 Shuhong Zhao
 Qin Li
 Yingying Kong
 Xi Chen
95% of researchers rate our articles as excellent or good
Learn more about the work of our research integrity team to safeguard the quality of each article we publish.
Find out more
ORIGINAL RESEARCH article
Front. Environ. Sci. , 23 February 2023
Sec. Environmental Economics and Management
Volume 11 - 2023 | https://doi.org/10.3389/fenvs.2023.1111828
This article is part of the Research Topic Environmental Risk and Corporate Behaviour View all 30 articles
Introduction: The development of tourism economy depends on air quality to a large extent, and good air quality is conducive to promoting the development of tourism economy. And it is crucial to understand the coupled and coordinated relationship between them. However, few studies have explored the coupling relationship between tourism and air quality. Therefore, it is necessary to further study the coupling relationship between tourism and air quality.
Methods: In this study, an index system was constructed to evaluate the development status of tourism economy and air quality system, and the entropy value method was used to weight the indexes. Using panel data of Chinese provinces from 2014 to 2020, a coupled coordination model was established, focusing on the degree of coordination between tourism economy and air quality.
Results: The empirical results show that during the sample period, China’s tourism economic index is decreasing, and the regional development is unbalanced, showing the gradient of eastern region > central region > western region. The air quality index, on the other hand, fluctuates and increases, showing a spatial distribution pattern of “weekly high, high and low” of western region > eastern region > central region. The coupling coordination level of both regions shows an increasing trend, with the eastern region having the highest coupling coordination level and always in the stage of barely balanced development; the central region has the second highest coupling coordination level and the coupling coordination level is steadily increasing; the western region has the worst coupling coordination level and the coupling system tends to decline. The main type of coupling coordination effect is tourism economy lagged type, and the overall performance shows that the ambient air quality condition is better than the tourism economy development.
Discussion: This study clearly reveals the evolution, degree and types of coupling coordination in the tourism economy and air quality of the two systems, which contributes to the understanding of coupling and synergy of industrial development and ecological environment. This research also expands the application field of the CCDM model, and has a certain methodology contribution for further exploring the synergy and symbiosis mechanism of tourism economy development and environmental change.
In many developing countries, tourism plays an important role in socio-economic development (Dogru and Bulut, 2018). Since the reform and opening-up in China, the tourism economy has grown at a high speed. In 2019, China achieved a total tourism income of 6.63 trillion yuan, and its comprehensive contribution rate to the national economy has reached 11.05% (China Tourism Research Institute), ranking the fastest developing country in the world in domestic tourism. The improvement of tourism economic development has undoubtedly promoted the rapid accumulation of material wealth and the promotion of people’s livelihood and wellbeing in China in a short period of time. However, the development of tourism is often a double-edged sword. Large-scale tourist activities and the operation of tourism assistance and supporting facilities have brought serious ecological and environmental problems, among which the air pollution with the strongest public perception has aroused people’s great concern (Zhang F. et al., 2022). Air pollution not only seriously endangers public health and life (Holgate, 2017; Martinez et al., 2018), but also has a negative effect on tourism travel, becoming an important factor hindering the high-quality development of tourism (Chen, 2017). Therefore, it is necessary to realize the coordination between the two subsystems of tourism economy and air quality, promote the rapid development of tourism in a sustainable way, and maintain good air quality at the same time.
In recent years, more and more scholars began to pay attention to the relationship between tourism and air quality. Most studies take carbon dioxide emissions as the representative variable of air quality to examine the impact of tourism on air quality. Most scholars come to the same conclusion that tourism will worsen air quality (Becken and Patterson, 2006; Lee and Brahmasrene, 2013; Tiwari et al., 2013; Katircioglu et al., 2014; Ozturk, 2015; Zhang and Gao, 2016; Ahmad et al., 2018; Wang and Wang, 2018). A large amount of greenhouse gases are emitted by tourism through transportation, accommodation and other tourism activities, resulting in serious air pollution problems. Some scholars also believe that the relationship between tourism and carbon dioxide may vary depending on the level of national economic development and the strategies adopted for tourism development (Paramati et al., 2017). However, compared with other pollutants, CO2 has negligible impact on air quality and human health, and is not a key pollutant (Robaina et al., 2020). Therefore, some scholars began to use PM10, PM2.5, O3 and other variables to discuss the impact of tourism on air quality (Keiser et al., 2018; Liu et al., 2019a; Eusébio et al., 2020; Zeng et al., 2021). For example, Saenz-de-Miera and Rosselló (2014) shows that when the number of tourists increases by 1%, the PM10 concentration level will increase by 0.45%.
While tourism brings air pollution, it will also be affected by air pollution. Good air quality is considered as one of the main attractions of tourist destinations (Goh, 2012; Becken and Wilson, 2013), which is crucial to the competitiveness of tourist destinations (Gao and Kerstetter, 2016). But when the air is polluted, it will hinder the development of tourism (Zhu, 2022). In some developed countries, the impact of air pollution index (CO2 emissions) on international tourism is significantly negative (Nademi and Najibi, 2011). The Fukushima nuclear accident in Japan in 2011 greatly affected the inbound tourism of the whole country. Zhang X. et al. (2022) showed that air pollution intensifies by 1%, the number of inbound tourists decreases by 1.171%. Outbound tourism will increase with the deterioration of air quality in origin (Wang et al., 2018). Dai et al. (2017) shows that seeking fresh air has become an important factor to promote China’s outbound tourism. Xu et al. (2019) further explore which pollutants (PM2.5, PM10, SO2 and NO2) have the greatest negative impact on tourism activities in China.
With the rapid development of tourism industry in the world, the relationship between tourism industry and the environment has become increasingly prominent. The concept of coupling originates from physics, and refers to the dynamic relationship between two or more complex systems through the interaction of subsystems or elements (Tang, 2015). As one of the methods to measure the interaction effect, it is widely used in environmental research. Previous studies have done empirical research on the coupling and coordination relationship between tourism and environment in Beijing (Li and Weng, 2016), Qinghai (Xue, 2018), Shanxi (Liu et al., 2019b), Nagasaki (Liu and Suk, 2021) and other places. These studies reveal the interaction between tourism subsystem and environment subsystem, and show that the coordinated development of the two subsystems is crucial to the sustainable development of regional tourism. As an1 important part of environmental quality, air quality has a complex interaction with tourism. However, few studies have explored the coupling relationship between tourism and air quality. Therefore, it is necessary to further study the coupling relationship between tourism and air quality.
In view of this, this study is based on the panel data of 31 provinces in China from 2014 to 2020. Firstly, it attempts to construct a coupling and coordination analysis framework of tourism economy and air quality. Secondly, the entropy method is used to obtain the index weight objectively. Finally, the coupling coordination degree model (CCDM) is used to comprehensively measure the coupling coordination degree between tourism economy and air quality. The purpose of this study is: 1) to reveal the dynamic trend of the coupled development of tourism economy and air quality; 2) Provide reference for the coordinated development of tourism economy and air quality in the process of macro-policy making. In addition, the coupling coordination degree between tourism economy and air quality proposed in this paper is an important reference for evaluating the environmental impact of tourism economic development. It provides an expanded perspective and a specific quantitative analysis tool for exploring in depth the ecological and environmental effects of tourism economic development. This method can be extended to explore the relationship between tourism economy and air quality in other regions at different levels. Theoretically, the analysis and the method also contribute to extending the understanding of coupling and synergy of industrial development and ecological environment.
The remainder of the article is structured as follows. Section 2 presents the materials and methods. Section 3 reports and discusses the empirical results. Finally, Section 4 is devoted to conclusions and recommendations, along with some limitations of the study and future research directions.
There is a complex interaction between tourism and air quality. Scholars generally believe that on the one hand, the capital accumulation effect formed by the development of tourism economy can provide financial support for the improvement of air quality, on the other hand, the operation of tourism departments will consume a lot of energy and emit waste gas, causing serious environmental air pollution. High-quality ambient air quality provides strong support for tourism services. While attracting tourists, it can also increase the tourist experience of tourists and bring good economic benefits to tourism development. However, serious air pollution will have negative effects on tourism and hinder the development of tourism economy (Robaina et al., 2020; Zhang F. et al., 2022). Objectively, there are various contradictions and interactions between tourism economy and air quality. Therefore, the system composed of tourism economy subsystem and air quality subsystem is defined as a coupling system, and its coupling and coordination relationship plays an important role in the sustainable development of tourism and pollution control. According to the conceptual framework and connotation of the coupling system, this paper constructs a comprehensive evaluation index system to measure the interaction between tourism economy and air quality. Refer to previous studies (Tang, 2015; Zheng et al., 2016; Liao K. C. et al., 2018; Wang et al., 2019; Geng et al., 2020; Geng et al., 2021), A comprehensive index system composed of two subsystems, three dimensions and 18 indicators was finally established (Table 1) based on the correlation analysis and significance test.
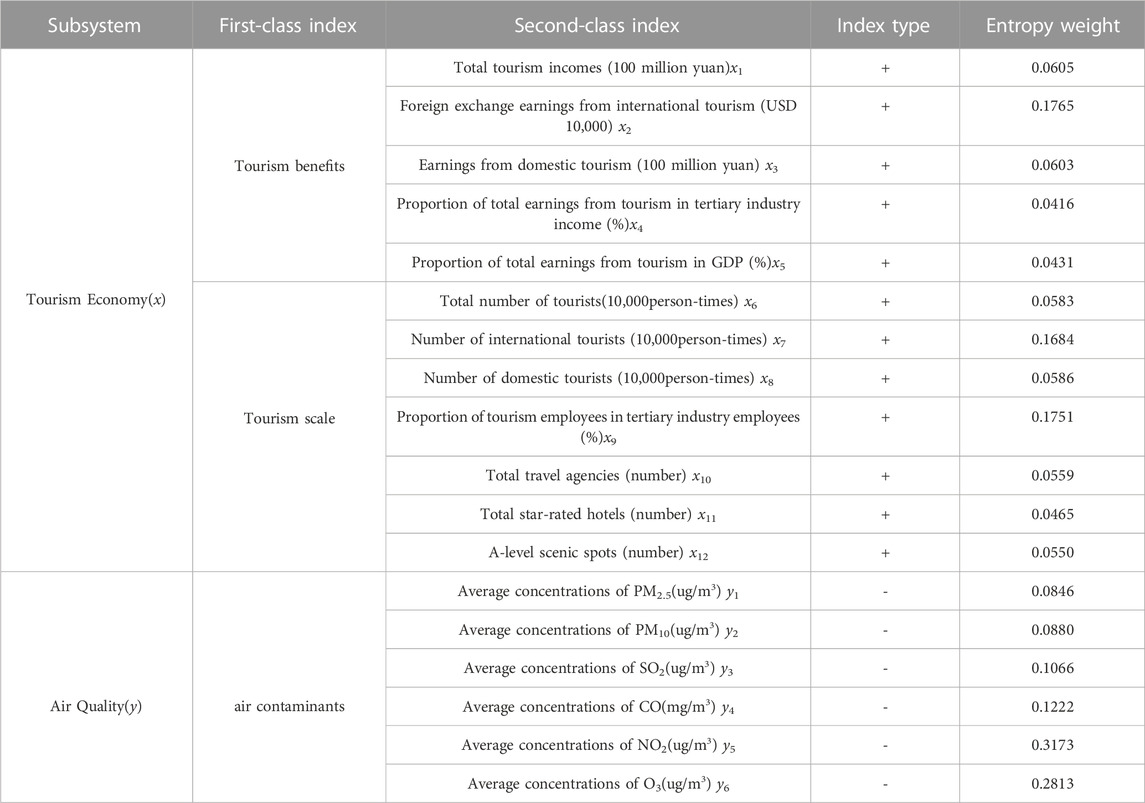
TABLE 1. Index system used for evaluation of the relationship between tourism economy and air quality and the index weights.
In the tourism economic subsystem, the dimension of tourism benefits represents the status of tourism, including total tourism incomes, foreign exchange earnings from international tourism, earnings from domestic tourism, proportion of total earnings from tourism in tertiary industry income, and proportion of total earnings from tourism in GDP. The three indicators of total tourism income, foreign exchange earnings from international tourism and earnings from domestic tourism indicate the direct economic income obtained by tourism. The proportion of total earnings from tourism in tertiary industry income, and the proportion of total earnings from tourism in GDP reflect the status of tourism in the tertiary industry and the national economy. The dimension of tourism scale shows that the overall scale of tourism, including the total number of tourists, number of international tourists, number of domestic tourists, the Proportion of tourism employees in tertiary industry employees, total travel agencies, total star-rated hotels and A-level scenic spots. The three indicators of the total number of tourists, number of international tourists, number of domestic tourists indicate the scale of the tourism market. The Proportion of tourism employees in tertiary industry employees indicates the scale of tourism employment. The number of travel agencies, the number of star-rated hotels and the number of A-level scenic spots indicate the scale of tourism enterprises.
In the air quality subsystem, at present, the air quality index (AQI) formulated by the Ministry of Ecology and Environment is mainly used in China to describe the air quality, and its evaluation index system includes six air pollutant indexes: SO2, NO2, PM10, CO, O3 and PM2.5 This index system is also used in this study. Due to the strong diffusion of air pollution, this study measured the air quality of provincial capital cities based on the annual average data of pollution indicators, and represented the overall air quality of the province.
Limited by the lack of data in Hongkong, Macau and Taiwan Province all the year round, it is not included in the scope of this study. Finally, 31 provincial units in China are selected as research samples. The air quality data is collected on the China Air Quality Online Monitoring and Analysis Platform (https://www.aqistudy.cn/historydata/). Tourism economic data comes from the Statistical Yearbook of China and the Statistical Yearbook of China Tourism in the corresponding years, and statistical bulletins of national economic and social development of various provinces. As for the research period, since the Air Quality Standard (GB3095-2012) has been gradually implemented since 2013, it is limited to the availability and authority of data, so 2014–2020 is chosen as the research period.
In order to eliminate the influence of dimensions, it is necessary to standardize the original data by using formulas (1) and (2). For a positive index (Liao K. C. et al., 2018), namely:
For negative exponents, namely:
Where,
In this study, the entropy weight method is used to determine the index weight (Wang et al., 2019). As an objective assignment method, the entropy weight method can avoid the subjectivity in the calculation process and is widely used in empirical research. The calculation steps are as follows:
Calculate the proportion of indicators:
Calculate the index information entropy:
Calculate index entropy redundancy:
Calculate index weight:
Based on the entropy method to determine the index weight, the comprehensive evaluation model is used to obtain the comprehensive development level of the two subsystems of tourism economy and ambient air quality (Zheng et al., 2016). Assuming that x1, x2, … , xm represents the index of tourism economy subsystem, and y1, y2, … , yn represents the index of air quality subsystem, then:
Where f(x) represents the comprehensive index of tourism economy; g(y) represents the comprehensive index of air quality; xi' and yi' are the values of tourism economy and air quality after standardized treatment respectively; ai and bi respectively represent the weight of each index in tourism economy and air quality subsystems.
As an effective tool to identify the multi-coupling relationship between different systems, the coupling coordination model is widely used in the fields of economy, ecology, transportation and tourism (Tang, 2015). In this paper, a coupling coordination model of tourism economy and air quality (CCDM) is constructed. The calculation steps of this model are as follows:
Where f(x) and g(y) respectively represent the comprehensive index of tourism economy and air quality; C is the coupling degree, which measures the degree of interaction between subsystems; D is the coupling coordination degree, which measures the coordination degree of each subsystem in the development and evolution; T is the comprehensive coordination index; α and β are the undetermined weights of each subsystem. As tourism economy and air quality are equally important to regional development, they are both set to 0.5 by referring to the general treatment methods of previous studies (Tang, 2015). Referring to the research results of Li et al. (2012), the coupling and coordinated development types of tourism economy and air quality are divided into four classes and 12 subclasses, as shown in Table 2.
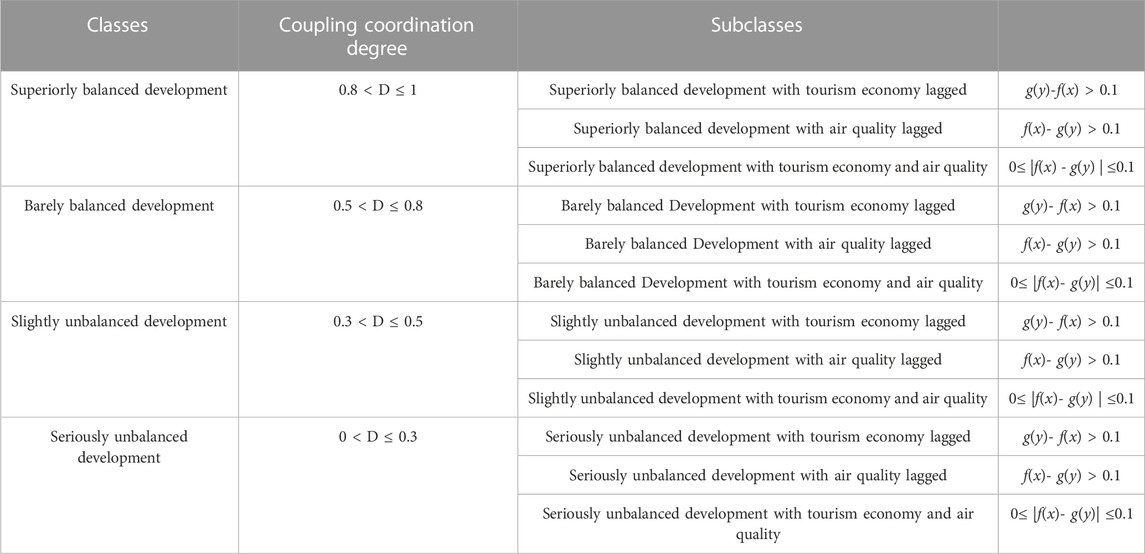
TABLE 2. Discriminating standard of coordinated coupling of tourism economy and air quality.
Entropy method and comprehensive evaluation model were used to calculate the comprehensive development index of tourism economy and air quality of 31 provinces, autonomous regions and municipalities in China from 2014 to 2020, and ArcGIS 10.2 software was used to make spatial visualization of the measurement results of tourism economy and air quality from 2014 to 2020. In order to compare the differences among regions, 31 provinces, cities and autonomous regions are divided into three regions. They are the eastern region (Beijing, Tianjin, Hebei, Liaoning, Shanghai, Jiangsu, Zhejiang, Fujian, Shandong, Guangdong, Guangxi and Hainan), the central region (Shanxi, Jilin, Heilongjiang, Anhui, Jiangxi, Henan, Hubei and Hunan) and the western region (Mongolia, Chongqing, Sichuan, Guizhou, Yunnan, Xizang, Shaanxi, Gansu, Qinghai, Ningxia and Xinjiang).
As can be seen from Figure 1, during the study period, the tourism economic index of China showed a fluctuating downward trend, with its value dropping from 0.155 in 2014 to 0.145 in 2020, indicating that the overall level of tourism economic development has declined. At the same time, the development and evolution of tourism economy has obvious characteristics in stages, which can be divided into two stages according to its changing trend. 2014–2019 is a rapid rising period, with an average annual growth rate of 9.944%. During this period, China has promoted the overall level of tourism economy by continuously integrating regional tourism resources, improving regional supporting facilities, optimizing tourism policies and innovating tourism product formats. However, in 2020, novel coronavirus epidemic broke out and spread to all parts of the country, which caused a serious impact on the tourism economy. The rapidly advancing tourism industry was forced to press the pause button, and the tourism economic index plummeted from 0.249 in 2019 to 0.145 in 2020. From the perspective of the three regions, the annual average of the comprehensive index of tourism economy in the eastern region (0.244) is higher than that in the central region (0.172) and the western region (0.149), showing a gradient decreasing feature. The result is consistent with the actual situation of tourism development in China. From the perspective of provinces, it can be seen from Figure 2A that the highest tourism economic index in 2014 was Guangdong (0.485), followed by Zhejiang, Shandong, Jiangsu, Xinjiang, Beijing, Liaoning and Shanghai. The high-level tourism economic index mainly distributed in the eastern coastal areas, and to some extent showed a spatial distribution pattern of decreasing from the eastern coastal areas to the northwest inland areas. Ningxia (0.016) has a low tourism economic index, followed by Tibet, Qinghai, Gansu and Heilongjiang. As can be seen from Figure 2B, in 2020, the tourism economic index of all provinces (cities, autonomous regions) will be below 0.4, and the tourism economic index of Guangdong will obviously drop, and Tianjin, Beijing, Liaoning, Zhejiang, Shanghai and other places will also drop. The high-value areas are still mainly concentrated in the eastern region, with the highest value being Guangdong (0.325), followed by Guangdong, Zhejiang, Shandong, Jiangsu, Guangxi, Hunan, Sichuan, Yunnan, Xinjiang, Jiangxi, Guizhou, Fujian and Henan. The tourism economic index of Ningxia (0.019) is still low, but the tourism economic index of Southwest China has generally improved, with Guizhou and Yunnan increasing the most. On the whole, from 2014 to 2020, the national tourism economic index dropped significantly, the regional differences among provinces gradually narrowed, and the spatial distribution gradually tended to be balanced.
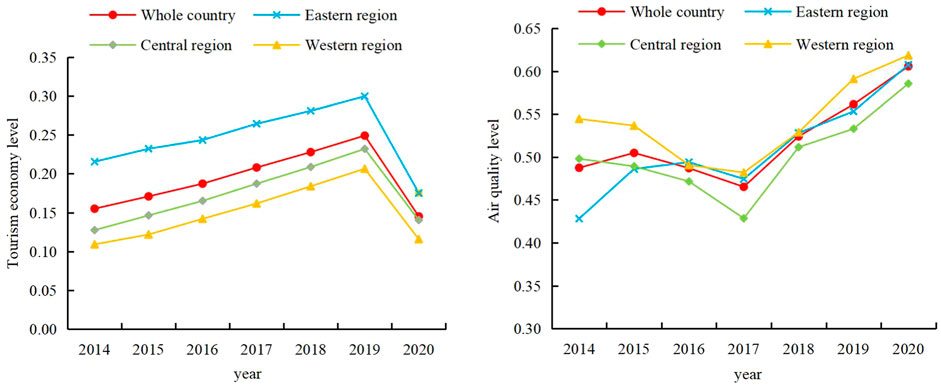
FIGURE 1. Trends of the comprehensive levels in subsystems.
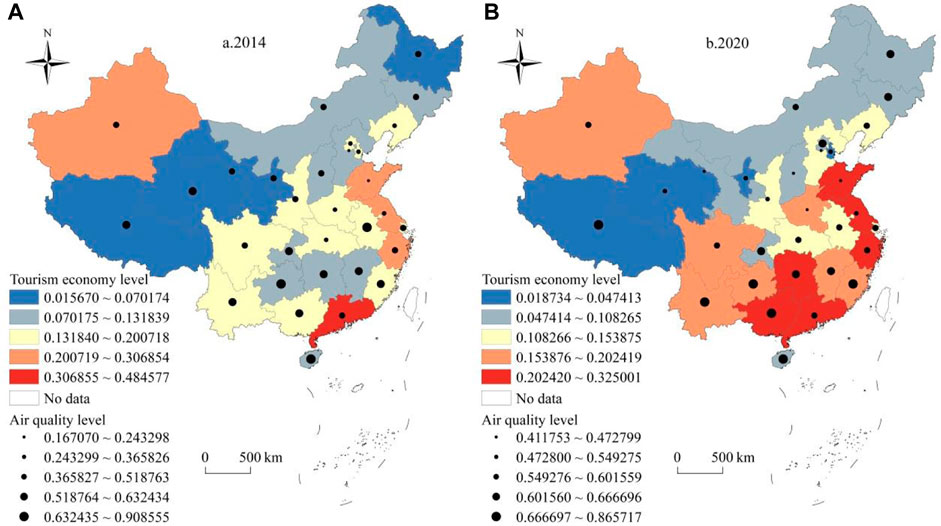
FIGURE 2. Spatial pattern of tourism economy and air quality in China from 2014 to 2020. Based on the standard map No. GS (2019)1822 of the standard map service website of the Ministry of Natural Resources, the base map boundary is not modified; data excluding Hong Kong, Macao and Taiwan.
As can be seen from Figure 1, on the whole, the average air quality index of China during the sample period is 0.519, which is at a medium level, indicating that there is still much room for improvement of air quality. Its development trend has turned into a fluctuating upward trend, with the air quality index rising from 0.487 in 2014 to 0.606 in 2020, with an average annual growth rate of 3.685%. According to the three regions, the air quality index in the western region is the highest (0.542) > that in the eastern region (0.510) > that in the central region (0.502), showing a spatial distribution pattern of “weekly, high, low”. From the perspective of provinces, it can be seen from Figure 2A that the highest air quality index in 2014 was distributed in Hainan (0.909), followed by Anhui, Guizhou, Tibet, Yunnan, Jiangxi and Qinghai. Provinces (cities, autonomous prefectures) with medium air quality index (0.365827–0.518763) have the most, and Shandong (0.167) has the lowest air quality index, followed by Hebei, Tianjin, Beijing, Liaoning, Hubei, Jiangsu and Henan, showing a spatial pattern with Beijing-Tianjin-Hebei urban agglomeration as the low-value core and increasing all around. As can be seen from Figure 2B, the number of high-value areas of air quality index increased obviously in 2020, mainly distributed in southwest and south China, with the highest value in Hainan (0.866), followed by Guizhou, Guangxi, Tibet, Yunnan, Fujian, Chongqing, Hunan, Jilin, Jiangxi, Heilongjiang and Beijing. The lowest value is distributed in Shanxi (0.412), followed by Gansu, Shandong, Hebei, Henan, Tianjin, Qinghai, Shaanxi, Ningxia and Jiangsu. On the whole, the coefficient of variation of air quality index showed a downward trend from 2014 to 2020, indicating that the regional differences among provinces decreased and the spatial distribution became more and more balanced.
As can be seen from Figure 3, the coupling coordination degree of tourism economy and air quality in China is not high in the whole during the inspection period, with the value between 0.4 and 0.6, which is mainly in the stage of barely balanced development, and there is still a lot of room for optimization in the future. From the time series, the coupling coordination degree of tourism economy and air quality in China showed a fluctuating growth trend during the study period, and the overall coordination level was improved. The value of coupling development index increased from 0.499 in 2014 to 0.528 in 2020, and the peak value appeared in 2019 (0.592), which indicated that the coupling coordination effect of tourism economy and air quality was getting better. From the overall stage evolution, before 2014, the coupling coordination degree of the two subsystems was less than 0.5, which belonged to the stage of slightly unbalanced development. In 2015, the coupling coordination degree was greater than 0.5, which entered the stage of barely balanced development. This may be related to the policy document of “Several Opinions of the State Council on Promoting the Reform and Development of Tourism Industry” (Guo Fa [2014] No.31) promulgated by the state, which helped the tourism industry to flourish, thus promoting the coupling state of tourism economy and ecological environment.
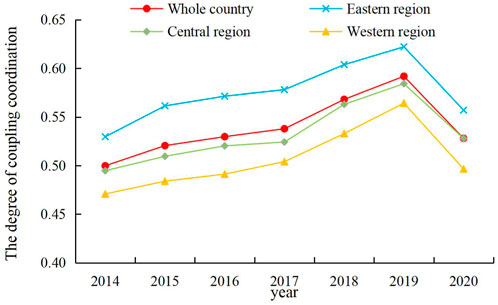
FIGURE 3. The degree of coupling coordination between tourism economy and air quality in China from 2014 to 2020.
From the perspective of regional coupling coordination degree, the coupling coordination degree between tourism economy and air quality in the three major regions of China, east, central and west, is generally fluctuating and rising, and the eastern region fluctuates from 0.530 to 0.557, which is always in the stage of barely balanced development. The fluctuation of the central region increased from 0.495 to 0.528, and it experienced the evolution process from slightly unbalanced development (2014–2015) to barely balanced development (2015–2020), which indicated that the tourism economy and air quality in the central region had passed the running-in period and entered the basic coordination stage in the acceptable range of coupling coordination. The fluctuation of the western region increased from 0.471 to 0.497, which experienced the evolution process of slightly unbalanced development (2014–2016)- barely balanced development (2016–2019)- slightly unbalanced development (2019–2020), and the system tended to decline. The main reason was that the tourism industry in the western region was weak, which was hit hardest by the COVID-19 epidemic, and the tourism economic system declined.
From the spatial distribution of the coupling coordination degree (Figure 4), the spatial agglomeration of the coupling coordination degree of tourism economy and air quality in China was obvious in 2014, and the spatial distribution pattern decreased from the eastern coastal areas to the northwest inland areas. The high-value areas of coupling coordination degree were basically located in the coastal areas, and Guangdong had the highest coupling coordination degree, with only four high-value distribution points in the inland areas: Anhui, Yunnan, Guizhou and Xinjiang. The low-value areas of coupling degree are mainly distributed in the western region, and there is a “trough” phenomenon in Ningxia, with the lowest value of coupling degree. By 2020, the high-value coupling coordination areas will continue to extend to the central and western regions, and the number of high-value coupling coordination areas will increase, with an obvious trend of contiguous development. Guangdong (0.659) has the highest coupling coordination degree, followed by Guangxi, Hunan, Zhejiang, Yunnan, Guizhou, Jiangsu, Fujian, Sichuan, Jiangxi, Shandong and Xinjiang. Ningxia (0.317) has the lowest coupling coordination degree, followed by Qinghai, Tianjin, Tibet, Gansu, Shanxi, Heilongjiang, Jilin and Inner Mongolia. On the whole, the coupling coordination degree of tourism economy and air quality in China is on the rise, but some areas have also dropped.
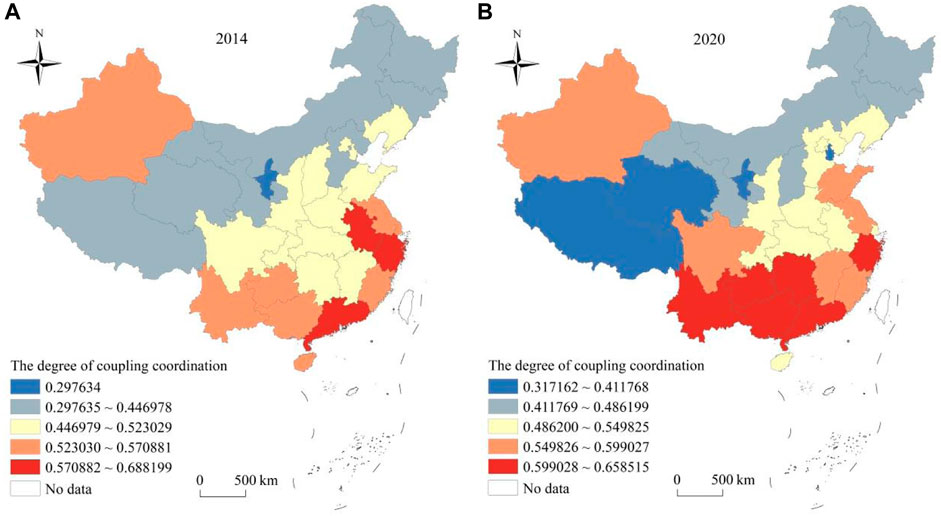
FIGURE 4. Spatial distribution of the coupling coordination between tourism economy and ambient air quality in China from 2014 to 2020.
From the spatial evolution of coupling coordination types (Figure 5), there are three types of coupling coordination types between tourism economy and air quality in China in 2014, among which the number of barely balanced development types is the largest, mainly concentrated in East China, South China and Southwest China, including 16 provinces such as Guangdong, Fujian, Shanghai, Jiangsu, Anhui and Jiangxi, accounting for 51.61% of the study sample. The provinces with slightly unbalanced development types are concentrated in Northeast China, North China and Northwest China, including 14 provinces such as Beijing, Tianjin, Hebei, Shandong and Inner Mongolia, accounting for 45.16% of the study samples. The province and city with Seriously unbalanced development is Ningxia, accounting for only 3.23% of the study sample. By 2020, the barely balanced development areas will go further north, with Beijing, Hebei, Liaoning, Henan and Hubei becoming the barely balanced development types, while the coupling coordination types of other provinces will remain unchanged. So far, the number of provinces with barely balanced development types is 22, accounting for 70.97% of the research samples. China’s tourism economy and air quality have basically achieved relatively coordinated development, which shows that under the encouragement of national policies, the intensive and low-carbon development of tourism industry has been promoted, thus enhancing the air quality. Meanwhile, the improvement of air quality has provided material guarantee for the development of tourism, making the “tourism economy-air quality” composite system continuously evolve towards the direction of coordination and optimization. However, there is still much room for improvement, and the whole needs to evolve to the stage of superiorly balanced development.
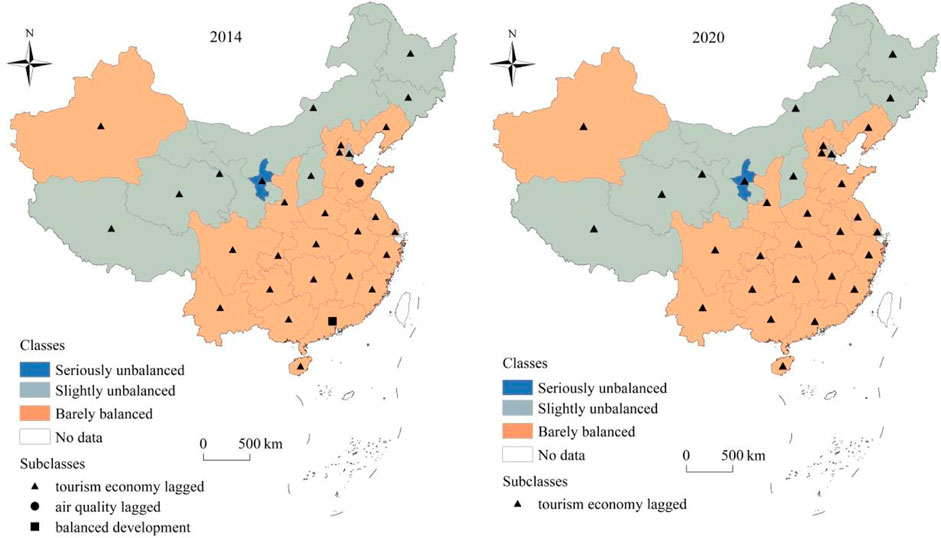
FIGURE 5. Spatial distribution of the types of coupled coordination between tourism economy and ambient air quality in China from 2014 to 2020.
Judging from the synchronization of the relative development of the system (Figure 5), the main type of coordination effect between tourism economy and air quality in China is tourism economy lagged. In 2014, except for Shandong’s air quality lagged and Guangdong’s system balanced development, all other provinces are tourism economy lagged. By 2020, all provinces show tourism economy lagged. It shows that at present, the improvement of the coupling coordination degree of the complex system of “tourism economy-air quality” in China mainly depends on strengthening the growth of tourism economy, and the driving effect of air quality improvement is slightly insufficient. Therefore, in the future, it is urgent to speed up the construction of tourism industry on the basis of protecting the existing air environment, and make up the shortcomings of tourism economy.
This study takes the panel data of 31 provincial units in China from 2014 to 2020 as the research sample, and uses entropy method and comprehensive evaluation model to measure the comprehensive level of tourism economy and air quality. The coupling coordination degree model is used to comprehensively measure the coupling coordination degree between tourism economy and air quality. The main conclusions are as follows:
(1) From the comprehensive development level of tourism economy and air quality, the tourism economic index shows a fluctuating downward trend, with its value dropping from 0.155 to 0.145. At the same time, the regional development is unbalanced, showing the gradient decreasing characteristics of the eastern region > the central region > the western region. The air quality index fluctuated from 0.487 in 2014 to 0.606 in 2020, showing a spatial distribution pattern of “weekly, high and low”, that is, western region > eastern region > central region.
(2) From the overall characteristics of the coupling coordination degree, the coupling coordination degree between China’s tourism economy and air quality showed a fluctuating growth trend during the study period, and the overall coordination level was improved. The eastern region has the highest level of coupling coordination, and it is always in the stage of barely balanced development; The level of coupling coordination in the central region is the second, and it has roughly experienced the evolution process of slightly unbalanced development - barely balanced development; The coupling coordination level in the western region is the worst, and it has experienced the evolution process of slightly unbalanced development - barely balanced development - slightly unbalanced development, and the system tends to decline. The main type of coordination effect is tourism economy lagged, which indicates that air quality is better than the development of tourism economy.
Based on the above research conclusions, the following policy recommendations are put forward: 1) Pay attention to the development of tourism industry and change the status quo of lagging tourism economy. From the perspective of the three regions, the eastern region should speed up industrial adjustment and technological innovation, promote the modernization of tourism, and transfer some superior resources to the central and western regions. The central region should fully tap its own resource potential, strengthen the integration of tourism resources, and stimulate the vitality of tourism development. The western region should strengthen the construction of tourism infrastructure and public service system, actively learn from the advanced technology and experience of the eastern region, and optimize the return on tourism investment. At the same time, we should promote the optimization and upgrading of the tourism industry itself, further realize the efficient utilization of tourism resources, energy conservation and emission reduction, and realize the active integration of tourism development into air environmental protection. 2) In the post-COVID-19 era, the government should increase investment in environmental governance and encourage the use of clean energy to promote the green development of tourism (Wan et al., 2021; Kang et al., 2022; Liu H. Y. et al., 2022; Liu P. H. et al., 2022; Tao et al., 2022; Tian et al., 2022).
The relationship between tourism economy and air quality has become the focus of current research. However, most of the previous studies did not reflect the interaction between tourism and air quality. The coupling coordination degree model (CCDM) provides an effective method for evaluating the interaction between tourism economy and air quality. Existing research has conducted empirical research on the coupling and coordination relationship between tourism and the environment, such as Beijing, Shaanxi and other cities (Li and Weng, 2016; Xue, 2018; Liu et al., 2019a). Air quality is an important part of environmental quality, and few studies have discussed the coupling relationship between tourism and air quality. According to the conceptual framework and connotation of coupling system, this paper constructs a comprehensive evaluation index system to help understand the interaction between tourism economy and air quality. In addition, the entropy method is an objective assignment method, which can avoid the defect of subjective weight determination. The combination of entropy method and coupling coordination model is an effective method, which is widely used in empirical research. Through comprehensive evaluation index system, entropy method and coupling coordination model, this paper reveals the dynamic trend of coupling development of tourism economy and air quality, which contributes to the understanding of coupling and synergy of industrial development and ecological environment. This research also expands the application field of the CCDM model, and has a certain methodology contribution for further exploring the synergy and symbiosis mechanism of tourism economy development and environmental change.
What needs to be explained is that the article has extensively absorbed the existing research results, tried to be scientific and reasonable, and tried to build an evaluation index system of tourism economy and air quality. However, both of them are complex systems involving various elements of human and land. At present, the academic circles have not formed a consistent and perfect research system, and some indicators still have room for improvement. In the future, a systematic and comprehensive index system should be further built. Due to the availability of data, this paper selects the provincial scale for research, and the air quality of provincial capital cities represents the overall air quality of the province. There may be some deviations in the calculated results, and the data of city and county scale can be further used for refined research in the future. In addition, due to the limitation of space, the article does not discuss the influencing factors of spatial correlation pattern of coupling coordination degree, and follow-up sustainable expansion research.
The raw data supporting the conclusions of this article will be made available by the authors, without undue reservation.
SZ performed the theory analysis andconceptualization and contributed to revising the manuscript. QL conducted the empirical analysis and drafting the paper. YK collected the data and improved the writing and conclusions. XC improved the manuscript and validation.
This paper was mainly supported by the National Social Science Foundation of China (No. 20BJY208). It also supported by Yunnan Provincial Department of Education Scientific Research Fund Project (No. 2023Y0290) and Program for Excellent Young Talents, Yunnan University.
The authors declare that the research was conducted in the absence of any commercial or financial relationships that could be construed as a potential conflict of interest.
All claims expressed in this article are solely those of the authors and do not necessarily represent those of their affiliated organizations, or those of the publisher, the editors and the reviewers. Any product that may be evaluated in this article, or claim that may be made by its manufacturer, is not guaranteed or endorsed by the publisher.
1China Tourism Research Institute. In 2019, China's total tourism revenue reached 6.63 trillion yuan, and the comprehensive contribution of tourism accounted for 11.05% of GDP [ EB-OL ]. http://shareapp.cyol.com/cmsfile/News/202003/11/347732.html.
Ahmad, F., Draz, M. U., Su, L., Ozturk, I., and Rauf, A. (2018). Tourism and environmental pollution: Evidence from the one belt one road provinces of western China. Sustainability 10 (10), 3520. doi:10.3390/su10103520
Becken, S., and Patterson, M. (2006). Measuring national carbon dioxide emissions from tourism as a key step towards achieving sustainable tourism. J. Sustain. Tour. 14 (4), 323–338. doi:10.2167/jost547.0
Becken, S., and Wilson, J. (2013). The impacts of weather on tourist travel. Tour. Geogr. 15 (4), 620–639. doi:10.1080/14616688.2012.762541
Chen, C. M. L. Y., Lin, Y. L., and Hsu, C. L. (2017). Does air pollution drive away tourists? A case study of the sun moon lake national scenic area, taiwan. Transp. Res. Part D Transp. Environ. 53, 398–402. doi:10.1016/j.trd.2017.04.028
Dai, B., Jiang, Y., Yang, L., and Ma, Y. (2017). China's outbound tourism–Stages, policies and choices. Tour. Manag. 58, 253–258. doi:10.1016/j.tourman.2016.03.009
Dogru, T., and Bulut, U. (2018). Is tourism an engine for economic recovery? Theory and empirical evidence. Tour. Manag. 67 (AUG), 425–434. doi:10.1016/j.tourman.2017.06.014
Eusébio, C., Carneiro, M. J., Madaleno, M., Robaina, M., Rodrigues, V., Russo, M., et al. (2020). The impact of air quality on tourism: A systematic literature review. J. Tour. Futur. 7 (1), 111–130. doi:10.1108/jtf-06-2019-0049
Gao, J., and Kerstetter, D. L. (2016). Using an intersectionality perspective to uncover older Chinese female's perceived travel constraints and negotiation strategies. Tour. Manag. 57, 128–138. doi:10.1016/j.tourman.2016.06.001
Geng, Y., Wang, R., Wei, Z., and Zhai, Q. (2021). Temporal-spatial measurement and prediction between air environment and inbound tourism: Case of China. J. Clean. Prod. 287 (5), 125486. doi:10.1016/j.jclepro.2020.125486
Geng, Y., Wei, Z., Zhang, H., and Maimaituerxun, M. (2020). Analysis and prediction of the coupling coordination relationship between tourism and air environment: Yangtze river economic zone in China as example. Discrete Dyn. Nat. Soc. 2020, 1–15. doi:10.1155/2020/1406978
Goh, C. (2012). Exploring impact of climate on tourism demand. Ann. Tour. Res. 39 (4), 1859–1883. doi:10.1016/j.annals.2012.05.027
Holgate, S. T., (2017). Every breath we take: The lifelong impact of air pollution' - a call for action. Clin. Med. J. R. Coll. Physicians Lond. 17 (1), 8–12. doi:10.7861/clinmedicine.17-1-8
Kang, J., Yu, C., Xue, R., Yang, D., and Shan, Y. (2022). Can regional integration narrow city-level energy efficiency gap in China? Energy Policy 163, 112820. doi:10.1016/j.enpol.2022.112820
Katircioglu, S. T., Feridun, M., and Kilinc, C. (2014). Estimating tourism-induced energy consumption and CO2 emissions: The case of Cyprus. Renew. Sustain. Energy Rev. 29, 634–640. doi:10.1016/j.rser.2013.09.004
Keiser, D., Lade, G., and Rudik, I. (2018). Air pollution and visitation at US national parks. Sci. Adv. 4 (7), t1613. doi:10.1126/sciadv.aat1613
Lee, J. W., and Brahmasrene, T. (2013). Investigating the influence of tourism on economic growth and carbon emissions: Evidence from panel analysis of the European Union. Tour. Manag. 38, 69–76. doi:10.1016/j.tourman.2013.02.016
Li, L. Y., and Weng, G. M. (2016). An integrated approach for spatial analysis of the coupling relationship between tourism footprint and environment in the Beijing-Tianjin-Hebei region of China. ASIA Pac. J. Tour. Res. 21 (11), 1198–1213. doi:10.1080/10941665.2015.1130161
Li, Y. F., Li, Y., Zhou, Y., Shi, Y. L., and Zhu, X. D. (2012). Investigation of a coupling model of coordination between urbanization and the environment. J. Environ. Manag. 98, 127–133. doi:10.1016/j.jenvman.2011.12.025
Liao, K. C., Yue, M. Y., Sun, S. W., Xue, H. B., Liu, W., Tsai, S. B., et al. (2018). An evaluation of coupling coordination between tourism and finance. SUSTAINABILITY 10 (7), 2320. doi:10.3390/su10072320
Liu, H. Y., Jiang, J., Xue, R., Meng, X. F., and Hu, S. Y. (2022). Corporate environmental governance scheme and investment efficiency over the course of COVID-19. FINANCE Res. Lett. 47, 102726. doi:10.1016/j.frl.2022.102726
Liu, J., Li, C., Tao, J., Ma, Y., and Wen, X. (2019a). Spatiotemporal coupling factors and mode of tourism industry, urbanization and ecological environment: A case study of Shaanxi, China. Sustainability 11 (18), 4923. doi:10.3390/su11184923
Liu, J., Pan, H., and Zheng, S. (2019b). Tourism development, environment and policies: Differences between domestic and international tourists. Sustainability 11 (5), 1390–1405. doi:10.3390/su11051390
Liu, P. H., Wang, Y., Xue, D. R., Linnenluecke, P. M., and Cai, D. (2022). Green commitment and stock price crash risk. Finance Res. Lett. 47, 102646. doi:10.1016/j.frl.2021.102646
Liu, Y., and Suk, S. (2021). Coupling and coordinating relationship between tourism economy and ecological environment—A case study of Nagasaki prefecture, Japan. Int. J. Environ. Res. Public Health 18 (23), 12818. doi:10.3390/ijerph182312818
Martinez, G. S., Spadaro, J. V., Chapizanis, D., Kendrovski, V., Kochubovski, M., and Mudu, P. (2018). Health impacts and economic costs of air pollution in the metropolitan area of Skopje. Int. J. Environ. Res. public health 15 (4), 626. doi:10.3390/ijerph15040626
Nademi, Y., and Najibi, S. M. R. (2011). CO2 emissions and international tourism in some developed countries. Adv. Environ. Biol. 5 (9), 2620–2622.
Ozturk, I. (2015). The relationships among tourism development, energy demand, and growth factors in developed and developing countries. Int. J. Sustain. Dev. World Ecol. 23, 122–131. doi:10.1080/13504509.2015.1092000
Paramati, S. R., Shahbaz, M., and Alam, M. S. (2017). Does tourism degrade environmental quality? A comparative study of eastern and western European union. Transp. Res. Part D Transp. Environ. 50 (JAN.), 1–13. doi:10.1016/j.trd.2016.10.034
Robaina, M., Madaleno, M., Silva, S., Eusébio, C., Carneiro, M. J., Gama, C., et al. (2020). The relationship between tourism and air quality in five European countries. Econ. Analysis Policy 67, 261–272. doi:10.1016/j.eap.2020.07.012
Saenz-de-Miera, O., and Rosselló, J. (2014). Modeling tourism impacts on air pollution: The case study of PM10 in Mallorca. Tour. Manag. 40, 273–281. doi:10.1016/j.tourman.2013.06.012
Tang, Z. (2015). An integrated approach to evaluating the coupling coordination between tourism and the environment. Tour. Manag. 46, 11–19. doi:10.1016/j.tourman.2014.06.001
Tao, H., Zhuang, S., Xue, R., Cao, W., Tian, J. F., and Shan, Y. L. (2022). Environmental finance: An interdisciplinary review. Technol. Forecast. Soc. CHANGE 179, 121639. doi:10.1016/j.techfore.2022.121639
Tian, J., Yu, L., Xue, R., Zhuang, S., and Shan, Y. (2022). Global low-carbon energy transition in the post-COVID-19 era. Appl. Energy 307, 118205. doi:10.1016/j.apenergy.2021.118205
Tiwari, A. K., Ozturk, I., and Aruna, M. (2013). Tourism, energy consumption and climate change in OECD countries. Int. J. Energy Econ. Policy 3 (3), 247–261.
Wan, D. X., Xue, R., Linnenluecke, M., Tian, J. F., and Shan, Y. L. (2021). The impact of investor attention during COVID-19 on investment in clean energy versus fossil fuel firms. FINANCE Res. Lett. 43, 101955. doi:10.1016/j.frl.2021.101955
Wang, L., Fang, B., and Law, R. (2018). Effect of air quality in the place of origin on outbound tourism demand: Disposable income as a moderator. Tour. Manag. 68 (OCT), 152–161. doi:10.1016/j.tourman.2018.03.007
Wang, M., and Wang, C. (2018). Tourism, the environment, and energy policies. Tour. Econ. 24 (7), 821–838. doi:10.1177/1354816618781458
Wang, Q., Mao, Z., Xian, L., and Liang, Z. (2019). A study on the coupling coordination between tourism and the low-carbon city. Asia Pac. J. Tour. Res. 24 (6), 550–562. doi:10.1080/10941665.2019.1610002
Xu, X., Dong, D., Wang, Y., and Wang, S. (2019). The impacts of different air pollutants on domestic and inbound tourism in China. Int. J. Environ. Res. public health 16 (24), 5127. doi:10.3390/ijerph16245127
Xue, H. (2018). Research on synchronous coordination development of tourism-economy-environment system in Qinghai section of silk road. IOP Conf. Ser. Earth Environ. Sci. 108, 042080. doi:10.1088/1755-1315/108/4/042080
Zeng, J., Wen, Y., Bi, C., and Feiock, R. (2021). Effect of tourism development on urban air pollution in China: The moderating role of tourism infrastructure. J. Clean. Prod. 280, 124397. doi:10.1016/j.jclepro.2020.124397
Zhang, X., Ma, C., Li, X., Xiong, L., and Nie, S. (2022). Assessing the impact of air pollution on inbound tourism along the yangtze river across space and time. Int. J. Environ. Res. Public Health 19 (17), 10944. doi:10.3390/ijerph191710944
Zhang, F., Peng, H., Sun, X., and Song, T. (2022). Influence of tourism economy on air quality—an empirical analysis based on panel data of 102 cities in China. Int. J. Environ. Res. Public Health 19 (7), 4393. doi:10.3390/ijerph19074393
Zhang, L., and Gao, J. (2016). Exploring the effects of international tourism on China’s economic growth, energy consumption and environmental pollution: Evidence from a regional panel analysis. Renew. Sust. Energ. Rev. 53, 225–234. doi:10.1016/j.rser.2015.08.040
ZhengKuang, Q. Y., and Huang, N. (2016). Coordinated development between urban tourism economy and transport in the pearl river delta, China. Sustainability 8 (12), 1338. doi:10.3390/su8121338
Keywords: tourism economy, air quality, entropy method, coupling coordination degree model, index system
Citation: Zhao S, Li Q, Kong Y and Chen X (2023) The coupling relationship between tourism economy and air quality in China: A province-level analysis. Front. Environ. Sci. 11:1111828. doi: 10.3389/fenvs.2023.1111828
Received: 30 November 2022; Accepted: 10 February 2023;
Published: 23 February 2023.
Edited by:
Rui Xue, Macquarie University, AustraliaReviewed by:
Liudan Jiao, Chongqing Jiaotong University, ChinaCopyright © 2023 Zhao, Li, Kong and Chen. This is an open-access article distributed under the terms of the Creative Commons Attribution License (CC BY). The use, distribution or reproduction in other forums is permitted, provided the original author(s) and the copyright owner(s) are credited and that the original publication in this journal is cited, in accordance with accepted academic practice. No use, distribution or reproduction is permitted which does not comply with these terms.
*Correspondence: Shuhong Zhao, Mzk2MzQyNjA1QHFxLmNvbQ==; Qin Li, MTIwODU0MjE5MkBxcS5jb20=; Xi Chen, Y2hlbnhpMTIzMUB5bnUuZWR1LmNu
Disclaimer: All claims expressed in this article are solely those of the authors and do not necessarily represent those of their affiliated organizations, or those of the publisher, the editors and the reviewers. Any product that may be evaluated in this article or claim that may be made by its manufacturer is not guaranteed or endorsed by the publisher.
Research integrity at Frontiers
Learn more about the work of our research integrity team to safeguard the quality of each article we publish.