
95% of researchers rate our articles as excellent or good
Learn more about the work of our research integrity team to safeguard the quality of each article we publish.
Find out more
ORIGINAL RESEARCH article
Front. Environ. Sci. , 14 February 2023
Sec. Environmental Economics and Management
Volume 11 - 2023 | https://doi.org/10.3389/fenvs.2023.1109072
This article is part of the Research Topic Sustainability Challenges Around Energy Poverty in an Era of Global Environmental and Economic Crisis View all 5 articles
 Min Luo1
 Lingming Chen2*
As China’s economy has transitioned, the energy industry has developed rapidly. The government is promoting a revolution in energy production and consumption and building a green, low-carbon, safe and efficient energy system. The high-quality development of green energy has become an essential part of high-quality economic development. This paper constructs a high-quality green energy development indicator system from three aspects: green energy production, green energy output and pollution output. Then, the entropy weight method is used to measure the high-quality development level of inter-provincial green energy in China from 2010 to 2018. Moreover, the characteristics of regional differences and time evolution are deeply analyzed. Based on this, the impact of sports industry agglomeration on the high-quality development of green energy is verified. The results show that the aggregation of the sports industry can increase the level of high-quality development of green energy, and different regions have heterogeneous characteristics. Finally, based on the research conclusions, this paper puts forward some policy recommendations for promoting high-quality energy development in China.
The process of human society development is also a process of energy improvement and replacement. The dynamics of economic growth, production and lifestyle, and the direction of scientific and technological development are also undergoing profound changes. The development and utilization of energy have extensively promoted the development of the world economy and human society. China has become essential to the world’s energy production and consumption. China is playing an active role in maintaining world energy security and promoting the development of green energy. With the acceleration of modernization, more attention has been paid to a series of environmental and ecological issues, such as global warming. The development and utilization of energy are closely related to environmental issues. Extensive use of energy will bring a series of environmental problems. The basis of economic development is energy consumption. The production and business activities of the primary and tertiary industries consume a lot of energy. Energy is also indispensable to people’s life, food, clothing, housing and transportation. Only by improving energy utilization and developing green energy can we protect the environment based on ensuring healthy and rapid economic development. In the energy field, a series of factors, such as the world’s new energy revolution, the global energy transition, COVID-19 and the conflict between Russia and Ukraine, have profoundly affected the world energy market and international energy geopolitics. Therefore, governments in various countries are actively promoting energy transformation and building a green and low-carbon new economic model. At the same time, vigorously develop new energy and high-tech industries and help optimize and upgrade the energy structure with financial technology (Feng, 2022). After the reform and opening up, China has experienced a period of “focusing on development and neglecting environmental protection” (Li, 2021). However, after entering the 21st century, the concept of sustainable development has gradually deepened. The Chinese government has proposed a “five-sphere integrated” overall strategic layout in the report of the 18th National Congress. It refers to “economic construction, political construction, cultural construction, social construction and ecological civilization construction in an all-round way,” For the first time, China has included the construction of ecological civilization in its overall national layout. China is in a critical period of economic transformation, and the quality of green energy development is the core of this transformation. Energy supply-side reform, green technology innovation and energy structure adjustment and optimization can effectively promote the high-quality development of green energy.
Green energy, which means clean energy, refers to the energy that does not emit pollutants and can be directly used for production and life. It includes nuclear, natural gas and renewable energy. As unique ore energy, natural gas has the characteristics of low development cost and high energy utilization rate. In China’s economic transformation, the consumption of urban natural gas has been increasing. According to the data published in the China Energy Statistics Yearbook, we calculate and get Figure 1. Figure 1 shows the total supply of natural gas and the number of natural gas users in Chinese cities from 2001 to 2019. It can be seen that only 3,240 million people used natural gas in 2001. The number of people using natural gas has reached 39,025 million by 2019, an increase of 11 times. The supply of urban natural gas exceeded 1,60 billion cubic meters in 2019.
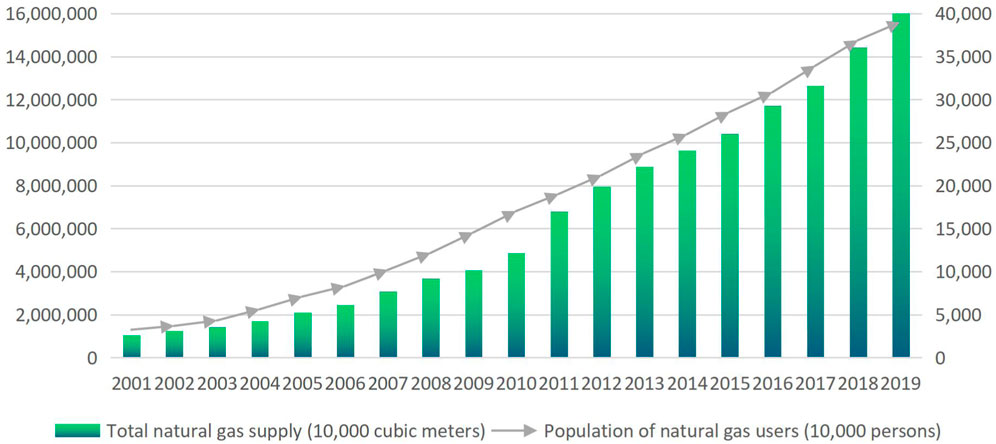
FIGURE 1. Total urban natural gas supply and number of natural gas users in China, 2001–2019. Data source: The data in the figure is calculated according to the China Energy Statistical Yearbook (2001–2019). The author uses the office software excel (one of the Office components in the Office software package developed by Microsoft in United States) to draw.
China’s energy structure is relatively particular, showing the characteristics of coal-dominated, diversified development constrained by the self-sufficiency rate. Coal still accounted for 58% of China’s primary energy in 2008, while oil and natural gas only accounted for 20% and 7%, respectively. From the global average level, the proportion of oil, natural gas and coal are relatively balanced, at 34%, 24%, and 27%, respectively. According to the data disclosed in BP World Energy Statistics Review: 2021, China is more dependent on coal, while the United States and the European Union are more dependent on oil and natural gas for fossil energy. Figure 2 shows China’s energy structure in 2020. China’s green energy is dominated by hydropower and natural gas. In 2020, China’s hydropower accounted for about 8%, and natural gas accounted for 10%. China’s share of nuclear energy was only 2%, significantly lower than that of the United States and the European Union (8% and 11%, respectively).
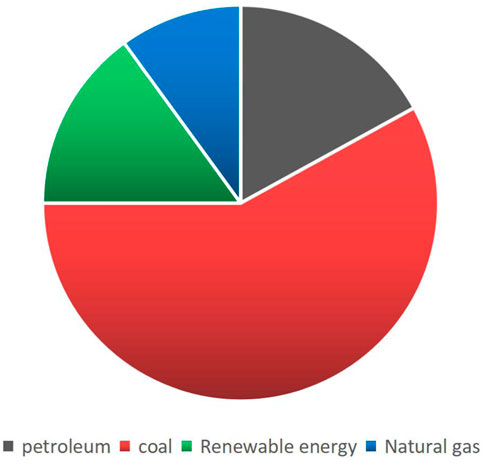
FIGURE 2. China’s energy structure in 2020. Data source: The data in the figure is calculated according to the China Energy Statistical Yearbook (2001–2019). The author uses the office software excel (one of the Office components in the Office software package developed by Microsoft in United States) to draw.
In China’s economic development, there is an evident phenomenon of industrial agglomeration. However, the industrial agglomeration of the primary and secondary industries has not effectively promoted the green development of energy. It is because a large amount of fossil energy is consumed in the process of agglomeration of the primary and secondary industries, and the development of green energy cannot meet the expansion of the production scale of the primary and secondary industries. The rapid economic growth is accompanied by the surge in energy consumption and the increasingly severe environmental problems caused by the industrial process. The Chinese government has raised the issue of economic transformation since the beginning of the Ninth Five-Year Plan. Specifically, economic transformation is the renewal of the economic system and the transformation of economic growth mode. It is also the upgrading of the economic structure and the replacement of pillar industries. It is also a process from quantitative to qualitative change in the national economic system and structure (Hong, 2013). After the Chinese government proposed economic transformation, the tertiary industry accelerated agglomeration (Ding, 2021). From the energy use perspective, factors such as technology spillover and industrial upgrading in the tertiary industry agglomeration process can improve the region’s energy efficiency. Under the adjustment of the market mechanism, the optimal allocation of resources can be achieved, and the high-quality development of green energy can be promoted. In order to demonstrate the relationship between the agglomeration degree of China’s provincial sports industry and the high-quality development of green energy, this paper first selects the sports industry in the third industry as the research object. Secondly, this paper establishes an indicator system to measure the high-quality development level of green energy, and analyzes the problems and improvement paths of green energy development in China. Finally, based on this, study the impact of sports industry agglomeration on the high-quality development of green energy.
This paper is organized as follows: Section 2 summarizes relevant literature on green energy development and industrial agglomeration. Section 3 constructs an indicator system for high-quality green energy development. And using 2010–2018 panel data in China to calculate with the entropy weight method. Section 4 sets a regression model, gives variable descriptions and data sources, and empirically analyzes the impact of sports industry aggregation on the high-quality development of green energy in China; Section 5 introduces the conclusions policy recommendations and future research prospects of this paper.
1 High-quality development of green energy
High-quality development of energy refers to the process of energy optimization that is conducive to social and economic development, such as the improvement of energy supply guarantee capacity, the optimization of production and consumption structure, the improvement of energy utilization efficiency, and the reduction of pollution caused by energy use. Among them, the production and use of green energy is particularly critical. Therefore, the development of green energy is the focus of current research in environmental economics. Scholars have conducted many theoretical and empirical in-depth studies on energy structure transformation (Tahvonen and Salo, 2001; Sadorsky, 2009; Marques and Fuinhas, 2012; Lin, 2017), green energy efficiency evaluation and influencing factors (Harrod and Denison, 1969; Henderson, 1974; Maddison, 1987; Cheng et al., 2017). Scholars have different evaluation angles and evaluation methods for developing green energy. (Ilbahar et al., 2019). summarizes the commonly used multi-attribute decision-making methods for the renewable energy system. It includes Analytic Hierarchy Process (AHP), Analytic Network Process (ANP) Technique for Order Preference by Similarity to an Ideal Solution (TOPSIS) and so on. (Qian et al., 2021). used the fuzzy analytic hierarchy process, anti-entropy weight method and multi-objective decision-making method of game theory to calculate the index weight of power energy. Other scholars use the input-output function to study the elasticity of substitution between green energy and non-green energy. It mainly discusses the impact of productivity changes on the energy structure (Van der Werf, 2008; Sancho, 2010; Zha and Zhou, 2014). (Jian and Tang, 2020) used the entropy weight method to measure the high-quality development level of green energy in China in 2017, and deeply analyzed the differences between regions. (Yan and Qifeng, 2022). used the projection pursuit evaluation model to measure the high-quality energy development level of each province in China from 2010 to 2017. They analyzed the time series evolution of the high-quality energy development level.
Actively developing clean energy can meet the increasing energy demand and reduce the large amount of carbon dioxide emissions caused by the use of fossil energy. Moreover, it can also optimize the industrial structure and achieve sustainable economic growth. Therefore, research on the impact of green energy development mainly focuses on two directions. First, green energy can suppress carbon emissions. This inhibitory effect is not unidirectional. The research of some scholars has found that the reduction of carbon emissions will also manifest the phenomenon of industrial structure adjustment and industrial agglomeration, thereby improving the development of green energy and reducing the use of re-burning fossil energy (Dogan and Seker, 2016; Zoundi, 2017). However, (Kahia et al., 2016), came to the opposite conclusion. He used panel data to empirically test that green energy does not play a significant role in carbon emission reduction. (Xu et al., 2019). believed that the relationship between the two is non-linear. In different development stages, the impact of clean energy development on carbon dioxide emissions in the three major regions of China is significantly different. Second, the role of green energy development on economic development. Some scholars believe that developing green energy can effectively promote economic growth in the long run (Bhattacharya et al., 2016; Inglesi-Lotz, 2016; Koçak and Şarkgüneşi, 2017). (Apergis and Payne, 2012) used the panel data from 80 countries as the research object and corrected the error of the model. Research shows that energy consumption has promoted economic growth. This paper use the same model to verify the relationship between green energy development and economic growth in different countries. The results show that there are great differences among different countries (Destek and Aslan, 2017). Some scholars have also verified the two-way causal relationship between green energy development and economic growth. Economic development will also drive the production and consumption of green energy (Pao et al., 2014; Kahia et al., 2017). (Wang, 2020) used China’s panel data from 2000 to 2018 to verify that the contribution rate of China’s green energy use to economic growth showed an inverted U-shaped trend that first increased and then decreased.
2 The impact of industrial agglomeration on the development of green energy
The energy structure has become a significant factor restricting the sustainable development of the economy. Green energy replaces non-clean energy in the general trend of energy development. The development of green energy has received more and more attention from academic circles. The discussion mainly focuses on the impact of factors such as structural adjustment (Farla and Blok, 2000; Freire-González et al., 2017), technological progress (Chen et al., 2013), economic development level (Managi and Ranjan Jena, 2008), openness (Chen et al., 2017), and environmental regulation intensity on green energy (Porter and Van der Linde, 1995). Industrial agglomeration refers to a process in which an industry is highly concentrated in a specific geographical area, and industrial capital elements are constantly converging in a spatial scope. Marshall began to pay attention to the economic phenomenon of industrial agglomeration in 1890. After Marshall, the theory of industrial agglomeration has developed greatly and formed a complete theoretical system. Among them, the research on economic growth is the most. Industrial agglomeration is closely related to the development of green energy. With the deepening of industrial agglomeration, some scholars have begun to study the impact of industrial agglomeration on the development of green energy, but no unified conclusion has been reached.
The first point of view is that industrial agglomeration increases the consumption of unclean mineral energy, deteriorates the energy structure, and reduces the speed of green energy development (Verhoef and Peter, 2002; Zhang and Wang, 2014). Since the fundamental reason for industrial agglomeration is externality (MARSHALL, 1920) research proves that the geographical agglomeration of the industry depends mainly on the external economy it produces. Including technology spillovers, skilled labour markets and specialized service intermediate industries. It will lead to over-exploitation of land and energy, resulting in increased pollution and squeezing the development space of green energy (Virkanen, 1998; Ren et al., 2003). (Andersson and Lööf, 2011) have proved that although industrial agglomeration can improve production efficiency, it can also lead to a decline in environmental quality and negatively impact green development.
The second point of view is: Industrial agglomeration can improve energy utilization efficiency, promote green energy to replace non-clean energy, and thus promote green energy development (Zeng and Zhao, 2009; Copeland and Scott Taylor, 2013). Technology spillovers brought about by industrial agglomeration will reduce the marginal cost of green technology innovation. (Cingano and Schivardi, 2004). found that industrial agglomeration positively impacts green development by analyzing enterprise-level micro-data. (Qu and Hu, 2019). believe industrial aggregation can bring economies of scale. It is easier for enterprises in aggregation to achieve green development through mutual resource assistance and knowledge sharing.
The third viewpoint: There is a non-linear relationship between industrial agglomeration and green and high-quality development. Different countries and different stages of industrialization have other influence relationships (He, 2006; Li, 2014). (Jiang et al., 2022) used the urban panel data of 268 prefecture-level cities in China from 2004 to 2017 to verify the regulatory mechanism and threshold effect of government development expenditure in the process of industrial agglomeration affecting energy efficiency from both theoretical and empirical perspectives.
3 Sports industry and high-quality development of energy
The sports industry is recognized as a green industry. Promoting the optimization of the sports industry structure is conducive to promoting the agglomeration. At the same time, it can better practice green development and promote the construction of ecological civilization (Jain, 2016). The research of (Ren and Huang, 2022) shows that the promotion of sports industry agglomeration on the high-quality development of energy under the “double carbon” goal is mainly reflected in three aspects. At the macro level, it is beneficial to integrate into the construction of ecological civilization actively. At the medium level, it is conducive to promoting the low-carbon transformation and development of the sports industry. At the micro level, it is conducive to promoting the low-carbon development of sports consumption. At the same time, the agglomeration of the sports construction and goods manufacturing industries is an essential part of the low-carbon transformation and development of the sports industry (Lu and Zhang, 2011).
To sum up, previous literature has formed a relatively complete system in terms of high-quality development of green energy, the impact of industrial agglomeration on green energy, sports industrial agglomeration and economic growth. Especially, the research on the coupling and coordinated development of sports industry agglomeration and regional economic growth is more comprehensive and in-depth. However, the impact of sports industry agglomeration on energy development is ignored. At the same time, the measurement of the development quality of green energy is not comprehensive and rigorous, and the heterogeneity of the impact of sports industry agglomeration on the development of green energy is not demonstrated. Based on the previous research results, this paper deeply discusses the impact of sports industry agglomeration on the high-quality development of green energy. The main marginal contributions are as follows: First, a high-quality development index system for green energy is constructed from three levels of green energy input, green energy output and pollution output. The entropy weight method is used to measure the high quality development level of China’s provincial energy, and the results are analyzed. Secondly, this paper empirically tested the relationship between sports industry agglomeration and the quality of green energy development in China by using provincial panel data from 2010 to 2018, and discussed its heterogeneity.
The Production function refers to the relationship between the quantity of various production factors used in production and the maximum output that can be produced within a certain time under the condition that the technical level remains unchanged. Since this paper studies the impact of sports industry agglomeration on the high-quality energy development, the manufacturer production function is constructed first, as shown in Eq. 1.
Where
Formula (3) can be obtained by calculating the partial derivative of energy investment in Formula (2).
Let Equation 3 be equal to zero, and the best investment in energy efficiency can be calculated as shown in Equation 4:
It can be seen from Formula (4) that whether the optimal energy investment efficiency is achieved depends on the production elasticity coefficient
Hypothesis 1. The improvement of sports industry agglomeration can promote the high-quality development of energy.The sports industry gathering enables the essential innovation achievements to be transformed and implemented in enterprises, industrial parks, science parks and other incubation bases, put into production and application, and obtain more profits to support more technological research and development and innovation. At the same time, the government in economically developed regions encourages enterprises to conductive research development and innovation of green energy. It can make large-scale investments in the sports industry, promoting enterprises to make breakthroughs in critical areas and core technologies. China’s economic development presents an unbalanced trend, so it is also necessary to integrate the sports industry chain in the east and the middle and west to form industrial clusters and promote the coordinated development of the regional green economy. However, this imbalance may lead to different effects of the scale of sports industry agglomeration in different regions on the high-quality energy development. Based on this, the second research hypothesis is proposed.
Hypothesis 2. The agglomeration degree of the sports industry in developed regions plays a more significant role in promoting a high-quality development level of energy than in the undeveloped areas.
There are few indicators to measure the high-quality development of green energy, and the previous literature has focused on one aspect. However, its measurement involves all aspects of energy production and use. This requires not only considering the production and consumption of green energy but also grasping the development trend of green energy. Therefore, this paper starts from the new development concept, based on the current characteristics of China’s economic development and green energy consumption, and constructs the measurement index system of high-quality green energy development from three levels of green energy production, green energy input and pollution output. Considering the connotation, status and availability of indicator data of the three secondary indicators, the indicator system is constructed as shown in Table 1.
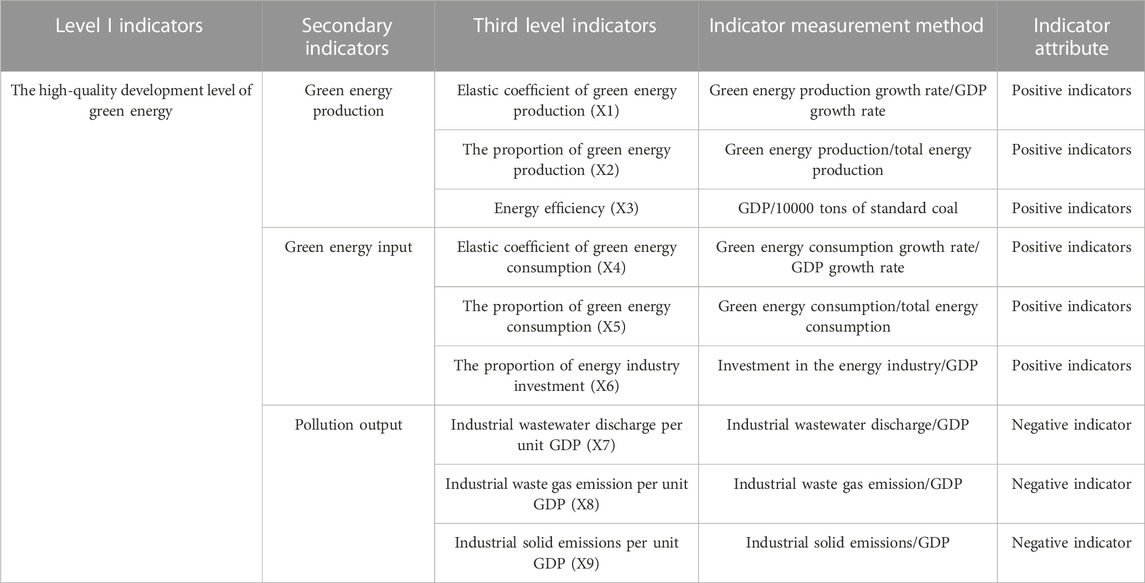
TABLE 1. Indicator system of high-quality development level of green energy.
The indicators of green energy production reflect the development speed and scale of green energy production, as well as the energy use efficiency under the current scientific and technological levels and economic levels. The indicators of green energy investment reflect the situation and characteristics of green energy consumption, and also reflect the local capacity and importance of energy investment. Pollution output indicators reflect the degree of pollution caused by non-green energy, which are negative indicators of high-quality development of green energy.
1 Measurement method
There is a difference between subjective empowerment and objective empowerment. The entropy weight method can determine the weight coefficient according to the different information content of the indicator and reduce human subjective interference. Therefore, this paper uses the entropy weight method to calculate the high-quality development level of green energy in different regions of China. The specific methods are as follows:
Before formal measurement, it is necessary to normalize the positive and negative indicators in the indicator system. This paper refers to the practice of Zhao et al. (2018) for the specific process. Formula (5) is used for positive indicators, and Formula (6) is used for negative indicators.
Wherein,
Define the information entropy of the indicator, then:
Calculate information entropy redundancy:
Wherein,
Based on the indicator
Wherein
(2) Data sources and processing
The data for measuring the level of high-quality green development in China’s sub-regions are from the China Statistical Yearbook (2010–2018) and the Statistical Yearbooks of each province (city). Among them, the growth rate of green energy production, green energy production, total energy production, 10,000 tons of standard coal, green energy consumption growth rate, green energy consumption, total energy consumption, and energy industry investment from the China Energy Statistical Yearbook (2010–2018). Specifically, green energy includes nuclear energy, natural gas and renewable energy. Renewable energy refers to the energy that can be regenerated from raw materials. Specifically, it includes hydropower, wind power, solar energy, bioenergy (biogas), geothermal energy (including ground source and water source) and ocean tide energy. The use of wind power, solar energy, bioenergy, geothermal energy and ocean tide energy is relatively limited. Using wind and solar energy requires high costs and a more suitable climate. The current scientific and technical development level limits the use of geothermal energy and ocean tidal energy, and the utilization rate is low. China’s large-scale use of green energy is hydropower and natural gas. Therefore, this paper uses the production and consumption of natural gas and hydropower to calculate the production and consumption of green energy.
The indicator system of high-quality development of green energy has been established, and the calculation method has been given. The core data is the production and consumption of green energy by region. However, incomplete statistics and untimely data releases are standard in some areas. The statistical calibre of Hong Kong, Macao and Taiwan is inconsistent with that of other regions, resulting in the rationality of the data. Therefore, this paper excludes the data from Tibet Autonomous Region, Hong Kong Special Administrative Region, Macao Special Administrative Region and Taiwan and obtains panel data from 30 provinces from 2010 to 2018.
1 time evolution characteristics
Based on the indicator system of high-quality green energy development, this section uses the data of China from 2010 to 2018 to calculate the level of high-quality green energy development in different regions by entropy weight method. The results are shown in Table 2.
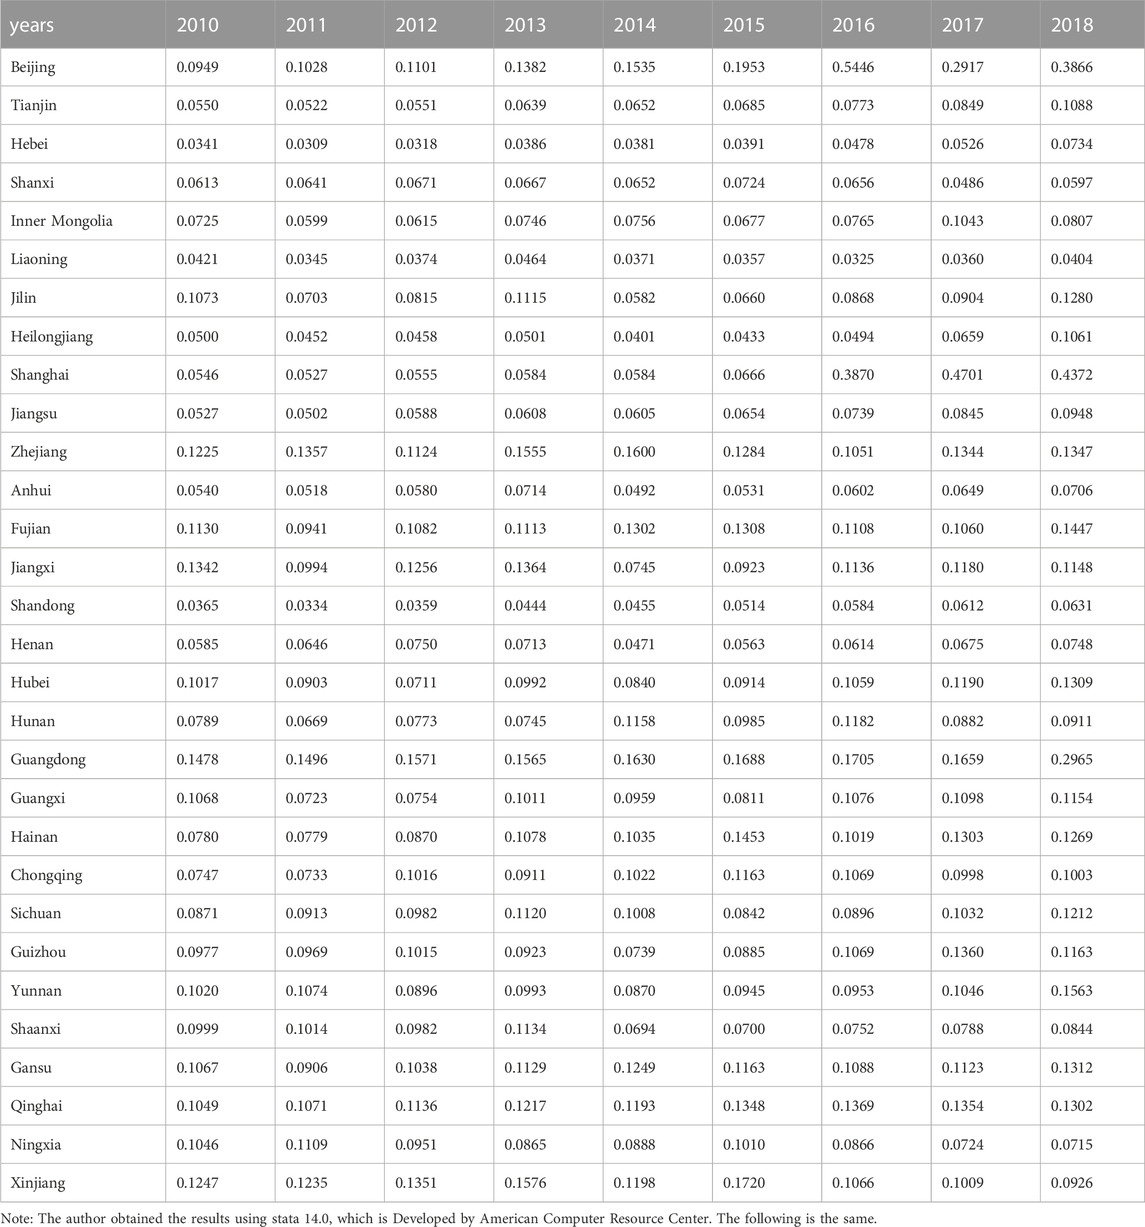
TABLE 2. Measurement results of High-Quality development level of green energy in different regions from 2010 to 2018.
From Table 2, the measurement results show that the overall development level of high-quality green energy in China is on the rise. The concentration of the sports industry in most provinces in 2018 is higher than in 2011. The five regions with the most significant growth were Shanghai, Beijing, Hebei, Heilongjiang and Guangdong, with growth rates of 700.73%, 307.38%, 115.25%, 112.20%, and 100.61%, respectively. China paid late attention to green energy. After 2010, economically developed provinces gradually began to increase green energy investment, adjust energy structure, and encourage green energy production and consumption. Therefore, the quality of green energy development in these regions is growing rapidly. The five regions with the low growth rate of high-quality green energy development are Liaoning, Jiangxi, Shaanxi, Xinjiang and Ningxia. Less developed regions rely more on coal, oil and other non-green energy to promote economic growth. However, green energy production needs to invest a lot of money and technology in the early stage, so the quality of green energy development in these regions has declined rather than increased.
Specifically, the high-quality development level of green energy in different regions of China from 2011 to 2018 shows two characteristics: first, the growth of the high-quality development level of green energy in China is slow, and there is still much room for development. From the national average, the national average of high-quality green energy development in 2010, 2013, 2016, and 2018 is 0.0261, 0.0281, 0.0519, and 0.0522, respectively. Until 2018, this value is less than 0.1. Because China’s green energy development started late, the energy structure is highly unreasonable, and the industrial structure needs to be optimized and upgraded. The high-quality development level of green energy in 2017 and 2018 has declined. As China constantly adjusts its industrial structure and vigorously promotes the development of green industries, the high-quality development level of green energy in China will gradually rise. Second, China’s high-quality development of green energy is characterized by regional imbalance and significant regional differences. Relatively developed cities remained at a high level. The high-quality development level of green energy in underdeveloped areas remains low, and there is an inevitable decline. Figure 4 shows the scores of the comprehensive level of high-quality green energy development in China by region in 2018.
From Figure 3, the five regions with the lowest green energy development quality in 2018 are Liaoning, Shanxi, Shandong, Anhui and Ningxia, with comprehensive scores of 0.0404, 0.0597, 0.0631, 0.0706, and 0.0715, respectively. The regions with the highest quality of green energy development in 2018 are Fujian, Yunnan, Guangdong, Beijing and Shanghai, with comprehensive scores of 0.1447, 0.1563, 0.2965, 0.3866, and 0.4372, respectively. There is a considerable gap between regions with high-quality green energy development and regions with low levels. Beijing, Shanghai, Guangdong and other regions pay more attention to improving green energy investment and consumption. However, Shanxi, Shandong and other regions have an insufficient investment in the green energy industry in economic development. At the same time, limited by the characteristics of the region’s resources, energy structure, economic development level and energy utilization rate, the high-quality development level of green energy is low, and there is still much room for adjustment and improvement.
(2) Spatial evolution characteristics
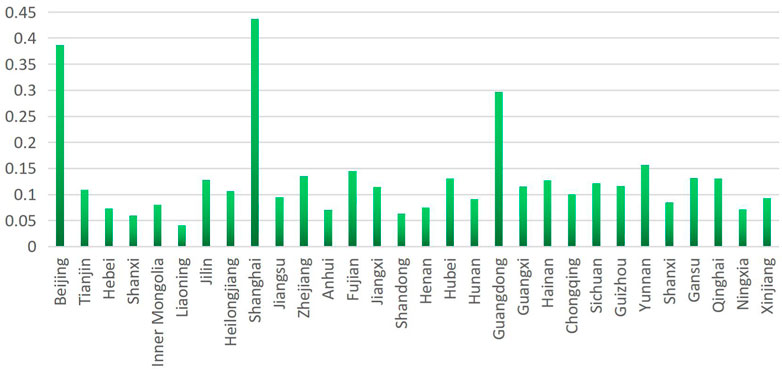
FIGURE 3. The comprehensive scores of high-quality green energy development in China in 2018. Data source:The author uses the data of China from 2010 to 2018 to calculate the level of high-quality green energy development in different regions by entropy weight method. Note:The author uses the office software excel (one of the Office components in the Office software package developed by Microsoft in United States) to draw.
The high-quality development of green energy in China shows prominent regional characteristics. It can be seen from the above analysis that there are significant differences among the eastern, central and western regions. To further observe the spatial evolution characteristics of the region’s high-quality development level of green energy, this paper uses ArcGIS 10.6 software (Environmental Systems Research Institute (Esri), RedLands, California, United States)to draw a map. Figure 4 shows the high-quality development level of green energy in different regions of China in 2010, 2013, 2016, and 2018.
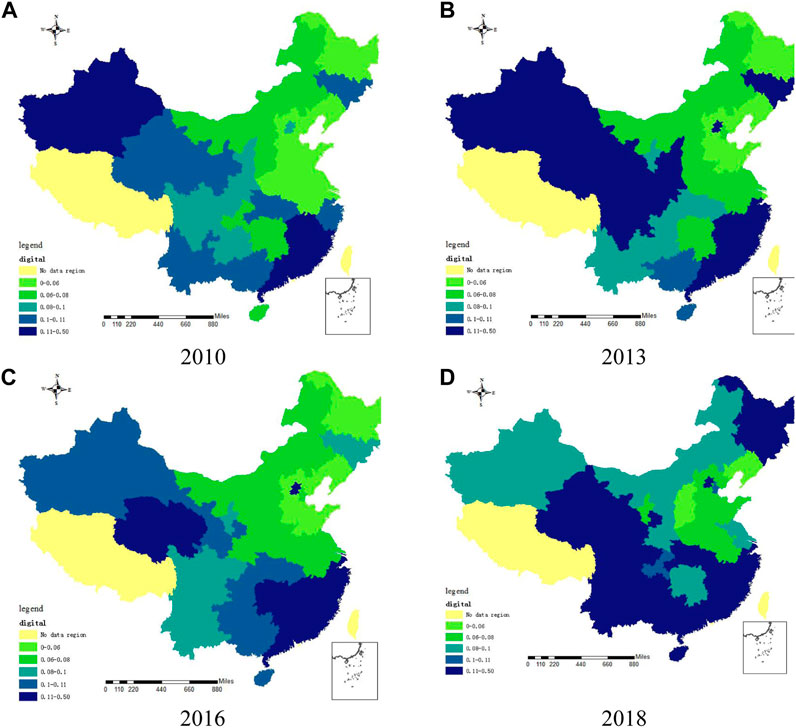
FIGURE 4. Spatial devolution of high-quality development level of green energy in China by region in 2010, 2013, 2016, and 2018. (A): The high-quality development level of green energy in China by region in 2010. (B): The high-quality development level of green energy in China by region in 2013. (C): The high-quality development level of green energy in China by region in 2016. (D): The high-quality development level of green energy in China by region in 2018.
From Figure 4, the high-quality development level of green energy in different regions of China showed different trends from 2010 to 2018, specifically as follows:
First, the level of high-quality green energy development in the eastern region is generally higher than in the central and western regions. The relatively developed regions represented by Guangdong Province, Beijing City, Shanghai City and Zhejiang Province started early with a high concentration of green industries. The energy industry in these regions has formed a relatively mature development model. At the beginning of the estimation in 2010, the high-quality development level of eastern China, except Guangdong, was still low. However, in the next ten years, green industries in these regions have developed steadily. The energy structure has also been further optimized, and green development quality has shown an upward trend.
Second, in the central region represented by Henan, Hunan, Hebei and Anhui, although the green industry started late, the initial energy consumption depended on non-clean energy such as coal and oil. However, after the energy structure adjustment, we have come from behind. And it has firmly occupied the second gradient of high-quality development of green energy in 2018. The green industry starts late and develops fast, mainly in inland cities, relying on natural resource endowment. The unique energy structure is explored according to its economic development model. For example, Sichuan, Chongqing and Hunan rely on particular terrain structures to vigorously develop hydropower. By 2018, the high-quality development level of green energy in Hunan, Chongqing, Sichuan and Hubei has risen to 0.0911, 0.1003, 0.1212, and 0.1309.
Due to their unique natural endowments, Shandong and Shanxi have 223 coal mines, including Shanneng (formed by the restructuring of Xinwen, Feikuang, Zikuang, Linkuang, Longkuang and Jujube) and Yankuang. In the energy production structure, coal maintains a high position. Therefore, the high-quality development level of green energy in these regions remains at a lower echelon.
Third, the high-quality development level of green energy in some western regions, represented by Xinjiang and Ningxia, has experienced a process from high to low, mainly because the development of the primary and secondary industries depends more on the use of non-clean energy. China’s regional economic development is uneven. Most western regions are still in the middle of industrialization, and vigorously developing the secondary industry will limit the green industry. Even the high-quality development level of green energy has declined instead of rising.
Generally, China’s high-quality development of green energy is distributed in a ladder pattern. The coastal area is in the first gradient. Most of the central region is in the second gradient. Northwest China is basically in the third echelon. It has gradually declined from the east to the central and western regions, forming a significant regional distribution pattern of “the development level of the eastern and central regions is close, while that of the western regions is low.” With the improvement of China’s overall green energy development level, the energy structure has also been constantly adjusted and optimized. The ladder distribution of high-quality development of green energy has shifted from coast to inland. More inland provinces, such as Hubei Province and Sichuan Province, have gradually entered the first gradient. However, there is still a particular gap between coastal cities. The high-quality development of green energy among regions in China is unbalanced. There is still much room for growth in areas with low development levels. China still needs to take some measures to promote the development of green industries in underdeveloped areas and narrow the gap between regions.
In the previous section, this paper measured the high-quality development level of green energy in different regions of China using the entropy weight method. There are many studies on industrial agglomeration, and the selection of proxy indicators is also different. To verify the impact of the development of the tertiary industry on the development of green energy, this paper uses the sports industry aggregation to represent the degree of the tertiary industry aggregation. It constructs a static panel regression model to discuss the impact of the scale of sports industry aggregation in different regions of China on the high-quality development of green energy in 2010–2018. Establish the following basic regression model, as shown in Eq. 12.
In Formula (12),
(1) Explained variable: High-quality development level of green energy (
(2) Core explanatory variable: Scale of sports industry agglomeration (
(3) Control variable
Industrial structure (
Urbanization level (
Environmental regulation (
Foreign direct investment (
Gross regional product (
(4) Instrumental variable: added value of sports industry per capita (
As the high-quality development level of green energy is calculated by building an indicator system, the potential endogenous problems in the model may not be avoided by using regression models only. As a result, the empirical results are not accurate enough. Specifically, the endogenous problem of the impact of sports industry agglomeration on the high-quality development of green energy mainly comes from the existence of missing variables. However, this paper considers various factors that affect the high-quality development of green energy and non-observational factors that are variable or immutable over time. However, the development quality of green energy covers a wide range, and there may still be challenging to describe and measure factors. For example, institutional differences between regions, factor endowment differences and other influencing factors; Second, two-way causality. Industrial agglomeration can promote the high-quality development of green energy, and improving green energy quality can also improve the development environment for sports industry agglomeration. Therefore, this paper uses tool variables to overcome endogenous problems. Regarding the choice of tool variables, the traditional approach is to take the lag term of endogenous variables or the lag term of other variables as the tool variable. However, considering the time spillover effect of high-quality development of green energy, the added value of the sports industry per capita is used as the tool variable.
This paper takes the level of energy quality development index and sports agglomeration degree of 30 provinces in China from 2010 to 2018 as the research object. The provincial panel data for 2010–2018 were obtained from the National Bureau of Statistics, the provincial energy statistical yearbook, the Ministry of Natural Resources, the China Science and Technology Statistical Yearbook, and other official platforms and open channels. The explained variable green energy high-quality development level has been measured in the previous section. The added value of the regional sports industry in the explained variable comes from the China Statistical Yearbook (2010–2018), the General Administration of Sports, and the official websites of provincial and municipal statistics bureaus and sports bureaus. And the Statistical Yearbook and Statistics of China’s Sports Industry and Related Industries (2010–2018) of all provinces (urban areas). The control variables mainly come from the China Statistical Yearbook (2010–2018), China Industrial Statistical Yearbook (2010–2018), China Urban Statistical Yearbook (2010–2018), the website of the National Bureau of Statistics and the statistical database of China’s economic and social development. Some indicators, such as urbanization level indicators, are calculated based on statistical data. Some missing data are supplemented from the provincial and municipal statistical yearbooks, and some are supplemented by linear interpolation and linear trend methods. In addition, considering the particularity and data availability of the four regions of Tibet Autonomous Region, Hong Kong Special Administrative Region, Macao Special Administrative Region and Taiwan, the data of these four regions are excluded from the data collation process. Finally, 30 provinces’ balanced panel data from 2010 to 2018 were obtained. To eliminate the influence of heteroscedasticity and stiffness of related variables on the results, some data are logarithmized in this paper. Table 3 presents a descriptive statistical analysis of all variables.
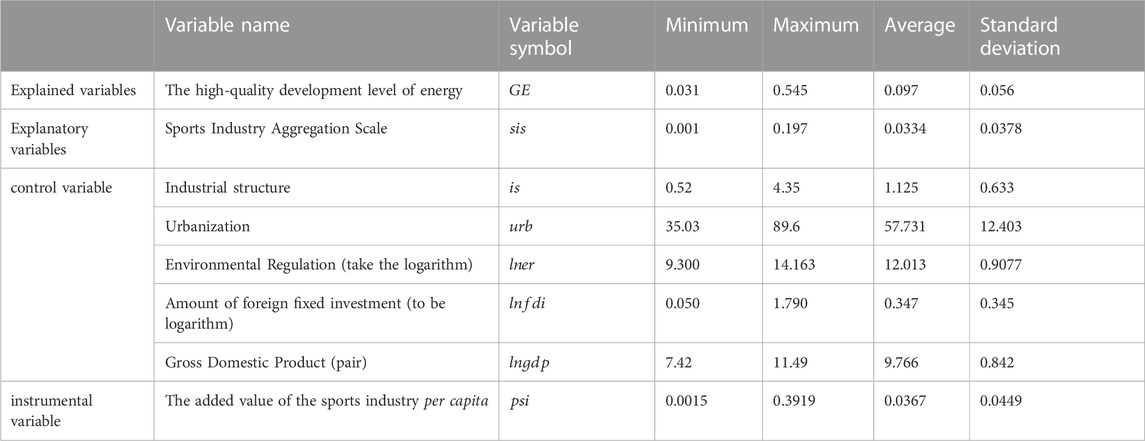
TABLE 3. Descriptive statistical analysis.
(1) Benchmark regression results
This paper constructs a panel regression model for stepwise regression to verify whether industrial agglomeration will affect the quality of green energy development. And get the model (1) - model (6). Fixed-effects models can improve the consistency of estimated results. The random effect model is a more efficient estimator than the fixed effect under no endogeneity. Hausman test results show that fixed effects should be selected. Table 4 reports the step-by-step regression results in which the explained variable is the high-quality development level of green energy, and the core explanatory variable is the sports industry aggregation. The results in Table 4 show that the improvement of the scale of sports industry agglomeration can promote the high-quality development of regional green energy.
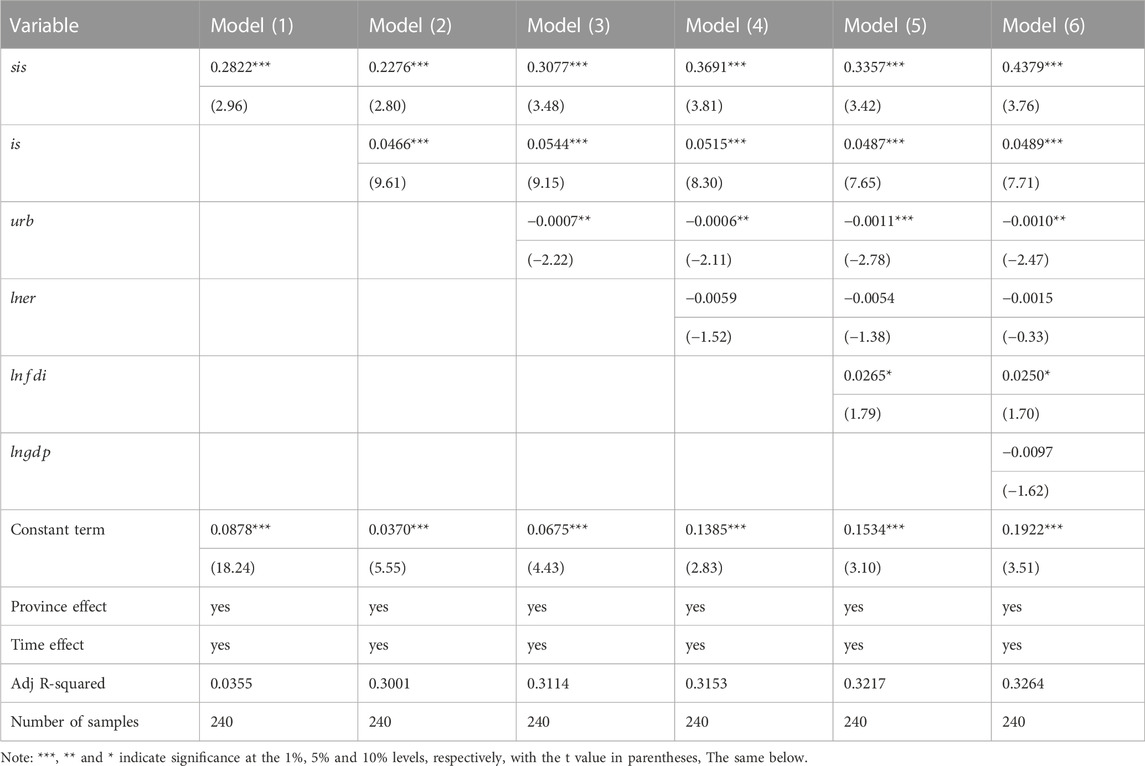
TABLE 4. Benchmark regression results of sports industry agglomeration affecting the high-quality development of green energy.
No control variables are added to the model (1), and only the impact of sports industry aggregation on the quality of green energy development is tested. The results show that sports industry agglomeration can promote the high-quality development of regional green energy. Although the empirical results are significant at the 1% level, the coefficient of determination is only 0.0355. It shows that regression models without control variables cannot simulate the situation well. Model (2) - Model (6) step-by-step adding control variables. From the regression results of model (6), the influence coefficient of sports industry agglomeration on the high-quality development level of green energy is 0.4379, and it has passed the 1% significance test. That is to say, for every 1% increase in the scale of sports industry agglomeration, the quality of green energy development will increase by 0.4379%. The increase in the scale of sports industry agglomeration will gradually change the living environment, lifestyle and consumption structure of residents. At the same time, these factors will also affect the regional energy consumption structure. On the one hand, the agglomeration of the sports industry has changed the region’s current mode of extensive economic growth. The perfect market structure and market scale will further optimize the allocation of resources and increase the efficiency of energy utilization; on the other hand, the aggregation of the sports industry requires the coordinated development of the secondary industry and the tertiary industry, which involves the coordination of various aspects of manufacturing, service industry and environmental protection. The agglomeration of the sports industry to drive the development of the tertiary industry will promote industrial upgrading and regional green technology investment and transform and adjust the energy consumption structure.
Previous studies have proved that the regional differences of China’s sports industry agglomeration are significant. However, the overall situation has been significantly improved, and there is an obvious coupling feature between regional economic growth and green energy development (Yao and Liu, 2021). Specifically, sports industry agglomeration is conducive to the generation of scale effect and technology spillover effect through resource sharing. This will not only promote regional economic growth, but also improve the level of green energy development. On the contrary, regional economic growth can also continuously attract factor agglomeration and promote sports industry agglomeration (Luo et al., 2009). Due to its advantages such as cost advantage, scale effect and information resource sharing effect, sports industry agglomeration can play a certain role in promoting the green development of energy (Wang et al., 2012). Using provincial panel data, this paper demonstrates quantitatively that sports industry agglomeration can promote high-quality development of regional green energy, which is a supplement and refinement of previous studies.
Next, analyze the impact of the main control variables on the high-quality development level of green energy. First, upgrading the industrial structure can adjust the energy consumption structure. The regression coefficient of industrial structure in the model (6) is 0.0489, which is significant at 1%. It shows that upgrading the industrial structure can promote the high-quality development of green energy. Secondly, urbanization will restrain the growth of green energy to a certain extent. The regression coefficient in model (6) is -0.0010, which is significant at the 5% level. It is because, in the early stage of urban construction, a large amount of energy will be consumed, especially mineral energy. Finally, model (6) shows that the amount of foreign fixed investment positively affects the high-quality development of green energy. Its influence coefficient is 0.0250 and has passed the 10% significance test. With the development of China’s economy to a certain level, many regions are more inclined to introduce foreign high-tech rather than being “pollution shelters."
(2) Endogenous test
The above benchmark regression results verify that sports industry agglomeration will promote the high-quality development of green energy. The general estimation method will make the estimated coefficients biased and inconsistent. There are endogeneity problems that interfere with the empirical regression results. Therefore, this section uses the instrumental variables method to test the benchmark regression results. Due to the temporal spillover effect of sports industry agglomeration in selecting instrumental variables, the per capita sports industry added value is chosen as an instrumental variable. And use the two-stage least squares method (2SLS) to regress Eq. 8 to test the impact of sports industry agglomeration on the quality of green energy development. The regression results of an instrumental variable are shown in Table 5. Model (7) is the 2SLS regression result of the unfixed time and province effects. Model (8) is the 2SLS regression result of the fixed time effect and uncontrolled province effect. Model (9) is the 2SLS regression results of the fixed province effect and uncontrolled time effect. Model (10) is the 2SLS regression result of the fixed time effect and province effect.
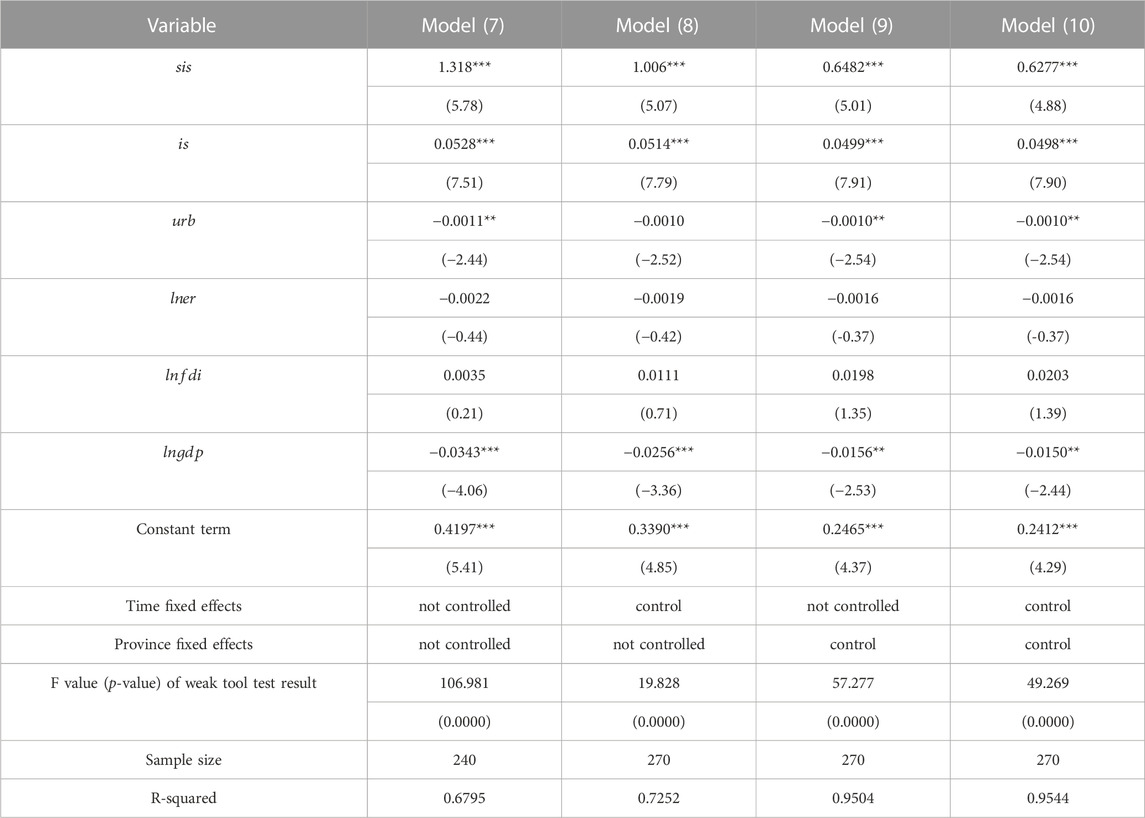
TABLE 5. Regression of instrumental variables.
From Table 5, model (7) to model (10) in the weak tool test, the F statistic p-value of Kleibergen-Paap rk LM is significant at the 1% level. The F-statistics are all higher than 10, which is greater than the critical value of the weak identification test. It shows that the instrumental and endogenous variables have sufficient correlation, which rejects the original hypothesis of insufficient identification of instrumental variables. Since only one instrumental variable is used in this paper, no over-identification test is required. Therefore, it is reasonable to choose the added value of the sports industry per capita as an instrumental variable. Specifically, after considering the endogeneity, the sports industry’s aggregation still positively impacts the high-quality development level of green energy. After controlling for the time-fixed and province-fixed effects, the influence coefficient is 0.6277, which is significant at the 1% level. Compared with the benchmark regression results, the instrumental variable regression results have not changed substantially. This further supports the conclusion obtained by the benchmark regression. It shows that the aggregation of the sports industry can promote the high-quality development of green energy.
(3) Heterogeneity analysis
The benchmark regression model in the previous section of this paper has demonstrated that the aggregation of the sports industry can promote the high-quality development of green energy. Due to the vast territory of China, there are relatively significant differences in the development level of the sports industry, the upgrading degree of industrial structure, the level of technological innovation and the energy consumption structure in different regions. To make the research results more scientific, this paper tests the mediating effect of the three variables in the east, middle and west regions to demonstrate the heterogeneity of the empirical results. Table 6 shows the regression results of the impact of the sports industry agglomeration on the high-quality development level of green energy in the eastern, central and western regions.
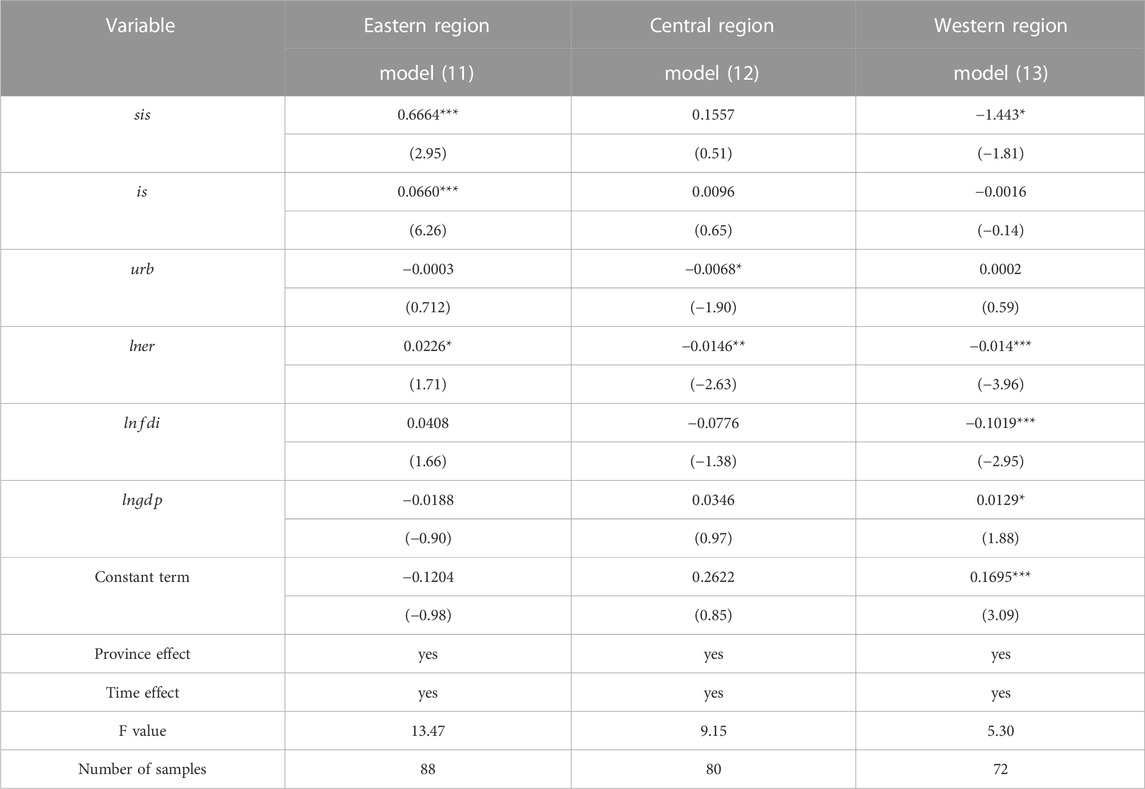
TABLE 6. Regression results of eastern, central and western regions.
According to the division of provinces in the eastern, central and western regions by the National Bureau of Statistics of China, the data of 30 provinces are divided into three regions for heterogeneity analysis. Model (11), model (12) and model (13) in Table 6 are the benchmark regression results for the eastern, central and western regions, respectively. The results show specific differences in the impact of the scale of sports industry aggregation on the quality of green energy development in the eastern, central and western regions. The regression coefficient of the scale of sports industry agglomeration in the eastern region on the quality of green energy development is 0.6664, and it passes the 1% significance test. That is to say, for every 1% increase in the scale of the sports industry agglomeration in the eastern provinces, the high-quality development level of green energy will increase by 0.6664%. The regression coefficient of the central region was 0.1557, but it did not pass the significance test. That is to say, the relationship between the scale of sports industry agglomeration in the central region and the high-quality development of green energy is still uncertain. The regression coefficient of the scale of sports industry agglomeration in the western region on the quality of green energy development is -1.443, and it has passed the 10% significance test. That is to say, every increase in the scale of the sports industry in the provinces of the western region increases by 1 unit, and the level of high-quality development of green energy will decrease by 1.443%.
Combined with the benchmark regression results in Table 4, the scale of sports industry agglomeration in the eastern region positively impacts the high-quality development of green energy, and the degree of promotion is more significant than that in the national region. The scale of the sports industry in the western region will inhibit the high-quality development of green energy. It is also in line with reality. The eastern region has a relatively high level of economic growth, and the development of the sports industry started early. It has greatly improved the level of green technology with the help of technological innovation. Due to differences in resource endowments and economic orientations, green energy development radiates to surrounding areas, with cities such as Beijing, Shanghai, Guangzhou, and Shenzhen as the center. And it has achieved good results in the past ten years. The aggregation of the sports industry depends on the development level of the tertiary industry in the region. The sports industry in the central region started late. Although the development is fast, it is not enough to promote the development of green energy. The development of the sports industry in the western region is slow, and the economy is generally underdeveloped. The development of the primary and secondary industries is the mainstay, and a large amount of ore energy will be consumed in agglomeration development. The lack of investment in green technology, which results in the aggregation of the sports industry in the western region, will inhibit the growth of green energy.
After China introduced the new development concept, it paid more attention to producing and consuming clean energy. The amount of green technology investment increased significantly. To explore the influence of the scale of sports agglomeration on the quality of green energy development, this paper takes the panel data of Chinese provinces from 2010 to 2018 as the research object. Firstly, the indicator system of high-quality development of green energy is constructed, and the empirical analysis is carried out after calculation by the entropy weight method. The main conclusions are as follows:
(1) From 2010 to 2018, the high-quality development level of green energy in different regions in China showed two characteristics. First, the high-quality development level of China’s green energy is growing slowly, and there is still much room for development. Second, the high-quality development of green energy in China presents regional imbalances. There are significant differences between regions. More developed cities maintained a high level. The high-quality development of green energy in underdeveloped areas is supported at a low level, and there is a certain degree of decline.
(2) The high-quality development of green energy in China is distributed in steps. The coastal areas are in the first gradient, most central areas are in the second gradient, and the northwest area is basically in the third echelon. It gradually declined from the east to the central and western regions, forming a significant regional distribution pattern of “the development level of the eastern and central regions is similar, and the western region is relatively low."
(3) The improvement of sports industry agglomeration can promote the high-quality development of regional green energy. The increase of sports industry agglomeration will gradually change the living environment, lifestyle and consumption structure of resident. At the same time, it will also drive the development of the tertiary industry and promote industrial upgrading. The increase in the scale of the sports industry agglomeration will also promote regional green technology investment and adjusts the energy consumption structure.
(4) There are specific differences in the impact of the scale of sports industry agglomeration on the quality of green energy development in the eastern, central and western regions. The scale of sports industry agglomeration in the eastern region positively impacts the high-quality development of green energy, and the promotion is more significant than that in the whole country. On the contrary, the scale of the sports industry in the western region will inhibit the high-quality development of green energy.
According to the above research conclusions, to actively promote the aggregation of the sports industry, promote the high-quality development of green energy and the coordinated improvement of regional green energy, this paper puts forward the following suggestions:
First, strengthen the benign interaction between sports industry regions and promote industrial agglomeration. Restructure the regional economic and industrial chain by introducing industries related to the sports industry. Use other industries or local and regional location advantages and resource endowments to develop the sports market, attract capital inflows, and accelerate the development of the sports service industry. Connect universities, third-party research and development institutions, enterprise research and development institutions and enterprise entities to promote the sports industry gathering. Promote the agglomeration of the sports industry by coordinating management innovation, infrastructure construction, project introduction, and human resources training and introduction.
Second, Adjust environmental regulations and formulate differentiated energy structure transformation policies. The contribution of the sports industry cluster to the development quality of green energy can be extended to the international scope. For developed countries or regions, investment in green energy and carbon emission reduction technologies can be further increased to transform energy structure. The industrial structure of developing countries or regions is dominated by industry, especially the development of heavy industry, which requires a large amount of fossil energy. Therefore, developing countries or regions can develop industries with comparative advantages according to the industrial structure determined by the factor endowment structure. To achieve capital accumulation and technological progress and pass the development stage of high energy consumption and high emissions as soon as possible. In addition, energy efficiency and economic development efficiency can also be improved through technology introduction, imitation and innovation. For China, the development of the energy structure needs further adjustment. Especially for the central and western regions, the pace of energy structure adjustment should be accelerated. Curbing the use of fossil energy in highly polluting industries through environmental regulation is critical. At the same time, it encourages the flow of factors to high-quality and efficient enterprises, industries and regions. And it has the radiation effect of the economy of scope and promotes the aggregation of the sports industry to adjust the energy structure.
Third, Actively create a benign industrial competition environment and realize the natural sports industry agglomeration. Utilize the advantages of multinational companies’ processing and manufacturing industry to promote the transformation and upgrading of processing trade, and form the supporting industrial chain and clusters. At the same time, optimize the capital investment structure of the sports goods manufacturing industry and sports service industry. Focus on the spatial pattern of capital investment in the sports service industry, and support the regional spatial agglomeration of the capital of sports service enterprises. By going out and introducing, we can change the inefficient status quo and explore the efficient and sustainable development mode of the sports industry.
Based on measuring the high-quality development of green energy, this paper empirically tests the relationship between the scale of regional sports industry agglomeration and the development of green energy. Research limitations are mainly reflected in the following three aspects.
First, this paper is limited by the availability and applicability of data, this paper only uses provincial-level data from 2011 to 2018, and the sample size is relatively small. The green energy high-quality index system is not comprehensive enough, and there is a lack of data on some renewable energy sources. Therefore, the research in this paper has certain limitations in depth and breadth. In future research, we will continue to pay attention to the development of green energy and look for the production and consumption data of renewable energy, such as nuclear energy, wind energy, solar energy, and tidal energy. Continue to improve research on the high-quality development of green energy. Second, a comprehensive understanding and scientific evaluation of the relationship between tertiary industry agglomeration and green energy development is a prerequisite for sustainable economic growth. However, it is not comprehensive enough to explore the relationship between the two only from the fixed effect model, and its specific impact mechanism needs further research. Third, in this paper, the scale of sports industry agglomeration is taken as explanatory variable and calculated by using macro panel data. This paper does not consider the use of questionnaires for data collection, and lacks the investigation of enterprise micro-data. Therefore, the research results are too one-sided, which limits the research in this paper to a certain extent.
Therefore, the following analysis can consider introducing moderator or intermediary variables to analyze further the impact of tertiary industry agglomeration on green energy development and structure. Combining China’s experience with international experience provides different paths for China to promote the development of green energy and adjust its energy structure. In addition, the global problems of climate change, ecological damage and environmental pollution are increasingly severe. The conclusions of this study may be extended to other countries or regions in the world. But this needs the support of data and experimental results. In the following analysis, we will try to verify whether the results of this study are universal internationally [(Luo et al., 2009; Wang et al., 2012; Yao and Liu, 2021)].
The raw data supporting the conclusion of this article will be made available by the authors, without undue reservation.
Conceptualization, ML and LC; methodology, ML and LC; software, LC and ML; formal analysis, ML and LC; resources, ML and LC; data curation, ML and LC; writing—original draft preparation, ML and LC; writing—review and editing, ML and LC; supervision, ML and LC; project administration, ML and LC; funding acquisition, LC. All authors have read and agreed to the published version of the manuscript.
This work was supported by the education science general project “14th Five-Year Plan” of Jiangxi Provincial Department of Education (No.22YB274), Humanities and Social Sciences Youth Project of Jiangxi Provincial Department of Education (No.JY22235), Teaching reform project of Jiangxi Provincial Department of Education (No.JXJG-22-20-13).
We would like to express our gratitude to those who helped us while writing this article. Our most profound appreciation goes to professor Xiaoyun Zhou, from the Xinyu University in China, for his constant encouragement.
The authors declare that the research was conducted in the absence of any commercial or financial relationships that could be construed as a potential conflict of interest.
All claims expressed in this article are solely those of the authors and do not necessarily represent those of their affiliated organizations, or those of the publisher, the editors and the reviewers. Any product that may be evaluated in this article, or claim that may be made by its manufacturer, is not guaranteed or endorsed by the publisher.
Andersson, M., and Lööf, H. (2011). Agglomeration and productivity: Evidence from firm-level data. Ann. regional Sci. 463, 601–620. doi:10.1007/s00168-009-0352-1
Apergis, N., and Payne, J E. (2012). Renewable and non-renewable energy consumption-growth nexus: Evidence from a panel error correction model. Energy Econ. 343, 733–738. doi:10.1016/j.eneco.2011.04.007
Bhattacharya, M., Paramati, S. R., Ozturk, I., and Bhattacharya, S. (2016). The effect of renewable energy consumption on economic growth: Evidence from top 38 countries. Appl. Energy 162, 733–741. doi:10.1016/j.apenergy.2015.10.104
Chen, N., Xu, L., and Chen, Z. (2017). Environmental efficiency analysis of the Yangtze River Economic Zone using super-efficiency data envelopment analysis (SEDEA) and Tobit models. Energy 134, 659–671. doi:10.1016/j.energy.2017.06.076
Chen, X., Zhang, Z., Kang, J., and Li, C. (2013). Analysis of the impact of technology space spillovers on the energy efficiency of the whole society. Sci. Res. Manag. 34 (02), 62–68. doi:10.19571/j.cnki.1000-2995.2013.02.008
Cheng, Z., Li, L., and Liu, J. (2017). Is industrial agglomeration conducive to energy efficiency improvement? Statistics Inf. Forum 32 (03), 70–76.
Cingano, F., and Schivardi, F. (2004). Identifying the sources of local productivity growth. J. Eur. Econ. Assoc. 24, 720–742. doi:10.1162/1542476041423322
Copeland, B R., and Scott Taylor, M. (2013). Trade and the environment: Theory and evidence" trade and the environment. Princeton university press. doi:10.1515/9781400850709
Destek, M A., and Aslan, A. (2017). Renewable and non-renewable energy consumption and economic growth in emerging economies: Evidence from bootstrap panel causality. Renew. Energy 111, 757–763. doi:10.1016/j.renene.2017.05.008
Ding, J. (2021). Industrial agglomeration, scientific and technological innovation and economic growth - analysis based on the new economic geography model. J. Hebei Univ. Econ. Trade 42 (01), 79–89. doi:10.14178/j.cnki.issn1007-2101.202106.003
Dogan, E., and Seker, F. (2016). Determinants of CO2 emissions in the European union: The role of renewable and non-renewable energy. Renew. Energy 94, 429–439. doi:10.1016/j.renene.2016.03.078
Farla, J. C. M., and Blok, K. (2000). Energy efficiency and structural change in Netherlands, 1980-1995. J. Industrial Ecol. 41, 93–117. doi:10.1162/108819800569203
Feng, Y. (2022). China's energy security under the international energy upheaval. Int. Econ. Rev. 1-15 [2013-01-10].
Freire-González, J., Vivanco, D. F., and Puig-Ventosa, I. (2017). Economic structure and energy savings from energy efficiency in households. Ecol. Econ. 131, 12–20. doi:10.1016/j.ecolecon.2016.08.023
Harrod, R. F., Why growth rate differ: Postwar experience in nine Western countries. (editor by E. F) Denison. Economica,1969. 36(143):323–325. doi:10.2307/2551816
He, Jie (2006). Pollution haven hypothesis and environmental impacts of foreign direct investment: The case of industrial emission of sulfur dioxide (SO2) in Chinese provinces. Ecol. Econ. 601, 228–245. doi:10.1016/j.ecolecon.2005.12.008
Hong, H. (2013). Is a key year for China's economic transformation. China Econ. Netw. 2013-01-18 Available at: http://finance.ce.cn/rolling/201301/18/t20130118_17044727.shtml.
Ilbahar, E., Cebi, S., and Kahraman, C. (2019). A state-of-the-art review on multi-attribute renewable energy decision making. Energy Strategy Rev. 25, 18–33. doi:10.1016/j.esr.2019.04.014
Inglesi-Lotz, R. (2016). The impact of renewable energy consumption to economic growth: A panel data application. Energy Econ. 53, 58–63. doi:10.1016/j.eneco.2015.01.003
Jian, S., and Tang, R. (2020). Research on the measurement of China's high-quality development level of green energy. Tech. Econ. 39 (05), 125–133.
Jiang, H., Li, J., and Li, Q. (2022). Government development expenditure, industrial agglomeration and green energy efficiency. Tech. Econ. 41 (01), 53–65.
Kahia, M., Aïssa, M. S. B., and Lanouar, C. (2017). Renewable and non-renewable energy use-economic growth nexus: The case of MENA Net Oil Importing Countries. Renew. Sustain. Energy Rev. 71, 127–140. doi:10.1016/j.rser.2017.01.010
Kahia, M., Mohamed, K., and Aïssa, M. S. B. (2016). What impacts of renewable energy consumption on CO2 emissions and economic and financial development? A panel data vector autoregressive (pvar) approach2016 7th international renewable energy congress (irec). IEEE. doi:10.1109/IREC.2016.7478912
Koçak, E., and Şarkgüneşi, A. (2017). The renewable energy and economic growth nexus in Black Sea and Balkan countries. Energy Policy 100, 51–57. doi:10.1016/j.enpol.2016.10.007
Li, J. (2021). Use energy transformation to help achieve the "double carbon" goal [N]. Soc. Sci. News. 2021, 12–09. 001. doi:10.28705/n.cnki.nshkx.2021.000842
Li, X. (2014). Empirical analysis on marketization, industrial agglomeration and environmental pollution. Stat. Res. 31 (08), 39–45. doi:10.19343/j.cnki.11-1302/c.2014.08.006
Lin, M. (2017). Clean energy consumption, environmental governance and sustainable economic growth in China. Quantitative Econ. Technol. Econ. Res. 34 (12), 3–21. doi:10.13653/j.cnki.jqte.2017.12.001
Lu, J., and Zhang, S. (2011). Development of sports industry - theory and policy. Beijing: Peking University Press.
Luo, N., Xie, L., and Tan, Z. (2009). New progress in research on the relationship between industrial agglomeration and economic growth. Econ. Dyn. (03), 117–121.
Maddison, A. (1987). Growth and slowdown in advanced capitalist economies: Techniques of quantitative assessment. J. Econ. literature 25 (2), 649–698.
Managi, S., and Ranjan Jena, P. (2008). Environmental productivity and Kuznets curve in India. Ecol. Econ. 652, 432–440. doi:10.1016/j.ecolecon.2007.07.011
Marques, A. C., and Fuinhas, J. A. (2012). Is renewable energy effective in promoting growth? Energy Policy 46, 434–442. doi:10.1016/j.enpol.2012.04.006
Pao, H-T., Li, Y-Y., and Fu, H-C. (2014). Clean energy, non-clean energy, and economic growth in the MIST countries. Energy Policy 67, 932–942. doi:10.1016/j.enpol.2013.12.039
Porter, M E., and Van der Linde, C. (1995). Toward a new conception of the environment-competitiveness relationship. J. Econ. Perspect. 94, 97–118. doi:10.1257/jep.9.4.97
Qian, J., Wu, J. H., Yao, L., Mahmut, S., and Zhang, Q. (2021). Comprehensive performance evaluation of Wind-Solar-CCHP system based on emergy analysis and multi-objective decision method. Energy 230, 120779. doi:10.1016/j.energy.2021.120779
Qu, X'e., and Hu, Y. (2019). Zhao Yujun the impact of industrial agglomeration on green total factor productivity of manufacturing industry -- an empirical analysis based on the perspective of long-term and short-term industry heterogeneity. J. Beijing Univ. Technol. Soc. Sci. Ed. 21 (01), 27–36. doi:10.15918/j.jbitss1009-3370.2019.5632
Ren, B., and Huang, H. (2022). The internal mechanism and upgrading strategy of China's sports industry structure optimization under the "double carbon" goal. Sports Res. 36 (04), 75–87. doi:10.15877/j.cnki.nsic.20220606.001
Ren, W., Yang, Z., John, M., Anderson, B., Watt, W., Chen, J., et al. (2003). Urbanization, land use, and water quality in Shanghai: 1947–1996. Environ. Int. 295, 649–659. doi:10.1016/s0160-4120(03)00051-5
Sadorsky, P. (2009). Renewable energy consumption and income in emerging economies. Energy policy 37 (10), 4021–4028. doi:10.1016/j.enpol.2009.05.003
Sancho, F. (2010). Double dividend effectiveness of energy tax policies and the elasticity of substitution: A cge appraisal. Energy Policy 386, 2927–2933. doi:10.1016/j.enpol.2010.01.028
Tahvonen, O., and Salo, S. (2001). Economic growth and transitions between renewable and nonrenewable energy resources. Eur. Econ. Rev. 45 (8), 1379–1398. doi:10.1016/S0014-2921(00)00062-3
Van der Werf, E. (2008). Production functions for climate policy modeling: An empirical analysis. Energy Econ. 306, 2964–2979. doi:10.1016/j.eneco.2008.05.008
Verhoef, E T., and Peter, N. (2002). Externalities in urban sustainability: Environmental versus localization-type agglomeration externalities in a general spatial equilibrium model of a single-sector monocentric industrial city. Ecol. Econ. 402, 157–179. doi:10.1016/S0921-8009(01)00253-1
Virkanen, J. (1998). Effect of urbanization on metal deposition in the bay of Töölönlahti, Southern Finland. Mar. Pollut. Bull. 369, 729–738. doi:10.1016/s0025-326x(98)00053-8
Wang, L., Gong, W., and Hou, X. (2012). Research on the measurement and dynamic evolution of China's inter-provincial sports industry agglomeration level. J. Beijing Sport Univ. 35 (10), 29–34. doi:10.19582/j.cnki.11-3785/g8.2012.10.007
Wang, S. (2020). Research on the relationship between China's green energy use, carbon emissions and economic growth. Soft Sci. 34 (10), 7–11+24. doi:10.13956/j.ss.1001-8409.2020.10.02
Xu, B., Chen, Y., and Shen, X. (2019). Clean energy development, carbon dioxide emission reduction and regional economic growth. Econ. Res. 54 (07), 188–202.
Yan, Q., and Qifeng, W. (2022). Measurement of China's high-quality energy development level and spatial imbalance analysis. J. North China Electr. Power Univ. Soc. Sci. Ed. (04), 16–25. doi:10.14092/j.cnki.cn11-3956/c.2022.04.003
Yao, S., and Liu, B. (2021). Research on the coupling and coordinated development of sports industry agglomeration and regional economic growth. J. Chengdu Inst. Phys. Educ. 47 (04), 118–124. doi:10.15942/j.jcsu.2021.04.019
Zeng, D-Z., and Zhao, L. (2009). Pollution havens and industrial agglomeration. J. Environ. Econ. Manag. 582, 141–153. doi:10.1016/j.jeem.2008.09.003
Zha, D., and Zhou, D. (2014). The elasticity of substitution and the way of nesting CES production function with emphasis on energy input. Appl. Energy 130, 793–798. doi:10.1016/j.apenergy.2014.01.093
Zhang, K., and Wang, D. (2014). Interaction between economic agglomeration and environmental pollution and spatial spillovers. China Ind. Econ. (06), 70–82. doi:10.19581/j.cnki.ciejournal.2014.06.007
Keywords: green energy, high-quality development, sports industry, industrial agglomeration, instrumental variables
Citation: Luo M and Chen L (2023) The impact of sports industry agglomeration on the high-quality development of green energy. Front. Environ. Sci. 11:1109072. doi: 10.3389/fenvs.2023.1109072
Received: 27 November 2022; Accepted: 02 February 2023;
Published: 14 February 2023.
Edited by:
Maria Alzira Pimenta Dinis, Fernando Pessoa University, PortugalReviewed by:
Zujaja Wahaj, National University of Sciences and Technology, PakistanCopyright © 2023 Luo and Chen. This is an open-access article distributed under the terms of the Creative Commons Attribution License (CC BY). The use, distribution or reproduction in other forums is permitted, provided the original author(s) and the copyright owner(s) are credited and that the original publication in this journal is cited, in accordance with accepted academic practice. No use, distribution or reproduction is permitted which does not comply with these terms.
*Correspondence: Lingming Chen, bGluZ21pbmcxMDE2QG1haWwuaG51c3QuZWR1LmNu
Disclaimer: All claims expressed in this article are solely those of the authors and do not necessarily represent those of their affiliated organizations, or those of the publisher, the editors and the reviewers. Any product that may be evaluated in this article or claim that may be made by its manufacturer is not guaranteed or endorsed by the publisher.
Research integrity at Frontiers
Learn more about the work of our research integrity team to safeguard the quality of each article we publish.