 Xianhui Feng
 Huan Wen1
 Mu He
Mu He
95% of researchers rate our articles as excellent or good
Learn more about the work of our research integrity team to safeguard the quality of each article we publish.
Find out more
ORIGINAL RESEARCH article
Front. Environ. Sci. , 16 February 2023
Sec. Atmosphere and Climate
Volume 11 - 2023 | https://doi.org/10.3389/fenvs.2023.1108002
This article is part of the Research Topic Climate Change and Adaptive Capacity Building View all 15 articles
Purpose: Urban trees play a key role in ameliorating extreme urban climates in cities. At the micro-level, it is crucial to investigate the variations in microclimates affected by the canopies of different tree species. The significance of this research is to provide scientific evidence for the selection of tree species in urban planning that can improve the local microclimate. This study examines the factors of microclimate (air temperature, relative humidity, wind environment, and solar radiation) underneath the canopy of four different evergreen tree species in hot and humid areas. Furthermore, the correlation between the physiological characteristics of these tree species and microclimate was statistically analyzed using data on the physiological parameters of the trees and microclimate factors.
Methods: In this study, four tree species were selected for field measurements: Ficus microcarpa L. f., Ficus virens Aiton, Bauhinia x blakeana Dunn, and Cinnamomum camphora (L.) Presl. We used the HOBE (H21-0024, onset) to measure three climatic parameters (Temperature, Relative Humidity, and Instantaneous Wind Speed), and the Li-6400 Portable Photosynthesis System to measure five plant physiological parameters: Stomatal Conductance (Gs), Leaf Temperature (Tleaf), Leaf Surface Relative Humidity (RHsfc), Photosynthetically Active Radiation (PAR), and Leaf-level Vapor Pressure Deficit (Vpdl). The observations were conducted during winter (January 16 - January 22) and summer (August 7 - August 22). The investigation periods were 9:00–11:00, 12:00–14:00, and 16:00–18:00, and data were recorded at 15-min intervals. The observational data obtained were analyzed using statistical methods, including one-way analysis of variance, Pearson correlation coefficient, and multiple regression analysis.
Results: The results of this study indicated that the four tree species being measured had different effects on the microclimate at the sites in both the winter and summer seasons. During the 7-day observation in the summer, the cooling effect of the four tree species was significant. The relative humidity underneath the canopies was 3%–11% higher than that of weather stations. The instantaneous wind speed in the afternoon was relatively higher than at other times. The solar radiation intensity was dramatically reduced by 85%–95%. During the 7-day observation in the winter, the trees had a warming effect in the morning. The relative humidity underneath the canopies was 10%–20% higher than that of the weather stations. The areas underneath the canopies were windless in the afternoon. The solar radiation intensity was reduced by 78%–95%. Ficus microcarpa was found to be one of the most effective tree species for increasing the relative humidity and reducing solar radiation intensity in hot and humid areas. Additionally, the highest instantaneous wind speed was observed in the areas underneath the canopies of F. virens and C. camphora. Statistical tests revealed that the air temperature and the instantaneous wind were extremely significantly correlated with Tleaf and RHsfc.
Conclusion: The four urban tree species studied had varying degrees of effect on air temperature, relative humidity, wind speed, and reducing solar radiation intensity in the areas underneath their canopies. Furthermore, these trees demonstrated varying abilities to improve microclimate conditions in different seasons. The four trees had a cooling effect in the summer. The instantaneous wind speed was calm in the afternoons during the winter in contrast to being relatively high speed in the afternoons during the summer. This characteristic is beneficial to warmth in winter and coolness in summer. In terms of the internal influence mechanisms, the results of the analysis indicated that microclimate factors were significantly correlated with the physiological parameters of the trees. Tleaf, RHsfc, and Vpdl were significant physiological parameters and had different contribution rates to microclimate factors.
Green spaces are one of the major types of urban land development. Trees in urban green spaces have positive effects and cool urban temperatures. There is considerable research demonstrating their cooling effect on temperatures and their effect on increasing the air humidity, which improves the local urban microclimate through trees in greenspaces (Bao et al., 2001; Guo et al., 2008; Li et al., 2011; Zhu et al., 2011).
The influence effect of urban trees on local urban climatic environments is a complex natural phenomenon. First, recent studies have shown urban trees have varying degrees of capability to mitigate high temperatures in cities under different climate contexts. The cooling efficiency of urban trees under different climatic conditions was shown to have significant differences in 510 cities, and the influence of mitigating temperature was particularly notable in arid cities (Cheng et al., 2022). Studies in two coastal cities with different climatic contexts, Seattle, Washington, and Baltimore, Maryland, USA, showed that the compactness of canopy cover was not significant in reducing land surface temperature (Jung et al., 2021). Secondly, trees have different local microclimate influence effects compared to shrubs and grasses, and the ecological effects of various species of trees are different. Using analysis of high-resolution land surface temperature (LSTs) and land-cover data from 293 European cities, it was found that the cooling effect of spaces without trees was approximately 2–4 times higher than that of green space (Schwaab et al., 2021). It has been shown in Jining city that the taller the trees, the more effective they are in reducing the temperature of surrounding areas. (Xia et al., 2013). It has been confirmed that tree greenbelts have the best cooling and humidifying effects in Shenzhen, as compared to the microclimate effects of other landscape types, such as lawns, and waterscapes, as determined by ENVI-met (Wu et al., 2016). Due to the different efficiencies of the internal mechanisms of trees, such as photosynthesis and evapotranspiration, different tree species have varying effects on microclimate conditions. (Yang et al., 2022). Research has established that there is a non-linear threshold relationship between the area underneath the canopy and the decrease in land surface temperature, and compactness of the canopy cover was found to have no significant impact on reducing the land surface temperature (Jung et al., 2021). It is hypothesized that microclimate conditions at a site can be influenced by different tree species through their photosynthesis or evapotranspiration processes. A study in northern China has shown that there are differences in the cooling and humidifying effects of Pinus densiflora forests and mixed Quercus acutissima/Pinus massoniana forests (Dong et al., 2017). The arborous layer has a significant impact on ecosystems, particularly on soil runoff. In forest tree species, spruce forests had the driest environmental conditions, which was also confirmed at the Soil Experiment Station of Moscow State University during 60 years of observations of ecosystems (Matyshak et al., 2021).
In terms of methodology, recently, software simulation techniques, such as FLUENT and ENVI-met, have been used frequently. FLUENT was used to simulate air turbulence in an ideal urban green space condition in Guangzhou (Feng and Chu, 2017). Previous studies using ENVI-met have found that outdoor thermal improvements in campus areas are related to the effects of different levels of tree canopy closure in Nigeria (Abdulkarim et al., 2021). Liu et al. (2018) set up simulation experiments using ENVI-met. The simulated experiments are accurately calculated based on the field-measured physiological parameters data of Ficus microcarpa, thus proving the physiological and microclimate performance of Ficus microcarpa in hot and humid areas. But the simulation method is limited by its algorithms and the lack of perception of complex real environmental conditions; the selection of representative real sites for field observation is still the most accurate method of microclimate research.
Previous studies have established that trees can affect the microclimate. This study selected four urban tree species, F. microcarpa, Ficus virens, Bauhinia x blakeana, and Cinnamomum camphora, all of them growing in Guangzhou city parks. The main purpose was to research the different impact effects of a variety of tree species on a site’s microclimate environment. Thus, the research hypothesis propose to investigate the following questions: 1) What are the conditions of the temperature, relative humidity, wind speed, and solar radiation intensity underneath the canopy of these tree species in a hot and humid area of southern subtropical region? 2) How different is the influence of these trees on the microclimate underneath their canopies compared with the observation results from weather stations? 3) Which physiological parameters of the trees affect the temperature, relative humidity, wind environment, and solar radiation intensity underneath the canopy, and what is the underlying correlation? The purpose of this study is to investigate the above assumptions through actual measurements of four tree species.
Guangzhou is a southern, subtropical city characterized by a hot and humid climate, and is a typically static wind city (Table 1). According to the 2021 Guangzhou Climate Bulletin, the annual average temperature is 24.0°C, and has increased at a rate of 0.3°C/10 years since 1961. The average wind speed is 1.9 m/s. Since 1961, the annual average wind speed has shown a significant decrease at a rate of 0.07 m/s per 10 years. According to meteorological data from the National Station in Guangzhou (59287), in the past 10 years (2009–2018), the annual average relative humidity was 71.1%. The area experiences its highest annual precipitation from May to June, with an annual mean precipitation of 1,695.9 mm and a maximum daily precipitation of 214.7 mm. Guangzhou vegetation consists of southern subtropical evergreen broad-leaved forests, and the trees are evergreen during four seasons.
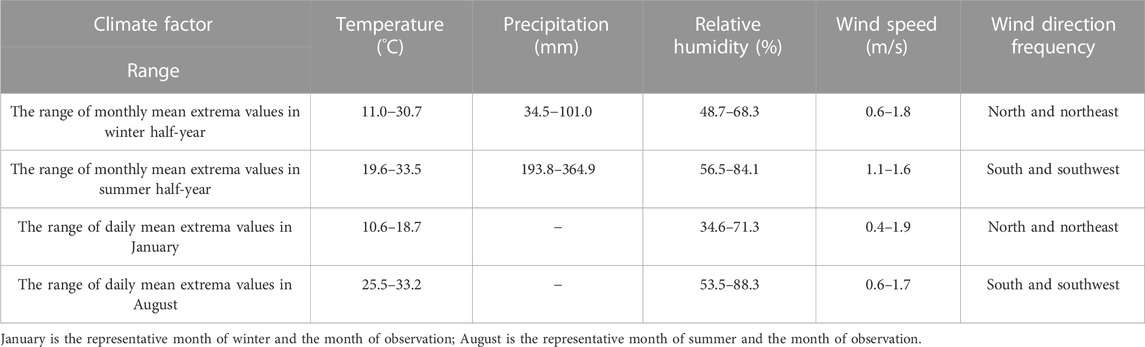
TABLE 1. The range of mean extrema values of climate factors in Guangzhou during the 30-year period (1991–2020).
The field of observation was Dongshan Lake Park, covering 31.7 ha, and with one of the four major artificial lakes in Guangzhou. In addition, Dongshan Lake Park is one of the most comprehensive city parks in Guangzhou, designated as a protected cultural heritage site in Guangzhou. Due to the well-protected tree species growing in the park and the characteristics of the Canton landscape, it has become a hotspot for nearby residents to rest. The areas underneath the tree canopies are some of the residents’ favorite activity spaces in the park.
According to the authoritative green space survey report of Guangzhou, we planned to select the trees with the largest number of plantings and the most widely used for research. The report was compiled by the Guangzhou Institute of Forestry and Landscape Architecture (GZ-IFLA). From 2011 to 2016, institute staff investigated all ten districts within the metropolitan area of Guangzhou, including 313 parks, 12,868 residential green spaces, 88 forest parks and nature reserves, 365 flyover green areas, and 600,000 street trees, in order to gather information about the planted tree species in urban green spaces. The survey reported that the three top trees, Bauhinia x blakeana, Ficus microcarpa (F. microcarpa), and Ficus virens (F. virens) are the most widely used, and the survey also reported on the planting numbers of these top three trees. The most widely used non-native tree species is Cinnamomum camphora (C. camphora). Therefore, in this study, four tree species were selected in total as research objects: Bauhinia x blakeana, F. microcarpa, F. virens, and C. camphora.
Site microclimate is influenced by a variety of factors. To the extent possible, to eliminate other factors affecting the site, all observation sites were required to have convergent features or a similar environment in this study. The distribution of the four observation sites is shown in Figure 1.
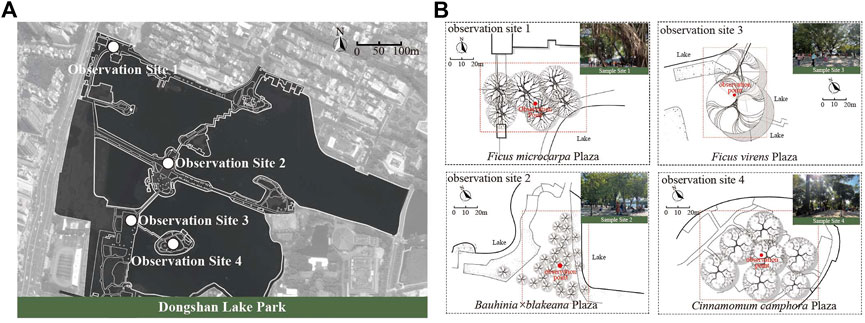
FIGURE 1. Study site (A) distribution map of the four measurement sites (B) sample site plan and field photos.
The selected observation sites meet the following requirements: 1) the sites were all located next to Dongshan Lake (distance < 5 m), and the distance between each site was approximately 500 m to eliminate the local climate differences caused by significant distance differences; 2) the trees of each observation site were of the same species, and all the sites had the same kind of pavement; 3) the ages of the trees in the four observation sites was older than 50 years, with crown base heights of over 2 m; 4) the observation sites did not have shrubs or grasses, to eliminate other plants influences; 5) the planting areas of the four observation sites were the same size; 6) the closure canopy of all trees was above 70% in summer. Details and real conditions of the observation sites are shown in Figure 1 and Table 2.
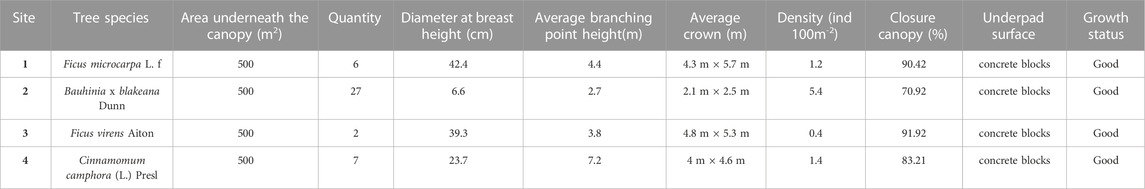
TABLE 2. Description of the conditions of the sample sites.
We measured the closure canopy of the trees by using fish-eye photographs at the observation sites. Both values of Sky View Factor (SVF) and closure canopy were analyzed by Rayman software (Matzarakis et al., 2007; Matzarakis et al., 2010), as shown in Table 3.
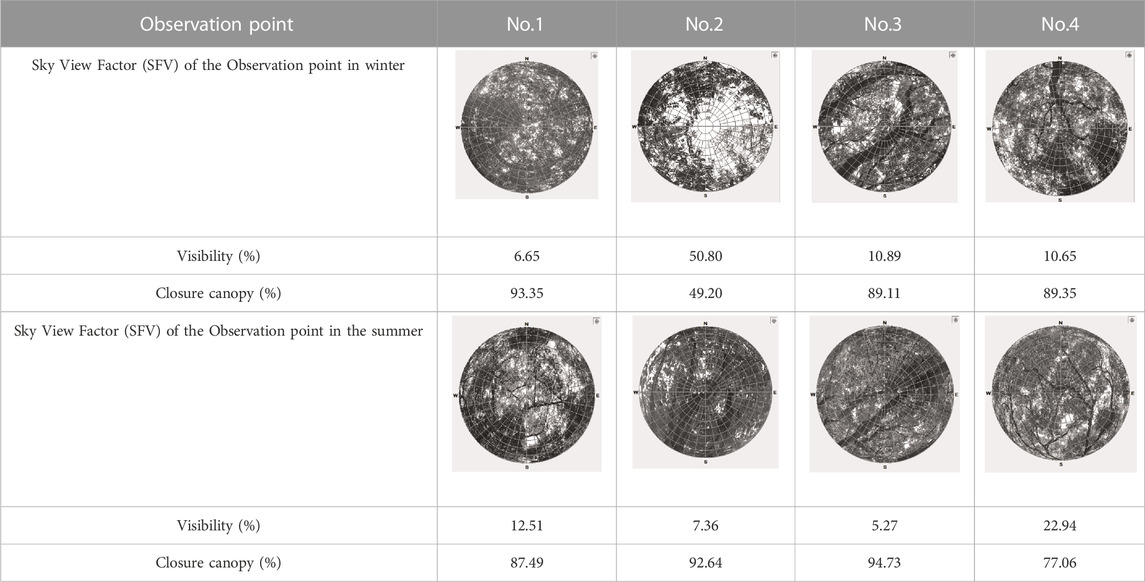
TABLE 3. Closure of the canopy of the four tree species.
This study used Onset HOBO equipment to measure three climatic parameters, including air temperature (Temp/°C), relative humidity (RH/%), and wind speed (WS/m/s); an Li-6400 Portable Photosynthesis System instrument to measure five physiological parameters, including Gs (molH2O/(m2·s)), Tleaf (°C), RHsfc (%), PAR(KPa), and Vpdl (μmol/(m2·s)). The intensity of solar radiation (SR, w/m2) was measured by LPPYRA06 albedo measuring instrument produced by Delta OHM in Italy.
The instrument properties, parameters, and observational times are shown in Table 4.
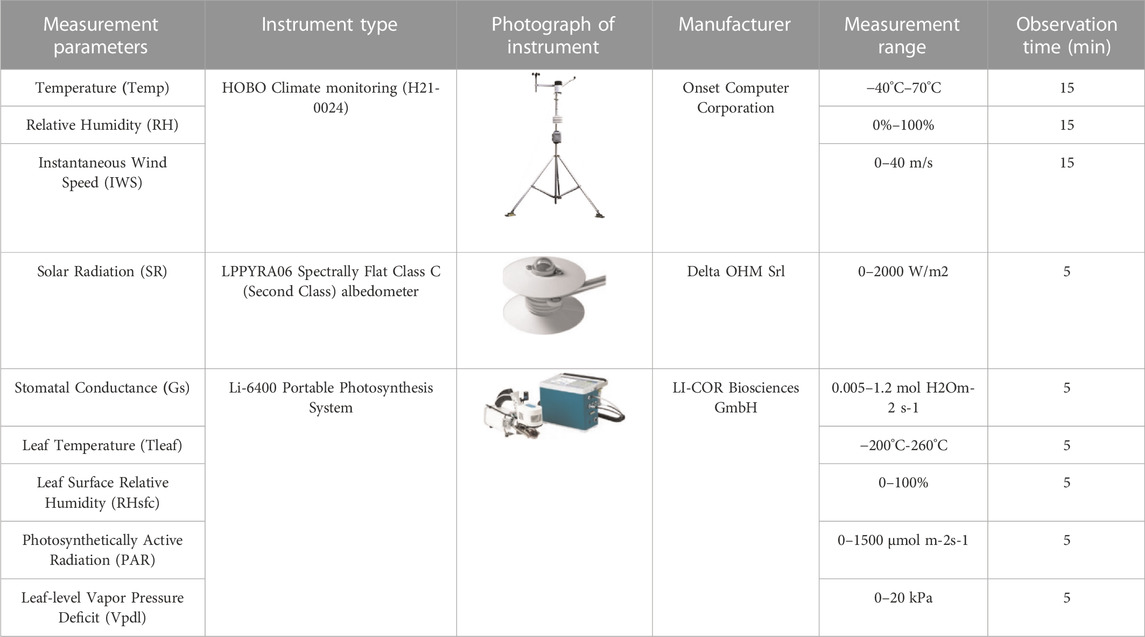
TABLE 4. The information of observation.
The Vpdl was calculated by the equation:
Where: Tleaf = leaf temperature; Vpkpa = vapor pressure chamber air; SVTleaf = SatVap (The saturation vapor pressure is calculated based on the temperature of the leaf.); H2OS = concentration of sample cell H2O; Press = atmospheric pressure.
According to the Guangzhou weather website, for 30 years (1991–2020), generally, the weather in Guangzhou has been divided into two typical seasons: the winter half-year, which is the period from October to March, and the summer half-year, which is the period from April to September. The lowest monthly mean temperature occurs in December, during the winter season. The highest monthly mean temperature occurs in June, during the summer.
To avoid the impact of extreme temperatures, this study selected January in the winter half-year and August in the summer half-year as the representative months for the winter and summer observation. January is third on the rank of monthly mean temperature from the lowest to the highest in winter; August is the same for summer. The general climate data of the weather stations are shown in Table 1.
In the winter season, the observation times were from 16th to 22 January 2021, with continuous observation for a week. The observation times in the summer were from 7th to 22 August 2021, excluding rainy days by selecting 7 days of clear and cloudless weather. The observation periods were 9:00–11:00, 12:00–14:00, and 16:00–18:00, recorded at 15-min intervals, and the mean values of the data were stored.
The data were calculated by Excel 2016, SPSS software, and illustrated by Origin 2021. In terms of data statistical methods, one-way analysis of variance, Pearson correlation coefficient analysis, and multiple regression analysis were used. One-way analysis of variance was used to compare the significance levels of air temperature and relative humidity between the different trees and the weather stations. Pearson correlation analyzed the correlation between the physiological parameters of the trees and the microclimatic factors. The multiple regression further analyzed the contribution rate of physiological parameters to microclimatic factors.
In the winter, the effects on temperature were more complex. Due to the heat storage and insulation capacity of plants, the air temperatures of the areas underneath the canopies of the four species were significantly higher than that of weather stations from 8:00–9:00. Before 12:00, the temperature underneath the canopy of F. microcarpa was warmer than the weather stations. Among the four tree species, F. microcarpa had the strongest warming effect. The trees increased the air temperature in the morning, but the temperature underneath the canopy was lower than that of the weather stations after 12:00, except for F. microcarpa, which was close to that of the weather stations (Figure 2A Above).
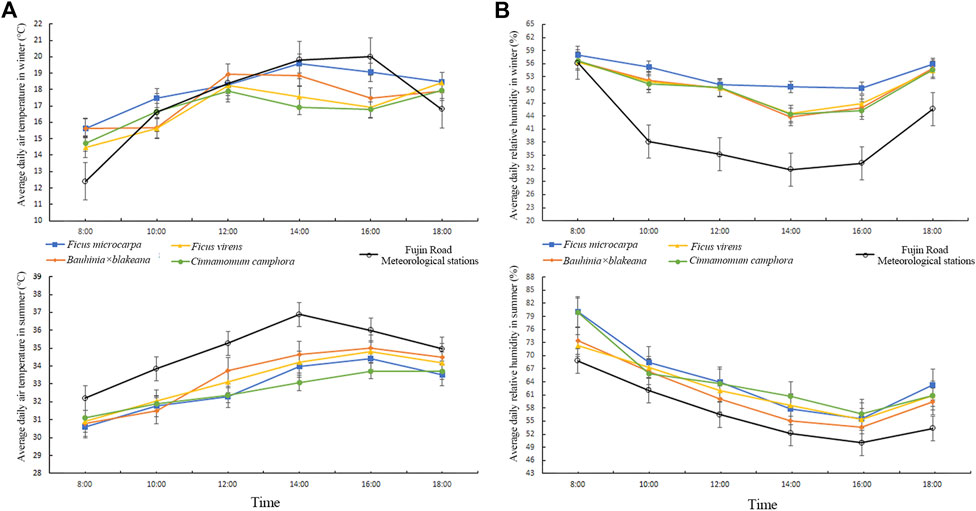
FIGURE 2. Diurnal change of air temperature and relative humidity of the four tree species in winter and summer community weather stations (A) air temperature (B) relative humidity.
The results indicated that during the summer, the four analyzed species demonstrated significant cooling effects during the daytime. However, there were notable variations in the cooling effect among the tree species after 10:00. The minimum temperature was observed underneath the canopy of C. camphora, and the maximum temperature was observed underneath the canopy of Bauhinia x blakeana (Figure 2A Below).
During observation times in January, the diurnal variation of air temperature underneath the canopies also increased gradually, but the warming effect was relatively slow, resulting in lower air temperature after 12:00, and the diurnal variation curve of air temperature underneath the canopies were gentler than that of the weather stations. Similarly, during observation time in August, because the temperatures underneath the canopies rose slowly, the temperatures were significantly lower than that at the weather stations, and the diurnal variation curve was smoother, as shown in Figure 2A.
Taking the data from the weather stations as the control group, we analyzed the differences in temperature of the areas underneath the canopies of the four tree species using a one-way analysis of variance. During the winter, the results of the analysis of variance for the four tree species during three periods were as follows: F = 0.058, p = 0.981 (9:00–11:00); F = 0.005, p = 0.999 (12:00–14:00); F = 0.021, p = 0.996 (16:00–18:00), respectively. The values of the analysis of variance for the four tree species in summer were as follows: F = 5.440, p = 0.005 (9:00–11:00); F = 5.318, p = 0.006 (12:00–14:00); F = 1.993, p = 0.151 (16:00–18:00). As the results showed, in winter, the fitting degree of diurnal air temperature variation underneath the canopies among the four tree species was low. On the contrary, it was high in summer. Furthermore, the difference in the diurnal air temperature variation range was not relatively significant, but the difference in degree was higher in the summer than that in winter.
During the 7-day observation in the winter, the air temperature change range of the areas underneath the canopies of F. microcirpa, F. virens, Bauhinia x blakeana, and C. camphora was 14.86°C–20.26°C, 14.41°C–20.01°C, 14.24°C–21.39°C, and 14.41°C–21.89°C, respectively. The maximum temperature occurred between 12:00–14:00 or 16:00–18:00. The maximum temperature of F. virens occurred at noon (12:00–14:00) and C. camphora in the afternoon (16:00–18:00) (Figure 3A). The diurnal mean temperatures underneath the canopies of F. microcarpa, Bauhinia x blakeana, F. virens, and C. camphora were 17.96°C, 18.17°C, 18.33°C, and 18.20°C, respectively. During the 7-day observation in the summer, the air temperature change range of the areas underneath the canopies of F. macrocirpa, F. virens, Bauhinia x blakeana, and C. camphora was 30.31°C–34.65°C, 30.47°C–36.09°C, 31.02°C–35.50°C, and 31.28°C–34.73°C, respectively (Figure 3B). The diurnal mean temperature underneath the canopies of F. microcarpa, Bauhinia x blakeana, F. virens, and C. camphora were 32.60°C, 33.30°C, 32.96°C and 32.70°C, respectively. F. microcarpa exhibited the strongest cooling effect among the four tree species and the cooling effect of Bauhinia x blakeana was the weakest.
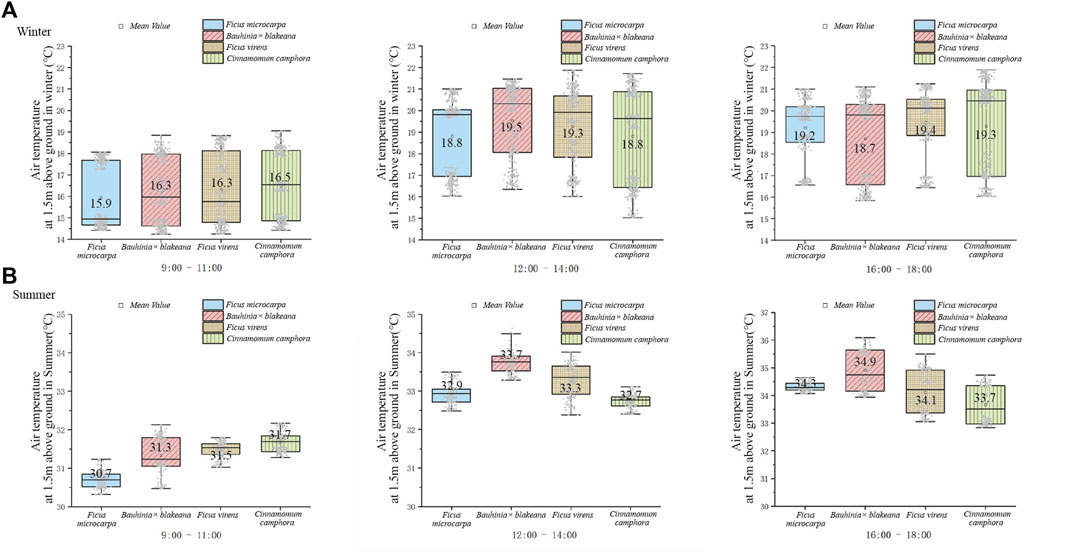
FIGURE 3. Temperatures underneath the canopy of the four tree species in winter (A) and summer (B).
As shown in Figure 2B, the results showed that, compared with the weather stations, the trees had a significant effect on increasing humidity both in winter and summer. The relative humidity underneath the canopies of the four tree species exhibited a slow decrease from morning to noon, but an increase in the afternoon both in the winter and summer. However, there were differences in the humidifying effect of different tree species in different seasons.
In the winter, the relative humidity of the area underneath the canopies was significantly higher than that of the weather stations. The daily mean relative humidity at the weather stations was 40.02%, while the area underneath of F. microcarpa, Bauhinia x blakeana, F. virens, and C. camphora, it was 53.55%, 50.60%, 50.72%, and 50.50%, respectively. Of these, the highest relative humidity was found underneath the canopy of F. microcarpa, which was 13.53% higher than that at the weather stations. The diurnal change curve of relative humidity of these four tree species revealed that the curve of F. microcarpa was the flattest (Figure 2B Above). During the summer, the relative humidity underneath the canopy of all tree species was higher than that at the weather stations (57.12%). Specifically, the relative humidity beneath F. microcarpa, F. virens, Bauhinia x blakeana, and C. camphora was 64.85%, 62.76%, 61.31%, and 64.58%, respectively (Figure 2B Below). The average daily humidity beneath F. microcarpa was the highest among the four trees.
As shown in Figure 4, in general, the relative humidity underneath the canopies in the summer was higher than that in the winter. At noon, the relative humidity was the lowest during the daytime.
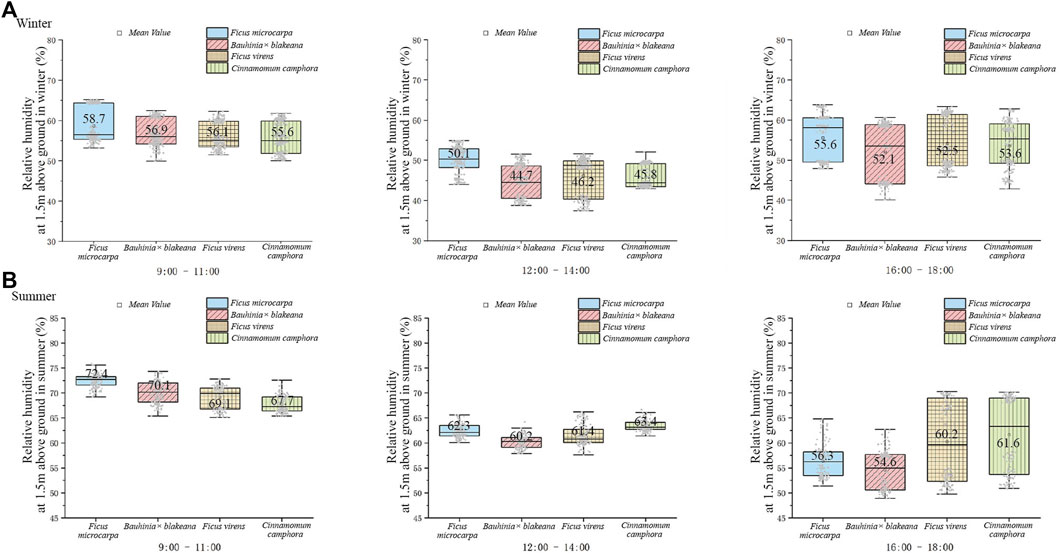
FIGURE 4. Relative humidity underneath the canopy of the four tree species in winter (A) and summer (B).
During the 7 days of observation in the winter, the range of relative humidity change for F. microcarpa, Bauhinia x blakeana, F. virens, and C. camphora was 43.40%–66.92%, 39.55%–62.38%, 39.48%–64.77%, and 43.74%–62.51%, respectively. The differences in change of magnitude were 23.52%, 22.83%, 25.29%, and 18.77%, respectively (Figure 4A). During the 7-day observation in the summer, the range of F. microcarpa, F. virens, Bauhinia x blakeana, and C. camphora was 51.60%–76.02%, 55.36%–72.37%, 56.69%–73.83%, and 53.55%–72.40%, respectively, and the change of magnitude was 24.42%, 17.01%, 17.14%, and 18.85%, respectively (Figure 4B).
A one-way analysis of variance was used to analyze the differences in relative humidity of the four tree species. In the summer, the results of the analysis of variance were as follows: F = 2.469, p = 0.086 (9:00–11:00); F = 16.05, p = 0.000 (12:00–14:00); F = 5.289, p = 0.006 (16:00–18:00). In the winter, the values were as follows: F = 0.133, p = 0.939 (9:00–11:00); F = 0.129, p = 0.942 (12:00–14:00); F = 0.187, p = 0.904 (16:00–18:00). As the results showed, in summer, the fitting degree of diurnal relative humidity variation underneath the canopies among the four tree species was high. Furthermore, the difference in the diurnal relative humidity variation range was not relatively significant.
Guangzhou is a city with typically calm wind, characterized by low wind speeds at the near-ground layer and poor ventilation. Therefore, the wind environment in Guangzhou is dominated by near-ground turbulence (Feng and Wei, 2011). As shown in Figure 5, the wind speed data observed beneath the tree canopies showed that there was no continuous or persistent wind flow, and just instantaneous winds speed were observed. There were differences in the instantaneous wind speed and frequency underneath the canopies of different trees.
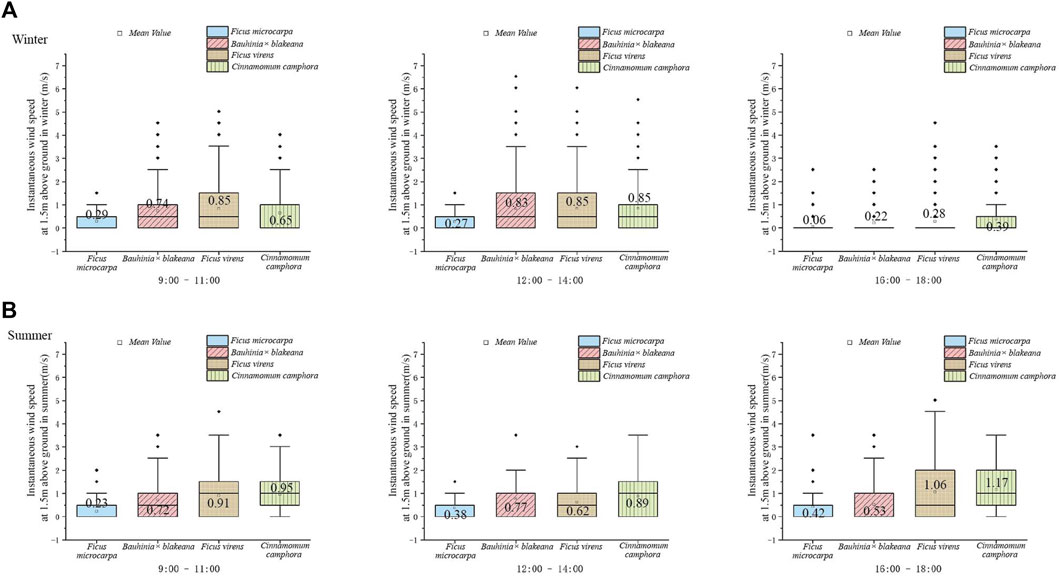
FIGURE 5. Instantaneous wind speed underneath the canopy of the four tree species in winter (A) and summer (B).
During the 7-day observation period in the winter, the daily average instantaneous wind speed of F. microcarpa was 0.21 m/s. A range of change was observed from 0.00 to 0.77 m/s in the daytime. Bauhinia x blakeana, F. virens, and C. camphora were observed to have daily average instantaneous wind speeds of 0.59 m/s, 0.66 m/s, and 0.63 m/s, with a range of wind speed change from 0.01 to 2.34 m/s, 0.02–2.32 m/s, and 0.01–2.69 m/s, respectively. The regulation of daily change showed that the instantaneous wind speed was highest at noon (12:00–14:00), and that it was almost windless in the afternoon (16:00–18:00). The daily average instantaneous wind speed underneath the canopy of F. microcarpa was the lowest and the F. virens was highest (Figure 5A).
During the 7-day observation in the summer, the daily average instantaneous wind speeds of F. microcarpa, Bauhinia x blakeana, F. virens, and C. camphora were observed to be 0.34 m/s, 0.67 m/s, 0.86 m/s, and 1.01 m/s, and the range of wind speed change was 0.19–0.49 m/s, 0.43–1.05 m/s, 0.45–1.51 m/s, and 0.48–1.48 m/s, respectively. The result showed that the daily variation of wind speed was opposite to that in winter. The instantaneous wind speed was highest in the afternoon (16:00–18:00), except for Bauhinia x blakeana. The daily average instantaneous wind speed underneath the canopy of F. microcarpa was the lowest and the C. camphora was the highest (Figure 5B).
Generally, the canopies of trees reduces solar radiation intensity by avoiding direct exposure to sunlight. As shown in Figure 6, the trees greatly reduced solar radiation in winter and summer, especially at noon.
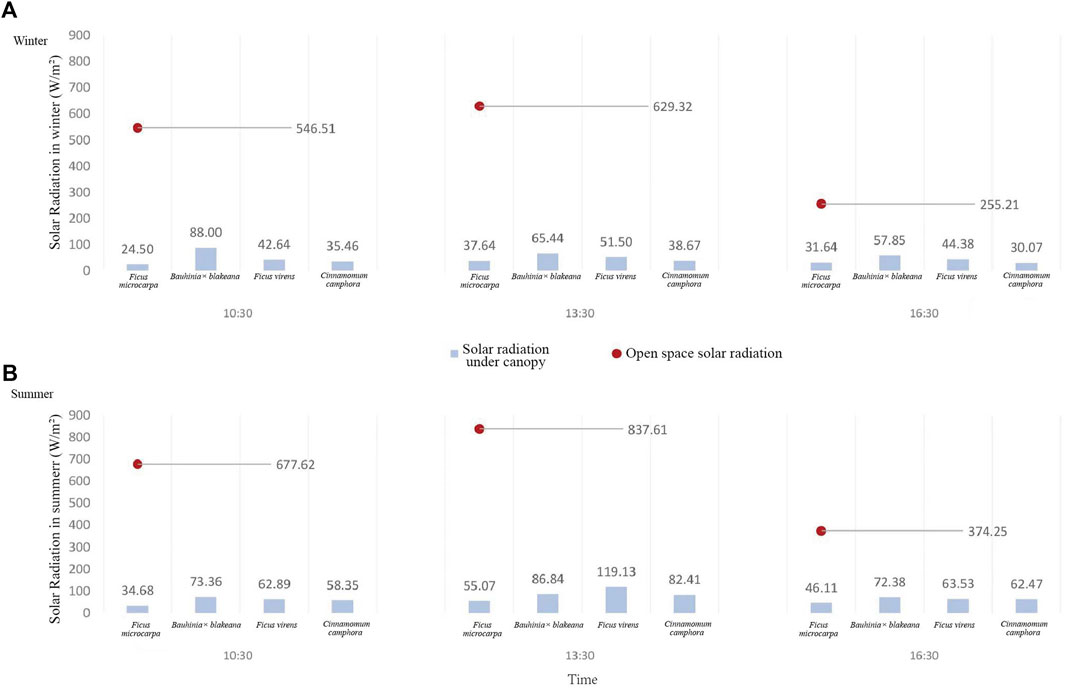
FIGURE 6. Solar radiation underneath the canopy of the four tree species in winter (A) and summer (B).
In the winter, the range of diurnal mean values of solar radiation intensity for the control observation point (open space) was found to be 255.21–629.32 w/m2. However, the solar radiation intensity of the areas underneath the canopies of F. microcarpa, Bauhinia x blakeana, F. virens, and C. camphora was 24.5–37.64 w/m2, 57.85–88.00 w/m2, 42.64–51.5 w/m2, and 30.07–38.67 w/m2, respectively (Figure 6A). In the summer, the solar radiation intensity of the control observation point was 374.25–837.61 w/m2, and for F. microcarpa, Bauhinia x blakeana, F. virens, and C. camphora it was 34.68–55.07 w/m2, 62.47–119.13 w/m2, 72.38–86.84 w/m2, and 58.35–82.41 w/m2, respectively (Figure 6B).
The result showed F. microcarpa had the strongest impact on reducing solar radiation intensity. In the winter, the area underneath the canopy of Bauhinia x blakeana had the highest solar radiation intensity. During all the observation periods in winter and summer, it was found that the solar radiation intensity underneath the canopy of F. microcarpa had the smallest fluctuations, with a range of fluctuation of about 30.56 w/m2; F. virens had the most significant fluctuation of solar radiation, with fluctuations of about 60.49 w/m2.
This study used the Li-6400 Portable Photosynthesis System instrument to measure five physiological parameters of plants, including Gs, Tleaf, RHsfc, PAR, and Vpdl. The observation periods were 9:00–11:00, 12:00–14:00, and 16:00–18:00, and were recorded at 5-min intervals. The Pearson correlation coefficient method was adopted to calculate the correlation between the physiological parameters and the data from observational records of microclimate in the same periods.
The results of the analysis, as shown in Table 5, revealed the air temperature underneath the canopies of the four tree species was extremely significantly correlated (p < 0.01) with the Tleaf and RHsfc. The instantaneous wind speed was extremely significantly correlated (p < 0.01) with the Tleaf of F. microcarpa and the RHsfc of Bauhinia x blakeana, respectively. The relative humidity correlated significantly (p < 0.05) with RHsfc and Vpdl of C. camphora but was not found to be significantly correlated with the physiological parameters of other trees. The solar radiation intensity was extremely significantly correlated (p < 0.01) with the PAR of C. camphora and Vpdl of F. virens, and significantly correlated (p < 0.05) with the PAR of F. microcarpa and Bauhinia x blakeana.
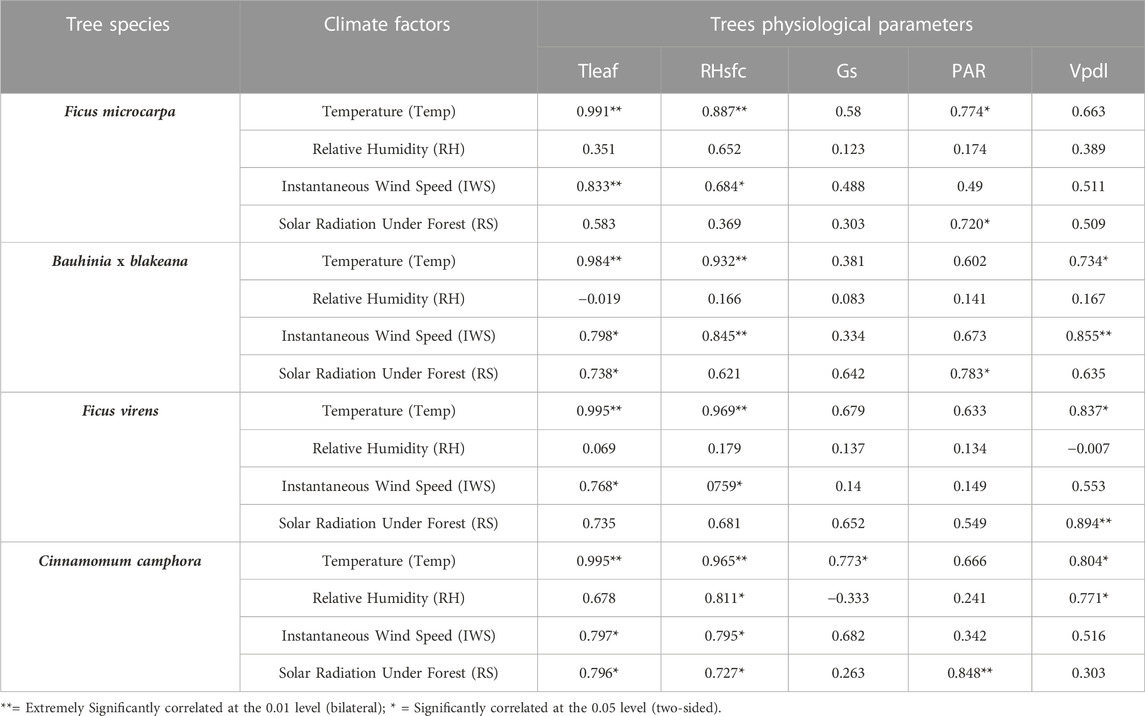
TABLE 5. Correlation of physiological parameters of trees with microclimatic factors.
For F. microcarpa, as a native plant of Canton, there was an extremely significant correlation (p < 0.01) between Tleaf, RHsfc, and air temperature, and also Tleaf and instantaneous wind speed. There was a significant correlation (p < 0.05) between PAR with air temperature, RHsfc with instantaneous wind speed, and PAR with solar radiation. The relative humidity was not found to be correlated with any physiological parameters. However, there was no correlation found between Gs, Vpdl, and the microclimate data. The Tleaf and RHsf of F. microcarpa were the major parameters related to the microclimate environment, and mainly affected temperature and instantaneous wind speed.
For Bauhinia x blakeana, there was an extremely significant correlation (p < 0.01) between the Tleaf, RHsfc, and air temperature, and also RHsfc, Vpdl, and instantaneous wind speed. There were significant correlations (p < 0.05) between Vpdl and air temperature, Tleaf and instantaneous wind speed, and Tleaf, PAR, and solar radiation. The change of Vpdl led to significant changes in air temperature and instantaneous wind speed. A possible explanation for this may be that Bauhinia x blakeana affected the microclimate by impacting its transpiration rate. The temperature and instantaneous wind speed of the area underneath the canopy had correlations with Tleaf, RHsfc, and Vpdl. The relative humidity was not found to be correlated with any physiological parameters.
For F. virens, there was an extremely significant correlation (p < 0.01) between Tleaf, RHsfc, and air temperature, and also Vpdl and solar radiation. Ficus virens had a significant correlation (p < 0.05) between Vpdl and air temperature, and Tleaf, RHsfc, and instantaneous wind speed. The air temperature and instantaneous wind speed of the area underneath the canopy had a correlation with the physiological parameters of Tleaf, RHsfc, and Vpdl. Vpdl was correlated with solar radiation and air temperature simultaneously. The relative humidity was not found to be correlated with any physiological parameters.
For C. camphora, the five physiological parameters all had a correlation with the four factors of microclimate. There was an extremely significant correlation (p < 0.01) between Tleaf, RHsfc, and air temperature, and PAR and solar radiation. The air temperature had a significant correlation (p < 0.05) with Gs and Vpdl. The instantaneous wind speed and solar radiation had significant correlation (p < 0.05) with Tleaf and RHsfc. The relative humidity had a significant correlation (p < 0.05) with RHsfc and Vpdl. However, except C. camphora, relative humidity showed no correlation with the physiological parameters of other tree species.
According to the Pearson correlation analysis, the correlation between the physiological parameters and the factors of microclimate was significant. The physiological parameters of the four tree species had different degrees of correlation with factors of microclimate. Overall, the results of this analysis showed that the physiological parameters of native plants (F. microcarpa, F. virens, Bauhinia x blakeana) had significant influences on air temperature, instantaneous speed, and solar radiation, but had no significant influence on relative humidity.
In order to statistically analyze the intrinsic correlation and valuable relationships between the five physiological parameters and four factors of microclimate, we established equations between them using multiple regression analysis and further explored the internal mechanisms between the trees and the microclimate. However, there were no mathematical characteristics of convergence of some data between the parameters and the microclimate factors, so it was impossible to establish multiple regression equations. Finally, equations were successfully established between the following microclimate factors and physiological parameters: 1) the physiological parameters of F. microcarpa and air temperature (Temp), instantaneous wind speed (IWS), and the solar radiation (SR); 2) the physiological parameters of Bauhinia x blakeana and Temp and SR; 3) the physiological parameters of F. virens and Temp, IWS, and SR; 4) the physiological parameters of C. camphora and Temp, relative humidity (RH), and SR. We established the equation to calculate the contribution of the physiological parameters of the four tree species to the microclimate factors.
As shown in Table 6, with regard to Temp, an analysis of the contributions of the physiological parameters revealed that the Tleaf of F. microcarpa had the highest contribution (75.10%), followed by the Tleaf of F. virens, which had a contribution of 62%. The Tleaf of C. camphora had the lowest contribution to temperature, at 31.4%.
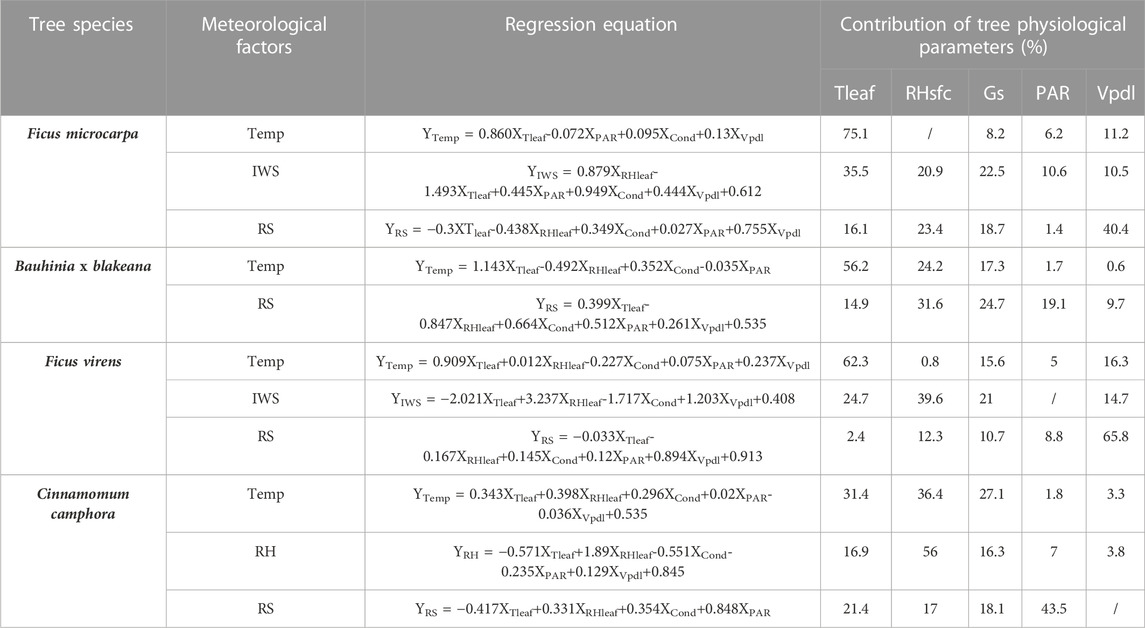
TABLE 6. Regression equation and contribution of physiological parameters of trees.
In terms of IWS, the IWS underneath the canopy of F. microcarpa was found to be affected by various physiological parameters, with Tleaf, Gs, RHsfc, PAR, and Vpdl contributing 35.5%, 22.5%, 20.9%, 10.6%, and 10.5%, respectively. In the case of F. virens, Tleaf, RHsfc, PAR, and Vpdl were identified as the main parameters influencing wind speed, with contributions of 24.7%, 39.6%, 21%, and 14.7%, respectively. Notably, RHsfc had the highest contribution rate. In contrast, the physiological parameters of Bauhinia x blakeana and C. camphora were found to have no statistical correlation with IWS.
The various physiological parameters performed varying levels of contribution to the reduction of solar radiation intensity underneath the canopies. Ficus microcarpa showed a contribution rate of 16.1% for Tleaf, 23.4% for RHsfc, 18.7% for Gs, 1.4% for PAR, and 40.4% for Vpdl, with the highest contribution coming from Vpdl. On the other hand, Bauhinia x blakeana had a contribution of 14.9% for Tleaf, 31.6% for RHsfc, 24.7% for Gs, 19.1% for PAR, and 9.7% for Vpdl, with the highest contribution coming from RHsfc. Similarly, F. virens had a contribution of 2.4% for Tleaf, 12.3% for RHsfc, 10.7% for Gs, 8.8% for PAR, and 65.8% for Vpdl, with the highest contribution coming from Vpdl. Lastly, C. camphora had a contribution of 24.1% for Tleaf, 17.0% for RHsfc, 18.1% for Gs, and 43.5% for PAR, with the highest contribution coming from PAR.
According to the data, there appeared to be no correlation between relative humidity and the physiological parameters of the tree species with the exception of C. camphora. However, as a foreign species, C. camphora had a contribution rate to relative humidity of 16.9%, 56.0%, 16.3%, 7.0%, and 3.8% for Tleaf, RHsfc, Gs, PAR, and Vpdl, respectively. The results suggested that RHsfc had the most significant contribution (56%) to relative humidity.
Previous studies have demonstrated the cooling and humidifying effects of urban trees. Generally, there are notable differences in terms of affecting the local microclimate between trees and shrubs, with trees being superior, particularly in their cooling and humidifying effects (Lu et al., 2006). Trees are able to enhance the local microclimate, including reducing extreme wind speeds and temperatures (Baker et al., 2021). A previous study found that the amplitude of air temperature, surface temperature, humidity, and heat stress indexes were minimized in woodlands (Fang et al., 2018). Additionally, in the forest, the cooling effect is consistent across forests of different tree species (Liu et al., 2014). In comparison to earlier studies, our observation experiment confirmed that these four tree species could increase the extremely low temperatures of winter mornings and decrease the extremely high temperatures in summer; furthermore, they could increase the humidity of the area underneath the tree canopy and significantly reduce solar radiation intensity.
Previous research has rarely involved the study of wind conditions under different trees. This study revealed that the characteristics of wind speed in the area underneath the canopy were mainly in the form of instantaneous wind. According to the instantaneous wind speeds observed, F. microcarpa was found to be the lowest both in winter and summer, with values of 0.21 m/s and 0.34 m/s, respectively. In comparison, the instantaneous wind speed of the areas underneath the canopies of F. virens and C. camphora were found to be higher, with values of 0.86 m/s and 101 m/s in summer and 0.66 m/s and 0.63 m/s in winter, respectively. A previous study may explain the findings of our study: Ding et al. (2022) found that a higher crown base height of C. camphora was associated with stronger wind speed and frequency underneath the canopy. The difference in wind speed was related to the average crown base height of the trees. This was further supported by a study conducted in Fuzhou that investigated that C. camphora had a strong effect on increasing wind speed by using ENVI-met (Huang et al., 2022). Specifically, in our experiment, the crown base heights of F. microcarpa and C. camphora were 4.4 m and 7.2m, respectively.
The effects of urban trees have differences in different seasons. According to Shao et al. (2015), the canopies of trees could have a significant impact on humidifying effects, with greater effects observed during the summer and autumn seasons in comparison to spring and winter. A recent study conducted by Meili et al. (2021), there are seasonal differences in four cities (Phoenix, Singapore, Melbourne and Zurich). The results of our study indicated that the microclimate regulation ability of trees has seasonal differences in winter and summer.
There are different effects produced by different types of trees on the microclimate. A previous study indicated the varying effects of three tree species on microclimate by examining the changing of sap flow, with the cooling effect order being Populus simonii > Cedrus deodara > C. camphora. This was attributed to the differences in the volume of the canopy transpiration cooling effect (Wang et al., 2018). Another study found that different trees (Sabina chinensis, Platycladus orientalis, and Populus) had different effects in mitigating temperatures and enhancing humidity (Li et al., 2018). Our study found that the minimum temperature underneath the canopy of F. microcarpa was in the summer, which was also supported by a study in Shenzhen. In continuous observations of various tree species in Shenzhen, F. microcarpa shows the strongest potential for transpiration and cooling effect compared to other trees (Ding et al., 2022). Furthermore, F. microcarpa had the most effect on increasing humidity among the four tree species. It is speculated that the ability of different trees may also be related to the closure canopy. The closure canopy of F. microcarpa was 91.92%, and it was 90.42% for F. virens, both greater than 90%. Conversely, Bauhinia x blakeana had the lowest closure canopy both in winter (49.00%) and summer (70.92%), resulting in the fastest heat dissipation and the slowest cooling effect. This is supported by another study conducted in Shenzhen, which found that the effect of green space in mitigating temperature mainly occurred via the sheltering effects of canopies (Li et al., 2011).
The ability of trees to influence the microclimate environment must be adapted to the varying climatic conditions in different regions. In severe cold regions, planting shrubs in the gaps between trees can enhance the wind protection effect. The complex vegetation structure has a positive impact on increasing human thermal comfort by reducing wind speed. Therefore, complex plant structures are beneficial in severe cold regions (Jin et al., 2018). In arid areas, it is important to select the appropriate plant species. For example, planting Caragana intermedia and Artemisia ordosica on the dunes has been shown to significantly reduce the wind speed, soil temperature, and air temperature, and increase the relative humidity and water content of soil (Zhu et al., 2014). In semi-arid areas, due to arid and windy climate characteristics, deciduous trees are often selected for planting (Wang et al., 2020).
However, in hot and humid areas, decreasing the high temperatures in summer, improving windless conditions, and reducing solar radiation can create a comfortable microclimate environment. In this research, F. microcarpa was the best species for improving air temperature and increasing the relative humidity in the winter. Additionally, in terms of improving wind speed, the diurnal mean wind speed under F. virens and C. camphora was found to be relatively higher both in the winter and summer.
Urban trees play a crucial role in shaping the local microclimate of the areas underneath their canopy through various physiological processes, such as photosynthesis and evapotranspiration. These processes affect the circulation of thermal energy and water, thereby impacting the local microclimate environment. Such effects are not only ecologically significant but also provide valuable insights into the effects of different tree physiological characteristics on changing climate environments. For instance, the results of our research can serve as a valuable reference for selecting appropriate tree species in urban planning efforts.
Recent studies have examined the correlations between the characteristics of urban trees and the local microclimate underneath the canopy. A major focus of this field has been the morphological characteristics of trees, such as height, crown width, and vertical structure, and their impact on the local microclimate (Wang et al., 2020). Researchers have utilized software such as ENVI-met to investigate the effects of crown structure and layout on temperature and humidity (Wei et al., 2019). Previous research conducted in Beijing Olympic Park has shown that the canopy structural characteristics (leaf area index and canopy coverage) of certain plants play a significant role in regulating microclimate factors (Yan et al., 2012).
Research on the influence of the physiological parameters of trees on the microclimate underneath the canopy is relatively scarce. However, previous research has revealed that physiological parameters have an extremely significant correlation with microclimate parameters (Shao et al., 2015). Data from one study suggested that Temp, Tleaf, and RH had a significant effect on the respiration of five tree species (Acer buergeranum, Platanus acerifolia, Ligustrum lucidum, C. camphora, and Magnolia grandiflcm). Of these parameters, Tleaf was found to have the most significant positive influence (Gao et al., 2006). Our research also confirmed this, showing that Tleaf had an extremely significant correlation with temperature, instantaneous wind speed, and solar radiation in the microclimate underneath the canopy. Furthermore, we found that RHsfc and Vpdl were extremely significantly correlated with temperature, instantaneous wind speed, and solar radiation. These results indicated that Tleaf, RHsfc, and Vpdl were the main parameters that impacted the microclimate of the area underneath the canopy.
However, except for C. camphora, the physiological parameters of the other three species did not show any correlation with relative humidity. As a result, through statistical and mathematical analysis, only the physiological parameters (Tleaf, RHsfc, Gs, PAR, and Vpdl) of C. camphora established regression equations with relative humidity. This finding was consistent with that of Xia et al. (2021), who investigated the possibility that C. camphora could improve air humidity and found that C. camphora was sensitive to changes in water conditions.
Wang et al. (2018) investigated the effect of green spaces on mitigating temperatures through evapotranspiration during the night and providing shade during the daytime. The results showed that the contribution (60%–75%) to reducing temperatures during the daytime by providing canopy shade was significantly greater than the contribution (25%–40%) made by evapotranspiration. Furthermore, our research confirmed this finding by analyzing physiological parameters. Through the analysis of multiple regression equations, we found that the Tleaf of F. microcarpa and C. camphora contributed to mitigating temperatured by 75.10% and 62.3%, respectively. In the statistical analysis of Gs and Vpdl, both of which represent evapotranspiration, F. microcarpa (8.2% and 11.2%) and F. virens (15.6% and 16.3%) contributed to the cooling effect. We also presumed that temperature was correlated with the closure canopy, which represented the parameter of shade. The canopy closure of F. microcarpa and F. virens was over 90%. This presumption could be confirmed by a study in Shandong indicating that the degree of canopy closure of trees (S. chinensis, P. orientalis, and Populus) could significantly affect the microclimate underneath canopy (Li et al., 2018).
The southern subtropical city of Guangzhou is known for its hot and humid climate, and characterized by the presence of evergreen trees. Our study aimed to investigate the following questions: How does the microclimate (Temp, RH, IWS, SR) vary underneath the canopy of different tree species in this area? What is the correlation between the physiological parameters of four tree species and the microclimate underneath their canopy, and what mechanisms are involved? To address these questions, we focused on the four trees species that are commonly found in hot and humid areas of Guangzhou and commonly used: F. microcarpa, F. virens, Bauhinia x blakeana, and C. camphora. To represent the typical climate characteristics of these areas, observations were conducted in January and August. Data were collected using a HOBE (H21-0024, onset), Li-6400 portable photosynthesis system, and LPPYRA06 spectrally flat class C (second class) albedometer. Pearson correlation coefficient was used to analyze the correlation between physiological and microclimate factors of the four tree species. Furthermore, through mathematical and statistical analysis, the effects of internal mechanisms between the four microclimate factors and five physiological parameters were investigated, and multiple regression equations were established to indicate the correlation between them.
The four tree species studied showed significant cooling effects during the daytime in the summer. In winter, the Temp of the area underneath the canopy of the four tree species was found to be higher than that of the weather stations during 8:00–9:00. The Temp under F. microcarpa was found to be warmer than the weather stations before 12:00.
Relative humidity underneath the canopies of the four tree species was significantly higher than that of the weather stations in winter. In contrast, in summer, while the RH was still higher than that of the weather stations, the difference between the two was found to be smaller than that in winter. Furthermore, the humidifying effect of F. microcarpa was found to be the greatest in comparison to the other three species studied.
Regarding instantaneous wind speed underneath the canopy, F. virens had the highest in winter and C. camphora the highest in summer. Our study found that the instantaneous wind speed of the four tree species slowed down to almost no wind in the cold winter afternoons, which reduced the cooling effect in winter; however, it increased in the summer afternoons, which improved the windless conditions and heat, making it more favorable for human habitation in hot summers. The impact of the trees could improve instantaneous wind speed in summer while decreasing the cold winds in winter, thereby maintaining a comfortable local microclimate in the area underneath the canopy.
The study found that in both winter and summer, the presence of trees significantly reduced solar radiation, particularly at noon.
The results of the Pearson correlation coefficient analysis revealed that there was an extremely significant positive correlation between the air temperature underneath the canopy and the Tleaf of the four tree species, and a significant correlation between the instantaneous wind speed and the RHsfc of the four tree species. However, no correlation was found between the physiological parameters of the tree species with the exception of C. camphora and RH.
The results of the multiple regression analysis revealed that certain microclimate factors could establish correlation equations with physiological parameters, while others could not. The Tleaf of F. microcarpa had the highest contribution (75.10%) to the Temp, while C. camphora had the smallest contribution (31.4%). Ficus microcarpa and F. virens improved the wind speed via the combined impacts of Tleaf, RHsfc, Gs, PAR, and Vpdl. The RHsfc of C. camphora had a significant contribution (56%) to the relative humidity. Regarding reducing the solar radiation intensity, the Vpdl of F. microcarpa and F. virens, RHsfc of Bauhinia x blakeana, and PAR of C. camphora had higher contributions, comparatively.
The original contributions presented in the study are included in the article/supplementary material, further inquiries can be directed to the corresponding author.
XF and HW contributed to conception and experimental design of the study. HW observate the data. HW and XF contributed to the statistical analysis. XF wrote the first draft of the manuscript. XF, HW, and MH wrote sections of the manuscript and edited the Enlish version. All authors contributed to manuscript revision, read, and approved the submitted version.
This study was supported by National Natural Science Foundation of China (NSFC) (No. 51978276), The interactive influence mechanism of urban green space, local wind climate, and residents' health based on the multi-spatial scale in Guangdong-Hong Kong-Macao Greater Bay Area.
We thank the Guangzhou Institute of Forestry and Landscape architecture for support of the observation instrument (Li-6400). This work would not have been possible without the tireless efforts of Zixuan Lian, Weisi Wang, and Biyuan Zhang, who helped with the data observation.
The authors declare that the research was conducted in the absence of any commercial or financial relationships that could be construed as a potential conflict of interest.
All claims expressed in this article are solely those of the authors and do not necessarily represent those of their affiliated organizations, or those of the publisher, the editors and the reviewers. Any product that may be evaluated in this article, or claim that may be made by its manufacturer, is not guaranteed or endorsed by the publisher.
Abdulkarim, K. H., Abd Ghafar, A., Lai, L. Y., and Said, I. (2021). Effects of vegetation covers for outdoor thermalimprovement: A Case Study at Abubakar Tafawa Balewa University, Bauchi, Nigeria. JST 29 (3), 2125–2147. doi:10.47836/pjst.29.3.43
Baker, T. P., Marais, Z. E., Davidson, N. J., Worledge, D., and Mendham, D. S. (2021). The role of open woodland in mitigating microclimatic extremes in agricultural landscapes. Ecol. Manag. Restor. 22, 118–126. doi:10.1111/emr.12466
Bao, C. S., Lou, J. H., Zhen, X. Y., and Xiang, Z. S. (2001). Effect of landscaping and greening on microclimate in Hangzhou city. J. Zhejiang Univ. (Agric. Life Sci.) 27 (4), 63–66.
Cheng, X., Peng, J., Dong, J., Liu, Y., and Wang, Y. (2022). Non-linear effects of meteorological variables on cooling efficiency of African urban trees. Environ. Int. 169, 107489. doi:10.1016/j.envint.2022.107489
Ding, J. J., Qin, L. J., Tan, S. L., Yu, X. H., Zhou, Z. D., Qiu, G. Y., et al. (2022). Study on characteristics of transpiration, cooling effect and carbon reduction effect of Ficus concinna, a native tree species in subtropical cities. Acta Sci. Nat. Univ. Pekin. 58, 537–545. doi:10.13209/j.0479-8023.2022.040
Dong, J. W., Bai, S. H., Ma, F. Y., and Li, N. N. (2017). Comparative microclimate analysis of 3 types of plantation forests in Shandong Taishan. Shandong For. Sci. Technol. 47, 56–59+62.
Fang, X., Sang, K. X., Huang, C., Fan, B. B., Yang, G. G., and Gou, E. H. (2018). Study on microclimatic effects of different vegetation types in yellow river wetland in zhengzhou. Acta Agric. Jiangxi 30, 81–85. doi:10.19386/j.cnki.jxnyxb.2018.09.18
Feng, X. H., and Chu, Y. Y. (2017). The study of urban green space and local micro-climate effect based on air dynamics simulation. Chin. Landsc. Archit. 33, 29–34.
Feng, X. H., and Wei, Q. Q. (2011). Study on the near-surface flow field in urban areas of Guangzhou. Ecol. Environ. Sci. 20, 1558–1561. doi:10.16258/j.cnki.1674-5906.2011.10.011
Gao, J., Peng, Z. H., and Yu, Y. S. (2006). Transpiration rates and effects for energy absorbed and water given off through transpiration of main afforestation tree species in Hefei city. J. Anhui Agric. Univ. 33 (4), 445–449. doi:10.13610/j.cnki.1672-352x.2006.04.001
Guo, W., Shen Tu, Y. J., Deng, W., and Pan, Z. J. (2008). Research advances on the effect of the urban green areas to microclimate. Ecol. Environ. Sci. 17, 2520–2524. doi:10.16258/j.cnki.1674-5906.2008.06.052
Huang, Y. L., Fu, W. C., Chen, J. R., Dong, J. W., and Wang, M. H. (2022). Study on the influence of plant community characteristics on the summer microclimate of the tree-shaded space in parks. Chin. Landsc. Archit. 38, 118–123. doi:10.19775/j.cla.2022.03.0118
Jin, H., Lv, H. Y., and Lin, Y. J. (2018). Influence of vegetation structures on winter and summer microclimates of urban residential areas in severe cold regions. Landsc. Archit. 25, 12–15. doi:10.14085/j.fjyl.2018.10.0012.04
Jung, M. C., Dyson, K., and Alberti, M. (2021). Urban landscape heterogeneity influences the relationship between tree canopy and land surface temperature. Urban For. Urban Green. 57, 126930. doi:10.1016/j.ufug.2020.126930
Li, Y. H., Wang, J. J., Chen, X., Sun, J. L., and Zeng, H. (2011). Effects of green space vegetation canopy pattern on the microclimate in residential quarters of Shenzhen City. Chin. J. Appl. Ecol. 22, 343–349. doi:10.13287/j.1001-9332.2011.0055
Li, K., Li, C. R., Xu, J. W., Guo, H. L., Chen, Y., Han, B., et al. (2018). Effect of three typical road landscape forests on microclimate under summer weather in zhucheng city. Ecol. Environ. Sci. 27, 1060–1066. doi:10.16258/j.cnki.1674-5906.2018.06.009
Liu, X. D., Zhou, G. Y., Chen, X. Z., Zhang, D. Q., and Zhang, Q. M. (2014). Forest microclimate change along with the succession and response to climate change in south subtropical region. Acta Ecol. Sin. 34, 2755–2764. doi:10.5846/stxb201307231934
Liu, Z. X., Zhen, S. L., Fang, X. S., Lu, X. H., and Zhao, L. H. (2018). Simulating validation of ENVI-met vegetation model to Ficus microcarpa in hot-humid region of subtropical zone. J. Beijing For. Univ. 40, 1–12. doi:10.13332/j.1000-1522.20170396
Lu, G. Q., Xie, Y. B., Gu, J. C., Zhang, S. C., and Bai, S. J. (2006). The analysis of reducing temperature and increasing humidity of familiar afforestation tree species in Dalian city. J. Agric. Univ. Hebei 29 (2), 65–67.
Matyshak, G. V., Goncharova, O. Yu., Bogatyrev, L. G., and Riazantseva, M. I. (2021). Influence of plant cover on hydrothermal conditions in soils of large lysimeters of the MSU soil station: Results of a 60-year experiment. Mosc. Univ. Soil Sci. Bull. 76, 134–139. doi:10.3103/S0147687421030078
Matzarakis, A., Rutz, F., and Mayer, H. (2007). Modelling radiation fluxes in simple and complex environments—Application of the RayMan model. Int. J. Biometeorol. 51, 323–334. doi:10.1007/s00484-006-0061-8
Matzarakis, A., Rutz, F., and Mayer, H. (2010). Modelling radiation fluxes in simple and complex environments: basics of the RayMan model. Int. J. Biometeorol. 54, 131–139. doi:10.1007/s00484-009-0261-0
Meili, N., Manoli, G., Burlando, P., Carmeliet, J., Chow, W. T. L., Coutts, A. M., et al. (2021). Tree effects on urban microclimate: Diurnal, seasonal, and climatic temperature differences explained by separating radiation, evapotranspiration, and roughness effects. Urban For. Urban Green. 58, 126970. doi:10.1016/j.ufug.2020.126970
Schwaab, J., Meier, R., Mussetti, G., Seneviratne, S., Bürgi, C., and Davin, E. L. (2021). The role of urban trees in reducing land surface temperatures in European cities. Nat. Commun. 12 (1), 6763. doi:10.1038/s41467-021-26768-w
Shao, Y. C., Zhuang, J. Y., Li, E. H., and Li, J. J. (2015). Regulating effects of urban forest canopy on microclimate. Chin. J. Ecol. 34, 1532–1539. doi:10.13292/j.1000-4890.2015.0133
Wang, X. J., Kong, F. H., Ying, H. W., Xu, H. L., Li, J. S., and Pu, Y. X. (2018). Characteristics of vegetation shading and transpiration cooling effects during hot summer. Acta Ecol. Sin. 38, 4234–4244. doi:10.5846/stxb201712032173
Wang, A. X., Ren, G. C., and Qin, Y. N. (2020). Research on influence of tree shape of city squares on microclimate in semiarid areas. Landsc. Archit. 27, 100–107. doi:10.14085/j.fjyl.2020.07.0100.08
Wei, X., Zhou, R. M., Zhang, M. J., Shen, H. T., Qiu, Y., and Geng, H. K. (2019). Microclimate changes with simulated canopy spatial structures. J. Zhejiang A&F Univ. 36, 783–792. doi:10.11833/j.issn.2095-0756.2019.04.019
Wu, C. G., Fang, Y. P., Lin, Y. Y., Ma, X. Y., Wang, Y. W., and Wang, K. H. (2016). Analysis of the effect of street greenbelt on microclimate in a hot-humid area of China using a numerical simulation method. J. Meteorol. Environ. 32, 99–106.
Xia, F. M., Ji, K. S., and Yang, Y. D. (2013). The influence of different plant disposition models on temperature and humidity in the microclimate of green spaces. J. For. Eng. 27, 75–78. doi:10.3969/j.issn.1000-8101.2013.05.020
Xia, Y. H., Zhang, X. P., Dai, J. J., Wang, R., and Luo, Z. D. (2021). Time-lag effects between meteorological factors and transpiration of Cinnamomum camphora in the subtropical monsoon region. J. Soil Water Conserv. 35, 194–203. doi:10.13870/j.cnki.stbcxb.2021.05.027
Yan, H., Wang, X., and Dong, L. (2012). Microclimatic characteristics and human comfort conditions of tree communities in northern China during summer. J. Beijing For. Univ. 34, 57–63. doi:10.13332/j.1000-1522.2012.05.021
Yang, Q., Huang, X., Tong, X., Xiao, C., Yang, J., Liu, Y., et al. (2022). Global assessment of urban trees’ cooling efficiency based on satellite observations. Environ. Res. Lett. 17, 034029. doi:10.1088/1748-9326/ac4c1c
Zhu, C. Y., Li, S. H., and Ji, P. (2011). Relationships between urban green belt structure and temperature-humidity effect. Chin. J. Appl. Ecol. 22, 1255–1260. doi:10.13287/j.1001-9332.2011.0172
Keywords: urban tree, microclimate, hot and humid area, Ficus microcarpa, Cinnamomum camphora, Ficus virens, Bauhinia x blakeana
Citation: Feng X, Wen H, He M and Xiao Y (2023) Microclimate effects and influential mechanisms of four urban tree species underneath the canopy in hot and humid areas. Front. Environ. Sci. 11:1108002. doi: 10.3389/fenvs.2023.1108002
Received: 25 November 2022; Accepted: 27 January 2023;
Published: 16 February 2023.
Edited by:
Shaoquan Liu, Institute of Mountain Hazards and Environment, CAS, ChinaReviewed by:
Britt Kniesel, Technical University Dresden, GermanyCopyright © 2023 Feng, Wen, He and Xiao. This is an open-access article distributed under the terms of the Creative Commons Attribution License (CC BY). The use, distribution or reproduction in other forums is permitted, provided the original author(s) and the copyright owner(s) are credited and that the original publication in this journal is cited, in accordance with accepted academic practice. No use, distribution or reproduction is permitted which does not comply with these terms.
*Correspondence: Xianhui Feng, eGhmZW5nQHNjdXQuZWR1LmNu
Disclaimer: All claims expressed in this article are solely those of the authors and do not necessarily represent those of their affiliated organizations, or those of the publisher, the editors and the reviewers. Any product that may be evaluated in this article or claim that may be made by its manufacturer is not guaranteed or endorsed by the publisher.
Research integrity at Frontiers
Learn more about the work of our research integrity team to safeguard the quality of each article we publish.