 Fei Fu1
 Xia Jia
 Han Fang
 Lu Aye
94% of researchers rate our articles as excellent or good
Learn more about the work of our research integrity team to safeguard the quality of each article we publish.
Find out more
ORIGINAL RESEARCH article
Front. Environ. Sci. , 12 January 2023
Sec. Environmental Economics and Management
Volume 11 - 2023 | https://doi.org/10.3389/fenvs.2023.1106019
This article is part of the Research Topic The Physical Environment and Health: Implications for the Planning and Management of Healthy Cities View all 68 articles
Metro stations are considered high-quality resources for promoting urban development, which have great influences on the surrounding land use changes. The simulation and prediction of land use change can provide a scientific basis for urban land planning. In this work, the cellular automata (CA)-Markov model was adopted by taking into account point of interest (POI) kernel density and station accessibility as driving factors to predict the land use change of station surrounding areas. Then, the land type compositions of different years, temporal and spatial evolution of landscape patterns, and strategies of different metro stations were explored. The results show that the Kappa coefficients of the Zoo Station and the Lu Xiao Station are 87% and 79%, respectively, indicating that the improved CA-Markov model can predict land use changes more accurately by considering POI kernel density and station accessibility. Finally, different optimized strategies based on systematic predictions of land use landscape patterns according to the spatial and temporal distribution of metro stations were proposed. The work provides important references for predicting the impact of new metro stations on land use in the future and guides the adjustment and optimization of land use policy planning.
The rapid urbanization process has improved people’s quality of life. However, it also brings about the contradiction between urban space, land development and transportation, accelerating the conversion between different land use types, resulting in the loss of farmland, woodland, ecosystem destruction, and other issues. In this case, land-use and land-cover change (LUCC) have become a research hotspot (Munsi et al., 2010; Wei et al., 2021). The transport network constitutes the spatial skeleton of urban development. The transformation and upgrading of urban transportation means and modes have a profound impact on the change of urban land use and the development of spatial structure (Yu, 2017).
As a high-quality resource to promote urban development, the efficient use of the land around metro stations becomes an important research topic (Suo and Zhang, 2015; Yang et al., 2022a; Yang et al., 2023a; Yang et al., 2023b), and the distribution characteristics of urban functional space can direct reflect land use (Wang et al., 2012). Land use change also leads to the change in regional landscape patterns. Landscape pattern is a core content in the field of landscape ecology, and its landscape patch types are usually expressed as land use types (Chu et al., 2018). By taking the research method of landscape ecology for reference, the landscape pattern index is used to analyze the urban landscape characteristics of the surrounding areas of the metro station to understand the impact characteristics of the metro station on its nearby areas (Cheng and Chen, 2019). Therefore, land use landscape patterns around metro stations have recently attracted much attention from academia alike.
Against this backdrop, this study takes two metro stations in Chengdu (China) as the study area and scrutinizes the relationship between the land use landscape patterns and the metro stations. This work aims to optimize the CA-Markov model by considering POI kernel density and station accessibility as driving factors, which are more applicable for small scales land use change predictions. Based on the GIS analysis platform, the CA-Markov model is used to empirically analyze the urban functional structure characteristics of Chengdu metro stations, which provides suggestions for the planning and layout of metro stations and the development of cities around them.
The contributions of this study can be summarized as follows. On the one hand, this study improved the accuracy of the CA-Markov model by including POI kernel and station accessibility as driving factors at first. Then, this study predicted the land use change around two selected metro stations in the west of China by the optimized CA-Markov model. Finally, this study proposed different optimized strategies of land use landscape pattern according to spatial and temporal distribution of metro stations. On the other hand, previous academic research on the relationship between metro and land use has focused more on the coordinated relationship between metro and land use at the urban scale, and there has been less in-depth discussion on the differences in land use around the station. This study analyzes the land use differences around specific stations, making up for the lack of such research.
The implications for future research are as follows. The research results of this paper focus on the accessibility direction. The main innovation is to couple the traffic network into the land use spatial and temporal evolution pattern of CA-Markov, and find out the influence of the traffic factor of the metro station on the prediction accuracy of the future scene of the CA-Markov model. The research results will realize the future multi-scenario planning of land use around the old urban metro station and the new urban metro station in the process of urban renewal, and provide reference for the decision-making of the city’s functional management department. At the same time, it is also a meaningful innovation and exploration of the coupling model method and predicting the impact factors of future scenarios under LUCC theory and landscape pattern theory.
The correlation between the metro station and land use/cover change has always been a hot research topic. With the rapid construction and development of metro stations, Cervero and Kockelman proposed a transit-oriented development (TOD) model with reasonable land development intensity, diversified functions, and a comfortable walking space scale (Robert and Kockelman, 1997). Binaco found that the price of land along Polish metro is dominated by traffic accessibility, and the development of metro promotes the value of surrounding land (Dueker and Bianco, 1998). Some scholars have focused on the station selection (Li and Lei, 2016), the type (Duan and Zhang, 2013), the impact of the station on the surrounding areas (Feng et al., 2011), and the coordinated development and planning of the surrounding areas (Xu et al., 2015).
According to the existing research, the continuous expansion of metro will have a profound impact on the land around the traffic stations, such as land development intensity, land use structure, land value, accessibility, etc (Fla, Zl, Hc, Zc, Mla; Higgins and Kanaroglou, 2016). Within the scope of the new metro, the increase of the surrounding land passenger flow and accessibility leads to the increase of the whole land development intensity. The proportion of business land, residential land, public services land and traffic land changed significantly. Land use change leads to the change of regional landscape patterns. The impacts of the land use on landscape patterns have also been extensively studied. Simulating the future changes in land use landscape patterns and studying the formation process and mechanism of the current land use landscape pattern has important scientific values and practical significance (Li et al., 2016). At present, many models are developed to simulate land use change. CLUE-S model, PLUS model, FLUS model, and CA-Markov model are commonly used, among which the CA-Markov model has out-standing advantages in time series and spatial prediction (Rahnama, 2021; Mathewos et al., 2022). It can simulate land use change in quantity and geographical space (MartzLawrence and Hyandye & Canute, 2017; Thaden et al., 2018), so it is widely used in the study of land use landscape pattern change. Previously, most of the research objects were selected on a large scale. For example, (Jana et al., 2022), (Sma et al., 2019), (Aksoy and Kaptan, 2021), Etemadi et al. (2018) used the CA-Markov model to simulate and predict the large-scale land use evolution of the Mahi River in India, mountainous cities in Oman, Ulus district in northern Turkey, mangroves along the coast of Iran. Meanwhile, (Fu et al., 2022) simulated and predicted the landscape pattern of county land use in Mianzhu City. However, academic research on the relationship between metro stations and land use has focused more on the coordination at the urban scale. Few studies focused on the simulation and prediction of small scale. Most of the previous studies considered that road factors will have an impact on land use change, but pay less attention to POI kernel density and station accessibility as driving factors of the CA-Markov model, which could improve the accuracy of the simulation.
This work chooses two metro stations in need of economical, intensive, and high-quality development but have obvious time and space differences (Ryan and Throgmorton, 2003). The metro stations under study are located in the old and new districts of Chengdu. Zoo Station and Lu Xiao Station are the representative of the old district and the new district, respectively. The Zoo Station is located on Metro Line 3, an old urban area of Chengdu, and began operation on 31 July 2016. The construction of the metro station has brought an opportunity for land development around the Chengdu Zoo and Chengdu Research Base of Giant Panda Breeding. With the establishment of the station, the land value will be greatly improved. The transformation of this type of area mainly lies in optimizing and upgrading the stock space, promoting the organic renewal of the city, enhancing the value of the city space, and promoting the development of the connotation of the park city. The development of such old urban metro station is relatively early and mature, and the supporting public service facilities are relatively perfect. The Zoo Station is a model of the old city station. The analysis of the surrounding land use changes is conducive to the improvement and optimization of this type of station land.
The Lu Xiao Station is located on Metro Line 6, in Chengdu High-tech Center, and it was operated to traffic on 18 December 2020. As the first TOD demonstration project in Chengdu, the Lu Xiao Station takes metro stations as the center of a circle. In its planning and design, it has a mixed-function development of land, equipped with medical, education, shopping centers, parks, office buildings, etc. Such new urbanstations implement efficient and intensive TOD comprehensive development. According to the concept of “station-city integration, industry priority, functional compounding, and comprehensive operation”, with rail transit as the guide, the city’s central vitality zone featuring park communities forms a new economic and new kinetic energy cultivation center. It is the representative of the overall construction of TOD urban design area. Therefore, the Lu Xiao Station has a certain demonstration effect.
At present, the research mostly adopts the spatial range of 400–800 m around the subway station as the research object (Qiang, 2009). Based on this result, combined with relevant theories and the characteristics of the research object, this study takes the two stations as the core and the 800 m radius as the research scope. Investigating two metro stations with different time and space distributions but the same area range helps to verify the simulation accuracy of the model and reveal the reasons for the regional differences of metro stations impact on land use change in old and new urban areas through comparative analysis, as shown in Figure 1. The qualitative and quantitative analysis of this article is helpful in understanding the influence of metro stations on the land use structure around the stations and can provide a reference for the local government to formulate urban development policies related to metro stations.
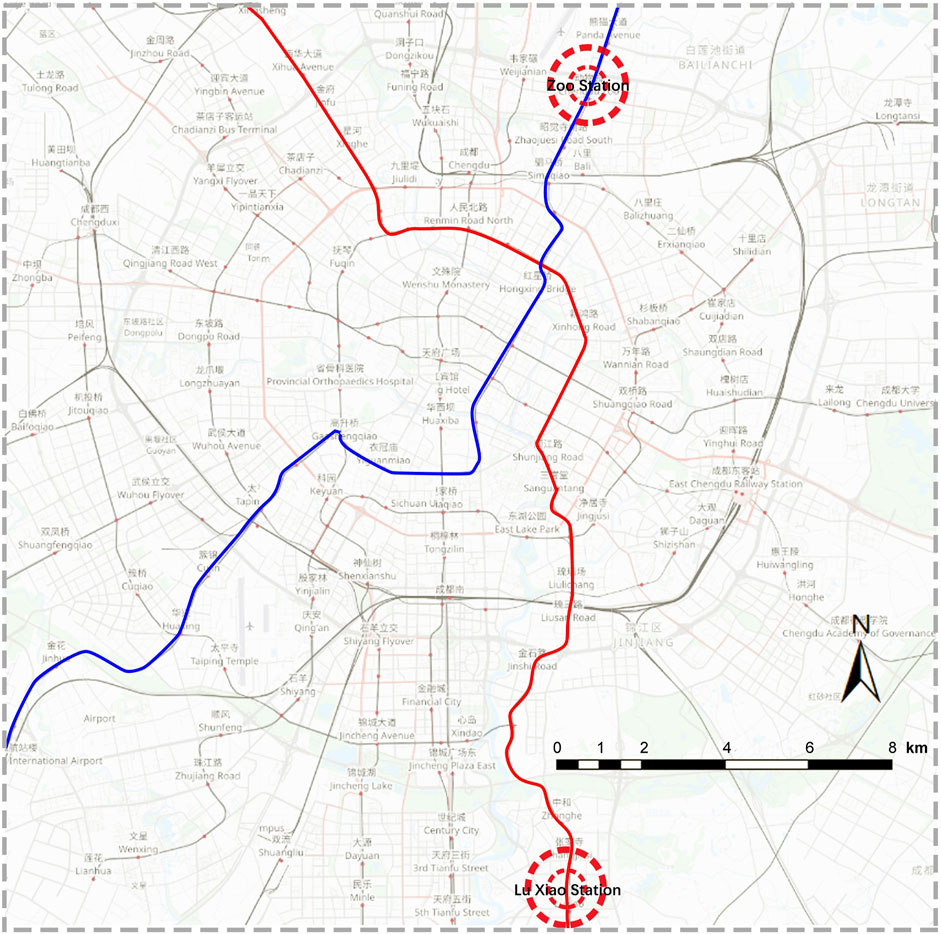
FIGURE 1. Distribution location of two metro stations (https://www.openstreetmap.org/relation/3287346).
1) The vector data of land use in the planning and construction year is obtained from the Sichuan Third Academy of Surveying and Mapping Engineering. The land use map of the operating year is based on the land use data of the planning year, combined with the Google satellite map of the operating year. Compared with the land use status data interpreted by remote sensing images, direct use of the vector data of land use status can reduce errors in supervised classification and manual visual interpretation, and the accuracy of land use simulation and prediction research will also be greatly improved. Moreover, in the current geographic information system based on vector data structure, to solve the problem of combining with remote sensing, vector data is often converted into raster data. The ArcGIS10.5 software is adopted to rasterize the vector data of land use, and the data is then manually interpreted.
Compared with Chengdu Urban Master Plan (2016–2035), this article analyzes the interactive relationship between metro stations and surrounding land use. According to the latest national standard of “Land use status classification” (GBT21010-2017), combined with the status of the study area, the land use types are divided into nine categories, as shown in Table 1.
2) Road information data comes from Chengdu’s comprehensive traffic planning map.
3) The geospatial data cloud of the Global Digital Elevation Model (GDEM) with a resolution of 30 m is downloaded from the website (http://www.gscloud.cn/). Then, the GIS software is employed to obtain the slope from DEM.
4) The POI data such as residence, commercial services, industrial and mining, public service, etc. are obtained from Baidu’s national map POI (https://lbsyun.baidu.com/solutions/fanxing).
5) The accessibility data are obtained from the lightweight route planning data of the Baidu web Service API (https://lbsyun.baidu.com/index.php?title=webapi/directionlite-v1).
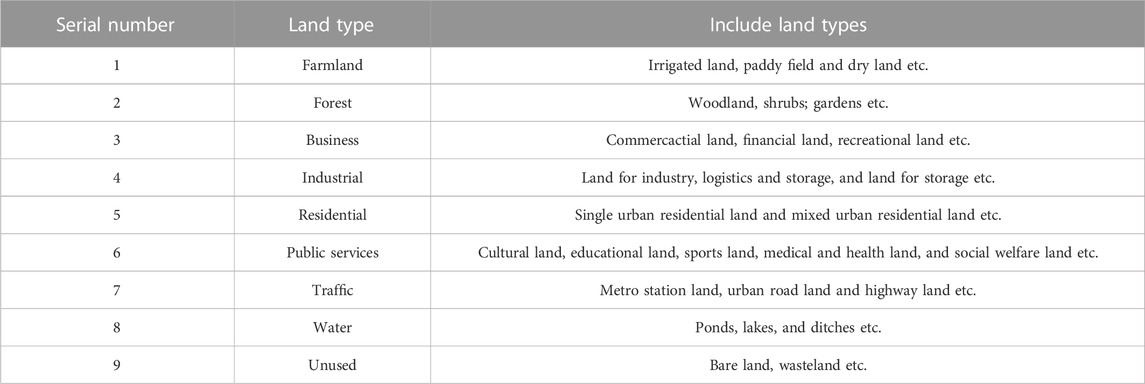
TABLE 1. Classification of land use types in the study area.
In addition, to meet the needs of research, Beijing_1954_3_degree_GK_zone_35 is used as the unified projection coordinate system of the above data, and the spatial res-olution is 5 m × 5 m.
Cellular Automata (CA) is a dynamic system with discrete space and state (Chudech et al., 2016), and each cell is in a discrete state. Synchronize updates based on the same transformation rules that are local in time and space. The formula is as follows (Sang et al., 2011):
S, the set of cellular states; N, the cellular domain;
Markov model is a stochastic model in the time dimension (Behera et al., 2012). The transition matrix is the application of the Markov Model in Land Use Change. The transition matrix is a digital reflection of the possibility of the event changing from t state to t+1 state, and it is an important quantitative basis for the simulation and prediction results under the Markov plate. The formula is as follows:
We choose the CA-Markov model, which combines the advantages of the two models to simulate. The kappa coefficient was calculated to reflect the consistency between the simulation results and the real results. When .8 < Kappa ≤1, it shows that the reference map is almost completely consistent with the simulation map. When .6 < Kappa ≤.8, the simulation result is highly consistent with the actual drawing.
POI is the abbreviation of “Point of Interest”, the core data of location-based service, and it is of great value for studying cities (Chen and Xu, 2019; Yang et al., 2021; Yang et al., 2022b). The POI data set carries the spatial information and attribute information data of geographical entities closely related to people’s lives, and can quickly and intuitively reflect their distribution in cities, which is superior to the traditional survey data (Shu et al., 2019). Moreover, the function agglomeration of cities around metro stations has a great relationship with the location of urban space (Wu, 2021). The distribution density of different POI types around the station will affect the transformation of the corresponding land use types. The kernel density estimation method transforms the data of interest points into continuous density surfaces so as to evaluate the distribution intensity of human activities in urban space (Yu et al., 2015). The higher the kernel density, the more concentrated the urban functions in the region and the higher the suitability of the corresponding land use types. Therefore, using ArcGIS’s kernel density analysis tool, mask extraction, reclassification and other operations, the kernel density values are divided into five grades of 1–5 according to the natural discontinuity classification method, which is the most commonly used method in ArcGIS. And then imported into IDRISI to obtain the corresponding land suitability factor layer for simulation prediction.
American scholar Hanson formally expounded the concept of accessibility for the first time, defining accessibility as the interaction opportunity of each node in the transport network (Guo et al., 2014). Accessibility is the key link between land use and traffic construction, and it is directional to urban development (Yang et al., 2020). The accessibility of a certain area can effectively reflect the value of the area.
Based on the ‘walking plan return parameter’ provided by the Baidu map Web service API, the ‘duration’ field is the required parameter. Through web crawler technology, the ‘duration’ field data is automatically captured and exported to an Excel table to form the basic data source of the GIS database. ArcGIS software is used for interpolation, and the inverse distance weight method is selected for interpolation. The interpolation results are fine-tuned and classified based on the geometric interval classification method. The grid image is extracted with the current regional land use image as the mask, and the projection coordinate system is unified to realize the visual expression of the accessibility of metro stations, which is used as an important factor affecting the change of construction land (Xiao, 2021).
Multi-criteria evaluation (MCE) model is often used to generate the atlas of suitability evaluation in CA-Markov model construction. According to the unique geographical conditions and the characteristics of land resource utilization in Chengdu, this article selects non-natural factors such as distance from road or metro stations, POI data, accessibility, and ecological factors such as elevation and slope as the driving factors affecting land use change. The driving factors are applied to the MCE model in IDRISI 17.0. Under the MCE module, different function forms are set for these two types of driving factors to determine the degree of influence of each factor on various types of land, which is used as a suitability atlas to participate in LUCC simulation prediction.
A landscape pattern index based on land use/land cover map is an important method of landscape spatial analysis (Yanhong, 2010). Fragstats is a commonly used landscape pattern analysis software with powerful calculation and analysis functions (Riitters et al., 1995; Jones et al., 2010). There are many landscape pattern indices. According to the characteristics of envi-ronmental impact assessment of metro stations, this article selects the landscape pattern index with strong predictability that changes with the land use classification system for analysis, including Number of Patches (NP), Patch Density (PD), which describe the relationship between landscape size and landscape fragmentation; Landscape Shape Index (LSI) and Fractal Dimension (Fd) measure the complexity of patch shape; Landscape dominance index, Largest Patch Index (LPI) and Percentage of Landscape (PLAND) can determine the dominant type of landscape. The above indexes respectively reflect the area, density, diversity, and aggregation of patches.
The research of this article combines the research methods described, and the technical route is shown in Figure 2.
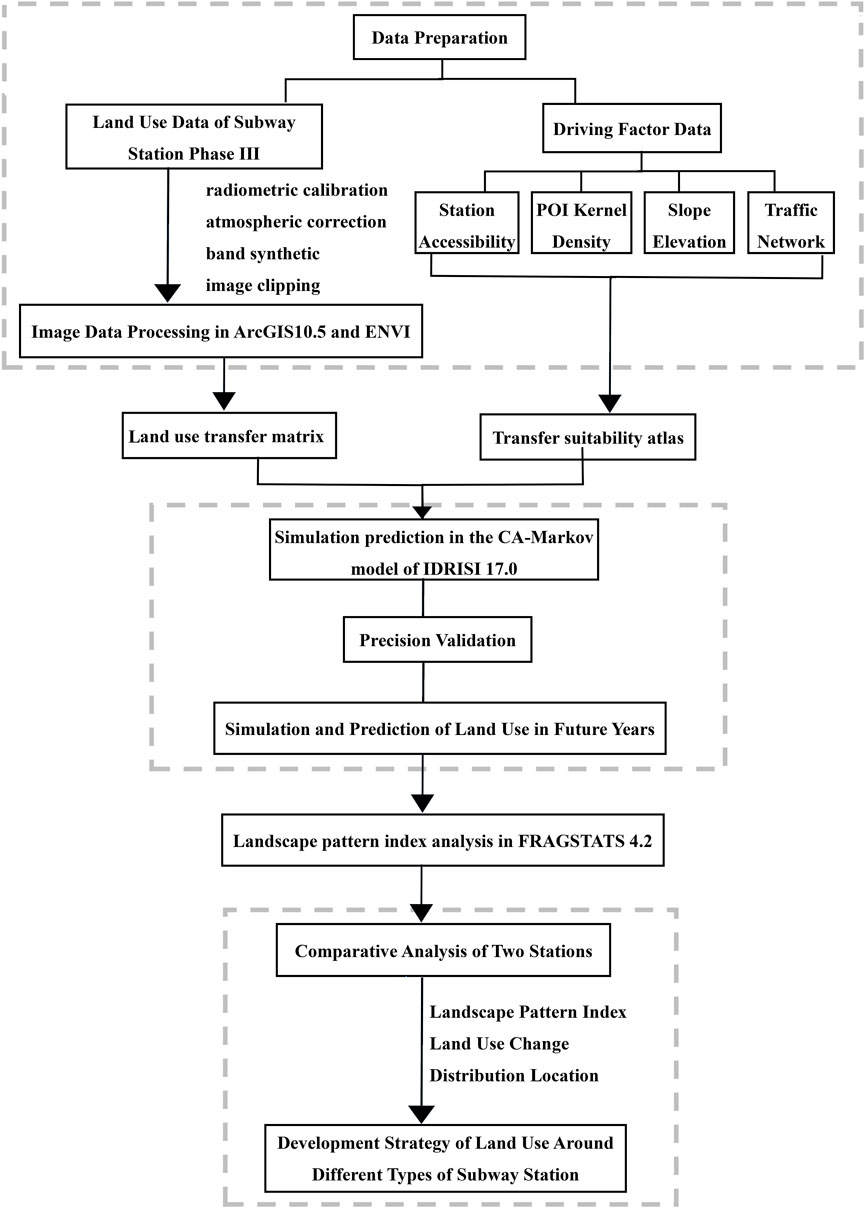
FIGURE 2. Technical Route. First, based on the land use data of the planning, construction and operation years of the two stations, the suitability atlas is constructed by combining the driving factors such as POI kernel density and station accessibility. The CA-Markov model was used to simulate the land use and cover situation in the operation year of the station, and the Kappa coefficient was calculated by comparing it with the current land use map. After the accuracy verification, the land use and cover change in the future year were simulated, and the landscape pattern index of the two stations was compared and analyzed. Finally, put forward the development strategy of different types of stations.
The analysis results of POI core density of Zoo residences, commerce, public services, and the analysis results of walking accessibility are shown in Figure 3. Other factors affecting land use change mainly include DEM terrain data, slope data, the distance of the transport network, etc. Taking 2013 and 2017 as the starting year and 4 years as the interval, the station accessibility analysis and POI kernel density analysis are coupled to make various land suitability atlas and calculate the Markov transition matrix. The CA-Markov model is used to simulate and predict the land use simulation map of the study area in 2021 as shown in Figure 4. Calculated by the Validate module in the IDRISI which can verify the accuracy, the kappa coefficient of the 2021 forecast map and the 2021 current map is 87%. The results show that the simulation accuracy is high, showing that the model is feasible. So, the simulation results of land use in 2025 will be closer to reality.
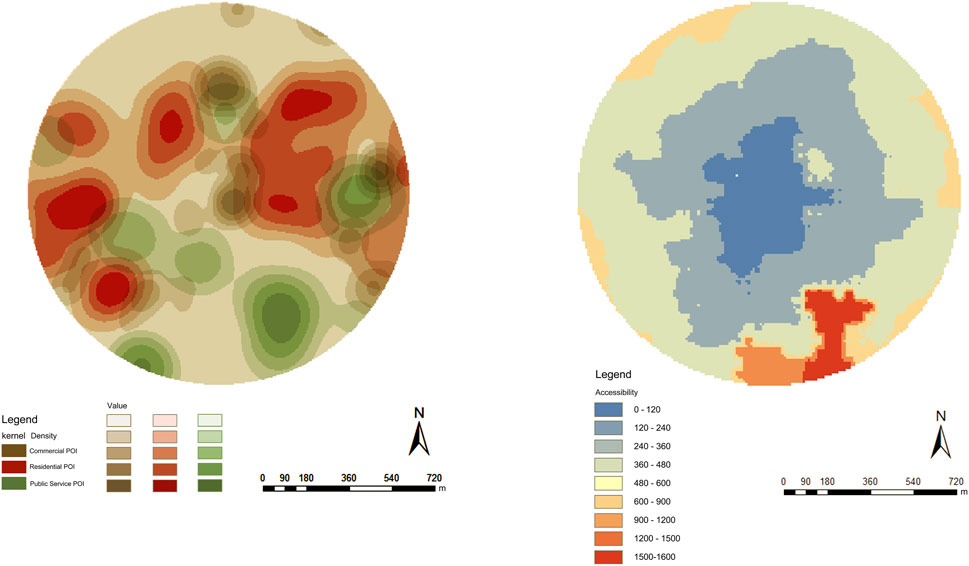
FIGURE 3. Analysis of POI kernel density (left) and accessibility (right) around Zoo Station.

FIGURE 4. Land use maps of 2013, 2017, 2021 and predicted land use maps of 2025 at Zoo Station.
After simulating and predicting the land use in 2025, the forecast map of 2025 is compared to the present map of 2021. Among them, the growth of business land, residential land, and the decrease of farmland are larger. More business land was added around the station and along the road, mostly forest land and unused land were converted into business land. Compared with the land use in 2021, the amount of industrial land increases, especially in the north of the station. Metro stations are more attractive to business and residential land, but it is more exclusive to industrial land (Guo and Li, 2015) and has little impact on public services land.
Under the guidance of policy, the construction of urban stationsleads to a change in population density, and then the land in the area will turn into living, functional land. Due to the sudden change in policy factors, such as new urban planning, there is a certain error between the simulation result and the reality. In subsequent simulation predictions, policy factors should be fully considered to increase simulation accuracy.
Figure 4 shows the evolution of land use in the Zoo Station and the simulation and prediction of land in 2021. On this basis, the kappa coefficient is calculated separately from the current situation in 2021 to ensure the accuracy of the simulation. After validation, land use in 2025 is simulated. The black dotted box is the location where land use changes greatly.
Six indexes are selected from aspects of landscape fragmentation, shape, and dominance to analyze the landscape pattern of the Zoo Station. The landscape land type data from 2013 to 2025 are converted into TIF. file format and imported into the Fragstats software to calculate the above-selected landscape index, as shown in Figure 5. The evolution law of landscape types of land use from 2013 to 2021 and the prediction result in 2025 are studied, and the evolution characteristics of landscape patterns in the region are analyzed.
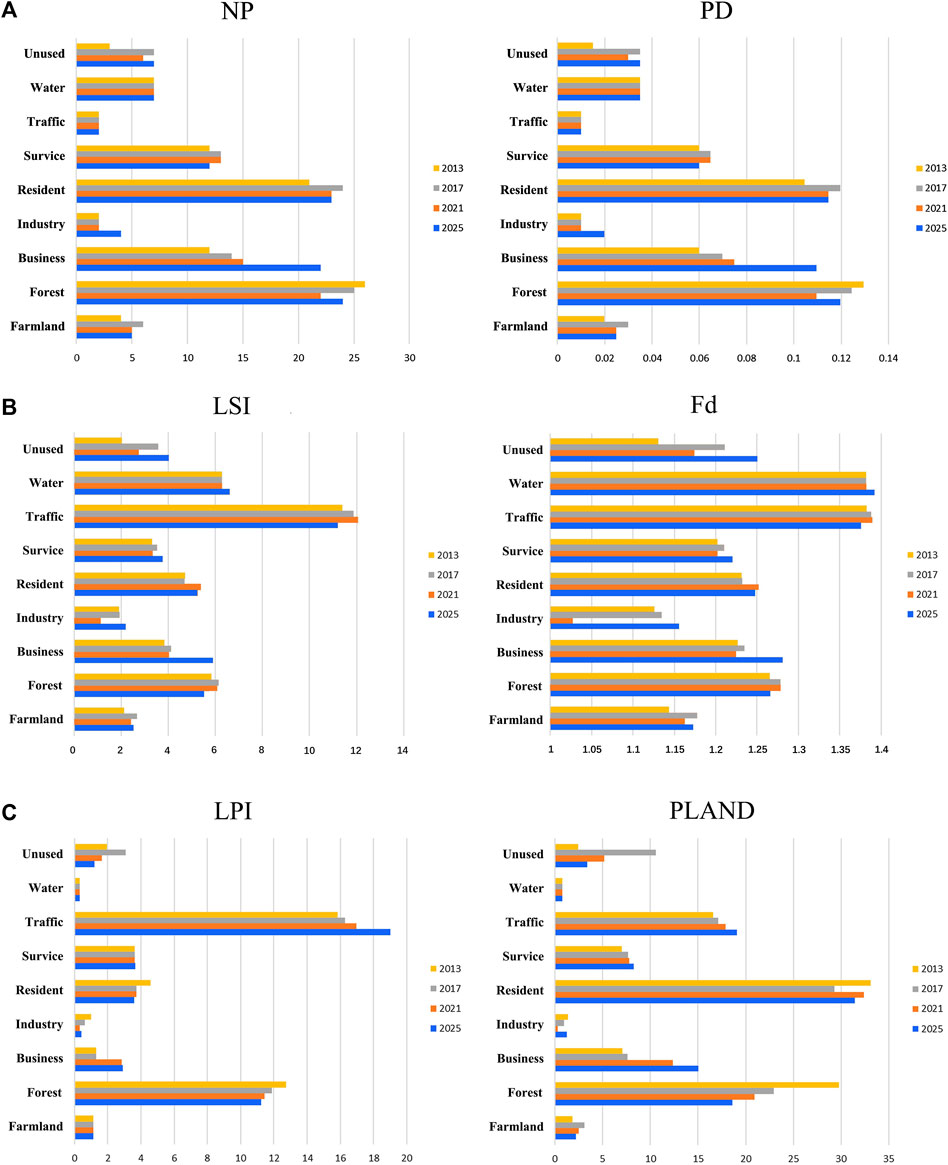
FIGURE 5. Landscape pattern indices of each landscape land type in the study area from 2013 to 2025 (A) Landscape fragmentation indices, (B) Landscape shape indices, (C) Landscape dominance indices.
NP and PD are important indicators to measure the fragmentation of landscape patterns, as shown in Figure 5A. The higher the PD value, the higher the fragmentation degree of the landscape type; the smaller the value, the higher the aggregation degree of the landscape type. The results show that the fragmentation of forest land decreases, and the aggregation increases with time, but the fragmentation of patches is at a high level. Meanwhile, business land, residential land, and farmland show an opposite development trend, which indicates that farmland and unused land are constantly used in urban construction during this period.
The LSI can directly measure the complexity of the landscape patch shape. The higher the LSI value, the greater the complexity of the landscape patch shape. LSI can show the development intensity of the surrounding areas. The LSI values of forest land and transportation land around the station increase first and then decrease, while those of other lands generally indicate an upward trend. This indicates that the future shape of land use is complex, the development intensity of the city increases during the construction process, and the fragmented forest land patches gradually spread and connect.
Fd is similar to the landscape shape index, and its variation trend can reveal the degree of border folds of each landscape patch. Its value range is 1–2. The closer the value of Fd is to 2, the more complex the patch shape is, and the less the interference of human activities is. Except for the water area and traffic land, the Fd values of all types of patches in the Zoo Station are all lower than 1.35, indicating that human disturbance is large and the development intensity is large. The overall Fd value of unused land, industrial land and farmland is low, indicating that these three types of land patches are most disturbed by human beings, as shown in Figure 5B.
The largest patch index (LPI) and the proportion of patches in the landscape area (PLAND) can confirm each other, thus reflecting the dominant types of landscape patches. From 2013 to 2025, the LPI and PLAND values of residential land patches always rank first, and forest land and traffic land are also at the forefront. These are dominant landscape types in the study area; The LPI and PLAND values of traffic land and residential land are constantly rising, which indicates that these patches in the old city area are becoming perfect and abundant, as shown in Figure 5C.
Based on POI kernel density and station accessibility, as shown in Figure 6, the land use of Lu Xiao Station was simulated by the same method as that of Zoo Station. The results of the Validate module of the IDRISI software show that the standard Kappa coefficient, random Kappa coefficient, and position Kappa coefficient of the 2021 prediction map and 2021 current map are 75%, 76%, and 79%, respectively. From the perspective of spatial position and comprehensive analysis, the simulation results are more accurate.
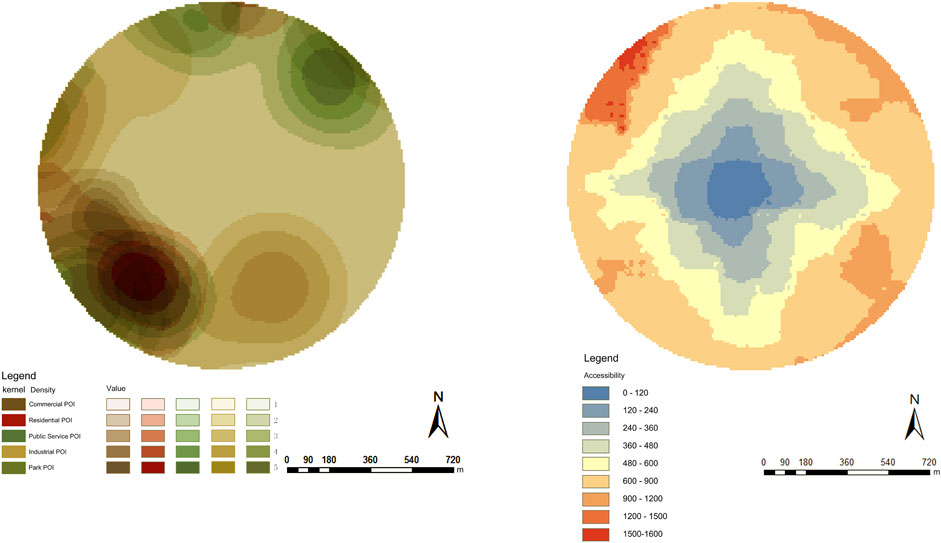
FIGURE 6. Analysis of POI kernel density (left) and accessibility (right) around Lu Xiao Station.
Figure 7 presents the simulation results from 2014 to 2023. With the completion and operation of the Lu Xiao Station, the spatial structure of the surrounding land use has changed obviously, and the most significant one is that the farmland has decreased greatly. In the place close to the Lu Xiao Station, more public service lands have been added in the northeast in 2017 than those in 2014, and the surrounding farmland and ecological land show a decreasing trend, while residential land has increased. In the south of the Lu Xiao station, a new piece of commercial service land is added, and the industrial land shows a decreasing trend. Compared with 2017, the business land near the station will increase in 2020, and the farmland will also decrease, while the forest land will decrease. The TOD planning space is usually within a walk distance of 5–15 min, with a radius of about 400–800 m. In the comparison of the current situation of 2020 with the prediction of 2023, it can be seen that the short-distance farmland of the station is greatly reduced, and the commercial and service land increases in circles around the station, while the residential land shows an obvious growth trend. This is consistent with the planning concept of the Lu Xiao TOD, and it also shows that the simulation results have a policy-guiding significance.
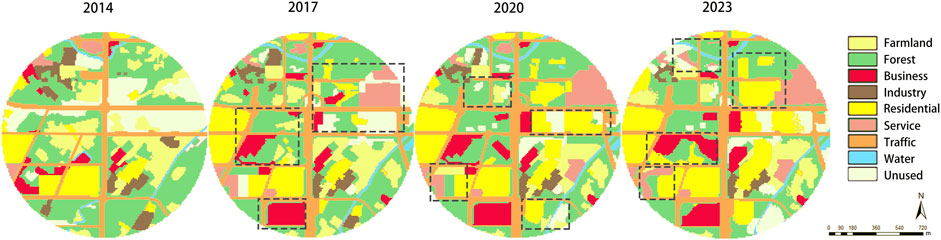
FIGURE 7. Land use maps of 2014, 2017, 2020 and predicted land use maps of 2023 at Lu Xiao Station.
Figure 7 shows the evolution of land use in the Lu Xiao Station and the simulation and prediction of land in 2020. On this basis, the kappa coefficient is calculated separately from the current situation in 2020 to ensure the accuracy of the simulation. After validation, land use in 2023 is simulated. The black dotted box is the location where land use changes greatly.
The same method is used to study the evolution law of land use landscape types under each landscape index in the Lu Xiao Station from 2014 to 2020 and the predicted result in 2023 as shown in Figure 8.
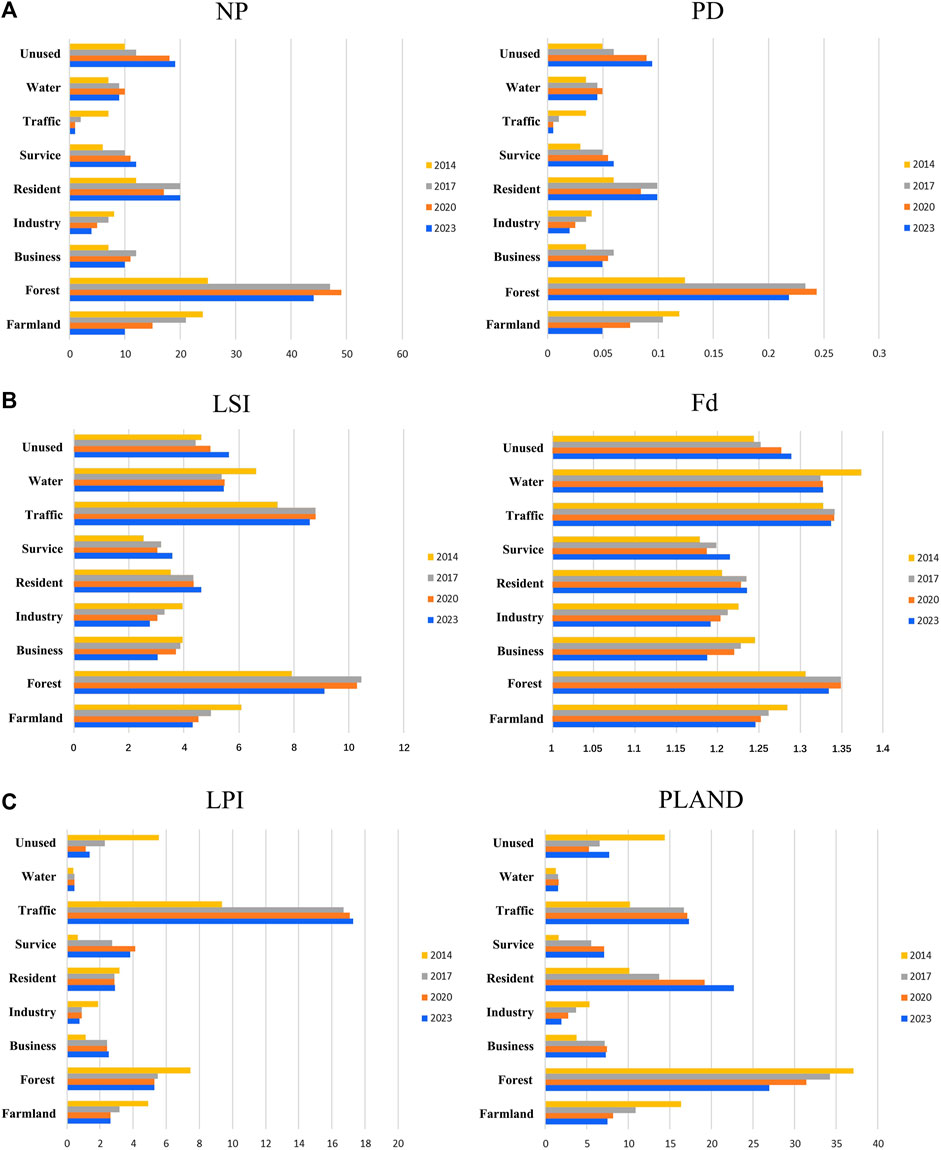
FIGURE 8. Landscape pattern indices of each landscape land type in the study area from 2014 to 2023 (A) Landscape fragmentation indices, (B) Landscape shape indices, (C) Landscape dominance indices.
The analysis results of PD in different periods around the Lu Xiao Station show that with the increase of time, the fragmentation degree of farmland, industrial, and mining storage land generally decreases, while the aggregation degree is constantly increasing; the business land, public land, and residential land show an opposite variation trend, while the fragmentation degree of ecological land first increases and then decreases, indicating that ecological land and unused land are constantly used from in urban construction during this period, and ecological land is mainly used in the initial stage of construction, as shown in Figure 8A.
The variation trend of LSI in different periods around the station shows that the LSI of ecological land first increases and then decreases; the LSI of industrial and mining land, commercial and service land, and farmland shows a downward trend.; the LSI of unused land, residential land, and public land shows an upward trend. These results indicate that the land development intensity in this area is strong. Also, the probability of unused land transfer is high, and it mainly occurs within 300 m of the station.
According to the Fd of Lu Xiao Station, the Fd values of industrial and mining storage land, commercial and service land, and farmland show a downward trend, the patch shape tends to be regular, and the intensity of human interference gradually increases. Meanwhile, the Fd values of public and residential land in the Lu Xiao Station show an upward trend, the patch shape tends to be complex. Although the intensity of human interference is strong, it gradually decreases. Moreover, the Fd values of traffic land and ecological land first increase in 2017 and then decrease in 2023, indicating that the patch shape of ecological land is initially complex and then becomes simple and regular, as shown in Figure 8B.
According to the calculation results of the LPI and the PLAND, the LPI and PLAND values of ecological land patches always rank first from 2013 to 2025, and residential land and traffic land are the main patches, which indicates that this land-scape type is dominant in the study area, as shown in Figure 8C.
When setting the parameters of the CA-Markov model, the choice of station driving factors and the size of parameters directly affect the spatial distribution of land use. The existing research fails to investigate the selection of driving factors of small-scale metro stations and the influence of parameter range on land use prediction results. Therefore, when using the CA-Markov model to predict the metro stations in Chengdu on a small scale, land POI data and accessibility factors are added to more accurately reflect the current government’s land use intensive development policy for optimizing the stock of the Zoo Station and increasing the TOD development of the Lu Xiao Station. The investigation results can provide a scientific basis for urban planning, environmental pollution caused by traffic, energy saving, and green development.
In the process of applying the CA-Markov model simulation, because of the complexity of model transformation rules, the influences of natural, social, and economic factors on the change of land use landscape pattern should be comprehensively considered (Zhou et al., 2020). However, it is found that human factors such as passenger flow and economy cannot be well reflected in this model as driving factors. Meanwhile, the change in the landscape pattern of land use is greatly influenced by policy, and metro station also affects the land structure in terms of geographical location, surrounding facilities, and density. And it is difficult to introduce qualitative law or sudden political trends in the model. Therefore, in future research, we will constantly improve the cellular transformation rules of the CA-Markov model, comprehensively consider various models, and discuss the driving factors of the metro station more comprehensively. Also, we will conduct a more indepth and comprehensive study on the landscape pattern index and explore a landscape pattern index that reflects the changing characteristics of regional landscape patterns more pertinently. This article takes small-scale metro stations as the research object, and future research will be developed in the direction of important metro stations to comparatively analyze linear land use landscape patterns with different spatial and temporal distributions.
Under the guidance of planning, urban land use change is affected by the comprehensive effects of economic development, population growth, industrial structure adjustment, and other factors, which lead to the outer expansion of urban space and the renewal of urban land. Specifically, metro, as an urban subsystem, is increasingly characterized by openness and publicity under the concept of a compact city (Xiaoyuan and Bingjie, 2020). The relationship between metro stations and land use is complex, and traffic accessibility is a key factor in the relationship between them, which is important for determining the scale, intensity, and spatial distribution of urban land (Xu et al., 2017). Based on the result of the study, the following strategies are proposed.
1) Choose the mode of land use and development according to local conditions. Different sites are located in different cities, and their surrounding land use and development patterns are also different. The optimization of land use in metro station areas needs to be coordinated in various aspects, such as land use function, development intensity, radiation population, and supporting service facilities, to improve the station efficiency. In the future, the development mode of metro stations should be determined according to their advantages and local conditions, and the organic mixing of commerce, parks, offices, and other functions should be guided to promote the 800 m radiation space around the metro to form a suitable urban structure.
2) Optimize the landscape pattern around the station. The fragmentation degree of forest land around the Zoo Station is obvious, but the fragmentation degree of forest land decreases. The human disturbance has an obvious intensity, so it is necessary to increase stepping stone patches among the forest land in this area, thus increasing landscape connectivity and keeping its ecological benefits in a good state. In landscape pattern evolution, the landscape pattern state of the study area is generally good, but the influence of human disturbance on the landscape pattern needs to be effectively controlled. The land development intensity around the Lu Xiao Station is high, and the edge of forest land is regular, which is not conducive to protecting biodiversity. Therefore, for the boundary of green patches in the region, the straight single-layer boundary should be replaced by twists and turns, and the landscape pattern index around the metro station needs to be optimized by carefully designing each ecological land patch.
3) Improve the policy planning system. In the construction and development of metro, priority should be given to land use efficiency, protection of urban ecological land, control of construction land, full protection of land use during construction, and reasonable adjustment after completion. Meanwhile, the three-dimensional and comprehensive development of metro should be encouraged to reduce the occupation of farmland and forest land. Moreover, it is necessary to strengthen the connectivity and aggregation between patches, improve the stability of landscape structure, optimize the landscape spatial pattern, reduce carbon emissions and increase carbon absorption, and enhance the socio-economic and ecological benefits of the landscape.
In this article, the Zoo Station and Lu Xiao Station of Chengdu Metro are taken as study areas. Based on the validation of land use simulation prediction, it is found that the simulation accuracy of the CA-Markov model is higher by adding POI kernel density and station accessibility. Therefore, this model is selected to predict and simulate the future landscape pattern of land use. This study aims to research the temporal and spatial change in land use landscape patterns of the study area under the influence of urbanization and to provide a reference for the economic, intensive, and high-quality development of Chengdu. The following observations are obtained: (Munsi et al., 2010) The landscape land types at the two metro stations changed greatly, the area of residential and business land continues to increase, and the area of farmland and forest land continues to decline. In the future, thefarmland and forest land around the Zoo Station in the study area will decrease by 13% and 11%, respectively, the business land will increase by 21%, and the other land will change slightly. The farmland and forest land around the Lu Xiao Station decreased by 9% and14%, respectively, residential land increased by 18%, and other land changes are small. In future urban construction, we should reasonably protect farmland and forest land, and control the growth of construction land, thus promoting the sustainable development of the city (Wei et al., 2021). Among all types of land in the study area, residential land, business land, and forest land have a large degree of landscape fragmentation, showing the characteristics of numerous patches and high patch density. From the perspective of the landscape level, the fragmentation of the study area is increasing, so it is necessary to strengthen the connectivity among patches to improve the stability of the landscape pattern (Yu, 2017). Aiming at the small-scale regional research of metro stations, the influence of POI and accessibility on land use types in the CA-Markov model is discussed. Different spatial scales have different sensitivity to driving factors, so we should pay attention to discussing the parameters of driving factors when making predictions for other scales. Based on the concept of a compact city and the requirement of low-carbon development, the research on landscape patterns of land use should focus on the optimization of regional landscape patterns of land use and provide a reference for sustainable urban construction in the future (Li et al., 2020).
The original contributions presented in the study are included in the article/Supplementary Material, further inquiries can be directed to the corresponding author.
FF: Conceptualization, funding acquisition, supervision, and writing—original draft. XJ: Formal analysis, methodology, writing—review and editing. DW: Formal analysis, writing—review and editing. QZ: Formal analysis, writing—review and editing. HF: Validation, writing—review and editing. LL: Validation and writing—review and editing. LA: Validation and writing—review and editing. All authors contributed to the article and approved the submitted version.
This study was supported by the Science Foundation of the Ministry of Education of China (18XJCZH003).
The authors declare that the research was conducted in the absence of any commercial or financial relationships that could be construed as a potential conflict of interest.
All claims expressed in this article are solely those of the authors and do not necessarily represent those of their affiliated organizations, or those of the publisher, the editors and the reviewers. Any product that may be evaluated in this article, or claim that may be made by its manufacturer, is not guaranteed or endorsed by the publisher.
Aksoy, H., and Kaptan, S. (2021). Monitoring of land use/land cover changes using GIS and CA-markov modeling techniques: A study in northern Turkey. Environ. Monit. Assess. 193, 507. doi:10.1007/s10661-021-09281-x
Behera, M. D., Borate, S. N., Panda, S. N., Behera, P. R., and Roy, P. S. (2012). Modelling and analyzing the watershed dynamics using Cellular Automata (CA)–Markov model – a geo-information based approach. J. Earth Syst. Sci. 121, 1011–1024. doi:10.1007/s12040-012-0207-5
Chen, Y., and Xu, X. (2019). Performance evaluation for land value of metro station based on POI big data. Urbanism Archit. doi:10.19892/j.cnki.csjz.2019.04.007
Cheng, H., and Chen, R. (2019). Landscape pattern analysis within neighborhood of urban metro system in megacities——A case study of shanghai city. Urban Geotechnical Investigation Surv., Porur, Chennai, CNKI:SUN:CSKC.0.2019-01-005.
Chu, L., Sun, T., Wang, T., Li, Z., and Cai, C. (2018). Evolution and prediction of landscape pattern and habitat quality based on CA-markov and InVEST model in hubei section of three gorges reservoir area (TGRA). Sustainability 10, 3854. doi:10.3390/su10113854
Chudech, L., Masahiko, N., Sarawut, N., and Rajendra, S. (2016). Modeling urban expansion in bangkok metropolitan region using demographic–economic data through cellular automata-Markov chain and multi-layer perceptron-Markov chain models. Sustainability 8, 686. doi:10.3390/su8070686
Duan, D., and Zhang, F. (2013) .Study on classification of urban rail transit stations from the perspective of land use optimization:a case study on XI’an subway line 2. City Plan. Rev., Beijing ChinaCNKI:SUN:CSGH.0.2013-09-009.
Dueker, K. J., and Bianco, M. J. (1998). Effects of light rail transit in portland: Implications for transit-oriented development design concepts. Center for Urban Studies.NY China.
Etemadi, H., Smoak, J. M., and Karami, J. (2018). Land use change assessment in coastal mangrove forests of Iran utilizing satellite imagery and CA–Markov algorithms to monitor and predict future change. Environ. Earth Sci. 77, 208. doi:10.1007/s12665-018-7392-8
Feng, C., Li, W., and Zhao, F. (2011). Influence of rail transit on nearby commodity housing prices: A case study of beijing subway line five. Acta Geogr. Sin. 66, 1055–1062.
Li, F., Li, Z., Chen, H., Chen, Z., and Li, M. (2020). An agent-based learning-embedded model (ABM-learning) for urban land use planning: A case study of residential land growth simulation in shenzhen, China - ScienceDirect. Land Use Policy 95.
Fu, F., Deng, S., Wu, D., Liu, W., and Bai, Z. (2022). Research on the spatiotemporal evolution of land use landscape pattern in a county area based on CA-Markov model. Sustain. Cities Soc. 80, 103760. doi:10.1016/J.SCS.2022.103760
Guo, Q., Dianting, W. U., Rui, L. I., and Qiu, Y. (2014). Evaluation of urban rail network accessibility:A case study of beijing subway. urban Dev. Stud. 15 doi:10.3969/j.issn.1006-3862.2014.04.010
Guo, Y. Y., and Li, L. I. (2015). Impact of rail transit on the land use structure along it: A case study of the 5∼(th) subway(baoan section) in shenzhen, guangdong province. Guangdong Land Sci.42 2.
Higgins, C. D., and Kanaroglou, P. S. (2016). Unbundling the hedonic price effects of rapid transit and transit-oriented development. Toronto.
Jana, A., Jat, M. K., Saxena, A., and Choudhary, M. (2022). Prediction of Land use land cover Changes of a river basin using the CA-Markov Model. Geocarto Int. 2022, 1–21. doi:10.1080/10106049.2022.2086634
Jones, K. B., Riitters, K. H., Wickham, J. D., and Goodman, I. A. (2010). Landscape monitoring and assessment research plan. Beijing.
Li, J., Oyana, T. J., and Mukwaya, P. I. (2016). An examination of historical and future land use changes in Uganda using change detection methods and agent-based modelling. Afr. Geogr. Rev. 35, 247–271. doi:10.1080/19376812.2016.1189836
Li, L., and Lei, H. (2016). A study on fuzhou-xiamen high speed rail route and station site specification. Planners. doi:10.3969/j.issn.1006-0022.2016.10.005
Martz, L. W., and Hyandye, C. (2017). A Markovian and cellular automata land-use change predictive model of the Usangu Catchment. Int. J. remote Sens. 38, 64–81. doi:10.1080/01431161.2016.1259675
Mathewos, M., Lencha, S. M., and Tsegaye, M. (2022). Land use and land cover change assessment and future predictions in the matenchose watershed, rift valley basin, using CA-markov simulation. Land, 11 1632. doi:10.3390/land11101632
Munsi, M., Malaviya, S., Oinam, G., and Joshi, P. K. (2010). A landscape approach for quantifying land-use and land-cover change (1976–2006) in middle Himalaya. Reg. Environ. Change 10, 145–155. doi:10.1007/s10113-009-0101-0
Ongsomwang, Suwit, and Pimjai, M. (2015). Land use and land cover prediction and its impact on surface runoff. Suranaree J. Sci. Technol. 22, 205–223.
Qiang, M. (2009). Recent studies on transit-oriented development in north America. Urban Plan. Int.14.
Rahnama, M. R. (2021). Forecasting land-use changes in Mashhad Metropolitan area using Cellular Automata and Markov chain model for 2016-2030. Sustain. Cities Soc. 64–102548. doi:10.1016/j.scs.2020.102548
Riitters, K. H., O’Neill, R. V., Hunsaker, C. T., Wickham, J. D., and Jackson, B. L. (1995) A factor analysis of landscape pattern and structure metrics. Landsc. Ecol. , 10, 23–39.
Robert, Cervero, and Kockelman, L. (1997). Travel demand and the 3Ds: Density, diversity, and design. Transportation Research Part D Transport & Environment., and, Kara & New York.
Ryan, S., and Throgmorton, J. A. (2003). Sustainable transportation and land development on the periphery: A case study of freiburg, Germany and chula vista, California. Transp. Res. Part D Transp. Environ. 8, 37–52. doi:10.1016/s1361-9209(02)00017-2
Sang, L., Chao, Z., Yang, J., Zhu, D., and Yun, W. (2011). Simulation of land use spatial pattern of towns and villages based on CA–Markov model. Math. Comput. Model. 54, 938–943. doi:10.1016/j.mcm.2010.11.019
Shu, B., Chen, Y., Cui, J., and Chen, L. (2019). Preliminary study on the city’s functional structure of subway station’s surrounding area under the TOD model: Empirical analysis based on POI data along Chengdu metro. Huazhong Archit. doi:10.13942/j.cnki.hzjz.2019.05.020
Sma, C., Ab, B., and Aa, A. (2019). Monitoring land use and land cover changes in the mountainous cities of Oman using GIS and CA-Markov modelling techniques. Land Use Policy 91.
Suo, C., and Zhang, H. (2015). Influencing factors and development proposals of business space around hsr station: A case study of cities along shanghai-nanjing hsr with POI data. City Plan. Rev. 1. doi:10.11819/cpr20150708a
Thaden, V., JjlabordeGuevara, , Venegas-Barrera &, C. S., and Venegas-Barrera, C. S. (2018). Forest cover change in the Los Tuxtlas Biosphere Reserve and its future: The contribution of the 1998 protected natural area decree. LAND USE POLICY 10, 443–450. doi:10.1016/j.landusepol.2017.12.040
Wang, L., Cao, Y. H., Liu, K. W., and Wang, C. (2012). Spatial distribution and clusters of industry nearby high-speed rail station: The case of nanjing station, shanghai-nanjing motor train. Sci. Geogr. Sin. 17 doi:10.13249/j.cnki.sgs.2012.03.008
Wei, H., Xiong, L., Tang, G., Strobl, J., and Xue, K. (2021). Spatial-temporal variation of land use and land cover change in the glacial affected area of the Tianshan Mountains. Catena 202–105256. doi:10.1016/j.catena.2021.105256
Wu, Lizheng (2021). Research on urban functional structure characteristics surrounding metro stations based on POI data—a case of hefei metro line 1 and line 2. Urbanism Archit. 51 doi:10.19892/j.cnki.csjz.2021.08.55
Xiao, Bohua (2021). Calculation method for transit accessibility of urban rail transit planning scheme based on internet map data. Urban Mass Transit 24, 5.
Xiaoyuan, L., and Bingjie, Y. (2020). Land use evolution in rail transit sites: A case study of Chengdu metro line 2. Huazhong Archit. 38, 5.
Xu, C., Shen, Z., and Fei, M. (2015). Research on the constitution and intensity of the land use of railway station adjacent areas in metropolitan: The analysis and planning of the land use of railway station adjacent areas in metropolitan abroad and overseas on the basis of synergetics. Planners.30 doi:10.3969/j.issn.1006-0022.2015.z2.008
Xu, L., Qian, C., and Yang, Z. (2017). Land use and spatial development research on low-carbon and accessible city. Huazhong Architecture. Huazhong doi:10.13942/j.cnki.hzjz.2017.04.005
Yang, L., Ao, Y., Ke, J., Lu, Y., and Liang, Y. (2021). To walk or not to walk? Examining non-linear effects of streetscape greenery on walking propensity of older adults. J. Transp. Geogr. 94–103099. doi:10.1016/j.jtrangeo.2021.103099
Yang, L., Chau, K. W., Szeto, W. Y., Cui, X., and Wang, X. (2020). Accessibility to transit, by transit, and property prices: Spatially varying relationships. Transp. Res. Part D Transp. Environ. 85–102387. doi:10.1016/j.trd.2020.102387
Yang, L., Liang, Y., He, B., Lu, Y., and Gou, Z. (2022). COVID-19 effects on property markets: The pandemic decreases the implicit price of metro accessibility. Tunn. Undergr. Space Technol. 125–104528. doi:10.1016/j.tust.2022.104528
Yang, L., Liang, Y., He, B., Yang, H., and Lin, D. (2023). COVID-19 moderates the association between to-metro and by-metro accessibility and house prices. Transp. Res. Part D Transp. Environ. 114–103571. doi:10.1016/j.trd.2022.103571
Yang, L., Tang, X., Yang, H., Meng, F., and Liu, J. (2022). Using a system of equations to assess the determinants of the walking behavior of older adults. Trans. GIS TG 26, 1339–1354. doi:10.1111/tgis.12916
Yang, L., Yu, B., Liang, Y., Lu, Y., and Li, W. (2023). Time-varying and non-linear associations between metro ridership and the built environment. Tunn. Undergr. Space Technol. 132–104931. doi:10.1016/j.tust.2022.104931
Yanhong, Y. (2010). Application of landscape indices on ecological environmental impact assessment by taking the case of railway construction from lijiang to shangri-la. Environ. Sci. Surv. 10 20 doi:10.13623/j.cnki.hkdk.2010.02.022
Yu, D. (2017). The spatial succession and organization model of the urban material space within the rail transit station: A case in beijing. Sci. Geogr. Sin. 10.
Yu, Wenhao, Ai, Tinghua, Liu, Pengcheng, and He, Yakun (2015). Network kernel density estimation for the analysis of facility POI hotspots. Acta Geod. Cartogr. Sinica 44, 7.
Keywords: land use/cover change (LUCC), metro stations, landscape pattern, CA-Markov model, temporal and spatial evolution
Citation: Fu F, Jia X, Wu D, Zhao Q, Fang H, Lin L and Aye L (2023) Evolution and prediction of land use around metro stations. Front. Environ. Sci. 11:1106019. doi: 10.3389/fenvs.2023.1106019
Received: 23 November 2022; Accepted: 02 January 2023;
Published: 12 January 2023.
Edited by:
Yibin Ao, Chengdu University of Technology, ChinaReviewed by:
Gang Liu, Chengdu University of Technology, ChinaCopyright © 2023 Fu, Jia, Wu, Zhao, Fang, Lin and Aye. This is an open-access article distributed under the terms of the Creative Commons Attribution License (CC BY). The use, distribution or reproduction in other forums is permitted, provided the original author(s) and the copyright owner(s) are credited and that the original publication in this journal is cited, in accordance with accepted academic practice. No use, distribution or reproduction is permitted which does not comply with these terms.
*Correspondence: Dan Wu, ZGFuLnd1QHN3anR1LmVkdS5jbg==
Disclaimer: All claims expressed in this article are solely those of the authors and do not necessarily represent those of their affiliated organizations, or those of the publisher, the editors and the reviewers. Any product that may be evaluated in this article or claim that may be made by its manufacturer is not guaranteed or endorsed by the publisher.
Research integrity at Frontiers
Learn more about the work of our research integrity team to safeguard the quality of each article we publish.