 Shankar Acharya Kamarajugedda
 Justin Andrew Johnson3
 Perrine Hamel
- 1Asian School of the Environment, Nanyang Technological University, Singapore, Singapore
- 2Earth Observatory of Singapore, Nanyang Technological University, Singapore, Singapore
- 3Department of Applied Economics, University of Minnesota, Saint Paul, MN, United States
- 4The Nature Conservancy, Berlin, Germany
- 5CUNY Institute for Demographic Research, New York City, NY, United States
- 6Research Affiliate, Humboldt University, Berlin, Germany
Land-use land-cover (LULC) changes are occurring rapidly in Southeast Asia (SEA), generally associated with population growth, economic development and competing demands for land. Land cover change is one of the vital factors affecting carbon dynamics and emissions. SEA is an important region to study urban-caused LULC emissions and the potential for nature-based solutions (NBS) and nature climate solutions (NCS), as it is home to nearly 15% of the world’s tropical forests and has some of the world’s fastest rates of urban growth. We present a fine-scale urban cluster level assessment for SEA of current (2015) and future (2050) scenarios for carbon sequestration service and climate mitigation potential. We identified 956 urban clusters distributed across 11 countries of SEA. Considering the urban expansion projected and decline in forests, this region could see a carbon loss of up to 0.11 Gigatonnes (Scenario SSP4 RCP 3.4). Comparing carbon change values to urban emissions, we found that the average offset value ranging from −2% (Scenario SSP1 RCP 2.6) to −21%. We also found that a few medium and large urban clusters could add to more than double the existing carbon emissions in 2050 in the SSP3 and SSP4 RCP 3.4 scenarios, while a minority of clusters could offset their emissions under SSP1. Our study confirms that NCS, and particularly reforestation, are in many cases able to offset the direct emissions from land cover conversion from SEA urban clusters. Hence, documenting the plausible LULC transitions and the associated impacts gains significance in the SEA region as the results can be useful for informing policy and sustainable land management.
1 Introduction
The global urban population is predicted to increase by 2.5 billion between 2018 and 2050, with nearly 90 percent of that growth concentrated in Africa and Asia (UNPD, Department of Economic and Social Affairs and Population Division, 2019). This growth implies an increase in demand for residential, commercial, and industrial areas. In turn, this increase in demand would impact the climate system at various spatio-temporal scales due to changes in carbon storage and greenhouse gases emissions (GHG) (Chen et al., 2020). Understanding the possible impacts of future land changes is vital to shape an environmentally sustainable future.
Urban areas have significant emissions of GHG’s from energy consumption, accounting for an estimated 70% of global emissions which is equivalent to about 34.3 Billion Tons of CO2 per annum (Mutizwa-Mangiza et al., 2011). This paper focuses on the way expanding urban areas may directly convert habitat, releasing large amounts of carbon dioxide. While smaller in magnitude than urban emissions from energy consumption, emissions from land-use land-cover (LULC) change due to urban growth can be significant. A global study estimated that total emissions from urban-caused habitat loss would release 1.19 Gt·C between 2000–2030 (Mcdonald et al., 2018a; McDonald et al., 2018b), an annual rate that represents between 2.0% and 6.6% of total annual GHG emissions associated with global LULC change (Le Quéré et al., 2018).
As nations are planning to meet their nationally determined commitments (NDC’s) to climate mitigation, information about the magnitude of LULC change emissions resulting from urban growth can help craft these plans. One promising solution to minimize carbon emissions from LULC change is to promote Nature-Based Solutions (NBS) (Goldstein et al., 2020; Seddon et al., 2020; Koh et al., 2021; Teo et al., 2021), in particular nature climate solutions (NCS) (Osaka et al., 2021; Teo et al., 2021) that help protect, restore or improve the management of forests, croplands, grasslands and wetlands (Griscom et al., 2017; Goldstein et al., 2020; Zeng et al., 2020; Koh et al., 2021; Teo et al., 2021).
Southeast Asia (SEA) is an important region to study urban-caused LULC emissions and the potential for NCS, because it is home to nearly 15% of the world’s tropical forests (Stibig et al., 2014) and has some of the world’s fastest rates of urban growth (UNPD, Department of Economic and Social Affairs and Population Division, 2019). Between 2005 and 2015, the region lost about 80 million ha of forest translating to a loss rate (forest) of around 8 million ha·yr−1 (Estoque et al., 2019). Deforestation in the region is attributed to rapid urbanization, food production, and agriculture (Sodhi et al., 2010; Imai et al., 2018; Zeng et al., 2018). Such LULC changes impact the carbon cycle and the amount of carbon emissions from the region (Diao et al., 2020). Globally, tropical moist forests have the largest irrecoverable carbon pool, estimated at more than 70 Gt (Goldstein et al., 2020). “Irrecoverable carbon” identifies the carbon stock in the biosphere based on three criteria: 1) It can be influenced by direct and local human action (“manageability”), 2) it is vulnerable to loss upon disturbance (“vulnerability”) and 3) it could not be recovered within a given timeframe (“recoverability”) (Folke et al., 2021; Noon et al., 2022). It is estimated that based on the current loss rate, approximately 0.8 Gt of irrecoverable carbon annually is released to the atmosphere due to land-use change (Goldstein et al., 2020). Hence it is vital to inform policy and planning for protecting existing vulnerable carbon and restoring new carbon stocks (Koh et al., 2021).
Recently, studies have incorporated scenario simulations based on the Intergovernmental Panel on Climate Change (IPCC)—Shared Socioeconomic Pathways (SSPs) employing a land change modelling approach and using remotely sensed data to assess potential pathways and explore uncertainties of future socio-economic factors (Chaplin-Kramer et al., 2019; Estoque et al., 2019; Chen et al., 2020; Gao and O’Neill, 2020; Hurtt et al., 2020). However, the SSP’s are primarily designed for global scale projections and thus, there is a need to spatially allocate these projections at a higher spatial resolution to facilitate regional or local studies (Estoque et al., 2019). A global study by Chaplin-Kramer et al. (2019) examines changes from current (2015) conditions to the future (2050) under scenarios of land-use, climate, and population change according to the SSP’s. This study provides insight into the potential number of people being affected globally with respect to change in water pollution, coastal risk and lost crop production via the scenario-based analysis (2015–2050). Scenario analysis has been useful for assessing socio-ecological impacts of interventions, and is thus an integral part of decision-making process as it provides a structured process of evaluating alternatives to gain insights into plausible rather than probable futures (Peterson et al., 2003; Sleeter et al., 2012; Kubiszewski et al., 2017).
Also studies that focused on carbon dynamics found that NBS or NCS could contribute substantially to climate change mitigation via the protection, restoration, and improved management of forests, agricultural lands, grasslands and wetlands (Griscom et al., 2017; Goldstein et al., 2020; Koh et al., 2021; Teo et al., 2021; Dong et al., 2022). However, the literature to date indicates that a more comprehensive spatiotemporal characterization of urban growth and associated land cover transitions in SEA cities is still lacking along with the dynamics of LULC change scenarios on carbon sequestration services (Samek et al., 2012; Imai et al., 2018; Zeng et al., 2018; Estoque et al., 2019).
With urban areas, expansion patterns show high degrees of spatial heterogeneity, thereby making the use of high-resolution LULC inputs necessary. In this study, we use a downscaled LULC SSP scenario dataset to assess the LULC transitions between 2015 and 2050 for SEA urban clusters. Our key research questions are:
• How is regional LULC change between 2015 and 2050 likely to impact land cover in SEA urban clusters, under each of the five SSP—RCP scenarios which represent different levels of major drivers such as economic development, urbanization, and population growth?
• What is the likely amount of vulnerable carbon (sensu Goldstein et al., 2020) released from urban-caused LULC change, for each urban cluster and for the region?
• How do these urban-caused LULC emissions compare in magnitude with other GHG emissions from the urban clusters?
2 Materials and methods
2.1 SEA urban cluster definition and delineation
A recent study by Chen et al (2020) compared multiple global gridded population datasets for their applicability in regional studies and their accuracy w.r.t statistical data across cities. Results indicated that the population values within the gridded population of the world (GPW) version 4.0 dataset and Global Human Settlement Layer (GHSL) dataset are closest to the statistical value. Also, the absolute value for the relative error of total population is the smallest for GPW v4.0 being within 3% compared to WorldPop and History Database of the Global Environment version 3.2 (HYDE) datasets (Chen et al., 2020). In this study. We used the (GPW) version 4.0 population dataset containing a raster grid of 30 arc-second spatial resolution. This dataset contains gridded population count and population density, as well as the corresponding U.N adjusted values, for years 2000, 2005, 2010, 2015, and 2020 (Doxsey-Whitfield et al., 2015). Following recent international guidelines (Brandmüller et al., 2020), we delineated the urban clusters from the gridded population datasets for the year 2015. An urban cluster (or moderate density clusters) consists of contiguous grid cells with a density of at least 300 inhabitants per km2 and has a population of at least 5,000 in the cluster.
We obtained 956 urban clusters in the SEA region based on 2015 population data. The clusters are distributed among all the 11 countries in the SEA region (Figure 1A). Each of the 11 SEA countries had between 1 (Singapore) and 93 (Indonesia) clusters, except the Philippines that had a very high number of urban clusters (659, Supplementary Figure S1A). This may be due to the topographic structure of the nation and due to considering many small islands. Around 56% of the total number of clusters range within 10 and 50 km2 (Supplementary Figure S1B). There are also around 37 clusters whose size is greater than 1,000 km2.
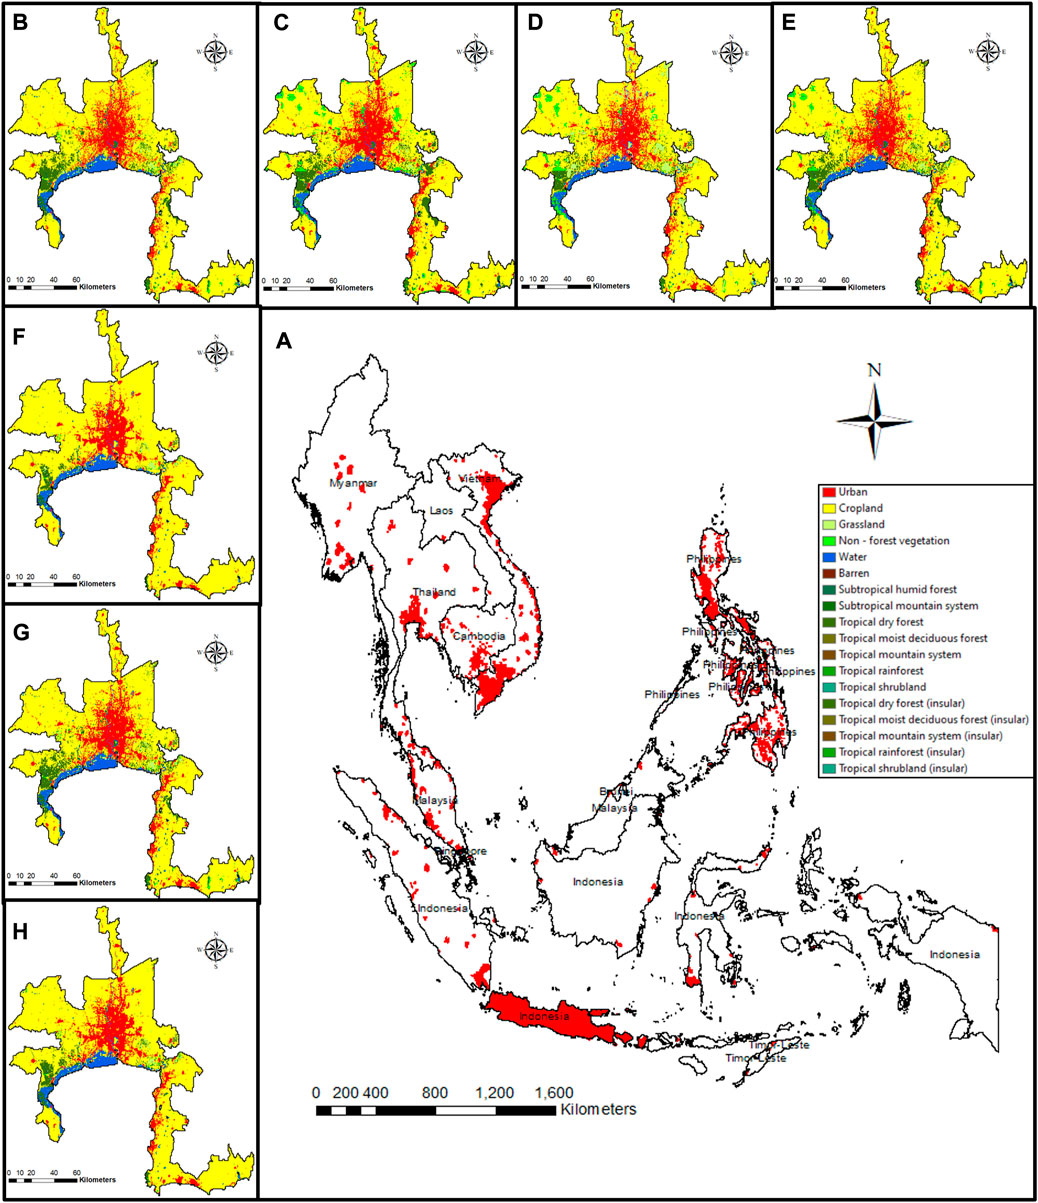
FIGURE 1. (A) SEA urban clusters (in red) derived for year 2015 based on GPWv4 population data; (B) 2015 Bangkok urban cluster land cover map; Bangkok urban cluster projected land cover map for the year 2050 for (C) SSP1 RCP 2.6; (D) SSP2 RCP 4.5; (E) SSP3 RCP 7.0; (F) SSP4 RCP 3.4; (G) SSP4 RCP 6.0; (H) SSP5 RCP 8.5. Only the urban land use legend (clusters) are depicted in panel (A) for clarity.
2.2 LULC change analysis within urban clusters
The primary LULC dataset used in this study was created by downscaling land-use change data from the Land Use Harmonization 2 (LUH2) Integrated Assessment Model datasets (Hurtt et al., 2020). The LUH2 data are reported at 30 km resolution, which is too coarse for our study, so we used downscaled versions of the LUH2 data that provided 10 arc-second (approximately 300 m at the equator) resolution LULC maps for each SSP scenario using the Spatial Economic Allocation Landscape Simulator (SEALS) model, documented in Johnson et al. (2020); Suh et al. (2020); Johnson et al. (2021). The LULC dataset we created is one of the few publicly available high-resolution products, allowing a finer understanding of LULC transition of seven major classes (water, forest, grassland, cropland, urban, barren and non-forested vegetation). Using these downscaled maps, we computed LULC transition graphs between 2015 and 2050 for each scenario. Further, a comparison analysis was performed with alternative urban scenario (SSP) global datasets to compare the accuracy of the dataset. The datasets used for comparison are the Global National Total Amounts of Urban Land, SSPs and Base Year, v1 (2000–2100) (Gao and O’Neill, 2020) and Global projections of future urban land expansion under SSPs (Chen et al., 2020). The data values in the Gao and O’Neill, 2020 dataset were only available between 2000 and 2100 for every 10-year interval. So, we first interpolated the dataset by country between 2000 and 2100. We then extracted the 2015 value via the best fit trendline between the datapoints (between 2000 and 2,100–10-year interval) Comparison was performed at the SEA level although all three models are developed at the global scale. Note that the (Gao and O’Neill, 2020) dataset had projections (SSP scenarios) for year 2015. However, for Chen et al. (2020) and Johnson et al. (2020), the base data year was 2015. Also, of note the results for Singapore have not been included in the following sections considering the non-comprehensive LULC data coverage for Singapore urban cluster.
2.3 Carbon storage and sequestration modelling
For the analyses, we used InVEST Carbon storage and sequestration model (standard and “forest edge” versions, v3.9.0), which represents a stock estimation (Sharp et al., 2021). GIS analysis, data organisation, and visualisation were conducted in ArcGIS 10.8 (ESRI). To obtain carbon pool values for aboveground and belowground biomass, we used the CDIAC (Carbon Dioxide Information Analysis Center) global database of consistent and spatially explicit estimates of vegetation carbon stocks, circa 2000, following the IPCC methodology (Ruesch, 2008). CDIAC also provides a global ecofloristic zones shapefile which was integrated into the LULC datasets in our study. These zones were integrated via spatial processing methods by which the existing forest land cover category was enhanced by deriving the sub forest types in this region.
To obtain soil carbon pool values, we used the Global Soil Organic Carbon (GSOC) map, the first global soil organic carbon map ever produced via a consultative and participatory process involving member countries (FAO, 2018). The LULC data with respective classes were overlaid with the GSOCmap to extract the mean SOC values for each class which were used in the analysis. The interface between agro soil-traits and the weather conditions could influence the growth of local species of plants for carbon storage/sequestration potential at plant species scale. However, this study is addressed at regional scale (300 m spatial resolution) and at land cover level so that we incorporated the Ecofloristic zones classification within SEA region to identify and understand the biomass properties of different types of forest cover from the CDIAC carbon pool database.
The biophysical table derived from these datasets, required for the InVEST model, is provided in Supplementary Table S1. Due to the unavailability of consistent data for dead carbon pools which mainly include litter as well as lying and standing dead wood, they have not been considered for this study.
2.4 Uncertainty assessment
We performed an uncertainty assessment for the carbon sequestration analysis for SEA urban clusters. For this, we first compared the results from the two carbon storage models (basic and forest edge versions of the InVEST model), and then extracted the available carbon pool data from another global database ForC (Anderson-Teixeira et al., 2018). ForC is the largest database of ground-based measurements of forest ecosystem carbon stocks and annual fluxes. However, the carbon pool data were only available for tropical dry forests, tropical moist deciduous forests and tropical shrubland for SEA urban clusters. Using these carbon pool data for the new database, a modified biophysical table was generated and the InVEST carbon model was run to extract the new carbon storage and sequestration values for SEA urban clusters. The new results were used for uncertainty assessment through comparison with the CDIAC carbon pool database.
2.5 Assessing carbon emission mitigation potential
Carbon sequestration or losses were compared to the CO2 emissions from the Emissions Database for Global Atmospheric Research inventory database v5.0 (Crippa et al., 2019). The emission values for the year 2018 were extracted for all the urban clusters in the region. Zonal statistics were applied to extract the total emission per cluster using the 0.10 resolution gridded CO2 emissions dataset. For those few urban clusters smaller than the grid cell resolution, the emission value of the grid cell was normalized with the cluster area within the grid cell to extract the value for the urban cluster.
3 Results
3.1 SSP dataset comparison
Urban cluster areas extracted for the SEA region in the adopted model (Johnson et al., 2020; Figure 1A) were close, ranging between “2% in SSP3 to 50% in SSP5”, to the (Gao and O’Neill, (2020)) reported model values (Supplementary Table S2). The rate of increase between 2015 and respective 2050 SSP scenarios were very similar between the two land use change models, within (+/−) 25% difference, except for the SSP1 scenario (71%, Supplementary Table S2). In general, the urban areas reported by the Chen et al. (2020) model were consistently lower than the Johnson et al. (2020) and the (Gao and O’Neill, (2020)) models, with a similar pattern observed for the rate of increase (%). This analysis confirms the discrepancies in the global urban areas projected under the SSP’s among various global datasets considering the underlying modelling frameworks and base data sources used in each of the model. Also, the Johnson et al (2020) dataset one of the few publicly available high-resolution products, allowing a finer understanding of LULC transition of seven major classes while both the Chen et al. (2020) and the (Gao and O’Neill, (2020)) datasets only consider urban land cover class.
3.2 LULC change analysis within urban clusters
The land-use and land-cover change components of the baseline SSP scenarios cover a broad range of possible futures based on the respective scenario narrative (Riahi et al., 2017). Our study shows that SSP1, SSP4 RCP 6.0, and SSP5 scenarios have higher urban expansion in urban clusters compared to SSP2, SSP3, and SSP4 RCP 3.4 (Figure 2). These observed urbanization patterns were similar to the global projected urbanization rates for SSP scenarios as reported by (Riahi et al., 2017). The study by Riahi et al. (2017) also reports that in SSP3 scenario, urbanization is constrained by slow economic growth. Similarly, our study observed lowest urban growth between 2015 and 2050 for SSP3 RCP 7.0. Most scenarios except SSP2 and SSP4 RCP 3.4 showed a reduction in cropland area between 2015 and 2050 in urban clusters. For forest areas, all scenarios except SSP1 show a reduction between 2015 and 2050 with highest in SSP4 RCP 3.4 (Figure 2). The observed forest increase in the SSP1 RCP 2.6 scenario in our study is consistent with the narrative of this scenario depicting a gradual, global-scale, and pervasive expansion of forests due to little pressure on land resources via low population projections and high agricultural productivity (Riahi et al., 2017). These patterns are observed within the Bangkok urban cluster and illustrated in Figure 1B–H. Based on these results and land cover transition patterns in Figure 2, we propose an urban scenario interpretation for SEA urban clusters:
a. SSP1 RCP 2.6—Urban sprawl and reforestation, where urban growth is highest amongst all scenarios and the only scenario with increase in forest, and reduction in cropland.
b. SSP2 RCP 4.5—Compact urbanization with moderate agriculture, where there is moderate increase in urban with moderate cropland expansion and forest loss.
c. SSP3 RCP 7.0—Compact urbanization with minimal land use change, where most vegetation loss is in terms of forest and crops but a slight increase in pastures.
d. SSP4 RCP 3.4—Compact urbanization with extensive agriculture, where there is compact urban growth with high cropland expansion and forest loss.
e. SSP4 RCP 6.0—Urban sprawl with grassland increase, where there is high urban growth with most green loss in terms of forest and crops but increase in pastures.
f. SSP5 RCP 8.5—Urban sprawl with minimal land use change, where there is high urban growth encroaching on agriculture and forest.
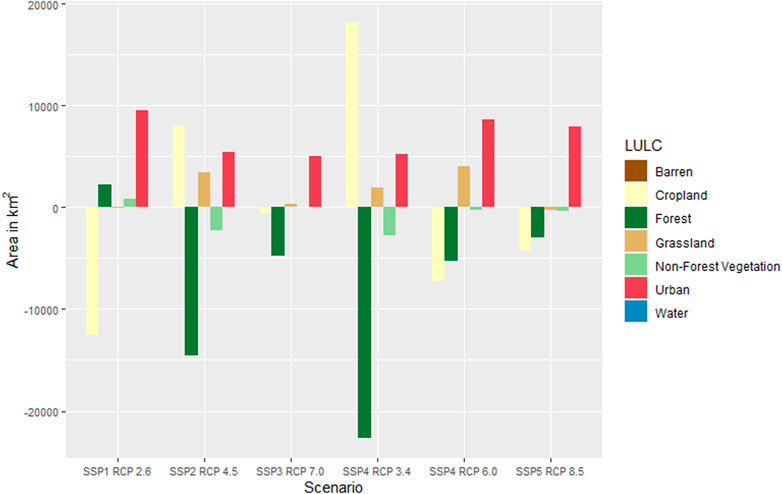
FIGURE 2. LULC transition between 2015 and 2050 scenarios for SEA urban clusters—scenario-based comparison.
3.3 Carbon storage and sequestration within urban clusters
Except for SSP1 RCP 2.6 (Urban sprawl and reforestation), all scenarios show that urban clusters will have emitted carbon between 2015 and 2050 as shown in Figure 3. SSP1 RCP 2.6 (Urban sprawl and reforestation) shows carbon sequestration mainly attributed to the increase in forest area between 2015 and 2050 indicating around 0.01 Gigatonnes of potential carbon to be sequestered. SSP2 (Compact urbanization with moderate agriculture) and SSP4 RCP 3.4 (Compact urbanization with extensive agriculture) show higher carbon emitted compared to other three scenarios—attributed to having higher decrease in forest area compared to others (Figure 3). Considering the urban sprawl and decline in forests projected, this region could see a carbon loss of up to 0.11 Gigatonnes (SSP4 RCP 3.4).
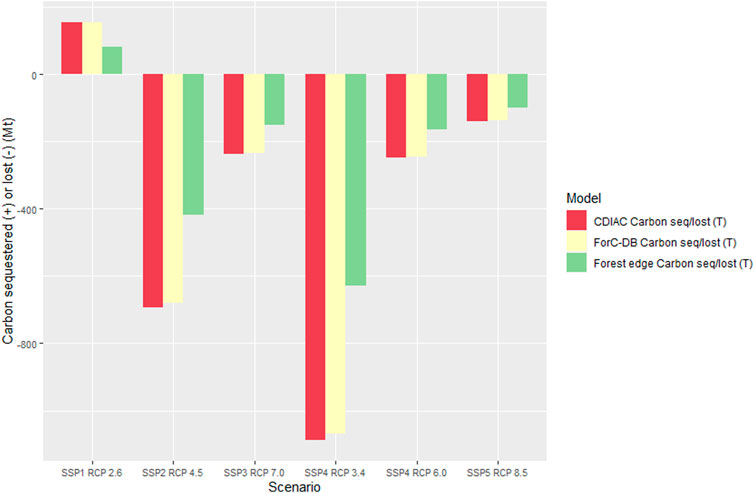
FIGURE 3. Comparison between CDIAC, ForC-DB and Forest edge carbon pools for the carbon sequestered (positive values) or lost (negative values) between 2015 and 2050 SSP scenarios.
Our uncertainty assessment reveals that the overall difference between the carbon values derived using the two carbon pools databases (CDIAC and For-C) is very minimal ranging from −0.28% for SSP1 RCP 2.6 to −2.11% for SSP5 RCP 8.5 (Figure 3). We also observed that the overall difference between the carbon values derived using the two InVEST carbon models (Carbon model and Forest carbon edge effect) ranges from −28% for SSP5 RCP 8.5 to −47% for SSP1 RCP 2.6.
Carbon change values normalized by urban cluster area (km2) help compare carbon sequestration and loss values across all urban clusters. The spread of the distribution varies across scenarios (Figure 4). SSP1 RCP 2.6 (Urban sprawl and reforestation) shows the least spread due to its emphasis on increase in forests. This scenario minimizes carbon losses for the majority of urban clusters in SEA. Higher spread of carbon change values is observed in SSP4 RCP 3.4 and SSP2 RCP 4.5 scenarios, which correspond to the highest median carbon losses as well.
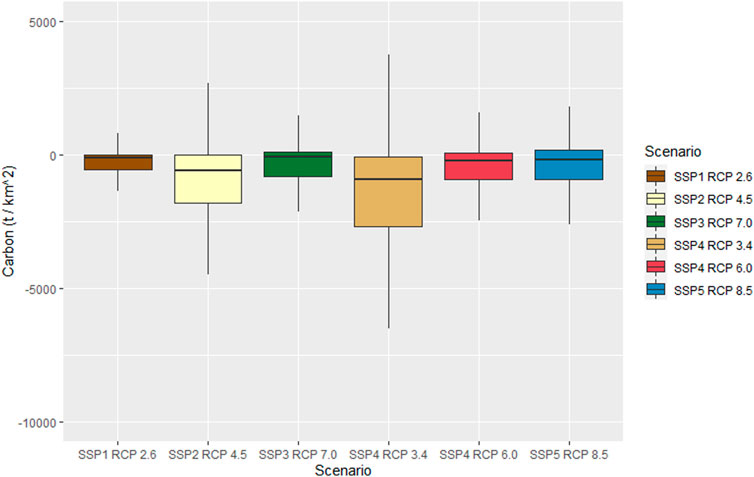
FIGURE 4. Box plot representing the spread of carbon change (t) for the SEA urban clusters normalized with their respective size (km2) for the SSP scenarios.
Interestingly, there are clusters emitting carbon and clusters sequestering carbon in each scenario. Therefore, we further examined the distribution of urban clusters according to their change in carbon values between 2015 and 2050 across scenarios. We grouped them into four classes representing: 1) Clusters that lost carbon under all scenarios; 2) clusters that sequestered carbon under all scenarios; 3) clusters that have not experienced any change under any scenario; and 4) clusters that either lost or gained carbon depending on the scenario. The analysis aimed to identify clusters which are more likely to sequester carbon or lose carbon by 2050, irrespective of the SSP scenarios. We found that 9% of the urban clusters (85 clusters) are likely to sequester carbon and 46% (438 clusters) are likely to lose carbon in every scenario (Figure 5). 40% (382 clusters) have mixed projections; and 5% (51 clusters) are projected not to change under any scenario. The Philippines and Timor Leste show a majority of urban clusters that are likely to lose carbon (Figure 5). There are also urban clusters sequestering carbon under every scenario for most countries except Brunei, Laos, and Timor Leste.
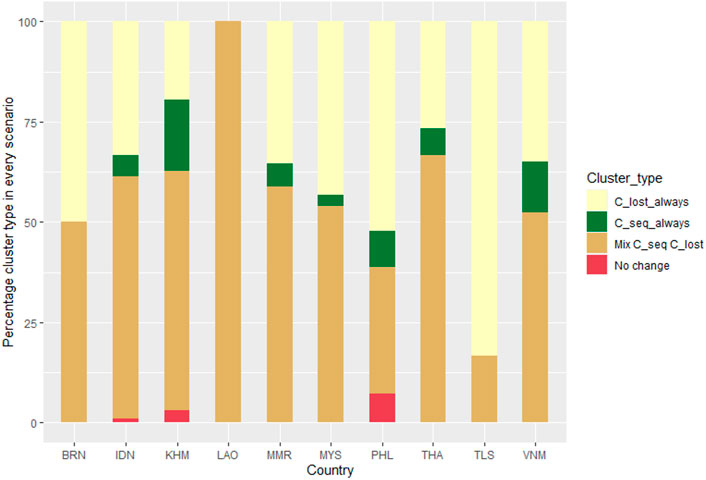
FIGURE 5. Distribution of urban clusters which are either sequestering carbon or losing carbon in every scenario country wise.
3.4 Interpreting carbon values and identifying potential sustainable strategies and mitigation effects of carbon loss
Comparing carbon change values to urban emissions, we found that the average offset value ranging from −2% (Scenario SSP1 RCP 2.6) to −21% (Scenario SSP4 RCP 3.4, Supplementary Figure S2). We also grouped urban clusters by size: small (0–100 km2), medium (100–500 km2) and large (>500 km2), to examine whether these offset values were driven by the urban extent of the city (Figure 6). Indeed, small urban clusters have higher spread of offset % except for SSP 1 scenario (Urban sprawl and reforestation) compared to medium and large clusters. This is an indication that the LULC changes in the smaller clusters depending on their major land cover influences the magnitude of the offset in the SEA region across the SSP’s. SSP 1, due to reforestation, is the only scenario with a positive average carbon offset for large clusters. Overall, Figure 6 indicates that majority of urban clusters in SEA, irrespective of their sizes, are still contributing to carbon emissions for all scenarios except SSP1 RCP 2.6. Even with the reforestation scenario, the majority of urban clusters will only offset 1% of their carbon emissions by the scenarios we modelled (results not shown).
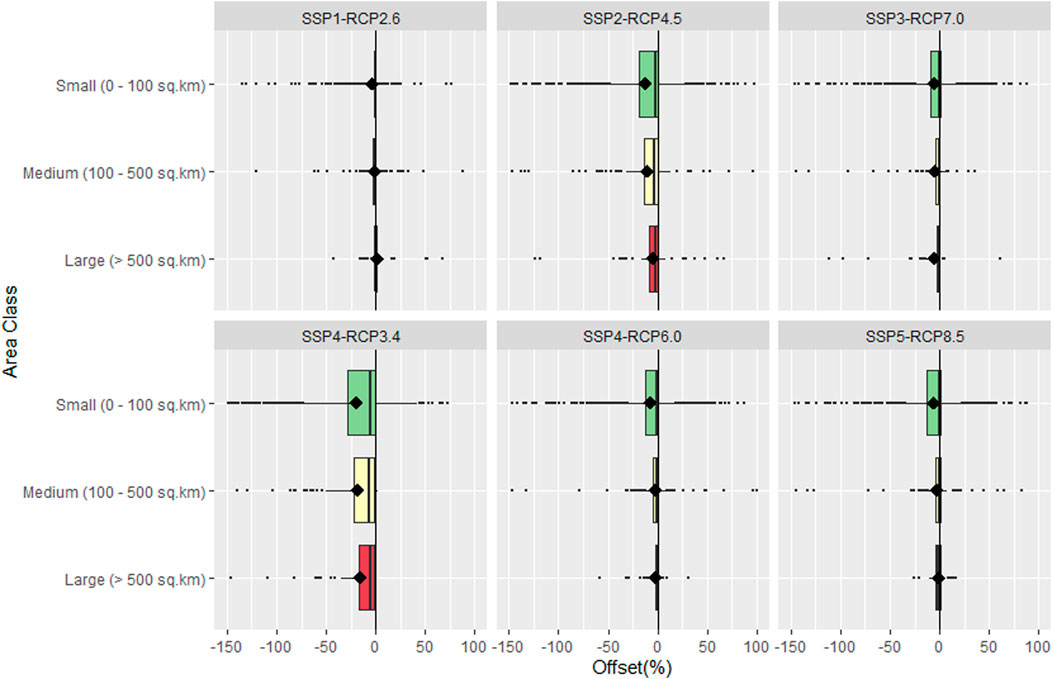
FIGURE 6. Percentage of urban cluster carbon emissions that offset (positive %) or add to (negative %) clusters’ carbon emissions for SEA urban clusters (distribution by cluster size); Diamond point (black) indicating the mean of the data.
Finally, we also investigated the historical trend of land cover change between 2010 and 2015. 360 urban clusters out of 956 have sequestered carbon between 2010 and 2015. Most of these urban clusters are projected to lose carbon in 2050 for all the SSP scenarios (Comparison of Offset % of these clusters with the total urban clusters is shown in Supplementary Figure S2).
4 Discussion
The SEA region could have emissions of vulnerable carbon up to 0.11 Gigatonnes. However, emissions varied significantly by scenario. As would be expected, SSP1 (Urban sprawl and reforestation), SSP4 RCP 6.0 (Urban sprawl with grassland increase), and SSP5 (Urban sprawl with minimal land use change) scenarios have indicated higher urban sprawl in urban clusters compared to SSP2 (Compact urbanization with moderate agriculture), SSP3 (Compact urbanization with minimal land use change) and SSP4 RCP 3.4 (Compact urbanization with extensive agriculture). The LULC transition patterns between 2015 and 2050 observed for SEA urban clusters illustrate the SSP definition (O’Neill et al., 2014; O’Neill et al., 2017; Riahi et al., 2017; Hurtt et al., 2020), enhanced by our urban scenario interpretation. All scenarios except for SSP1 show a reduction in forest area between 2015 and 2050 with highest in SSP4 RCP 3.4. This reforestation trend in SSP1 drives one of our main findings, SSP1 is the only scenario with a positive average offset (for large clusters, Figure 6). For all other scenarios, our results confirm the large impact of urban land expansion on carbon emissions (Goldstein et al., 2020; Koh et al., 2021), with a few medium and large urban clusters in SEA that could more than double existing carbon emissions in 2050 in the SSP3 and SSP4 RCP 3.4 scenarios. Most scenarios except for SSP2 and SSP4 RCP 3.4 also showed a reduction in cropland area in urban clusters between 2015 and 2050, confirming global trends (Bren d’Amour et al., 2017). We also found that 9% of the urban clusters are likely to sequester carbon and 46% are likely to lose carbon in every scenario. Acknowledging the limitations of our modelling exercise, discussed below, this suggests that the trends (positive or negative carbon changes) for these clusters are robust to regional changes. At the national scale, such trends also encourage governments to think about how urban growth is occurring (i.e., sprawl vs. compact) as part of a strategy to achieve NDCs. Growth in cities that result in minimum carbon loss should be encouraged, mitigating the growth in high-carbon loss cities.
Importantly, the modelling assumptions used in the LULC change model impact the modelling results, specifically the way the model handles the regional drivers of urban population, forest, and agricultural changes (Johnson et al., 2020). The urban population driver ignores the effect of urban growth policies implemented by local or national government. However this assumption is supported by recent studies suggesting that population is the main driver of urban land expansion, more so than economic growth (Mahtta et al., 2022). This is especially true in cities with weak governance in Southeast Asia (Mahtta et al., 2022). Yet, it is important to consider the potential of urban policies to mitigate the loss in carbon sequestration. For example, a study by Teo et al. (2021) recently estimated the climate mitigation potential of reforestation within grass or shrubs areas in cities and compared it to the total carbon emissions from each city globally. Four of the six SSP scenarios especially SSP2, SSP3, and SSP4 (both RCPs) in our study have shown an increase in grassland area between 2015 and 2050 ranging from 348 km2 to 4,025 km2. Considering the potential of this approach for reducing carbon emissions, reforestation of these grass areas could further offset the carbon emissions in the urban clusters.
Forests in and around urban areas provide valuable ecosystem services in addition to carbon storage, such as air quality benefits, urban heat reduction, runoff prevention and the mental and physical health benefits of exposure to nature (Mcdonald et al., 2018a; Keeler et al., 2019). Studies have reported that over the last few decades there has been an unprecedented loss of forests in the SEA region, owing to a multitude of anthropogenic activities (Samek et al., 2012; Imai et al., 2018; Estoque et al., 2019). Addressing this aspect in our study, reforestation policies under SSP1 help in increasing forests via reduction in cropland and grasslands and thus increase carbon sequestration and other support associated ecosystem services. However, our research highlights that across all scenarios, avoiding forest conversion could prevent the release of vulnerable carbon. Avoiding forest conversion through land protection or other conservation activities appears to be potentially an important NCS for the SEA region, across all scenarios. Considering the growing interest in NBS for climate mitigation potential, creating awareness for conservation programmes and informing policy and planning about the potential losses could help implement sustainable development strategies (Koh et al., 2021).
5 Conclusion
We used a 300-m resolution LULC change model to quantify the plausible LULC transitions between 2015 and 2050 under SSP-RCP scenarios for SEA urban clusters and assessed the carbon sequestration and emission potential. Our results indicated that under the SSP4 RCP 3.4 scenario (Compact urbanization with extensive agriculture) there could be a carbon loss of up to 0.11 Gigatonnes between 2015 and 2050. This scenario has the highest decrease in forest area compared to other SSP scenarios. Conversely, the SSP1 scenario (Urban sprawl and reforestation) indicates that the SEA urban clusters could sequester around 0.01 Gigatonnes of carbon between 2015 and 2050. This is due to an increase in forested areas, not to the larger extent of urban extent (reflected in the title “urban sprawl”), which is only relative to other scenarios. By comparing the carbon stock changes obtained via the six SSP scenarios with carbon emissions from corresponding cities, we found that a few medium and large urban clusters could add to more than double the existing carbon emissions in 2050 in the SSP3 and SSP4 RCP 3.4 scenarios, while a minority of clusters could offset their emissions under SSP1. Yet, even with the reforestation scenario, the majority of urban clusters will only offset 1% of their carbon emissions. Our study confirms that NCS, and particularly reforestation, are in many cases able to offset the direct emissions from land cover conversion from SEA urban clusters.
Data availability statement
The raw data supporting the conclusion of this article will be made available by the authors, without undue reservation.
Author contributions
SK, PH, RM, and JJ contributed to conception and design of the study. JJ provided the landcover dataset. SK arranged the database and performed statistical analysis. SK and PH performed the visualization. SK and PH wrote the first draft of the manuscript. JJ and RM reviewed the first draft and provided necessary input. All authors contributed to manuscript revision, read, and approved the submitted version.
Funding
This study was funded by the National Research Foundation, Prime Minister’s Office, Singapore (Grant number: NRF-NRFF12-2020-0009).
Conflict of interest
Author RM was employed by The Nature Conservancy.
The remaining authors declare that the research was conducted in the absence of any commercial or financial relationships that could be construed as a potential conflict of interest.
Publisher’s note
All claims expressed in this article are solely those of the authors and do not necessarily represent those of their affiliated organizations, or those of the publisher, the editors and the reviewers. Any product that may be evaluated in this article, or claim that may be made by its manufacturer, is not guaranteed or endorsed by the publisher.
Supplementary material
The Supplementary Material for this article can be found online at: https://www.frontiersin.org/articles/10.3389/fenvs.2023.1105759/full#supplementary-material
References
Anderson-Teixeira, K. J., Wang, M. M. H., McGarvey, J. C., Herrmann, V., Tepley, A. J., Bond-Lamberty, B., et al. (2018). ForC: A global database of forest carbon stocks and fluxes. Ecology 99, 1507. doi:10.1002/ecy.2229
Brandmüller, T., Corbane, C., Poelman, H., Bolliger, F., and Castillo, M. (2020). A recommendation on the method to delineate cities, urban and rural areas for international statistical comparisons. European Commission – eurostat and DG for Regional and Urban Policy – ILO, FAO, OECD, UN-Habitat World Bank. Available at: https://ec.europa.eu/eurostat/cros/system/files/bg-item3j-recommendation-e.pdf (Accessed November 2, 2021).
Bren d’Amour, C., Reitsma, F., Baiocchi, G., Barthel, S., Güneralp, B., Erb, K. H., et al. (2017). Future urban land expansion and implications for global croplands. Proc. Natl. Acad. Sci. 114, 8939–8944. doi:10.1073/pnas.1606036114
Chaplin-Kramer, R., Sharp, R. P., Weil, C., Bennett, E. M., Pascual, U., Arkema, K. K., et al. (2019). Global modeling of nature’s contributions to people. Science 366, 255–258. doi:10.1126/science.aaw3372
Chen, G., Li, X., Liu, X., Chen, Y., Liang, X., Leng, J., et al. (2020a). Global projections of future urban land expansion under shared socioeconomic pathways. Nat. Commun. 11, 537. doi:10.1038/s41467-020-14386-x
Chen, R., Yan, H., Liu, F., Du, W., and Yang, Y. (2020b). Multiple global population datasets: Differences and spatial distribution characteristics. ISPRS Int. J. Geo-Information 9, 637. doi:10.3390/ijgi9110637
Crippa, M., Monforti-Ferrario, F., Oreggioni, G., Schaaf, E., Guizzardi, D., Olivier, J. G. J., et al. (2019). Fossil CO2 and GHG emissions of all world countries: 2019 report(Luxembourg: . LU: Publications Office of the European Union). Available at: https://data.europa.eu/doi/10.2760/687800 (Accessed October 26, 2021).
Diao, J., Liu, J., Zhu, Z., Li, M., and Sleeter, B. M. (2020). Substantially greater carbon emissions estimated based on annual land-use transition data. Remote Sens. 12, 1126. doi:10.3390/rs12071126
Dong, H., Huang, Q., Zhang, F., Lu, X., Zhang, Q., Cao, J., et al. (2022). Path of carbon emission reduction through land use pattern optimization under future scenario of multi-objective coordination. Front. Environ. Sci. 10, 1065140. doi:10.3389/fenvs.2022.1065140
Doxsey-Whitfield, E., MacManus, K., Adamo, S. B., Pistolesi, L., Squires, J., Borkovska, O., et al. (2015). Taking advantage of the improved availability of census data: A first look at the gridded population of the world, version 4. Pap. Appl. Geogr. 1, 226–234. doi:10.1080/23754931.2015.1014272
Estoque, R. C., Ooba, M., Avitabile, V., Hijioka, Y., DasGupta, R., Togawa, T., et al. (2019). The future of Southeast Asia’s forests. Nat. Commun. 10, 1829. doi:10.1038/s41467-019-09646-4
FAO (2018). Global soil organic carbon map (GSOCmap): Technical report. Rome, Italy: FAO. Available at: https://www.fao.org/documents/card/en/c/I8891EN (Accessed October 26, 2021).
Folke, C., Polasky, S., Rockström, J., Galaz, V., Westley, F., Lamont, M., et al. (2021). Our future in the Anthropocene biosphere. Ambio 50, 834–869. doi:10.1007/s13280-021-01544-8
Gao, J., and O’Neill, B. C. (2020). Mapping global urban land for the 21st century with data-driven simulations and Shared Socioeconomic Pathways. Nat. Commun. 11, 2302. doi:10.1038/s41467-020-15788-7
Goldstein, A., Turner, W. R., Spawn, S. A., Anderson-Teixeira, K. J., Cook-Patton, S., Fargione, J., et al. (2020). Protecting irrecoverable carbon in Earth’s ecosystems. Nat. Clim. Chang. 10, 287–295. doi:10.1038/s41558-020-0738-8
Griscom, B. W., Adams, J., Ellis, P. W., Houghton, R. A., Lomax, G., Miteva, D. A., et al. (2017). Natural climate solutions. PNAS 114, 11645–11650. doi:10.1073/pnas.1710465114
Hurtt, G. C., Chini, L., Sahajpal, R., Frolking, S., Bodirsky, B. L., Calvin, K., et al. (2020). Harmonization of global land use change and management for the period 850–2100 (LUH2) for CMIP6. Geosci. Model. Dev. 13, 5425–5464. doi:10.5194/gmd-13-5425-2020
Imai, N., Furukawa, T., Tsujino, R., Kitamura, S., and Yumoto, T. (2018). Factors affecting forest area change in Southeast Asia during 1980-2010. PLoS ONE 13, e0197391. doi:10.1371/journal.pone.0197391
Johnson, J. A., Baldos, U., Hertel, T., Liu, J., Nootenboom, C., Polasky, S., et al. (2020). Global futures: Modelling the global economic impacts of environmental change to support policy-making world wildlife fund UK. Available at: https://www.gtap.agecon.purdue.edu/resources/download/10281.pdf (Accessed January 26, 2022).
Johnson, J. A., Ruta, G., Baldos, U., Cervigni, R., Chonabayashi, S., Corong, E., et al. (2021). The economic case for nature : A global Earth-economy model to assess development policy pathways. Washington DC; The World Bank. Available at: https://openknowledge.worldbank.org/entities/publication/fcc11682-c752-51c4-a59f-0ab5cd40dc6f.
Keeler, B. L., Hamel, P., McPhearson, T., Hamann, M. H., Donahue, M. L., Meza Prado, K. A., et al. (2019). Social-ecological and technological factors moderate the value of urban nature. Nat. Sustain 2, 29–38. doi:10.1038/s41893-018-0202-1
Koh, L. P., Zeng, Y., Sarira, T. V., and Siman, K. (2021). Carbon prospecting in tropical forests for climate change mitigation. Nat. Commun. 12, 1271. doi:10.1038/s41467-021-21560-2
Kubiszewski, I., Costanza, R., Anderson, S., and Sutton, P. (2017). The future value of ecosystem services: Global scenarios and national implications. Ecosyst. Serv. 26, 289–301. doi:10.1016/j.ecoser.2017.05.004
Le Quéré, C., Andrew, R. M., Friedlingstein, P., Sitch, S., Pongratz, J., Manning, A. C., et al. (2018). Global carbon budget 2017. Earth Syst. Sci. Data 10, 405–448. doi:10.5194/essd-10-405-2018
Mahtta, R., Fragkias, M., Güneralp, B., Mahendra, A., Reba, M., Wentz, E. A., et al. (2022). Urban land expansion: The role of population and economic growth for 300+ cities. npj Urban Sustain 2, 5–11. doi:10.1038/s42949-022-00048-y
Mcdonald, R., Colbert, M., Hamann, M., Simkin, R., Walsh, B., Ascensão, F., et al. (2018a). Nature in the urban century: A global assessment of where and how to conserve nature for biodiversity and human wellbeing. Report. The Nature Conservancy.
McDonald, R. I., Güneralp, B., Huang, C. W., Seto, K. C., and You, M. (2018b). Conservation priorities to protect vertebrate endemics from global urban expansion. Biol. Conserv. 224, 290–299. doi:10.1016/j.biocon.2018.06.010
Mutizwa-Mangiza, S., Naison, D., Arimah, Ben. C., Jensen, I., Yemeru, E. A., and Kinyanjui, M. K. (2011). Cities and climate change global report on human settlements 2011. Earthscan. Available at: https://unhabitat.org/sites/default/files/download-manager-files/Cities%20and%20Climate%20Change%20Global%20Report%20on%20Human%20Settlements%202011.pdf (Accessed January 26, 2022).
Noon, M. L., Goldstein, A., Ledezma, J. C., Roehrdanz, P. R., Cook-Patton, S. C., Spawn-Lee, S. A., et al. (2022). Mapping the irrecoverable carbon in Earth’s ecosystems. Nat. Sustain 5, 37–46. doi:10.1038/s41893-021-00803-6
O’Neill, B. C., Kriegler, E., Ebi, K. L., Kemp-Benedict, E., Riahi, K., Rothman, D. S., et al. (2017). The roads ahead: Narratives for shared socioeconomic pathways describing world futures in the 21st century. Glob. Environ. Change 42, 169–180. doi:10.1016/j.gloenvcha.2015.01.004
O’Neill, B. C., Kriegler, E., Riahi, K., Ebi, K. L., Hallegatte, S., Carter, T. R., et al. (2014). A new scenario framework for climate change research: The concept of shared socioeconomic pathways. Clim. Change 122, 387–400. doi:10.1007/s10584-013-0905-2
Osaka, S., Bellamy, R., and Castree, N. (2021). Framing “nature-based” solutions to climate change. WIREs Clim. Change 12, e729. doi:10.1002/wcc.729
Peterson, G. D., Cumming, G. S., and Carpenter, S. R. (2003). Scenario planning: A tool for conservation in an uncertain world. Conserv. Biol. 17, 358–366. doi:10.1046/j.1523-1739.2003.01491.x
Riahi, K., van Vuuren, D. P., Kriegler, E., Edmonds, J., O’Neill, B. C., Fujimori, S., et al. (2017). The Shared Socioeconomic Pathways and their energy, land use, and greenhouse gas emissions implications: An overview. Glob. Environ. Change 42, 153–168. doi:10.1016/j.gloenvcha.2016.05.009
Ruesch, A. (2008). New IPCC tier-1 global biomass carbon map for the year 2000. United States: Environmental System Science Data Infrastructure for a Virtual Ecosystem ESS-DIVE.
Samek, J. H., Lan, D. X., Silapathong, C., Navanagruha, C., Abdullah, S. M. S., Gunawan, I., et al. (2012). Land use and land cover change in Southeast Asia. Land Change Sci. 2012, 111–122. doi:10.1007/978-1-4020-2562-4_7
Sharp, Richard(2021). InVEST 3.9 User’s Guide. Available at: http://releases.naturalcapitalproject.org/invest-userguide/latest/
Seddon, N., Chausson, A., Berry, P., Girardin, C. A. J., Smith, A., and Turner, B. (2020). Understanding the value and limits of nature-based solutions to climate change and other global challenges. Philosophical Trans. R. Soc. B Biol. Sci. 375, 20190120. doi:10.1098/rstb.2019.0120
Sleeter, B. M., Sohl, T. L., Bouchard, M. A., Reker, R. R., Soulard, C. E., Acevedo, W., et al. (2012). Scenarios of land use and land cover change in the conterminous United States: Utilizing the special report on emission scenarios at ecoregional scales. Glob. Environ. Change 22, 896–914. doi:10.1016/j.gloenvcha.2012.03.008
Sodhi, N. S., Posa, M. R. C., Lee, T. M., Bickford, D., Koh, L. P., and Brook, B. W. (2010). The state and conservation of Southeast Asian biodiversity. Biodivers. Conserv. 19, 317–328. doi:10.1007/s10531-009-9607-5
Stibig, H. J., Achard, F., Carboni, S., Raši, R., and Miettinen, J. (2014). Change in tropical forest cover of Southeast Asia from 1990 to 2010. Biogeosciences 11, 247–258. doi:10.5194/bg-11-247-2014
Suh, S., Johnson, J. A., Tambjerg, L., Sim, S., Broeckx-Smith, S., Reyes, W., et al. (2020). Closing yield gap is crucial to avoid potential surge in global carbon emissions. Glob. Environ. Change 63, 102100. doi:10.1016/j.gloenvcha.2020.102100
Teo, H. C., Zeng, Y., Sarira, T. V., Fung, T. K., Zheng, Q., Song, X. P., et al. (2021). Global urban reforestation can be an important natural climate solution. Environ. Res. Lett. 16, 034059. doi:10.1088/1748-9326/abe783
UNPD, Department of Economic and Social Affairs and Population Division (2019). World urbanization prospects: The 2018 revision. United Nations New York: Department of Economic and Social Affairs.
Zeng, Y., Sarira, T. V., Carrasco, L. R., Chong, K. Y., Friess, D. A., Lee, J. S. H., et al. (2020). Economic and social constraints on reforestation for climate mitigation in Southeast Asia. Nat. Clim. Chang. 10, 842–844. doi:10.1038/s41558-020-0856-3
Keywords: Southeast Asia, urban clusters, land cover scenarios, carbon sequestration, carbon emissions, nature-based solutions, nature climate solutions
Citation: Kamarajugedda SA, Johnson JA, McDonald R and Hamel P (2023) Carbon storage and sequestration in Southeast Asian urban clusters under future land cover change scenarios (2015–2050). Front. Environ. Sci. 11:1105759. doi: 10.3389/fenvs.2023.1105759
Received: 23 November 2022; Accepted: 13 March 2023;
Published: 23 March 2023.
Edited by:
Borja Gonzalez Reguero, University of California Santa Cruz, United StatesReviewed by:
Ariana Sutton-Grier, University of Maryland, United StatesHossein Sadeghi, Shiraz University, Iran
Copyright © 2023 Kamarajugedda, Johnson, McDonald and Hamel. This is an open-access article distributed under the terms of the Creative Commons Attribution License (CC BY). The use, distribution or reproduction in other forums is permitted, provided the original author(s) and the copyright owner(s) are credited and that the original publication in this journal is cited, in accordance with accepted academic practice. No use, distribution or reproduction is permitted which does not comply with these terms.
*Correspondence: Shankar Acharya Kamarajugedda, c2hhbmthci5ha0BudHUuZWR1LnNn