 Yiping Liao
 Guangsheng Liu
 Haijun Luan
 Guojiang Deng
 Meiduan Zheng
 Wenhao Cai
95% of researchers rate our articles as excellent or good
Learn more about the work of our research integrity team to safeguard the quality of each article we publish.
Find out more
ORIGINAL RESEARCH article
Front. Environ. Sci. , 03 May 2023
Sec. Environmental Informatics and Remote Sensing
Volume 11 - 2023 | https://doi.org/10.3389/fenvs.2023.1105007
Rapid urbanization has placed the sustainable development of some watershed ecosystems in jeopardy. In order to achieve sustainable urban development, it is vital to identify the coupling mechanisms between urbanization and the ecological environment quality. This study establishes indicators to evaluate the Jiulong River Basin’s urbanization and ecological environment systems. These are utilized to analyze spatial and temporal changes and build a coupling coordination degree model. This research investigates the level of development coordination between urbanization and the ecological environment quality in the basin. The data sources include nighttime lighting and Landsat data from 2000 to 2020. The findings indicated the following: 1) Urbanization levels in the basin rise annually, and the years 2010–2020 represent a stage of high urbanization growth. In addition, the development levels are spatially heterogeneous, with high levels in the south and low levels in the north. 2) The ecological environment quality category for the basin is generally Excellent; however, many facets of the climate and human activity drastically lowered this grade in 2005. 3) In the basin, there is a basic coordination relationship between urbanization and environmental quality, but the number of cities falling into the moderate imbalance category has grown. 4) Increasing the urbanization level raises the coordination between urbanization and the ecological environment more than improving environmental quality, but antagonistic effects make it necessary to strengthen the protection of the ecological environment alongside economic development. From the viewpoint of counties, this study examines the long-term interactions between the ecological environment and urbanization in Fujian Province, China. Recommendations for balancing urban development and environmental concerns in coastal watersheds are presented, providing references to the fact that the future of this area of China can be sustainable.
Urbanization is a crucial indicator of national economic development (Dou and Kuang, 2020). As a result of China’s reform and opening up, its urban population has expanded from 170 million in 1978 to 910 million in 2021, and its GDP has increased from 364.52 billion CNY in 1978 to 114.4 trillion CNY in 2021 (Statistics, 2021). Alongside this, urbanization has had adverse effects on the environment, resulting in ecosystem devastation, water scarcity, and frequent natural disasters (Abu Hammad and Tumeizi, 2012; Uniyal et al., 2015; Quan-pei et al., 2017; Mafi-Gholami and Baharlouii, 2019). Therefore, understanding the interactive coupling mechanisms between urbanization and the ecological environment in this context is essential for two reasons: 1) From a practical standpoint, it can provide a scientific reference for the formulation of sensible urban development strategies. 2) The understanding can be utilized to mitigate the potential ecological risks brought about by accelerated urbanization.
There are some advances in theoretical methods for examining the relationship between urbanization and the ecological environment (Fang et al., 2016). These approaches include the environmental Kuznets curve, the long-range coupling model, the ecological footprint model, and the coupling coordination degree model (CCDM) (Tang et al., 2021; Addai et al., 2022; Wang J et al., 2022; Wang Q et al., 2022). These approaches indicate that urbanization’s impact on the ecological environment is non-linear, and many studies have supported this hypothesis (Cui et al., 2019; Geng and Zhang, 2020). The CCDM focuses more on the interactions between subsystems than other methods. CCDM-based research on the coupling relationships between urbanization and the ecological environment achieved results at several scales, and these studies can be divided into two main approaches.
The first approach uses statistical data to evaluate the level of regional ecological environment or urbanization. For example, Li et al. collected social, economic, and environmental statistical information to evaluate their coordinated development capacity in nine main cities in China (Li and Yi, 2020). Zhang et al. (2022) calculated the new urbanization quality and the environmental carrying capacity of more than 200 prefecture-level cities in China and analyzed the coupling coordination degree (CCD) between them, based on data from the China Urban Statistical Yearbook. Shen et al. (2018) investigated the coupling relationship between the economy and carbon emissions in 30 Chinese provinces by employing the statistical data of economic growth and carbon emission changes. When calculated using statistical data, the CCD tends to be highly authoritative, but this method provides limited spatial information and thus does not represent the actual local situation of a study area. Furthermore, statistical data are challenging to obtain and highly subjective, which can lead to discrepancies between the results of a study and reality (Shao et al., 2020).
The second approach uses remote sensing data to construct indicators for the two subsystems and establish the coupling relationship based on the CCDM. For example, Ji et al. (2021) analyzed the spatial and temporal changes and coordinated development of “population–society–economy–resources–ecology–environment” in the Beijing–Tianjin–Hebei urban agglomeration using CCDM mainly with MODIS and supplemented by statistical data. In another study, Ji et al. (2022) integrated multisource remote sensing datasets and nighttime light data to evaluate the coupling relationship between urbanization and the ecological environment in China since 2000 at multiple scales. Satellite observation technology was developed significantly in recent decades, and remote sensing data can now cover large areas and monitor changes over time; it also has the advantage of objectivity. These developments have led to regional ecological, environmental monitoring and urbanization evaluation systems. In 2013, Xu used principal component analysis (PCA) to construct the remote sensing ecological index (RSEI), which uses four indicators: greenness, humidity, heat, and dryness (Han-qiu, 2013). The RSEI has the advantages of being efficient, objective, and accurate for monitoring changes in regional ecological environment quality, and it is widely used in evaluating the quality of the urban ecological environment (Zhao et al., 2021; Wang Q et al., 2022; Xu et al., 2022). In addition, nighttime light (NTL) datasets are based on the characteristics of urban clusters and can objectively and accurately reflect regional human activities at the grid scale. Numerous studies have confirmed that NTL image-element values have a strong correlation with human activity indicators such as economic development, urbanization level, and energy consumption (Zhang and Seto, 2011; Forbes, 2013; Tian et al., 2021).
Fujian Province was allocated as “an ecology-friendly province” by the government since 2005, indicating that ecological environmental protection will be paid more attention to during its economic development (urbanization). While because of its wide area and covering series of significant cities, Jiulong River Basin (JRB) is the core zone of ecological environmental protection and economic development (urbanization) in Fujian Province (Li et al., 2018). In addition, following the national guiding mind of promoting well-coordinated environmental conversation and avoiding excessive development for big river basins. The ecological environmental protection and economic development (urbanization) of the JRB should be investigated as a whole. These also obeys the natural characteristics of close spatial relation for a river basin and the cities along it, and is more reasonable from geographical view. Remote sensing and CCDM provide methods to quantitatively observe economic, social, and environmental changes in the JRB.
In recent years, studies have shown that excessive human activities brought pressure on the ecological carrying capacity of the JRB (Huang et al., 2019). However, most of the studies focus on describing the relationship between ecological environment and urbanization in the urban cluster, few concern the relationship at the watershed scale. According to the authors’ knowledge, little research has been reported in peer reviewed literature that study the relationship between ecological environmental protection and economic development of the JRB with the coupling coordination degree model (CCDM) so far. Using the JRB as the study area, this research examines watershed-based urbanization and ecological quality using remote sensing image data from 2000 to 2020. CCDM is utilized to assess their coordinated development between urbanization and eco-environmental quality. The aim of this study is to observe the progress of the relationship between the ecological environment and urbanization at the watershed scale in the context of the ecological province to contribute to sustainable development.
Jiulong River, a relatively rich water resource, is located south of Fujian Province (Figure 1). It has a main-stream length of 258 km and a flow rate of 446 m3/s. The watershed covers an area of 14 741 km2, accounting for about 12% of the land area of Fujian Province. This consists of three main streams, injected into the Taiwan Strait at Xiamen Port after passing through Zhangzhou. The downstream Zhangzhou Plain is one of the four major plains in Fujian Province. The total population of the basin accounts for 17% of the province’s total population, and the total economic volume accounts for about 26.7% of that of Fujian Province, covering the political and economic centers of Longyan and Zhangzhou, two prefecture-level cities. This includes the Xinluo District of Longyan City and Zhangzhou City’s Xiangcheng and Longwen districts. The area has a mid-subtropical southern maritime monsoon climate, with an average annual precipitation of 1700 mm and an average annual temperature of 16°C–22°C. The JRB is composed of ten primary counties, and it judged whether to conduct an urbanization-level analysis in each of these based on their main economic and political centers. Because the economic and political center of Anxi County is not located in the basin, it is not included in the analysis presented here.
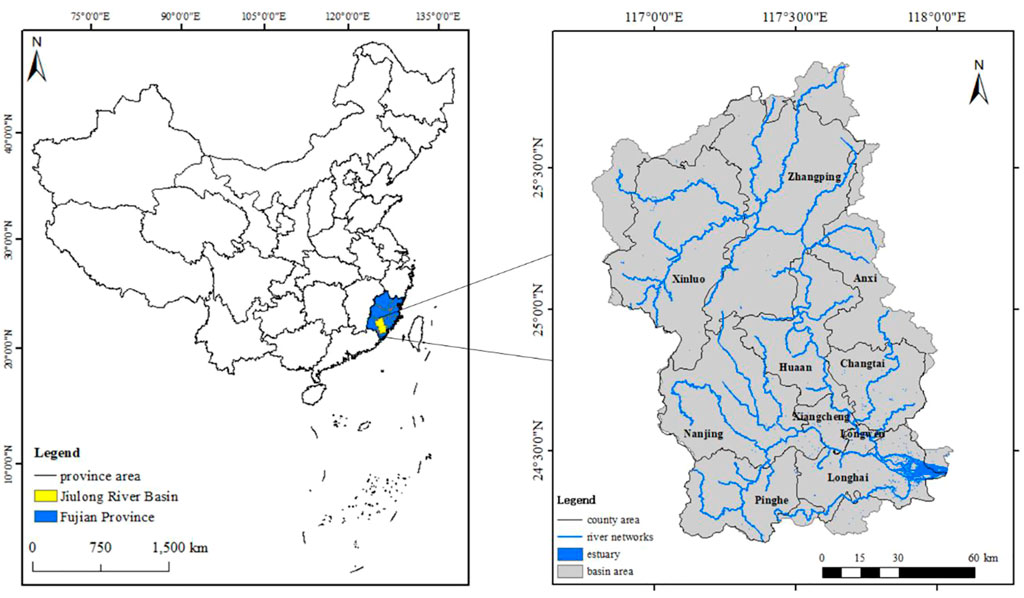
FIGURE 1. Location of the Jiulong River Basin and its distribution of counties.
This study used two types of data: NTL data and Landsat Thematic Mapper Operational Land Imager (TM/OLI) remote sensing images.
For the NTL data, the currently used Defense Meteorological Program Operational Linescan System (DMSP/OLS) and National Polar-Orbiting Partnership Visible Infrared Imaging Radiometer Suite (NPP/VIIRS) nighttime light data lack comparability due to differences in their sensors, differences in satellite transit times, and aging of the sensors. These factors lead to large differences between the data acquired from different satellites or in different years from the same satellite. Therefore, this research uses the annual NTL images (for the period 2000–2020) produced by Chen et al. for a continuous time series with a resolution of 500 m (Chen et al., 2021). The dataset consists of combined monthly DMSP/OLS (2000–2012) and NPP/VIIRS (2013–2020) datasets, generated using a modified self-encoder model and a cross-sensor calibration model with good accuracy and temporal consistency.
The Landsat TM/OLI remote sensing images were obtained from the United States Geological Survey (https://glovis.usgs.gov) with a spatial resolution of 30 m. The images were utilized to obtain the ecosystem’s current state and calculate the ecological environment quality indicators needed for the later CCDM. The images were acquired from June to September in the years 2000, 2005, 2010, 2015, and 2020, and they were filtered and mosaicked to synthesize minimum cloud images.
In this study, NTL data were employed to characterize the urbanization level. For each year, the number of luminous pixels was calculated and defined as pixels with NTL intensity greater than 0 nWcm−2sr−1. The average NTL values of nine counties in the JRB, Changtai (CT), Hua’an (HA), Longhai (LH), Longwen (LW), Nanjing (NJ), Pinghe (PH), Xinluo (XL), Xiangcheng (XC), and Zhangping (ZP), were calculated. The NTL intensity was divided into five levels according to the actual situation in the study area to determine the level of urban development in the basin, as shown in Table 1.

TABLE 1. Classification of nighttime light levels.
The ecological environment indicator used in this study is the RSEI (Han-qiu, 2013). This considers four factors: greenness, wetness, dryness, and heat. Integrating these multiple ecological factors into a single measure allows monitoring and evaluation of the regional ecological environment. Landsat 5 and Landsat 8 surface reflectance images uploaded by NASA, which have been radiometrically calibrated and atmospherically corrected, were selected to calculate these four indicators using the Google Earth Engine platform with outlier processing and PCA. The calculations were performed using the equation:
Here, the normalized difference vegetation index (NDVI) is used for
where
For
where
This study classified the RSEI results for each year into five grades at equal intervals of 0.2. The RSEI in the ranges (0, 0.2), (0.2, 0.4), (0.4, 0.6), (0.6, 0.8), and (0.8, 1.0) correspond to Very Poor, Poor, Moderate, Good, and Excellent, respectively (Wang J et al., 2022). The area and percentage corresponding to each class were utilized to monitor the changes in RSEI.
The CCDM was used to calculate the coupling relationship between the above two indicators to objectively represent the level of coordinated development of the urbanization level and the ecological environment. This is calculated using:
where C is the coupling degree; U is the standardized NTL; E is the RSEI; T is the combined level of urbanization and ecological environment; α and β represent the proportions of urbanization and ecological environment in the study area, respectively, and these are both taken as 0.5; and D is the CCD, which takes values in the range [0,1].
A larger value of D indicates a higher level of coupling coordination development, and a smaller value of D indicates a more severe dysfunction. In addition, we referred to a related study (Cheng and Ning, 2018) to consider the actual situation of the JRB by classifying the CCD into five types, as listed in Table 2.
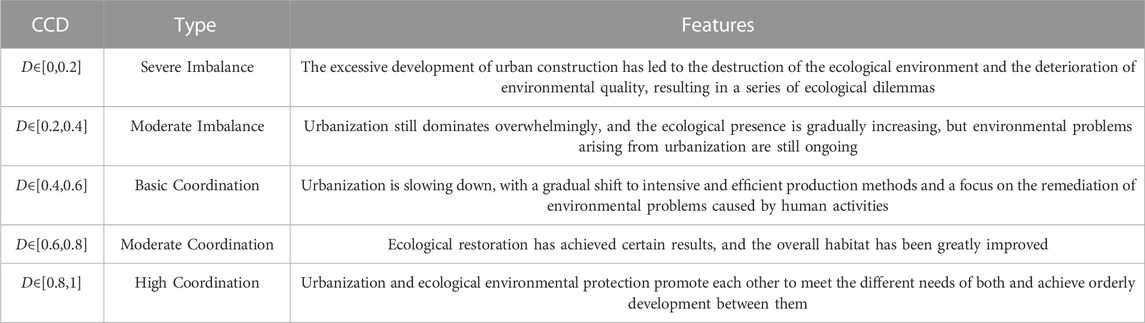
TABLE 2. Classification of coupling coordination degree in Jiulong River Basin.
The NTL images indicate the relatively rapid urbanization of the JRB during the past 20 years. Longwen District, Xiangcheng District in the southeast, and Xinluo District in the northwest are the primary luminous areas (Figure 2). These counties serve as the economic hubs of the basin and have attracted significant investment and population growth over the past 20 years, fueling urbanization and playing a crucial role in the basin’s overall urban development. Rapid population and economic growth contribute to a rise in urbanization, accompanied by an increase in the impervious surface area (Statistics, 2021). Based on the observed light distribution, the number of high-brightness pixels in the watershed has significantly increased since 2010.
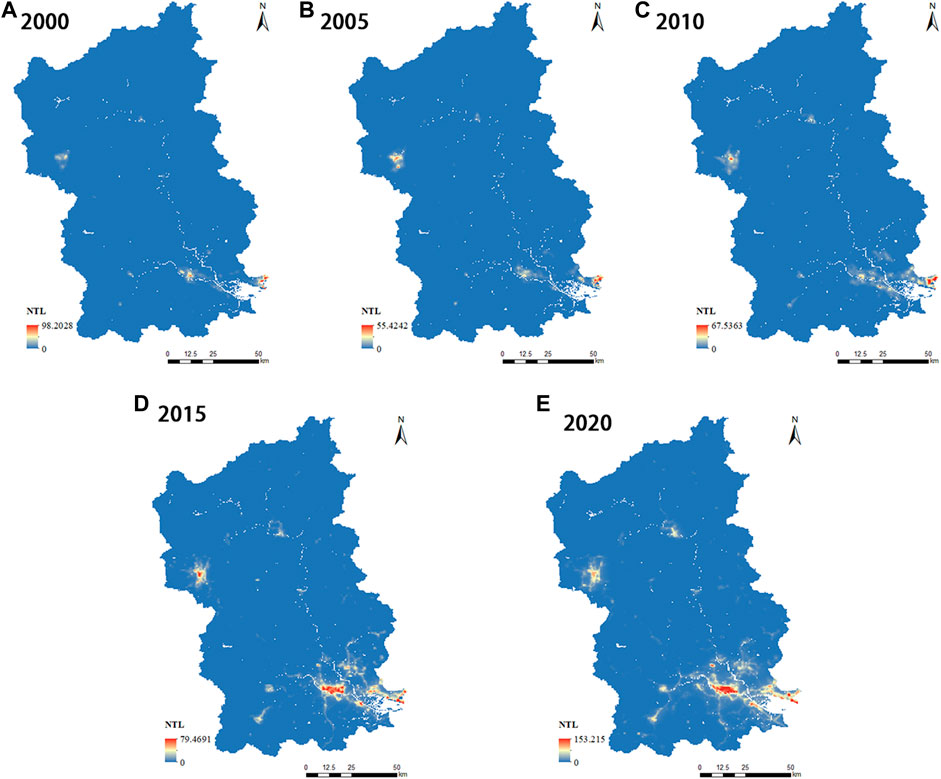
FIGURE 2. Variation of nighttime light in the JRB over time: (A) 2000; (B) 2005; (C) 2010; (D) 2015; (E) 2020.
The NTL of the JRB was processed using the classifier in Table 1 and performed the numerical statistics. Figure 3 indicates that “Minimal development” image elements decrease, reflecting more lands have been developed. The progressive development of the JRB resulted in the gradual reduction of undeveloped land from 2000 to 2020. In Table 1, the feasibility of the NTL intensity classification is also proved.
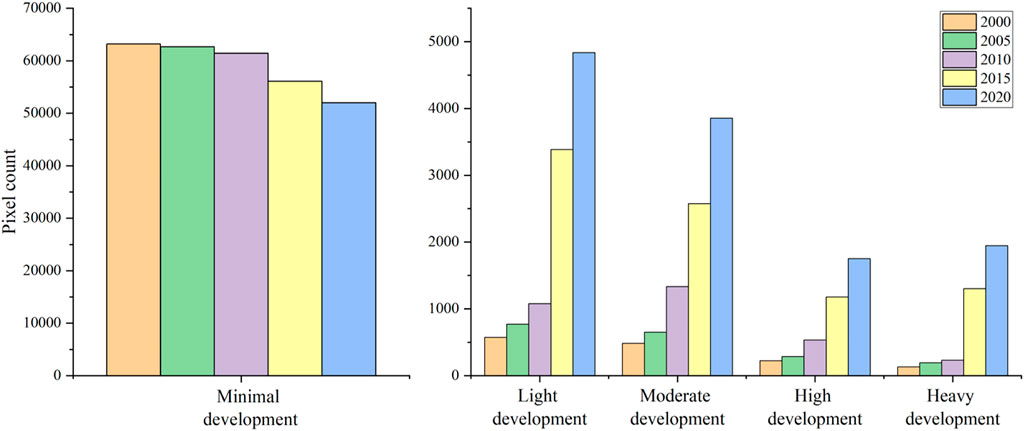
FIGURE 3. Distribution of nighttime light for Jiulong River Basin.
The JRB’s urban extent was determined using the NTL images (Figure 4). In the southern part of the basin, the spatial pattern of urban areas gradually shifted from single-point development to multi-point development with high compactness. As previously mentioned, the urban development of the basin is primarily driven by three counties, among which Longwen and Xiangcheng districts are closely connected with neighboring counties. Urban regions in the northern counties are mainly expanded outward circularly, although there is minimal interaction with adjacent counties. Based on the urban-area extraction data, the basin’s initial efficiency of urban expansion was poor, but between 2010 and 2020, urban expansion entered a high-speed phase. Their number of pixels with non-zero NTL continued to rise from 2000 to 2020, with the biggest jump occurring between 2010 and 2015, when their number increased by a factor of 2.65, from 3180 to 8444.
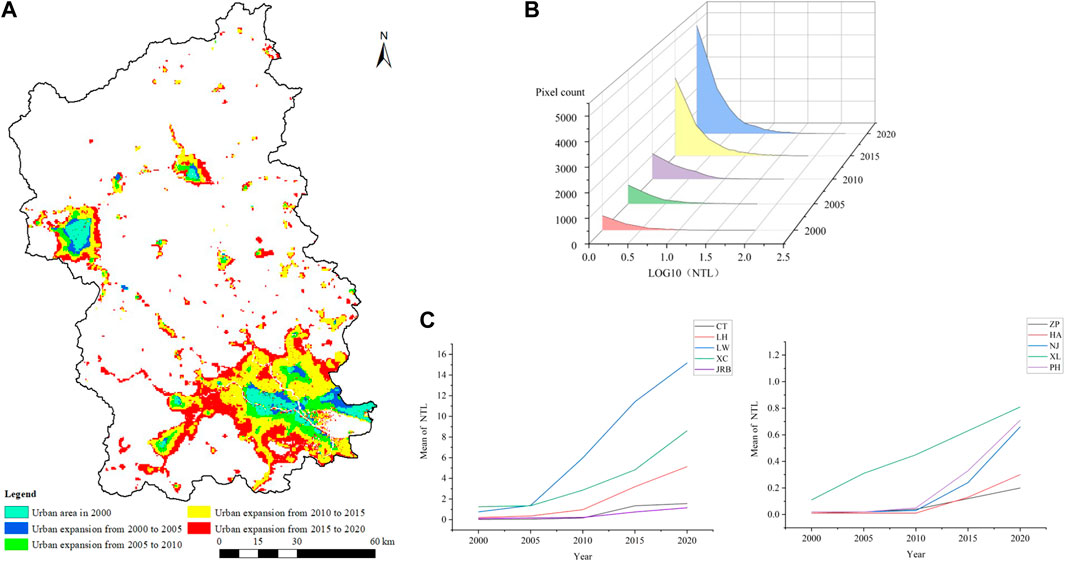
FIGURE 4. Urbanization of the Jiulong River Basin from 2000 to 2020: (A): Urban expansion in Jiulong River Basin; (B): Number of pixels with Nighttime Light greater than 0; (C): Time variation of the mean of Nighttime Light value by county.
In order to examine the evolution of the urbanization level, the NTL of the study region (nine counties) and the urbanization level from 2000 to 2020 were counted, as shown in Figure 4. In addition, there are significant differences in urbanization between the nine counties. As mentioned previously, LW and XC are the primary economic counties within the basin, and the mean value of NTL of these two districts increased exponentially from 2000 to 2020, from 0.75 to 1.25 in 2000 to 15.17 and 8.61 in 2020, respectively, forming a fault line lead in the JRB. Considering that China’s 11th and 12th Five-Year Plans emphasize the priority development of core cities in urban agglomerations, the primary manifestation of this phase is the dramatic increase in NTL in core areas such as LW and XC. Such intense human activity has driven the development of the entire region through increased social and economic activity in these areas and an influx of people from outside Zhangzhou (Li et al., 2021a; Li et al., 2021b).
The urban development level of JRB exhibits a spatial pattern of high in the south and low in the north, as shown in Figure 5. With inadequate location advantages and development momentum, traditional agriculture and industries still dominate the cities in the central and northern regions, resulting in slower economic growth and lower economic levels. The urbanization levels in the southeast of XC, LW, and LH are much higher than in the other counties. Before 2005, most counties had “Minimal development”, and the basin’s highest levels of development were only light. The urbanization levels of XC and LW significantly increased over the following 5 years. Other counties also gradually increased their urbanization levels, with NJ, HA, CT, LH, and PH gradually moving away from “Minimal development” after 2010. LH was the most notable, with development levels increasing from minimal to high between 2010 and 2020. Overall, the urbanization level’s development in the JRB primarily depended on the higher-level counties driving the lower-level counties, thereby promoting basin development. Most counties have low levels of urbanization and a significant disparity with the highest-level counties.
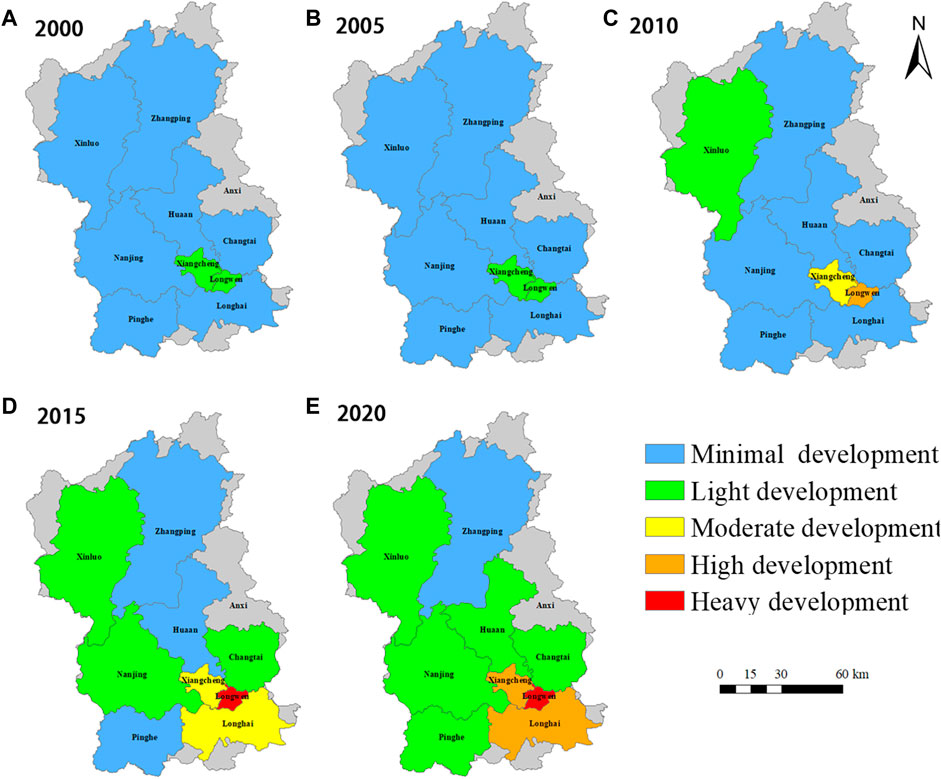
FIGURE 5. Spatial evolution of urbanization in the Jiulong River Basin: (A) 2000; (B) 2005; (C) 2010; (D) 2015; (E) 2020.
The JRB’s average RSEI scores in 2000, 2005, 2010, 2015, and 2020 were 0.81, 0.74, 0.84, 0.81, and 0.79, respectively, showing a gradually eroding trend, but the overall ecological environment quality was good. Figure 6 displays the spatial distribution of RSEI grade levels. The primary grade of the RSEI changed from “Excellent” to “Good” in 2005, which marked an abrupt change in the monitoring of the basin’s environmental quality. The mean of the RSEI dropped by 0.07 and reached a trough value at that time. The ecological environment quality improved in 2010, and most RSEI grades returned to “Excellent”. The ecological environment quality of JRB has not changed significantly in the last 10 years, and the regions that have become better and worse do not differ much from the images. In terms of spatial distribution, the areas with high ecological quality are mainly located in the central, northeastern, and southwestern parts of the basin, where the vegetation coverage is high. The areas with poor ecological quality are mainly located in the built-up areas in the southeast and northwest, where the urbanization level is high and human activities are frequent, so the ecological quality is declining.
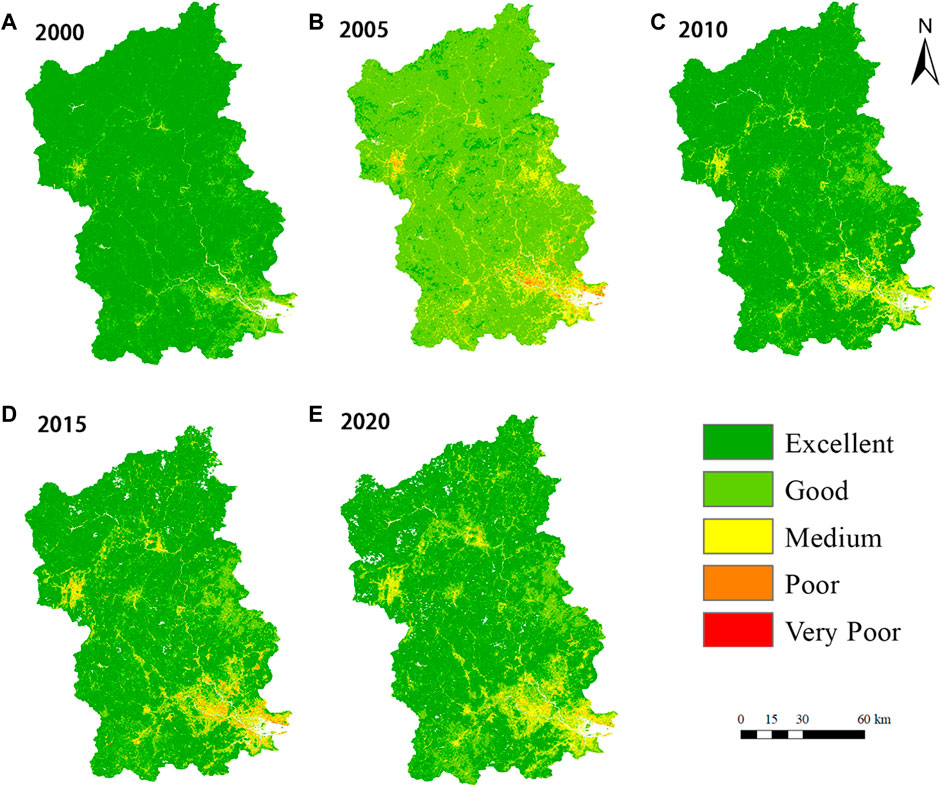
FIGURE 6. Changes in the remote sensing ecological index category across the JRB: (A) 2000; (B) 2005; (C) 2010; (D) 2015; (E) 2020.
Table 3 indicates that the overall ecological environment quality of the JRB has remained good over the past 20 years; however, the areas with poor ecological environmental quality have continued to expand due to the influence of urban development. Except for 2005, the percentage of “Excellent” grades was greater than 60%, which is the dominant position. The area of the “Excellent” grade decreased by 80.3% between 2000 and 2005, while the area of the “Good” grade increased by 70.77%, and the remaining area also increased compared to 2000. From 2010 to 2020, the ecological quality deteriorated slightly, as shown by the decrease in RSEI with the “Excellent” grades and the increase in the areas of the remaining grades. This change is concentrated between 2010 and 2015, a period of rapid urban construction.
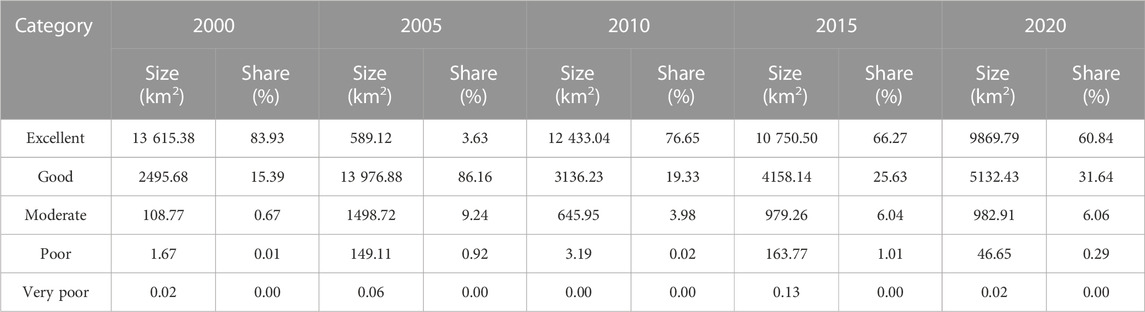
TABLE 3. Area statistics of remote sensing ecological index types from 2000 to 2020.
Based on the CCDM, the CCD of the ecological environment and urbanization was calculated from 2000 to 2020 using the RSEI and NTL (Figure 7; Table 4). From 2000 to 2005, the CCD of the JRB showed a decreasing trend. The area occupied by the “Moderate Imbalance” increased by 121.24 km2, the CCD level in some areas decreased, and the relationship between urban development and the ecological environment slightly worsened. This change is related to the deterioration of the ecological environment quality in 2005, demonstrating that the decline in ecological environment quality can damage the relationship between ecology and urbanization. As the ecological environment recovered in 2010, the relationship between ecology and urbanization eased, and the proportion of areas with “Moderate Imbalance” decreased. The CCD-type structure of the JRB changed from 2010 to 2020. The level of city-center coordination increased, indicating a moderate relationship between urbanization and ecology in downtown areas. However, the size of areas with “Moderate Imbalance” maintained an upward trend, with the proportion rising from 20.47% to 36.87%. Relatively, the proportions of “Basic Coordination” and “Moderate Coordination” decreased.
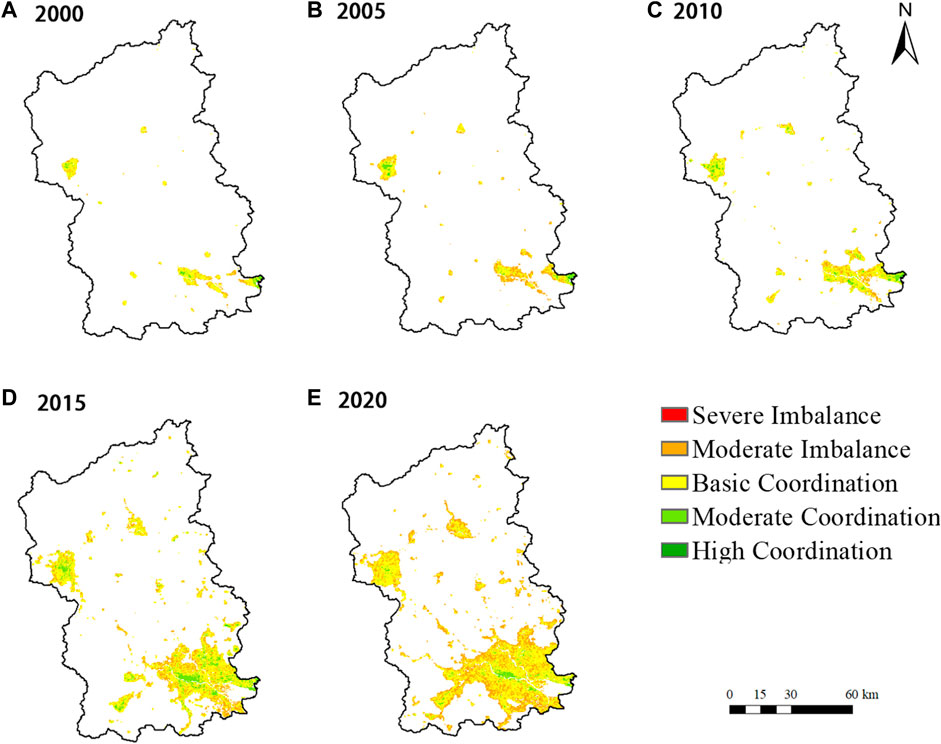
FIGURE 7. Spatial changes of coupling coordination degree in the Jiulong River Basin over time: (A) 2000; (B) 2005; (C) 2010; (D) 2015; (E) 2020.
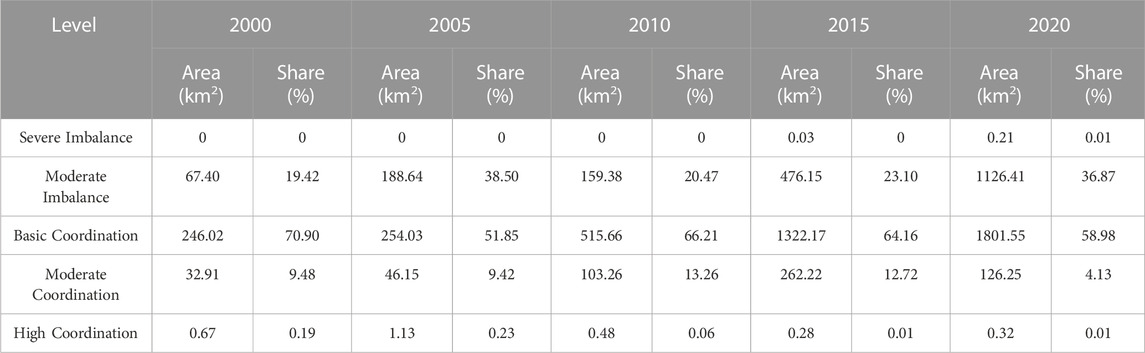
TABLE 4. Areas of different coupling coordination degree types in the Jiulong River Basin.
In terms of spatial distribution, the urban expansion will sacrifice part of the ecological environment, resulting in an imbalanced level of coordination in the new area, but this will gradually improve after subsequent ecological engineering and other measures. Some urban areas in the JRB have poor ecological environment quality due to early construction. However, with the continuous development of cities, the urban environment is beautified, vegetation cover is enhanced, the ecological environment is artificially improved, and the relationship between the ecological environment and urbanization is improved.
The average CCD values in the JRB for 2000, 2005, 2010, 2015, and 2020 are 0.47, 0.44, 0.49, 0.48, and 0.43, respectively. The type of coordination between urbanization and the ecological environment was mainly Basic Coordination, and the JRB’s ecological environment condition was maintained at a relatively good level in the process of continuously promoting urbanization. However, the fact that the proportion of imbalanced areas is increasing should not be ignored. Results for each county are shown in Figure 8. From 2000 to 2005, except for XL, the CCD of the districts and counties declined; from 2010 to 2020, except for HA, the CCD of the districts and counties again declined. Considering the information in Figures 3, 6, 7, it can be seen that the ecological environment of JRB deteriorated from 2000 to 2005, while urbanization developed more slowly, and the CCD decreased. The CCD changes from 2010 to 2020 originate from the rapid urban construction within the county, urban expansion, and compression of ecological environment quality. This resulted in more contradictions between urbanization and the development of the ecological environment; thus, the CCD decreased.
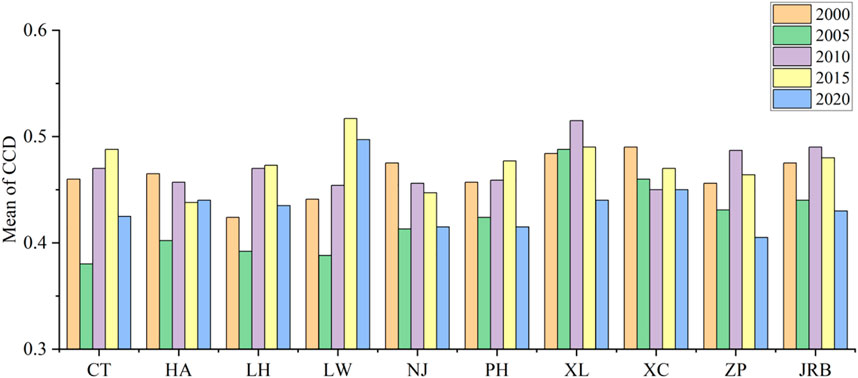
FIGURE 8. Average values of coupling coordination degree by county in the Jiulong River Basin from 2000 to 2020.
The RSEI of the JRB in 2005 was only 0.74, which was much lower than in other years. To investigate the reasons for the significantly lower RSEI in 2005 and to analyze the driving factors of RSEI changes, a multiple linear regression model of RSEI with NDVI, WET (including WetL5 and WetL8), LST, and NDBSI was established as given in Table 5. Trends in the variation of RSEI with NDVI, WET, LST, and NDBSI are shown in Figure 9.
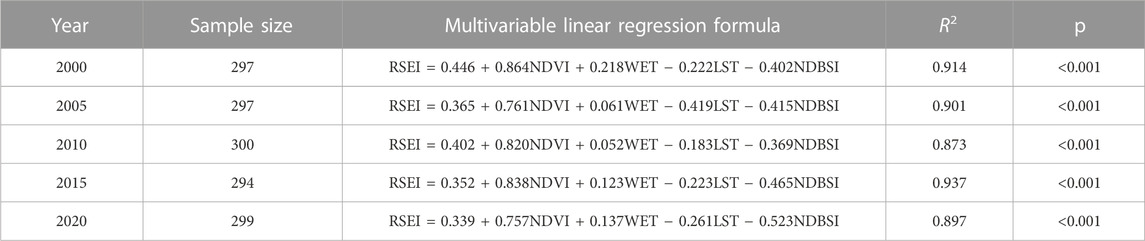
TABLE 5. Multivariable linear regression models of NDVI, WET, LST, NDBSI, and remote sensing ecological index with the significance(p) and the relevant indicator (R2).
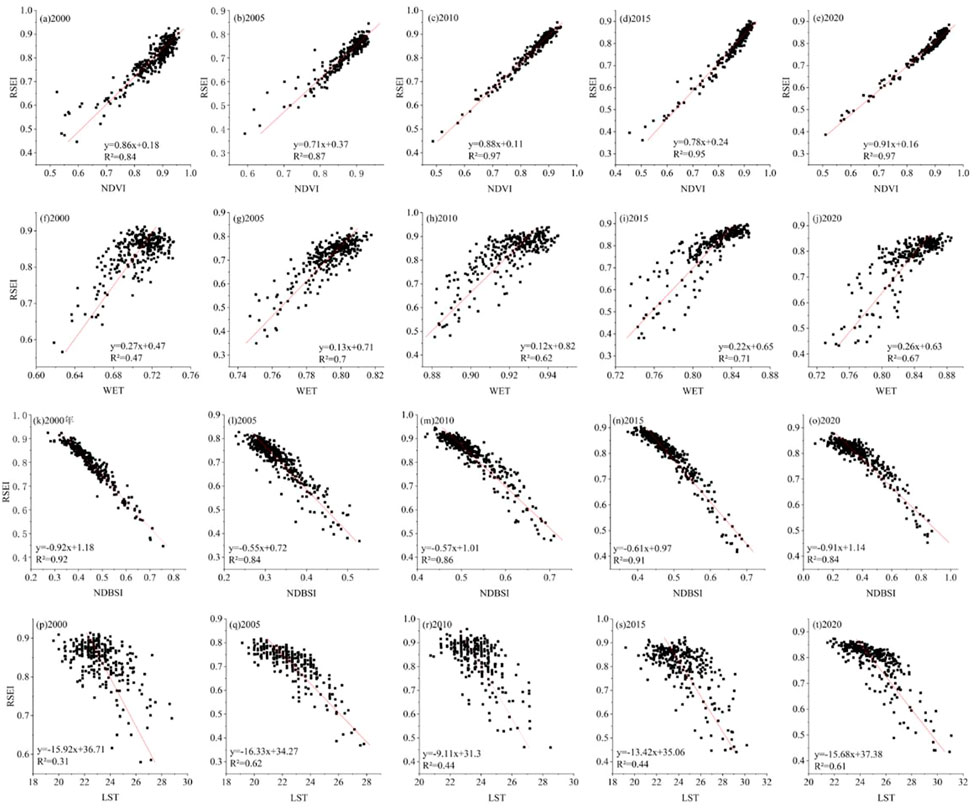
FIGURE 9. Trends of remote sensing ecological index with NDVI, WET, NDBSI, and LST.
From the results, all four independent variables had high participation in the model, with NDVI and WET playing a positive feedback role and LST and NDBSI playing a negative feedback role. Regarding indicator influence, NDVI always has the greatest influence, and RSEI tends to increase as the NDVI increases, indicating that vegetation is correlated with a good ecological environment in the JRB. After 2015, the influence of NDBSI in the watershed increased significantly, causing RSEI to keep decreasing. This indicates that the level of urbanization in the study area is increasing, leading to the expansion of the urban area. The multiple linear regression model is significantly different from the other years. The coefficient of LST’s influence is −0.419, which is equivalent to twice that in the other years, while the influences of NDVI and WET decreased.
Although each indicator is objective and independent in calculating RSEI, all four are intercorrelated. The four indicators of RSEI represent vegetation cover, land degradation, soil moisture, and surface-temperature conditions. Soil moisture and surface temperature affect vegetation growth, and land degradation increases the surface temperature (Ermida et al., 2020). A related study showed that the surface temperature from 2002 to 2007 in the JRB was higher than the other periods, while the precipitation was lower (Shen and Zeng, 2017). Furthermore, the increase in temperature and decrease in precipitation reduced the surface soil moisture, which affected vegetation growth in the watershed, leading to a decrease in RSEI and worsening the ecological environment quality.
In summary, the ecological quality of the watershed was good, while the average RSEI in the south was 0.65, which is lower than the value of 0.81 in the north. This is related to the higher vegetation cover rate in the northern part of the watershed. According to the 2021 Fujian Provincial Statistical Yearbook, the overall vegetation cover of the JRB exceeds 70%, with the vegetation cover of all major counties in the north exceeding 80% (Statistics, 2021). In addition, the economic development and urbanization levels in the southern part of the basin are better than those in the northern part, and the higher regional resource consumption puts greater pressure on the ecological environment (Zhang et al., 2022). The mean NTL of the basin in 2020 reached 1.15, at a Light development level. The level of urbanization varies greatly between counties in the basin, and the spatial distribution of urban composition and development shows an obvious “core–periphery” ring structure with differences in development from north to south. This structure is similar to most urban agglomerations in China, such as the Wuhan and Beijing–Tianjin–Hebei urban agglomerations (Ji et al., 2021; Tang et al., 2021). Specifically, the southern urban area has a pattern with LW and XC as the core and CT, LH, PH, and NJ as the periphery, with frequent exchanges between counties. In the north, the counties are surrounded by mountains, hills, and valleys, interspersed with mesas, low mountains, hills, and basins, with more scarce traffic. In addition to the topography, the northern counties have a large administrative scope and are therefore closed to development, with urban development mostly in a ring structure with internal communication.
As described in Section 4.1, the JRB’s mean NTL has increased over the past 20 years, from 0.10 in 2000 to 1.15 in 2020. This shows that urbanization within the basin increased and that luminous areas have increased due to better urban living circumstances. There are various driving factors of NTL changes, hence this study employed the population and GDP of the JRB from China Statistical Yearbook for the past 2 decades. The GDP increased from 5 billion in 2000 to 42 billion in 2020, and the town population increased from 2.77 million in 2000 to 3.41 million in 2020. With the growth of GDP and population, the artificial light was increasing in urban areas which made the NTL more intense. Chai et al. (2022) used the NTL to reveal information about the spatial expansion changes in Xiamen. Its urban development was mainly concentrated between 2005 and 2020, which accounted for 79.44% of the 30-year expansion with GDP and population soars. The urbanization results of Xiamen, one of the outlet cities of the JRB, confirm the judgment herein about the changes in NTL. With the increasing of GDP and urban populations, more lands have been developed, which results in the sharply exploding of NTL in the JRB.
To investigate the coupling relationship between watershed ecology and urbanization, a multiple linear regression model of CCD with RSEI and NTL was developed (Table 6; Figure 10). Scatter plots of the fitted and actual CCD were constructed to test the model’s accuracy, as shown in Figure 11. In Figure 10, the R2 of the fits for 2000, 2005, 2010, 2015, and 2020 are 0.683, 0.892, 0.835, 0.861, and 0.877, respectively, indicating that the fitted models could predict CCD well. The model’s regression coefficients are all positive, indicating that as the RSEI and NTL indices increase, the watershed CCD will enhance, i.e., both an improved ecological environment and an increased level of urbanization will enhance the level of coordination between them. Compared to the RSEI, the NTL has a greater contribution value, which matches previous studies’ findings. Ji et al. (2022) explored the relationship between the three at multiple scales and found that urbanization always contributes more to CCD than ecology. In the study area, specifically in counties with higher urbanization levels such as LW and XC, the RSEI in 2020 for LW (0.61) and XC (0.64) was much lower than the average for the basin (0.79), but the CCD was higher due to the higher NTL (Figure 9). This development trend is like those of the three major urban agglomerations in China (Beijing–Tianjin–Hebei, Yangtze River Delta, and Pearl River Delta), which have experienced rapid urban development in the last 20 years, leading to ecological degradation. However, their CCD is still increasing (Xu et al., 2021).
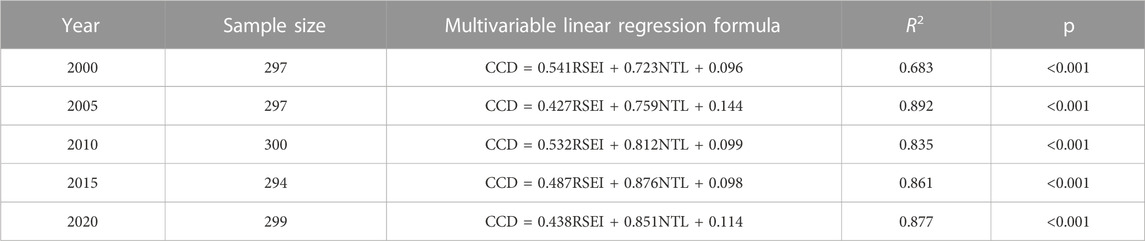
TABLE 6. Multivariable linear regressions of remote sensing ecological index, nighttime light, and coupling coordination degree.
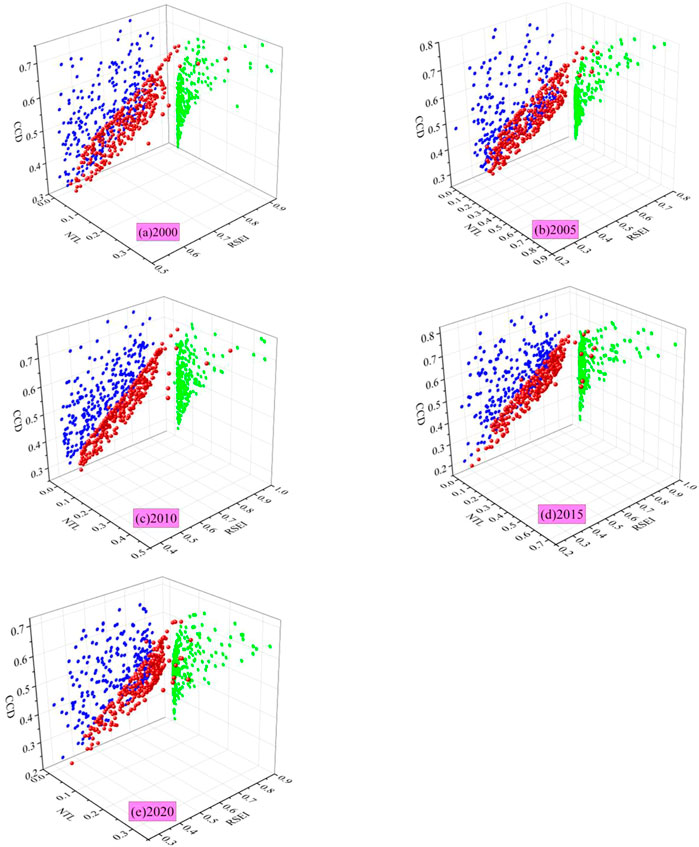
FIGURE 10. Three-dimensional scatter plots between remote sensing ecological index, nighttime light, and coupling coordination degree (red dots are between remote sensing ecological index, nighttime light, and coupling coordination degree; green dots are between coupling coordination degree and nighttime light; blue dots are between coupling coordination degree and remote sensing ecological index). (A): 2000; (B): 2005; (C): 2010; (D): 2015, (E): 2020.
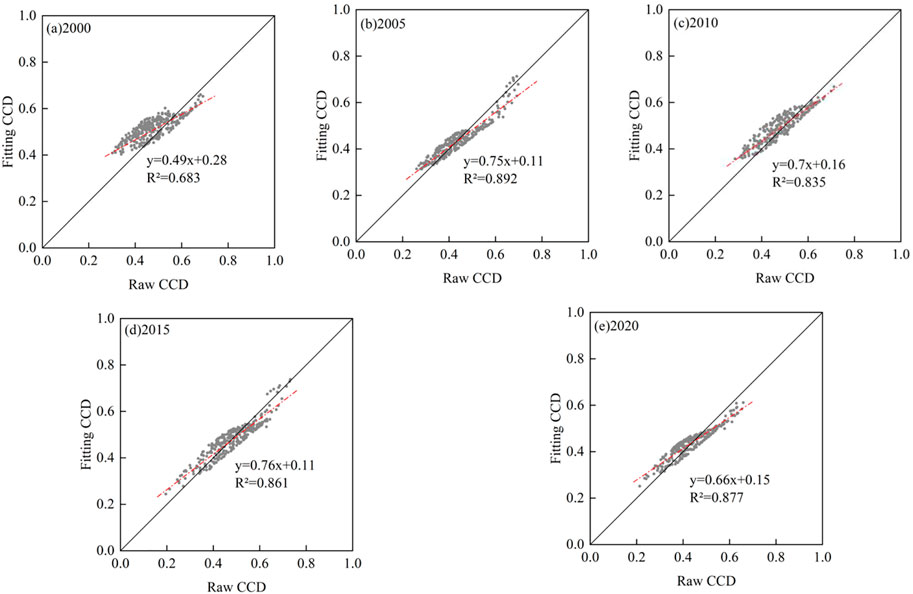
FIGURE 11. Scatter plots of the fitting coupling coordination degree and the raw coupling coordination degree: (A): 2000; (B): 2005; (C): 2010; (D): 2015; (E): 2020.
The above results do not imply that the JRB can accelerate its pace of urbanization without any concern for ecological protection. Xu et al. (2021) predicted the effect of urbanization on CCD and found an inverted “U”-shaped distribution between the two, with CCD continuing to decline when urbanization levels exceeded a critical value. The symmetry axes of regions with low urbanization levels are closer to 0, implying that the negative impact of urbanization on CCD will occur more quickly. This is related to the negative correlation between urbanization and the ecological environment leading to the decline of CCD. Therefore, if the protection of the ecological environment is neglected in urbanization, CCD will decrease accordingly.
Compared to the three major urban agglomerations, most counties in JRB have a low level of urbanization and a late start of urbanization construction; urbanization development and ecological environment development are still antagonistic, and rapid urbanization will directly exert pressure on the ecological environment (Fang et al., 2021). Considering the RSEI (Table 3), NTL (Figure 4), and CCD changes (Table 4) in conjunction, the urbanization process of JRB entered a high development stage from 2010 to 2020 (Li et al., 2021a; Li et al., 2021b). At the same time, the proportion of RSEI characterized as “Excellent” continued to decline, and the proportion of CCD ranked as imbalanced continued to increase, which indicates that the decrease of the ecological environment quality in the JRB during this period had a greater impact on CCD than the promotion of the urbanization level. The antagonistic effect between urbanization and the ecological environment affected the CCD.
Compared to other urban agglomerations, there are differences in the trends of CCD changes in the study area. The CCD of several cities in the Yellow River Basin maintained an increasing trend during the same period and the CCD of the Wuhan urban agglomeration continued to fluctuate and grow (Liu et al., 2021; Tang et al., 2021). All these urban agglomerations have experienced large urban development in the last decade, but their ecological environment quality has also been improving, achieving a shift from uncoordinated to coordinated development. The JRB must continue ecological environmental construction and increase remediation efforts.
Besides analyzing the statistical correlation of RSEI, NTL, and CCD, this paper attempts to reveal the path and mechanism of urban development and urban expansion on the ecological environment change at the micro-scale.
The effects of urbanization are generally loss of vegetation, water, and soil areas and expansion of construction land area with more impervious land. Furthermore, vegetation, water, and soil directly affect the NDVI and wetness values, indirectly affect the LST values by reduced evaporation and transpiration of the objects, and construction land directly affects the NDBSI value, indirectly affects the LST value by less evaporation and transpiration. Finally, these changed values are employed to calculate the comprehensive ecological environment index- RSEI. For the process above, there is a classic triangular feature space diagram of land surface temperature (LST) and vegetation index (NDVI→VI) to illustrate it at the micro-scale (Figure 12; Peng et al., 2017; Zhao et al., 2022). The LST/NDVI feature space depicts the variation of surface water-heat exchange process, especially the interactions between surface soil moisture, evapotranspiration and surface temperature under different vegetation coverage (Li et al., 2009). The variation is driven by the ground objects changes under urban development and expansion, including vegetation, soil, and impervious surface, which change the external and internal surface features further, including greenness, wetness, dryness, and heat. Finally, it can be concluded that the ecological environment changes. The illustration and interpretation above are the path and mechanism of urban development and expansion on the ecological environment in the JRB at the micro-scale.
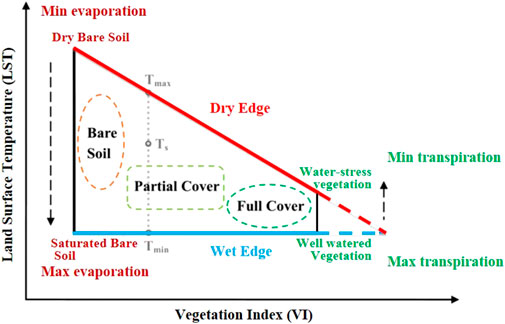
FIGURE 12. Diagram of the triangular (trapezoidal) space between land surface temperature (LST) and vegetation index (VI) (Li et al., 2009; Peng et al., 2017; Zhao et al., 2022).
In summary, the following suggestions are made: 1) For the counties in the south of the JRB, the urban pattern of a core–periphery ring structure should be maintained, and a structure of “one core and four wings” should be built. The “one core” refers to Longwen, Longhai, and Xiangcheng districts, where urban development has been completed. Their development strategies should constantly optimize urban space’s internal structure and development pattern and formulate balanced environmental protection policies. The “four wings” refers to Nanjing County, Pinghe County, Changtai District, and Hua’an County, where urban development has just started. These areas need to focus on ecological environmental protection while improving infrastructure construction and steadily increasing urbanization. 2) For counties in the northern part of the JRB, such as Xinluo District and Zhangping County, their urban pattern, mainly based on their exchanges, should not be changed. Their development strategies should focus on repairing and maintaining infrastructure and promoting an ecological economy. In terms of infrastructure, the shortcomings of transportation infrastructure should be made up so that the mountainous counties do not lag in building the JRB economy. In terms of ecological economics, the advantages of the ecological environment within these counties should be transformed into the advantages of the ecological economy in areas such as ecological agriculture, ecological industry, and ecological tourism.
This study explored a methodological reference for investigating the coupling relationship between urbanization and the ecological environment in an offshore watershed and provided decision support for the future harmonious development of humans and nature at the watershed scale in China. First, the urbanization and ecological environment were connected by CCDM based on new NTL products and remote sensing data. Compared to the previously used NTL data, this product does not require considering problems such as sensor aging. Thereafter, a multiple linear regression model was used to find the reason for the abnormally low value of RSEI of JRB in 2005. Finally, the results of CCD proved that this method explores the relationship between the ecological environment and urbanization, identifies the critical point of ecology, and seeks the re-optimization space of urbanization. In addition, the authors attempted to illustrate and interpret the path and mechanism of urban development and urban expansion on the ecological environment in the JRB at the micro-scale. However, this study still has shortcomings: a) The impact of urbanization on the ecological environment was mainly considered. In contrast, the impact between them is mutual. Hence, watershed ecological environment will be considered to impact urbanization in the future. b) Most discussions were directed at the relationship between the NTL, RSEI, and CCD. Accordingly, future research can focus on the path and mechanism of urban development and urban expansion on the ecological environment at the watershed scale. c) Both the calculation of urbanization indicators and ecological environment indicators are one-sided. For example, population density, air quality, or land use intensity should play an essential role in the assessment.
This study constructs the CCDM based on NTL and Landsat remote sensing data obtained from 2000 to 2020 to explore the coupled coordination relationship between urban development and the ecological environment in the JRB using the RSEI. The following main conclusions can be drawn.
1) From 2000 to 2020, the JRB urbanization level increased, and the mean NTL raised from 0.1 to 1.15. However, the urbanization levels of most counties improved slowly, with significant differences between them.
2) During this period, the mean RSEI in the JRB was consistently greater than 0.6, indicating a good ecological environment quality. The low value of RSEI in 2005 was related to the influences of both the climate and human activities. The increase in temperature and decrease in precipitation in the basin during that period reduced surface soil moisture, which affected the growth of vegetation, decreasing the RSEI and decreasing the quality of the ecological environment.
3) The coordination category between urbanization and the ecological environment in the JRB during the 2000–2020 period was mainly “Basic coordination”, and the proportion of imbalanced areas increased. In addition, it was found that the higher the county’s urban development level, the better the coordination.
4) Promoting urbanization is more conducive to enhancing regional coupling coordination than improving the ecological environment’s quality. However, due to the antagonistic effect between urbanization and the ecological environment, it is necessary to pay more attention to protecting the ecological environment when promoting urbanization to avoid decreasing development coordination.
Publicly available datasets were analyzed in this study. This data can be found here: https://dataverse.harvard.edu/dataset.xhtml?persistentId=doi:10.7910/DVN/YGIVCD.
Conceptualization and methodology: YL, GL, and HL; data curation: YL, GD, WC, and MZ; preliminary draft preparation: YL; review and editing: GL and HL.
Nation al Natural Science Foundation of China (51809222) provide 50% of the cost of this publication Natural Scice Foundation of Fujian Province (2020J0113, 2020J01258, 2020J01261, 2022J011232) provide 50% of the cost of this publication.
We would like to express our gratitude to Prof. Zuoqi Chen for sharing the nighttime light data and Dr. Zheng Duan for his support in revising the manuscript.
The authors declare that the research was conducted in the absence of any commercial or financial relationships that could be construed as a potential conflict of interest.
All claims expressed in this article are solely those of the authors and do not necessarily represent those of their affiliated organizations, or those of the publisher, the editors and the reviewers. Any product that may be evaluated in this article, or claim that may be made by its manufacturer, is not guaranteed or endorsed by the publisher.
Abu Hammad, A., and Tumeizi, A. (2012). Land degradation: Socioeconomic and environmental causes and consequences in the eastern mediterranean. Land Degrad. Dev. 23 (3), 216–226. doi:10.1002/ldr.1069
Addai, K., Serener, B., and Kirikkaleli, D. (2022). Empirical analysis of the relationship among urbanization, economic growth and ecological footprint: Evidence from eastern europe. Environ. Sci. Pollut. Res. 29 (19), 27749–27760. doi:10.1007/s11356-021-17311-x
Chai, C. F., He, Y. R., Yu, P., Zheng, Y. M., Chen, Z. C., Fan, M. L., et al. (2022). Spatiotemporal evolution characteristics of urbanization in the xiamen special economic zone based on nighttime-light data from 1992 to 2020. Land 11 (8), 1264. doi:10.3390/land11081264
Chen, Z. Q., Yu, B. L., Yang, C. S., Zhou, Y. Y., Yao, S. J., Qian, X. J., et al. (2021). An extended time series (2000-2018) of global NPP-VIIRS-like nighttime light data from a cross-sensor calibration. Earth Syst. Sci. Data 13 (3), 889–906. doi:10.5194/essd-13-889-2021
Cheng, W., and Ning, T. (2018). Spatio-temporal characteristics and evolution of rural production-living-ecological space function coupling coordination in Chongqing Municipality. Geogr. Res. 37 (6), 1100–1114. doi:10.11821/dlyj201806004
Cui, D., Chen, X., Xue, Y. L., Li, R., and Zeng, W. H. (2019). An integrated approach to investigate the relationship of coupling coordination between social economy and water environment on urban scale - a case study of Kunming. J. Environ. Manag. 234, 189–199. doi:10.1016/j.jenvman.2018.12.091
Dou, Y. Y., and Kuang, W. H. (2020). A comparative analysis of urban impervious surface and green space and their dynamics among 318 different size cities in China in the past 25 years. Sci. Total Environ. 706, 135828. doi:10.1016/j.scitotenv.2019.135828
Ermida, S. L., Soares, P., Mantas, V., Gottsche, F. M., and Trigo, I. E. (2020). Google Earth engine open-source code for land surface temperature estimation from the Landsat series. Remote Sens. 12 (9), 1471. doi:10.3390/rs12091471
Fang, C. L., Liu, H. M., and Li, G. D. (2016). International progress and evaluation on interactive coupling effects between urbanization and the eco-environment. J. Geogr. Sci. 26 (8), 1081–1116. doi:10.1007/s11442-016-1317-9
Fang, C. L., Liu, H. M., and Wang, S. J. (2021). The coupling curve between urbanization and the eco-environment: China's urban agglomeration as a case study. Ecol. Indic. 130, 108107. doi:10.1016/j.ecolind.2021.108107
Forbes, D. J. (2013). Multi-scale analysis of the relationship between economic statistics and DMSP-OLS night light images. Giscience Remote Sens. 50 (5), 483–499. doi:10.1080/15481603.2013.823732
Geng, Y. Q., and Zhang, H. (2020). Coordination assessment of environment and urbanization: Hunan case. Environ. Monit. Assess. 192 (10), 637. doi:10.1007/s10661-020-08598-3
Han-qiu, X. (2013). A remote sensing index for assessment of regional ecological changes. China Environ. Sci. 33 (5), 889–897. doi:10.3969/j.issn.1000-6923.2013.05.019
Huang, H. B., Lin, C. Q., Yu, R. L., Yan, Y., Hu, G. R., and Li, H. J. (2019). Contamination assessment, source apportionment and health risk assessment of heavy metals in paddy soils of Jiulong River Basin, Southeast China. Rsc Adv. 9 (26), 14736–14744. doi:10.1039/c9ra02333j
Ji, J. W., Tang, Z. Z., Zhang, W. W., Liu, W. L., Jin, B., Xi, X., et al. (2022). Spatiotemporal and multiscale analysis of the coupling coordination degree between economic development equality and eco-environmental quality in China from 2001 to 2020. Remote Sens. 14 (3), 737. doi:10.3390/rs14030737
Ji, J. W., Wang, S. X., Zhou, Y., Liu, W. L., and Wang, L. T. (2021). Spatiotemporal change and coordinated development analysis of “population-society-economy-resource-ecology-environment” in the jing-jin-ji urban agglomeration from 2000 to 2015. Sustainability 13 (7), 4075. doi:10.3390/su13074075
Li, W. W., and Yi, P. T. (2020). Assessment of city sustainability-Coupling coordinated development among economy, society and environment. J. Clean. Prod. 256, 120453. doi:10.1016/j.jclepro.2020.120453
Li, X. Q., Han, G. L., Dong, A. G., Liu, M., and Yang, K. H. (2018). Hydrogeochemical characteristics and controlling factors in Jiulong River (Fujian Province) during the flood season. Chin. J. Ecol. 37 (3), 697–706.
Li, Y., Ye, H. P., Gao, X., Sun, D. Q., Li, Z. H., Zhang, N. H., et al. (2021a). Spatiotemporal patterns of urbanization in the three most developed urban agglomerations in China based on continuous nighttime light data (2000-2018). Remote Sens. 13 (12), 2245. doi:10.3390/rs13122245
Li, Y., Ye, H. P., Sun, X., Zheng, J., and Meng, D. (2021b). Coupling analysis of the thermal landscape and environmental carrying capacity of urban expansion in beijing (China) over the past 35 years. Sustainability 13 (2), 584. doi:10.3390/su13020584
Li, Z. L., Tang, R., Wan, Z., Bi, Y., Zhou, C., Tang, B., et al. (2009). A review of current methodologies for regional evapotranspiration estimation from remotely sensed data. Sensors 9 (5), 3801–3853. doi:10.3390/s90503801
Liu, K., Qiao, Y. R., Shi, T., and Zhou, Q. (2021). Study on coupling coordination and spatiotemporal heterogeneity between economic development and ecological environment of cities along the Yellow River Basin. Environ. Sci. Pollut. Res. 28 (6), 6898–6912. doi:10.1007/s11356-020-11051-0
Mafi-Gholami, D., and Baharlouii, M. (2019). Monitoring long-term mangrove shoreline changes along the northern coasts of the Persian gulf and the Oman sea. Emerg. Sci. J. 3, 88. doi:10.28991/esj-2019-01172
Peng, J., Loew, A., Merlin, O., and Verhoest, N. E. C. (2017). A review of spatial downscaling of satellite remotely sensed soil moisture. Rev. Geophys. 55 (2), 341–366. doi:10.1002/2016rg000543
Quan-pei, W., Yue-hua, Z., Zhi-guo, H., Lan, L., Li, W., and Lei, Z. (2017). Risk changes of storm flood disasters in southeast China under climatic warming. Chin. J. Ecol. 36 (2), 483–490. doi:10.13292/j.1000-4890.201702.005
Shao, Z. F., Ding, L., Li, D. R., Altan, O., Huq, M. E., and Li, C. M. (2020). Exploring the relationship between urbanization and ecological environment using remote sensing images and statistical data: A case study in the Yangtze River Delta, China. Sustainability 12 (14), 5620. doi:10.3390/su12145620
Shen, L. Y., Huang, Y. L., Huang, Z. H., Lou, Y. L., Ye, G., and Wong, S. W. (2018). Improved coupling analysis on the coordination between socio-economy and carbon emission. Ecol. Indic. 94, 357–366. doi:10.1016/j.ecolind.2018.06.068
Shen, Z., and Zeng, J. (2020). Analysis of spatiotemporal patterns and evolution of regional thermal islands in Fujian Delta urban agglom-eration during decade of 1996-2017. J. Saf. Environ. 20 (04), 1567–1578. doi:10.13637/j.issn.1009-6094.2019.1149
Tang, P. L., Huang, J. J., Zhou, H., Fang, C. L., Zhan, Y. J., and Huang, W. (2021). Local and telecoupling coordination degree model of urbanization and the eco-environment based on rs and gis: A case study in the wuhan urban agglomeration. Sustain. Cities Soc. 75, 103405. doi:10.1016/j.scs.2021.103405
Tian, S. Z., Feng, R. Y., Zhao, J., and Wang, L. Z. (2021). An analysis of the work resumption in China under the COVID-19 epidemic based on night time lights data. Isprs Int. J. Geo-Information 10 (9), 614. doi:10.3390/ijgi10090614
Uniyal, B., Jha, M., and Verma, A. (2015). Assessing climate change impact on water balance components of a River Basin using SWAT model. Water Resour. Manag. 29 (13), 4767–4785. doi:10.1007/s11269-015-1089-5
Wang J, J., Zhao, M., Zhong, W., Li, J. B., and Zheng, C. Y. (2022). Coupling relationship of urban development and the eco-environment in guanzhong region, China. Sustainability 14 (5), 2969. doi:10.3390/su14052969
Wang Q, Q., Wang, X., and Li, R. (2022). Does urbanization redefine the environmental Kuznets curve? An empirical analysis of 134 countries. Sustain. Cities Soc. 76, 103382. doi:10.1016/j.scs.2021.103382
Xu, D., Cheng, J., Xu, S., Geng, J., Yang, F., Fang, H., et al. (2022). Understanding the relationship between China's eco-environmental quality and urbanization using multisource remote sensing data. Remote Sens. 14 (1), 198. doi:10.3390/rs14010198
Xu, D., Yang, F., Yu, Y., Zhou, Y. Y., Li, H. X., Ma, J. J., et al. (2021). Quantization of the coupling mechanism between eco-environmental quality and urbanization from multisource remote sensing data. J. Clean. Prod. 321, 128948. doi:10.1016/j.jclepro.2021.128948
Zhang, F., Ju, S. B., Chan, N. W., Ariken, M., Tan, M. L., Yushanjiang, A., et al. (2022). Coupled analysis of new urbanization quality (NUQ) and eco-environmental carrying capacity (EECC) of prefecture-level and above cities in China during 2003-2016. Environ. Dev. Sustain. 24 (6), 8008–8038. doi:10.1007/s10668-021-01771-9
Zhang, Q., and Seto, K. C. (2011). Mapping urbanization dynamics at regional and global scales using multi-temporal DMSP/OLS nighttime light data. Remote Sens. Environ. 115 (9), 2320–2329. doi:10.1016/j.rse.2011.04.032
Zhao, W. J., Yan, T. T., Ding, X., Peng, S. Z., Chen, H. N., Fu, Y. C., et al. (2021). Response of ecological quality to the evolution of land use structure in Taiyuan during 2003 to 2018. Alexandria Eng. J. 60 (1), 1777–1785. doi:10.1016/j.aej.2020.11.026
Keywords: Jiulong River basin, coupling coordination degree model, ecological environment quality, urbanization, remote sensing ecological index, nighttime light
Citation: Liao Y, Liu G, Luan H, Deng G, Zheng M and Cai W (2023) Study of the relationship between urbanization and environment in the Jiulong river basin based on coupling coordination degree model. Front. Environ. Sci. 11:1105007. doi: 10.3389/fenvs.2023.1105007
Received: 22 November 2022; Accepted: 14 April 2023;
Published: 03 May 2023.
Edited by:
Marco Casazza, University of Salerno, ItalyReviewed by:
Xiang Zhang, Wuhan University, ChinaCopyright © 2023 Liao, Liu, Luan, Deng, Zheng and Cai. This is an open-access article distributed under the terms of the Creative Commons Attribution License (CC BY). The use, distribution or reproduction in other forums is permitted, provided the original author(s) and the copyright owner(s) are credited and that the original publication in this journal is cited, in accordance with accepted academic practice. No use, distribution or reproduction is permitted which does not comply with these terms.
*Correspondence: Guangsheng Liu, bGl1Z3NAeG11dC5lZHUuY24=; Haijun Luan, aGFpanVuLmx1YW5AbmF0ZWtvLmx1LnNl
†Present address:
Haijun Luan, Institute of Big Data for Natural Hazards Monitoring of Fujian Development and Reform Commission, Xiamen University of Technology, Xiamen, China
Disclaimer: All claims expressed in this article are solely those of the authors and do not necessarily represent those of their affiliated organizations, or those of the publisher, the editors and the reviewers. Any product that may be evaluated in this article or claim that may be made by its manufacturer is not guaranteed or endorsed by the publisher.
Research integrity at Frontiers
Learn more about the work of our research integrity team to safeguard the quality of each article we publish.