 B. B. Cael
 David A. Seekell
94% of researchers rate our articles as excellent or good
Learn more about the work of our research integrity team to safeguard the quality of each article we publish.
Find out more
PERSPECTIVE article
Front. Environ. Sci., 21 February 2023
Sec. Freshwater Science
Volume 11 - 2023 | https://doi.org/10.3389/fenvs.2023.1103068
Kleiber’s 3/4-scaling law for metabolism with mass is one of the most striking regularities in biological sciences. Kleiber’s law has been shown to apply not only to individual organisms but also to communities and even the whole-ecosystem properties such as the productivity of estuaries. Might Kleiber’s law also then apply to lake ecosystems? Here, we show that for a collection of whole-lake primary production measurements, production scales to the 3/4 power of lake volume, consistent with Kleiber’s law. However, this relationship is not explicable by analogy to theories developed for individual organisms. Instead, we argue that dimensional analysis offers a simple explanation. After accounting for latitudinal gradients in temperature and insolation, whole-lake primary production scales isometrically with lake area. Because Earth’s topography is self-affine, meaning there are global-scale differences between vertical and horizontal scaling of topography, lake volume scales super-linearly with lake surface area. 3/4 scaling for primary production by volume then results from these other two scaling relationships. The identified relationship between the primary production and temperature- and insolation-adjusted area may be useful for constraining lakes’ global annual productivity and photosynthetic efficiency. More generally, this suggests that there are multiple paths to realizing the 3/4 scaling of metabolism rather than a single unifying law, at least when comparing across levels of biological organization.
Kleiber’s law states that metabolism scales to the three-quarters power of mass (West et al., 1997; Dodds et al., 2001; Banavar et al., 2010). Its persistence across diverse species and ecosystems has fascinated successive generations of biologists and motivated many attempts to provide a general explanation, which often require new ways of viewing biological systems (West et al., 1997; Dodds et al., 2001; López-Urrutia et al., 2006; Banavar et al., 2010). Observations in recent years have shown that this metabolic principle for individual organisms also applies to the whole-ecosystem properties, such as predator–prey ratios (Hatton et al., 2015) or estuarine productivity (Nidzieko, 2018), implying a far greater generality and that in certain respects, ecosystems self-organize to behave like superorganisms. However, the specificity of a 3/4-exponent is a challenging criterion for the admissibility of theoretical models, and the mathematical and biological validity of many candidate models is contested (Dodds et al., 2001). The mechanisms underlying this strikingly universal scaling law are, therefore, still unclear and, furthermore, may be different in different instances.
Kleiber’s law has been shown to be applied to community- and ecosystem-level properties which suggest that it may also be applicable for lakes. Here, we explore this question by compiling and analyzing the whole-lakes’ productivity and size data. We found a 3/4-power scaling between whole-lake primary production and volume. However, we argue that this is simply the result of two other scaling relationships between these properties and lake surface area, which are based on well-established, simpler mechanisms than those invoked to explain the 3/4 scaling of metabolism in other systems. Lakes may therefore be an example of an alternative way that the 3/4 scaling of metabolism is realized, at least for community-level ecosystem properties. Additionally, the relationship that we identify between whole-lake primary productivity and surface area accounts for latitudinal differences in insolation and temperature, and we discuss how this approach may be useful for constraining lake productivity over large regions.
We compiled the rates of whole-lake primary production from published sources. Primary production was estimated using several methods, but all included habitat-specific measurements in the benthic and pelagic zones. We used rates that are the daily average across the productive ice-free season. When annual rates were provided, we converted them to productive season rates based on season lengths stated in the original publication or based on the graphs of seasonal patterns provided in the original publication. We did not include the estimates of macrophyte production, which are rarely reported (Vadeboncoeur and Steinman, 2002). We did not include primary production estimated from free-water oxygen sensors because such measurements are typically made with a single sensor in the mixed layer at the center of the lake, and these deployments often do not capture benthic primary production when lakes are stratified (Van de Bogert et al., 2007; Staehr et al., 2010; Staehr et al., 2012). Our study focuses on whole-ecosystem primary production and in many regions the vast majority (80+%) of this production is benthic (Seekell et al., 2015; Klaus et al., 2022; Norman et al., 2022). Therefore, we compiled data from studies that specifically include both benthic and pelagic measurements. We did not attempt to control for differences in rates that might arise from methodological variation in the source of data. These variations arise from differences in incubation techniques including the length and the specific technique for measuring production (change in dissolved oxygen concentration and radio carbon uptake), and up-scaling from measurements to ecosystem scales. Inability to adjust for these types of variations is a shared feature of studies based on the compilations of production measurements, including those based on the compilations of measurements from high frequency oxygen sensors. Volume is an appropriate analog for mass in our study because water density varies relatively little among lakes, even those that are thermally stratified. In total, we compiled data for 73 lakes with seven orders of magnitude variation in volume (60 m3 - 2.8 × 10⁹ m3). Because benthic primary production is difficult to measure (Puts I. et al., 2022), whole-lake productivity measurements are uncommon, and so our compilation contains nearly three times more lakes than the next largest, allowing us to potentially describe novel patterns like this quarter-power relationship. Even global studies have a small number of lakes compared to what is compiled here (Puts I. C et al., 2022); (Vadeboncoeur et al., 2003); (Seekell et al., 2015). Table 1 shows the basic characteristics of the lakes in our compilation, which is also included as a supplemental file.
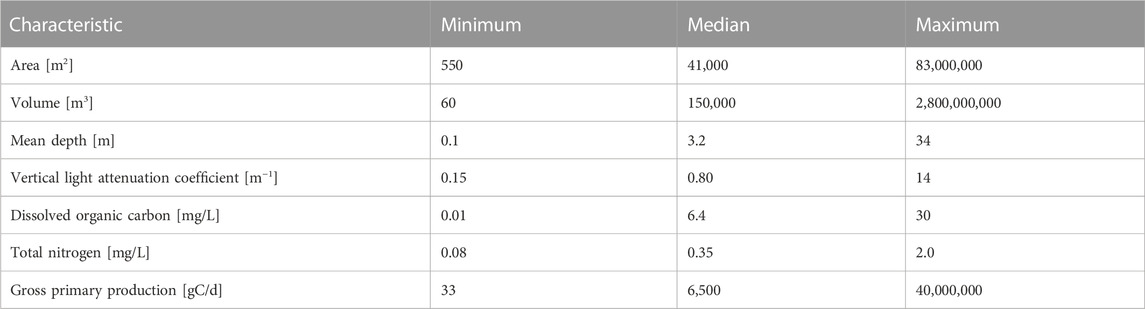
TABLE 1. Characteristics of lakes included in the study. Data are reported to two significant digits for simplicity and consistency, but the full reported significant digits are used for all calculations of all variables in our analyses.
We used type I regression of the log-transformed variables for our scaling analysis (i.e., regressed y against x in the most common way, where in each case y and x are the logarithms of the variable of interest). Among the different methods available to conduct allometric analysis, this is particularly appropriate for our analysis because in our data, the uncertainty in the independent variable in each case is negligible to that of the dependent variable. To calculate the best estimates and uncertainties robustly provided the distribution of the data, we used bootstrapping. We computed median estimates and standard errors of the scaling exponents by bootstrapping 106 times (ten 105 subsets agreed to three significant digits, indicating that this is a sufficient number of bootstrap iterations). Uncertainties throughout this paper are a one standard error and are propagated from the bootstrap uncertainties in the scaling coefficients. To investigate the influence of other variables robustly, we used Kendall’s tau to compare these against the residuals of the area-production and area-volume scaling relationships.
The energetics of photosynthesis are light- and temperature-dependent (López-Urrutia et al., 2006; Cael et al., 2017a). Both light and temperature vary systematically with latitude, and therefore we accounted for latitudinal differences among lakes by adjusting the lake area (ATI) according to
where I(y) is the annual mean clear-sky insolation (W m−2) at latitude y (Hartmann, 2015), Ea is the average activation energy of photosynthesis (0.32 eV) (López-Urrutia et al., 2006), k is Boltzmann’s constant (8.6 × 10⁻⁵ eV K−1), and T(y) is the annual mean surface temperature in Kelvin as a function of latitude (Hartmann, 2015). In essence, the lake area is modified so as to also absorb latitudinal differences in light and insolation. To do this, we converted latitude to temperature and light by fitting Fourier series to the annual mean surface temperature and insolation vs. latitude between 39–75°N, encompassing the latitudinal range of the lakes we considered; we chose the Fourier series degree (1st and 2nd order, respectively) with the best adjusted r2, which is r2 > 0.99 in each case. This adjustment accounts for gradients in insolation and temperature by normalizing to the latitude 58.5°N, which has a mean annual surface temperature of ∼0 °C. Notably, this choice of temperature is arbitrary and does not affect our results. The advantage of introducing this adjustment to the area instead of primary production is that it preserves the ability to directly compare r2 and root square mean error (RMSE) values among the various scaling relationships in our study (Figure 1). This approach is consistent with previous applications of adjustments for the impact of variation in insolation and temperature on metabolic scaling (López-Urrutia et al., 2006; Cael et al., 2017a).

FIGURE 1. (A) Lake volume (V) vs. whole-lake gross primary production (P), (B) lake area (A) vs. whole-lake gross primary production, (C) lake area vs. lake volume, and (D) temperature (T)- and light (I)-corrected lake area, for the data used in this study. See text for T-and-I-correction procedure. Exponents in each legend are the mean and standard deviation of the slopes of bootstrapped iterations of type I regression of the log-transformed variables; coefficient of variation (r2) and root mean square error (RMSE) are also those for the type I regression of the log-transformed variables, represented by the solid lines, in each case.
We estimated global lake primary production for lakes
We calculated photosynthetic efficiency based on the one parameter model P = βATI, where β is proportional to the photosynthetic efficiency at 0°C. We convert β to a photosynthetic efficiency from using the Gibbs free energy of 39,748 J to convert a gram of CO2 to glucose and comparing to
We found three-quarters power scaling of whole-lake (benthic + pelagic) gross primary production (GPP) by volume (Figure 1A),
The production-volume scaling exponent was significantly greater than the 2/3 scaling (94.9% bootstrap probability), which is a null hypothesis for volume–area relationships (Dodds et al., 2001). This result agrees with the 3/4-power scaling of ecosystem-scale primary production in estuaries (Nidzieko, 2018), supporting the idea that the regularities that engender Kleiber’s law extend to higher levels of biological organization than those of organisms or communities (Hatton et al., 2015). However, explanations for Kleiber’s law at the individual level are typically based on optimal resource distribution networks (West et al., 1997; Dodds et al., 2001; Banavar et al., 2010; Nidzieko, 2018), which are based on a one-way flow of nutrients. Analogous explanations for ecosystems are especially unclear for lakes because primary producers can be supplied significant recycled nutrients from the sediments and particularly because myriad factors influence aquatic primary productivity (Orihel et al., 2017).
What might be a simpler explanation for this 3/4 scaling, then? The total nitrogen concentration, dissolved organic carbon concentration, and the vertical light attenuation coefficient were not correlated with the residuals of this relationship (nor any other scaling relationship reported here), suggesting that these cannot be invoked to explain it. Latitude, however, is correlated (p
We also observed that lake primary production scales super-linearly (98.3% probability) with surface areas (Figure 1B), but latitude is again correlated (p
It is also known that the volume and surface area conform to power-law scaling relationships in lakes (Cael et al., 2017b). Earth’s topography is well-characterized as a self-affine random fractal (Gagnon et al., 2006; Cael et al., 2017b). This means that topography scales differently in the horizontal and vertical directions. The difference in vertical and horizontal scaling is characterized by the Hurst exponent H, which varies between 0 and 1. Cael et al. (2017b) showed that a topography’s self-affinity imprints on the volume–area scaling of lakes embedded on that topography, such that the lake volume scales to the lake area by
The volume–area scaling exponent of 1.33 within our dataset (Figure 1C) is exactly consistent with the recent estimates of H for Earth’s topography (Gagnon et al., 2006).
The primary production scales isometrically with the area, and it is, therefore, clear from the volume area-scaling that primary production scales sub-linearly with volume, with the 3/4-exponent emerging based on the Hurst exponent. Hence, we propose the simple explanation that Kleiber’s law applies for lakes because lake GPP is isometric with the lake area and because of the self-affinity of Earth’s topography.
Power-laws arise from scale-invariance, in this case, because a single process—photosynthesis—is responsible for primary production across the full range of lake sizes (Stumpf and Porter, 2012). Isometric scaling, in particular, is indicative of solar insolation as the primary factor structuring variation in primary production among lakes, even though photosynthesis depends on many factors such as light attenuation, which varies by two orders of magnitude (0.15–14 m−1) for the lakes shown in Figure 1. The number of photons reaching the lake should be proportional to the area. Isometric scaling of lake primary production with surface areas has been independently reported for lakes in Denmark, providing some evidence that this key pattern is not specific to the lakes we consider or an artifact of our data compilation or normalization procedure (Staehr et al., 2012).
Other factors constraining productivity are often considered proportional to the shore length and would result in sub-linear scaling between production and areas; nutrient concentrations are one such example of this (Hanson et al., 2007), though nutrients supply is also influenced by other factors such as catchment size, hydrology, and land use. This is consistent with the lack of correlations between other variables that we investigated with the residuals from our scaling relationships. These patterns do not minimize the role of nutrients or herbivory in shaping the patterns of primary production, particularly in lakes subject to eutrophication (Carpenter et al., 1987; Schindler, 2012). In other words, our point is that in lakes as in other systems (Nidzieko, 2018), the essence of global patterns of ecosystem primary production lies in the size of the system. It is unlikely that a small hyper-eutrophic lake will fix more carbon than an ultra-oligotrophic lake and many orders of magnitude larger in size. The effects of nutrients and herbivory play out in significant ways at different scales within the broader context of these scaling relationships.
The relationship we identify may also be useful in estimating primary production in the collections of lakes. Based on our scaling relationships and the HydroLAKES database, we estimate that lake primary production north of 40°N is 265 (±3) Tg C y−1. This implies an areal productivity rate of 113 ± 14 gC m−2 y−1, significantly different compared to the 76 gC m−2 y−1, which would be obtained by a simple up-scaling, using the average areal productivity rate across the lakes analyzed here (but still considering the length of the ice-free season). We do not extrapolate our relationship equatorwards from 40°N because the southernmost lake in our data compilation is at 39°N, though the processes on which the temperature- and insolation-adjusted area calculation is based are general and not restricted to these latitudes. This estimate is intended to illustrate that the relationship we identify may be useful in constraining global scale patterns of lake carbon cycling.
Lakes are traditionally studied individually or as few systems in close proximity, but our study is illustrative of the diverse and exciting emergent patterns that await global scale analysis of lakes’ ecosystems. We argue that the observed Kleiber’s law-like production-volume scaling for lakes is rooted in the interaction between the self-affinity of Earth’s topography and the isometric scaling of primary production with the area, which themselves may have implications for patterns of the structure and function of lake ecosystems at the global scale. Our explanation differs fundamentally from most explanations of Kleiber’s law in organisms because it arises from the randomness that characterizes self-affine surfaces rather than a mechanism rooted in principles of optimality, whether they be for nutrient distribution, heat dispersion, or some other factors Dodds et al. (2001); Gagnon et al. (2006). This suggests that there may be multiple pathways to Kleiber’s law instead of a single unifying mechanism, at least when comparing across the levels of biological organization.
We have shown that for a data compilation of whole-lake productivity, lake productivity scales with lake size (volume) to the 3/4-power. However, the theories used to explain this in other systems are not applicable to lakes. Instead, we have shown that productivity scales exactly linearly with area once accounting for differences in temperature and latitude, and lake volume scales superlinearly with area because Earth’s topography is self-affine. As a result of these two scaling laws, productivity scales with volume to the 3/4-power. Our insolation-and-temperature-corrected area vs. productivity relationship can be used to generate improved estimates of lake production over the collections of lakes. These results also provide an interesting example of an alternate route to 3/4-power scaling in biological systems.
Publicly available datasets were analyzed in this study. Code and data are available at github.com/bbcael. And given a Zenodo DOI should this manuscript be accepted.
BC contributed equally to this work with DS. BC and DS conceptualized the study. DS compiled the dataset. BC conducted the analysis. BC and DS wrote the manuscript.
This paper is based on research supported by the National Environmental Research Council (grants NE/N018087/1, NE/T010622/1, and NE/R015953/1), the Knut and Alice Wallenberg Foundation, and Umeå University.
The authors declare that the research was conducted in the absence of any commercial or financial relationships that could be construed as a potential conflict of interest.
All claims expressed in this article are solely those of the authors and do not necessarily represent those of their affiliated organizations, or those of the publisher, the editors, and the reviewers. Any product that may be evaluated in this article, or claim that may be made by its manufacturer, is not guaranteed or endorsed by the publisher.
The Supplementary Material for this article can be found online at: https://www.frontiersin.org/articles/10.3389/fenvs.2023.1103068/full#supplementary-material
Banavar, J. R., Moses, M. E., Brown, J. H., Damuth, J., Rinaldo, A., Sibly, R. M., et al. (2010). A general basis for quarter-power scaling in animals. Proc. Natl. Acad. Sci. 107, 15816–15820. doi:10.1073/pnas.1009974107
Cael, B., Bisson, K., and Follows, M. J. (2017a). How have recent temperature changes affected the efficiency of ocean biological carbon export? Limnol. Oceanogr. Lett. 2, 113–118. doi:10.1002/lol2.10042
Cael, B., Heathcote, A., and Seekell, D. (2017b). The volume and mean depth of Earth’s lakes. Geophys. Res. Lett. 44, 209–218. doi:10.1002/2016gl071378
Carpenter, S. R., Kitchell, J. F., Hodgson, J. R., Cochran, P. A., Elser, J. J., Elser, M. M., et al. (1987). Regulation of lake primary productivity by food web structure. Ecology 68, 1863–1876. doi:10.2307/1939878
Dodds, P. S., Rothman, D. H., and Weitz, J. S. (2001). Re-examination of the “3/4-law” of metabolism. J. Theor. Biol. 209, 9–27. doi:10.1006/jtbi.2000.2238
Gagnon, J.-S., Lovejoy, S., and Schertzer, D. (2006). Multifractal Earth topography. Nonlinear Process. Geophys. 13, 541–570. doi:10.5194/npg-13-541-2006
Hanson, P. C., Carpenter, S. R., Cardille, J. A., Coe, M. T., and Winslow, L. A. (2007). Small lakes dominate a random sample of regional lake characteristics. Freshw. Biol. 52, 814–822. doi:10.1111/j.1365-2427.2007.01730.x
Hatton, I. A., McCann, K. S., Fryxell, J. M., Davies, T. J., Smerlak, M., Sinclair, A. R., et al. (2015). The predator-prey power law: Biomass scaling across terrestrial and aquatic biomes. Science 349, aac6284. doi:10.1126/science.aac6284
Klaus, M., Verheijen, H. A., Karlsson, J., and Seekell, D. A. (2022). Depth and basin shape constrain ecosystem metabolism in lakes dominated by benthic primary producers. Limnol. Oceanogr. 67, 2763–2778. doi:10.1002/lno.12236
López-Urrutia, Á., San Martin, E., Harris, R. P., and Irigoien, X. (2006). Scaling the metabolic balance of the oceans. Proc. Natl. Acad. Sci. 103, 8739–8744. doi:10.1073/pnas.0601137103
Nidzieko, N. J. (2018). Allometric scaling of estuarine ecosystem metabolism. Proc. Natl. Acad. Sci. 115, 6733–6738. doi:10.1073/pnas.1719963115
Norman, S., Nilsson, K. A., Klaus, M., Seekell, D., Karlsson, J., and Byström, P. (2022). Effects of habitat-specific primary production on fish size, biomass, and production in northern oligotrophic lakes. Ecosystems 25, 1555–1570. doi:10.1007/s10021-021-00733-6
Orihel, D. M., Baulch, H. M., Casson, N. J., North, R. L., Parsons, C. T., Seckar, D. C., et al. (2017). Internal phosphorus loading in canadian fresh waters: A critical review and data analysis. Can. J. Fish. Aquatic Sci. 74, 2005–2029. doi:10.1139/cjfas-2016-0500
Puts, I., Bergström, A.-K., Verheijen, H., Norman, S., and Ask, J. (2022). An ecological and methodological assessment of benthic gross primary production in northern lakes. Ecosphere 13, e3973. doi:10.1002/ecs2.3973
Puts, I. C., Ask, J., Siewert, M. B., Sponseller, R. A., Hessen, D. O., and Bergström, A.-K. (2022). Landscape determinants of pelagic and benthic primary production in northern lakes. Glob. Change Biol. 28, 7063–7077. doi:10.1111/gcb.16409
Schindler, D. W. (2012). The dilemma of controlling cultural eutrophication of lakes. Proc. R. Soc. B Biol. Sci. 279, 4322–4333. doi:10.1098/rspb.2012.1032
Seekell, D. A., Lapierre, J.-F., Ask, J., Bergström, A.-K., Deininger, A., Rodríguez, P., et al. (2015). The influence of dissolved organic carbon on primary production in northern lakes. Limnol. Oceanogr. 60, 1276–1285. doi:10.1002/lno.10096
Staehr, P. A., Baastrup-Spohr, L., Sand-Jensen, K., and Stedmon, C. (2012). Lake metabolism scales with lake morphometry and catchment conditions. Aquat. Sci. 74, 155–169. doi:10.1007/s00027-011-0207-6
Staehr, P. A., Bade, D., Van de Bogert, M. C., Koch, G. R., Williamson, C., Hanson, P., et al. (2010). Lake metabolism and the diel oxygen technique: State of the science. Limnol. Oceanogr. Methods 8, 628–644. doi:10.4319/lom.2010.8.0628
Stumpf, M. P. H., and Porter, M. A. (2012). Critical truths about power laws. Science 335, 665–666. doi:10.1126/science.1216142
Vadeboncoeur, Y., Jeppesen, E., Zanden, M. J. V., Schierup, H.-H., Christoffersen, K., and Lodge, D. M. (2003). From Greenland to green lakes: Cultural eutrophication and the loss of benthic pathways in lakes. Limnol. Oceanogr. 48, 1408–1418. doi:10.4319/lo.2003.48.4.1408
Vadeboncoeur, Y., and Steinman, A. D. (2002). Periphyton function in lake ecosystems. Sci. World J. 2, 1449–1468. doi:10.1100/tsw.2002.294
Van de Bogert, M. C., Carpenter, S. R., Cole, J. J., and Pace, M. L. (2007). Assessing pelagic and benthic metabolism using free water measurements. Limnol. Oceanogr. Methods 5, 145–155. doi:10.4319/lom.2007.5.145
West, G. B., Brown, J. H., and Enquist, B. J. (1997). A general model for the origin of allometric scaling laws in biology. Science 276, 122–126. doi:10.1126/science.276.5309.122
Weyhenmeyer, G. A., Livingstone, D. M., Meili, M., Jensen, O., Benson, B., and Magnuson, J. J. (2011). Large geographical differences in the sensitivity of ice-covered lakes and rivers in the northern hemisphere to temperature changes. Glob. Change Biol. 17, 268–275. doi:10.1111/j.1365-2486.2010.02249.x
Keywords: gross primary production, allometric scaling, metabolic theory, Kleiber’s law, global limnology
Citation: Cael BB and Seekell DA (2023) How does lake primary production scale with lake size?. Front. Environ. Sci. 11:1103068. doi: 10.3389/fenvs.2023.1103068
Received: 19 November 2022; Accepted: 17 January 2023;
Published: 21 February 2023.
Edited by:
Qinghua Cai, Institute of Hydrobiology (CAS), ChinaReviewed by:
Yueming Qu, UK Centre for Ecology and Hydrology (UKCEH), United KingdomCopyright © 2023 Cael and Seekell. This is an open-access article distributed under the terms of the Creative Commons Attribution License (CC BY). The use, distribution or reproduction in other forums is permitted, provided the original author(s) and the copyright owner(s) are credited and that the original publication in this journal is cited, in accordance with accepted academic practice. No use, distribution or reproduction is permitted which does not comply with these terms.
*Correspondence: B. B. Cael, Y2FlbEBub2MuYWMudWs=
Disclaimer: All claims expressed in this article are solely those of the authors and do not necessarily represent those of their affiliated organizations, or those of the publisher, the editors and the reviewers. Any product that may be evaluated in this article or claim that may be made by its manufacturer is not guaranteed or endorsed by the publisher.
Research integrity at Frontiers
Learn more about the work of our research integrity team to safeguard the quality of each article we publish.