 A. Pistocchi
 C. Dorati1
 F. Galimberti
 A. Udias
 S. Bopp
 R. Catarino
94% of researchers rate our articles as excellent or good
Learn more about the work of our research integrity team to safeguard the quality of each article we publish.
Find out more
ORIGINAL RESEARCH article
Front. Environ. Sci. , 25 April 2023
Sec. Toxicology, Pollution and the Environment
Volume 11 - 2023 | https://doi.org/10.3389/fenvs.2023.1101316
This article is part of the Research Topic Legacy & Emerging Contaminants in the Aquatic Environment View all 11 articles
Pesticides can be an important stressor to aquatic ecosystems, and their use is strictly regulated in the European Union (EU). However, data on the use of pesticides are rather limited and poorly available, and monitoring is often insufficient to characterize their actual exposure and impact. The aim of the work presented here is to harness the limited data available and assess, for the first time, the distribution of concentrations and toxicity of 148 pesticide active substances (AS) for the whole EU. Starting from available estimates of pesticide use in agriculture and a simple screening-level model of their fate and transport, we quantify pesticide concentrations in soil and water. A comparison with monitoring data shows that predicted water concentrations are in plausible orders of magnitude, hence the model can be regarded as a first-approximation representation of the distribution of pesticides in the environment. The toxicity of individual pesticide active substances (AS) is characterized by their concentrations divided by the respective no observed effect concentrations (NOEC) for aquatic organisms, which represents the “toxic units” (TU) of each AS. The cumulative toxicity of pesticides in soils and streams of the EU is obtained by summing the TU of individual AS. We estimate that the toxicity of individual AS is generally well below 0.1 TU, indicating relatively safe environmental exposure. However, the cumulative toxicity of a mixture of AS can exceed 0.1 toxic units (TU) for more than 27% of the length of the EU’s stream network, and 1 TU for more than 4%. The cumulative toxicity at a given location is driven by only a handful of AS, but these differ from site to site reflecting the variability of pesticide use. Still, we estimate that only about 20 AS out of 148 appear among the top contributors to cumulative toxicity in most cases. While our assessment suggests a relatively widespread risk due to pesticide pollution, it also points to the important limitations concerning knowledge of pesticide use and monitoring of pesticide occurrence in the environment. These limitations need to be addressed in order to evaluate more accurately the effectiveness of EU pesticide policies. The assessment represents a proof-of-concept of a method that can be applied in support of the monitoring of pesticide policies implementation in the EU and elsewhere, once pesticide use can be estimated.
Pesticide fate in the environment has long been an issue of concern for the civil society around the world. Early ecologist literature, including famous Rachel Carson’s Silent spring (Carson, 1962), has flagged the presence of these chemicals even in areas remote from their application as a strong evidence of the capability of mankind to poison the global environment. Besides the decline in the abundance and diversity of terrestrial organisms, such as Lepidoptera (butterflies), Hymenoptera (honeybees, bumblebees) and beetles (ladybirds, carabids) mainly found in agricultural areas, also freshwater organisms show a high proportion of threatened species as a consequence of exposure to a number of stressors including pesticides (Sala et al., 2000; Vörösmarty et al., 2010). The concern has fostered the ongoing development of stringent legislation on the management of pesticides (EU, 2009b; EU, 2005; European Commission, 2006a; European Commission, 2002; EU, 2009a; European Commission, 2022). The use of pesticides, and related risks, are also considered a criterion to assess the environmental performance of agriculture in the EU (European Commission, 2006b), and is addressed as one of the key aspects of concern in the recent European Farm to Fork (European Commission, 2020b) and Biodiversity strategies (European Commission, 2015; European Commission, 2020a). Moreover, a number of pesticides are included in the list of priority substances targeted by the European Water Framework Directive and related directives (EU, 2000; EU, 2006), which aim at an overall reduction of chemical risk in aquatic ecosystems. Pesticides are widely applied in modern agriculture, typically in sequence during the vegetation period, where pesticide products may contain multiple active substances (Auber et al., 2011; Chiaia-Hernandez et al., 2017). Consequently, in agricultural regions pesticides occur as mixtures in soils (Chiaia-Hernandez et al., 2017), ground waters (Gilliom, 2007; Munira et al., 2018) and surface water bodies (Schäfer et al., 2013; Schreiner et al., 2016). The distribution of pesticides in the environment and their cumulative risks must be quantified when assessing the implementation of EU policies in the field.
Assessments of pesticide risk at European scale have been performed in the past several years based on a variety of approaches (e.g., by Schriever et al. (2007), using an empirical indicator of runoff potential; by Tiktak et al. (2004), using a physical modeling approach; by Delbaere and Nieto Serradilla (2004), using a pesticide fate indicator, among others). Risk assessment usually rests on exposure/toxicity ratios, i.e., environmental concentrations divided by threshold values indicating toxic risks with reference to specified receptors (ecosystems, non-target species, humans) (e.g., Gutsche and Rossberg, 1997; Reus and Leendertse, 2000; FOCUS, 2001; Chen et al., 2002; Reus et al., 2002; Padovani et al., 2004; de Zwart, 2005; HAIR project, undated). Concentrations may derive from direct measurements, but these are affected by limitations (e.g., Wolfram et al., 2021). Therefore estimates based on models, ideally using monitored concentration for comparison and validation, in practice are often the only possibility of quantification, especially when addressing a large area.
When concentrations represent the actual conditions in the environment, we can consider the indicators to represent a “true” risk. Conversely, if they reflect a conventional “reasonable worst case” scenario assuming a given pesticide use, they represent a conditional risk. This is typically the subject of assessments for the authorization of pesticide active substances on the market (FOCUS, 2001).
Currently ca. 300 chemical substances are reported in use in the EU as agricultural pesticides (Galimberti et al., 2020). However, little is known about their actual use patterns and emission rates, hence their expected concentrations in the environment.
These knowledge limitations have so far undermined any attempt at assessing the cumulative environmental risk of pesticides at EU level, although there is expanding evidence that the latter may represent an important pressure on aquatic ecosystems (Oliver et al., 2022). In this contribution, we draw a first EU scale cumulative environmental risk assessment of 148 pesticide active substances (AS) in soil and water across Europe, based on recent estimates of pesticide use derived from available data (Udias et al., 2022). In the following sections, we clarify the method used to compute environmental concentrations of pesticide AS, compare our calculations with available monitoring data, present and discuss the cumulative toxicity resulting from computed concentrations. In the final section, we draw conclusions for pesticide assessment and management in the EU including a set of policy recommendations focusing on identified agricultural regions with high cumulative water toxicity, in support of the implementation of EU Strategies and Targets.
Throughout this paper, we refer to the amounts of pesticides released in the environment as “emissions”. We make use of the estimates of emissions by Udias et al. (2022) for 148 pesticide active substances (AS) in Europe, listed in the Supplementary Material S1, Annex 1, together with their physicochemical properties used for modelling. These represent total amounts of each AS applied in agriculture around the reference year 2015, within EU regions (in kg per year). The regional total application was apportioned to land surfaces within each region on the basis of land cover information, as explained in details in the Supplementary Material S1, Annex 2. This resulted in 148 maps of pesticide AS emission, expressed in kg per hectare and year. Consistent with the resolution of environmental data used for subsequent model calculations, we produced these emission maps with a resolution of 1 km2 (see Supplementary Material S1, Annex 2).
The mass of pesticides in soil and the loads to the stream network were predicted using a simple steady state box model (Pistocchi, 2010; Pistocchi, 2013). The model describes the soil as a linear continuous stirred tank reactor; we assume an emission of pesticides that is constant in time, although it is well known that pesticides are applied intermittently and often only during a few days in a year. The implications of this assumption will be discussed later. The model accounts for pesticide removal from the soil due to degradation, runoff and leaching, erosion, and volatilization. From steady state mass balance in soils, we compute the loads of pesticide to the stream network through runoff and leaching as well as erosion. Moreover, we consider that a fixed proportion of emissions reaches the stream network after bypassing the soil, to account for direct losses of pesticides (e.g., through wind drift, dripping from distribution equipment and rinsing of chemical tanks). Direct losses of pesticides are intrinsically difficult to model due to their dependence on local management variables. Here we tentatively set direct losses to 1% of emissions. The implications of this assumption are further discussed below.
The loads of pesticide AS coming from agricultural soils through runoff, leaching and erosion, and the assumed fixed proportion of emissions that bypasses the soil ending up directly in water, are then considered as an input to the stream network. For the stream network, we use a steady state plug-flow model accounting for first-order dissipation. In this way it is possible to estimate the concentration of each pesticide AS at each section of the stream network, taking into account all loads coming from its contributing area subject to dissipation along the respective trajectories. Supplementary Material S1, Annex 2 provides a more detailed description of the calculations used for the mass balance in soils and the stream network. The soil model equations are solved in spatially distributed form using map algebra within a geographic information system (GIS) (Pistocchi, 2014). The stream network model equations are solved in a vector format on a network of sub-basins with a spatial resolution varying from a few to a few tens of squared km (Vogt, 2007), similar to the modelling exercise shown in (Pistocchi et al., 2019). Soil properties and water flow in the stream network are described using European-scale datasets further described in the Supplementary Material S1, Annex 2.
The model is deliberately kept very simple. An alternative could have been to use a complex model incorporating an accurate description of chemical fate and transport processes. When applied to predict environmental concentrations from detailed input data including on pesticide use and observations for calibration and verification, complex models promise to yield the most accurate assessment. Application of these models at European scale has been limited so far to assessing conditional risks (e.g., Tiktak et al., 2002; Holman et al., 2004; Centofanti et al., 2008; Hendley et al., 2009; Urionabarrenetxea et al., 2022) capitalizing on the increasing availability of datasets supporting the definition of model scenarios (e.g. Schneider et al., 2007; Blenkinsop et al., 2008; FOOTPRINT, 2008). Assessing “true” risk at EU scale using complex models, though, is not proportionate to the knowledge available in practice. In the absence of detailed data, models entail assumptions (hence uncertainties) that may jeopardize the advantages of an accurate description of processes. Moreover, when model parameters cannot be calibrated on the basis of observations, models of very different structure and complexity are expected to give results of comparable prediction quality, and use of complex models is only advisable after testing simpler screening-level models (Pistocchi, 2013).
The estimates of emissions by Udias et al. (2022), used as input for our calculation, are an extrapolation of reported emissions in selected countries. For a comparison of model results with monitoring data, observed concentrations of pesticides in water were extracted from the IPCHEM platform (see Galimberti et al., 2020 for details). No suitable data could be found on pesticide concentrations in soils to compare with model results.
Once concentrations are estimated for all 148 individual AS, we can refer to two fundamental models to predict the toxicity of chemical mixtures: the model of concentration addition (CA) for chemicals with a similar Mode of Action (MoA) (Loewe and Muischnek, 1926) and the model of independent action (IA) (Bliss, 1939), also called effect addition or response addition, for chemicals with a dissimilar MoA. The CA model posits that the concentrations of the chemicals in a mixture are exchangeable if scaled by an appropriate effect concentration (Belden and Brain, 2018). On the contrary, IA accounts for the probability that multiple chemicals contribute to an effect. Several studies have analysed the performance of CA and IA when used to predict the joint toxicity of pesticides, indicating overall similar performances, although in different cases one approach has shown a better match with observations compared to the other (Backhaus et al., 2004a; Backhaus et al., 2004b; Belden et al., 2007; Cedergreen et al., 2008; Norgaard and Cedergreen, 2010; Schäfer et al., 2013; Cedergreen, 2014). In the light of this evidence, the literature tends to suggest CA as the first step in ecological risk assessment irrespective of the MoA, as it provides a precautionary but not overprotective estimation for pesticide mixtures (Junghans et al., 2006; Backhaus and Faust, 2012; Schell et al., 2018) while more complex approaches may not be applicable widely due to data limitations (e.g. Kim et al., 2018). Another recent review confirmed that synergisms with high deviations from CA based predictions are rare and the use of CA as default approach is recommended, still keeping in mind some exceptions for specific classes of chemicals (Martin et al., 2021). Therefore, CA has become in practice the standard tool for a first tier pesticide risk assessment in China (Chen et al., 2020), the European Union (Frische et al., 2014), and the USA (Belden and Brain, 2018). In this work, we refer only to the CA model and compute a toxicity indicator as the sum of individual AS concentrations divided by their respective effect concentration. For the latter, we use the median of chronic no observed effect concentration (NOEC) species sensitivity distributions (SSD) provided by Posthuma et al., 2019. For chemicals not covered by these SSD, we refer to the 21-days NOEC for aquatic invertebrates reported in the Pesticide Properties Database (PPDB) developed by the University of Hertfordshire (http://sitem.herts.ac.uk/aeru/ppdb/en/index.htm). The assumed effect concentrations are provided in the Supplementary Material S1, Annex 1, for the 148 AS considered here.
Figure 1 shows the ranges of concentrations of all active substances predicted in the stream network (rivers water), together with the assumed effect concentration. All substances appear to be below the effect concentration. Concentrations in soils show a similar pattern, as shown in the Supplementary Material S1, Annex 2. Liquid phase concentrations in soil tend to be lower than in rivers water because river concentrations reflect also the direct loss of 1% of emissions that we assumed to fall directly on water due to spray drift, dripping and other causes, hence not contributing to soil concentrations. Direct losses may be an important, and in some cases a dominant contribution.
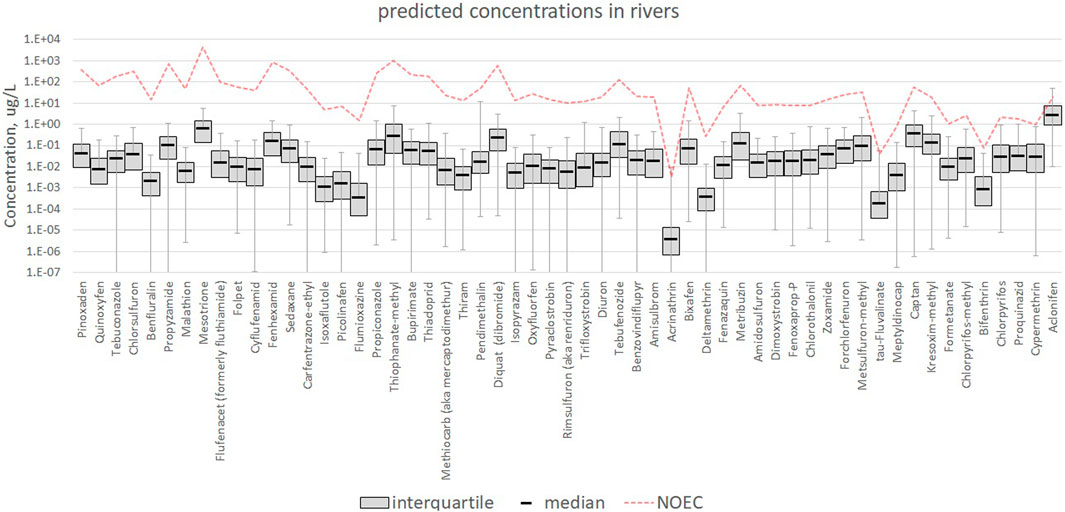
FIGURE 1. Concentrations in freshwater. The whiskers represent the 1st and 99th percentiles of computed concentrations. For the sake of readability, we show only the individual AS for which the NOEC is 4 orders of magnitude larger or less with respect to the median concentration. For all other AS, the computed concentrations are much smaller than the NOEC. A more detailed picture is provided in the Supplementary Material S1, annex 2.
To underline the potential importance of direct losses compared to losses through leaching and soil erosion, we also compute the ratio of combined losses through runoff and leaching to emissions, and the one of losses through erosion to emissions, for all 148 AS (Supplementary Material S1, Annex 2), indicating runoff and leaching losses are mostly below 10%, and rather often below 1% of emissions, while losses with erosion rarely exceed 0.1%.
Figure 2 shows the frequency of occurrence of discrepancies (computed as the ratios between observed and computed concentrations) if within a factor 10, between a factor 10 and a factor 100, or above a factor 100, for each of the AS for which monitoring data were available, across all monitoring sites. We can observe that, using estimated emissions, for a majority of substances (53 out of 86) observed and computed concentrations are within a factor 10 at least in 50% of the cases, while 63 out of 86 AS exceed a factor 100 discrepancy in 20% of the cases or less. However, for 10 substances discrepancies are above a factor 100 in more than 50% of the cases. The scatter plot of the central value of the observed and computed concentration ranges (Figure 3) indicates a tendency of the model to underestimate observations, and generally mirrors the pattern of Figure 2.

FIGURE 2. Fraction of observation sites with a discrepancy between observed and computed values with estimated emissions. Green, orange and red represent observations and calculated concentrations within a factor 10, a factor 100 or beyond a factor 100, respectively. The horizontal blue line marks 50% of the available observations. Numbers (n = ) by the AS name on the x-axis indicate the number of observations available in IPCHEM for each substance. Codes following the AS name are those in the EU pesticide database.
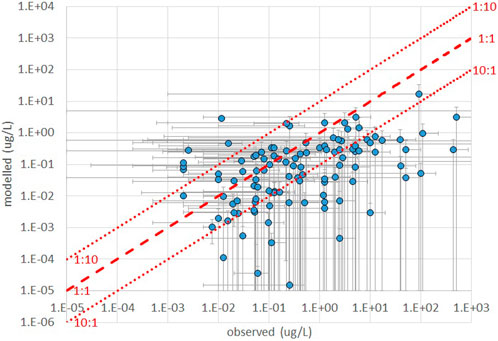
FIGURE 3. comparison of ranges of concentrations from observations and model calculations based on estimated emissions.
Many of the cases where discrepancies are larger can be explained with the quantification limits of the observations. For a large proportion of the monitoring data for some AS, true concentrations are likely lower than reported, since measurements below the limit of quantification (LOQ) have been substituted by the value of the LOQ or LOQ/2 in the underlying datasets. For example, the chemical with the worst performance (Benalaxyl-M) has more than 5,000 observations, but all except 4 in the database indicate a constant value of 0.035 ug/L, whereas the calculated values span a range of much lower values. Ametoctradin, a chemical showing mostly discrepancies beyond a factor 100, has 780 observations, all but one at the value of 0.1 ug/L vis-à-vis calculated values ranging over several orders of magnitude, but well below 0.1 ug/L. Observations for all AS suffer from similar limitations, but when concentrations are higher above or around quantification limits the match with calculated values tends to improve. Scatter plots of observations and modelled concentrations for individual substances across measurement sites are provided in the Supplementary Material S1, Annex 3, for the worst-matching AS.
As a benchmark for the model’s skill at matching observed concentrations, we repeated the model calculations with original reported emissions, in the reference countries (Germany, France, Spain, Italy, Ireland, Denmark, Belgium and the Netherlands) for which these were available. A comparison of the calculation results with observations (Supplementary Material S1, Annex 3) does not show clear improvements over the model based on estimated emissions: than the model with reported emissions: for the latter, 46 out of 82 substances are within a factor 10 in 50% of the cases or more, and 53 out of 82 beyond a factor 100 in 20% of the cases or more, while the scatter plot of central values is slightly worse than with estimated emissions.
Figure 4 shows a map of cumulative toxicity in the stream network, computed under a CA model assumption as the sum of concentrations divided by the respective NOEC for all 148 pesticide AS, with estimated emissions as input. The sum of concentrations divided by NOEC represents the amount of “toxic units” (TU) of the mixture. The Supplementary Material S1, Annex 2 also shows a map of the sum of the corresponding losses from soils due to erosion, leaching and runoff and direct losses (1% of emissions) for all 148 pesticide AS, also in this case divided by the respective NOEC. The sum of NOEC-normalized losses can be read as the losses in mass equivalents of a hypothetical substance with unit toxicity. The two maps, shown in Figure 4; Supplementary Material S1 Annex 2 respectively, visualize the estimated distribution of toxicity in rivers and “toxic load” coming from the catchment, hence the parts of the stream network at highest risk and the parts of the catchments contributing the most to pollution. The two maps are rather consistent with each other and highlight a pattern of higher risk in Southern and eastern countries, but with presence of hot spots in various countries. Figure 5 summarizes the distribution of toxicity in the stream network by country, indicating that a cumulative toxicity between 0.1 TU and 1 TU is widespread across the EU, and a cumulative toxicity of 1 TU is also relatively often exceeded. In aggregated terms, 27.4% of the length of the EU’s stream network is above 0.1 TU and 4.3% above 1 TU due to the 148 pesticide AS considered in the model.
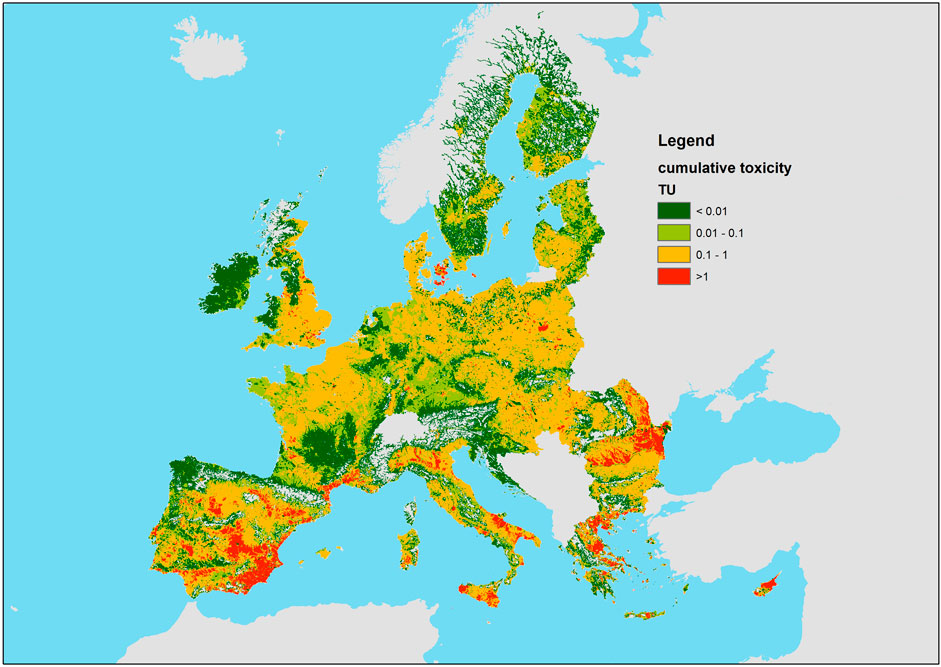
FIGURE 4. Map of the cumulative water toxicity due to the pesticides considered in this study.
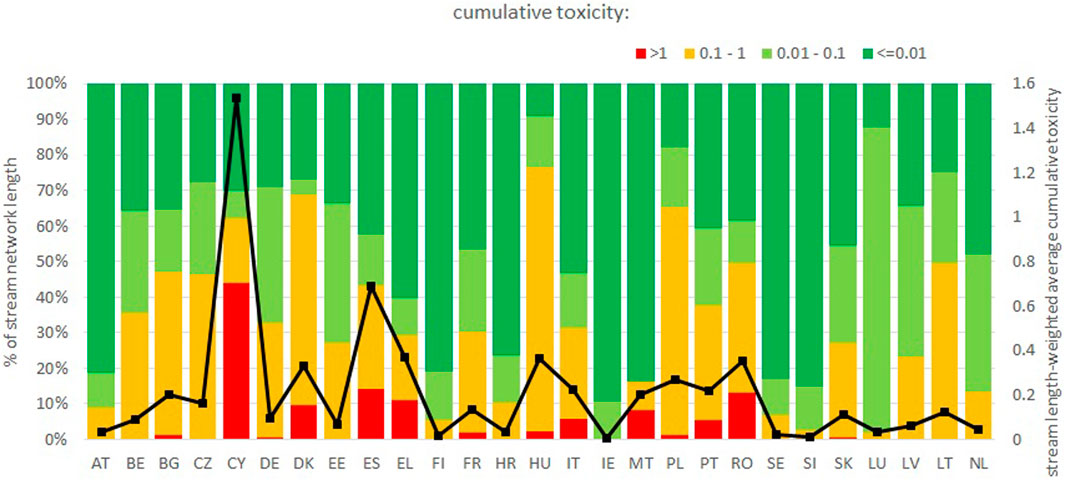
FIGURE 5. summary of the cumulative toxicity in the stream network due to the 148 pesticide AS considered here, by country in the EU. The black line represents the stream length-weighted average cumulative toxicity for each country. Labels of the category axis are EUROSTAT country codes (https://ec.europa.eu/eurostat/statistics-explained/index.php?title=Glossary:Country_codes).
The individual maps of concentration normalized by NOEC for the 148 pesticide AS enable also an analysis of which substances contribute the most to overall toxicity. In Figure 6 we plot the frequency of appearance, across the stream network, of each AS among the top 10 contributors to cumulative toxicity. For instance, a frequency of 0.1 would indicate that an AS is among the top 10 contributors in 10% of the stream network. If we consider the whole EU stream network, including also stretches where the cumulative toxicity is low, we tend to identify the most widespread AS. Conversely, if we focus on those parts of the stream network with toxicity above 0.1 TU or 1 TU, we can identify the substances contributing the most to toxicity. For instance, herbicide Glyphosate appears as the 5th most frequent top contributor with reference to the whole stream network, but only as the 37th when looking at the network with toxicity >10 (and similarly above 0.1 and above 1). However, some substances consistently appear among the top contributors irrespective of the toxicity threshold considered. These include deltamethrin, acrinathrin, cypermethrin, chlorpyrifos, tau-fluvalinate, chlorotalonil, which are mostly insecticides.
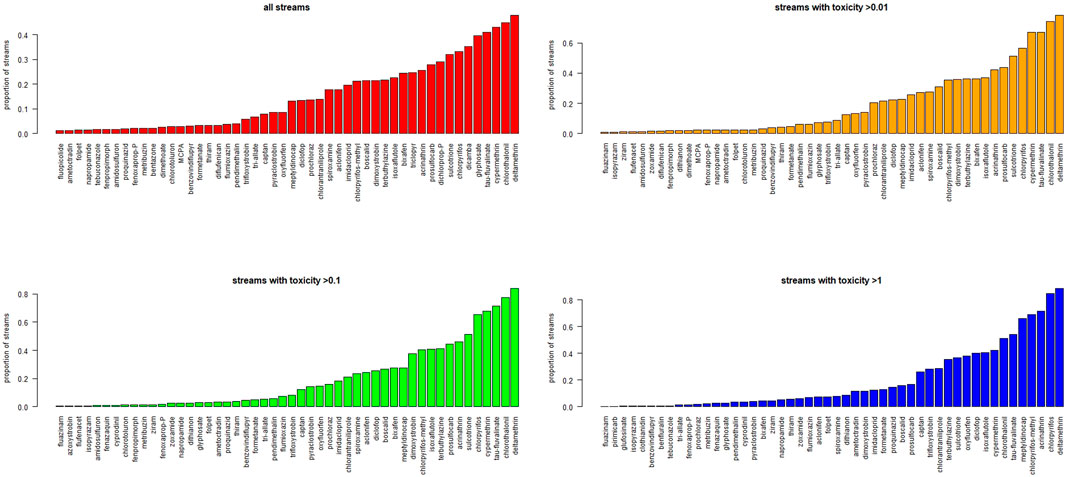
FIGURE 6. Main pesticides contributing to toxicity: frequency of occurrence of each AS among the top 10 contributors to toxicity in the EU streams, or in streams where toxicity exceeds 0.01, 0.1, and 1 TU respectively. Streams correspond to the segments of the stream network described in (Vogt, 2007). All streams have comparable length and are weighted equally.
Using a simple model, we have presented an analysis of the cumulative risk of toxicity for aquatic organisms due to 148 pesticide AS in the EU. We have shown how more than 27% of the EU’s stream network is affected by a pesticide mixture with concentrations resulting in a cumulative toxicity of 0.1 TU or more, and more than 4% above 1 TU. This indicates that pesticide pollution is widespread, and could be a relevant pressure on aquatic ecosystems in Europe. As a first extensive model-based assessment of pesticides at the EU scale, our quantification is laden with uncertainties further addressed below. The uncertainty affecting model estimates of concentrations of each pesticide active substance is at least one order of magnitude, as shown by the comparison with observations presented above. The uncertainty owes to all parameters used in the calculation. Pesticide properties (degradation half-life, soil-water partition coefficient) are usually characterized in controlled experiments, not necessarily accounting for the variability of environmental conditions. However, in many cases concentrations depend critically on the assumed direct losses of pesticides. An additional uncertainty in the assessment of risks is related to the assumed NOEC, which may also be regarded as uncertain within at least one order of magnitude. The two aspects together cause a potentially very large uncertainty on each of the 148 AS considered in this work. The sum of toxicities could suffer from lower uncertainty, if errors were completely random, as underestimations of toxicity for some AS would be canceled out by overestimations for others. A formal uncertainty analysis of the model, anyway beyond the scope of this work, would add limited benefit for the following overarching reasons.
First of all, we focus on 148 pesticide AS out of a total of about 300 chemical AS in current use. Under a concentration addition model, neglecting substances implies underestimating cumulative toxicity.
Furthermore, our assessment of toxicity is based on concentrations in water calculated by the model. These are quite consistent with reported observations in terms of orders of magnitude and ranges, in the majority of the cases. The model tends to underestimate concentrations in comparison with observations (see Figure 2; Figure 3). The correlation between observed and calculated concentrations, though, is rather weak (Figure 3 and Annex 3). This can be explained by uncertainties and bias related to both observed and calculated concentrations. Pesticide concentrations vary significantly in space and time, and the current sampling schemes with regular grab sampling tend to underestimate true concentrations as relevant exposure periods can be missed (Stehle et al., 2013; Oliver et al., 2022). Indeed, the monitoring data used in this exercise contained frequent records below levels of quantification while calculated concentrations were still significant for cumulative toxicity.
Discrepancies between observations and calculations may owe in part to the simplicity of the model: our steady-state calculation apparently does not account for the highly dynamical nature of certain pesticide applications. A systematic bias of our steady state calculation, in particular, is the approximation of emissions as stationary, while a more realistic model should take into account at least the fact that pesticides are released impulsively, once or a few times in a year. In the Supplementary Material S1, Annex 4, we present and discuss a correction factor to account for the effect of an impulsive release of pesticides when using steady state models initially proposed in (Pistocchi, 2010; Pistocchi, 2013; Pistocchi, 2014). In general, however, the simulation of an impulsive release yields lower annual average concentrations than a steady state calculation, which would further exacerbate our underestimation of observations. Therefore, we should assume higher emissions in order to match the available observations. More complex models, describing processes at a finer spatial and temporal resolution, are not expected to show better predictive capacity, because the key fate and transport parameters (degradation rates and, to some extent, partitioning properties) cannot be calibrated under field conditions (see, e.g., Knäbel et al., 2012). Based on the above considerations, we regard our modelled concentrations as a provisionally acceptable generalization of observed concentrations.
Another aspect to consider is the effect concentration used to compute the TU of the mixture. We rest on existing estimates of the NOEC affecting 50% of the species in aquatic ecosystems, according to the species sensitivity distributions (SSD) modelled by Posthuma et al. (Posthuma et al., 2019), and our assessment is therefore conditional to the validity of this threshold. For example, (EFSA, 2013), recommends applying an assessment factor of 3 for toxicity data based on chronic NOEC based SSDs considering the 5th percentile of the distribution, while here the 50th percentile of the distribution was used and no assessment factor was applied, likely leading to an underestimation of risks. Moreover, for substances with missing SSD-based values (Posthuma et al., 2019), we used the 21-day NOEC for aquatic invertebrates. These NOEC values may not be consistent with the other SSD-based values for those AS which are most toxic towards organisms other than invertebrates.
We flag a relatively high risk from chronic exposure when the mixture toxicity calculated from the NOEC exceeds 1 TU, and a lower but somehow significant risk when it is between 0.1 and 1 TU. However, we could not verify any relationship between our calculated mixture toxicity, hence risk, and impacts on aquatic ecosystems. The NOEC may be about one order of magnitude lower than concentrations at which an acute exposure has observable effects on aquatic organisms [e.g., 67], but the relationship between exceedance of NOEC and the risk of ecological effects is still problematic (Smetanová et al., 2014).
Nutrients and hydromorphological degradation often co-occur with toxicants above ecological risk levels in freshwater ecosystems (Schäfer and Piggott, 2018). Although our knowledge of the combined impacts is limited, stressors can interact in different ways (Schäfer and Piggott, 2018): by exerting a combined pressure on ecosystems (Holmstrup et al., 2010; Stampfli et al., 2013; Link et al., 2017), by influencing the sensitivity of organisms towards other stressors (Holmstrup et al., 2010), and by differentially affecting age stages, populations or species within an ecosystem, triggering disruptions in the population dynamics (Bracewell et al., 2019; Van den Brink et al., 2019). Pesticides frequently co-occur (Matthaei et al., 2010; Moschet et al., 2014; Lemm and Feld, 2017; Szöcs et al., 2017) and interact with other stressors (Holmstrup et al., 2010), (Lange et al., 2011; Magbanua et al., 2013; Piggott et al., 2015; Elbrecht et al., 2016; Jackson et al., 2016; Liess et al., 2016; Magbanua et al., 2016; Chará-Serna and Richardson, 2018; Davis et al., 2018; European Environment Agency, 2018; Bray et al., 2019; Chará-Serna et al., 2019; Juvigny-Khenafou et al., 2020), often in a synergistic way (Holmstrup et al., 2010; Jackson et al., 2016; Liess et al., 2016). Maps of pesticide concentrations as discussed here may support the assessment of combinations of stressors on aquatic ecosystems, which so far have struggled to disentangle the effect of chemical pollutants (Vigiak et al., 2021).
This paper presents what, to our knowledge, is the first EU-scale model-based assessment of the cumulative toxicity of pesticide active substances presently authorized on the market, based on a spatially explicit estimation of pesticide use. We have used a simple, spatially explicit model to quantify the cumulative toxicity of 148 pesticide AS in the stream network of the EU. We find a relatively high frequency of exceedance of safe chronic exposure to pesticides, mainly driven by less than 20 of those substances. While our model is theoretically prone to overestimation, available measurements rather suggest an underestimation of concentrations, hence we do not expect to exaggerate the extent and severity of pesticide environmental contamination. Reference to NOEC and the CA model make the assessment precautionary for the goals we have pursued. In this modelling exercise, we have used an improved estimation of emissions compared to a previous exercise that we regard as an “ancestor” (provided for reference in the Supplementary Material S1, Annex 5). However, this has led only to limited improvements in the overall prediction, consistent with the persisting knowledge gaps on actual pesticide use in Europe. In particular, the data currently available at the EU scale do not allow predicting pesticide AS concentrations more accurately than within one order of magnitude. In the future, an accurate characterization of spatial patterns of pesticide emissions remains key to improve model predictions and the overall assessment of pesticides in the framework of current European pesticide legislation. A recently proposed regulation of statistics on agricultural input and output (European Commission, 2021) requires better harmonization and quality of data from 2025 on, possibly enabling more sophisticated modelling in the future. However, pending an improved representation of emissions, the simple approach presented here may still prove sufficient for a first assessment. For the time being, what we present here is a proof of concept for spatially explicit pesticide risk indicators, which could also be presented in aggregated form (see Supplementary Material S1, Annex 6), in support to the monitoring of policy implementation and EU scale pesticide management, compatible with the available knowledge.
The raw data supporting the conclusion of this article will be made available by the authors, without undue reservation.
AP conceived, led and executed the research, wrote the manuscript and managed resources and funding. CD curated the data and executed processing and calculations under the supervision of AP. RS, AU, and FG provided data, advice, scientific discussion, and contributed to writing and reviewed the manuscript. SB, RC, and RD reviewed the manuscript and contributed to clarification and improvement of the presentation and discussion.
This work was partly developed in the context of the project “Nature-based solutions for climate and water pollution mitigation in agricultural regions” under an administrative arrangement between the JRC and the Directorate General for Environment of the European Commission.
The authors declare that the research was conducted in the absence of any commercial or financial relationships that could be construed as a potential conflict of interest.
All claims expressed in this article are solely those of the authors and do not necessarily represent those of their affiliated organizations, or those of the publisher, the editors and the reviewers. Any product that may be evaluated in this article, or claim that may be made by its manufacturer, is not guaranteed or endorsed by the publisher.
The Supplementary Material for this article can be found online at: https://www.frontiersin.org/articles/10.3389/fenvs.2023.1101316/full#supplementary-material
AS, (pesticide) active substance; CA, concentration addition; EU, European Union; GIS, geographic information system; MoA, mode of action; NOEC, no observed effect concentration; PPDP, Pesticide Properties Database; SI, supporting information; SSD, species sensitivity distribution; TU, toxic unit(s); LOQ, limit of quantification.
Auber, A., Roucaute, M., Togola, A., and Caquet, T. (2011). Structural and functional effects of conventional and low pesticide input crop-protection programs on benthic macroinvertebrate communities in outdoor pond mesocosms. Ecotoxicology 20, 2042–2055. doi:10.1007/s10646-011-0747-5
Backhaus, T., Arrhenius, A., and Blanck, H. (2004a). Toxicity of a mixture of dissimilarly acting substances to natural algal communities: Predictive power and limitations of independent action and concentration addition. Environ. Sci. Technol. 38, 6363–6370. doi:10.1021/es0497678
Backhaus, T., and Faust, M. (2012). Predictive environmental risk assessment of chemical mixtures: A conceptual framework. Environ. Sci. Technol. 46, 2564–2573. doi:10.1021/es2034125
Backhaus, T., Faust, M., Scholze, M., Gramatica, P., Vighi, M., and Grimme, L. H. (2004b). Joint algal toxicity of phenylurea herbicides is equally predictable by concentration addition and independent action. Environ. Toxicol. Chem. 23, 258–264. doi:10.1897/02-497
Belden, J. B., and Brain, R. A. (2018). Incorporating the joint toxicity of co-applied pesticides into the ecological risk assessment process. Integr. Environ. Assess. Manag. 14, 79–91. doi:10.1002/ieam.1957
Belden, J. B., Gilliom, R. J., and Lydy, M. J. (2007). How well can we predict the toxicity of pesticide mixtures to aquatic life? Integr. Environ. Assess. Manag. 3, e1–e5. doi:10.1002/ieam.5630030326
Blenkinsop, S., Fowler, H. J., Dubus, I. G., Nolan, B. T., and Hollis, J. M. (2008). Developing climatic scenarios for pesticide fate modelling in Europe. Environ. Pollut. 154, 219–231. doi:10.1016/j.envpol.2007.10.021
Bliss, C. I. (1939). The toxicity of poisons applied jointly. Ann. Appl. Biol. 26, 585–615. doi:10.1111/j.1744-7348.1939.tb06990.x
Bracewell, S., Verdonschot, R. C. M., Schäfer, R. B., Bush, A., Lapen, D. R., and Van den Brink, P. J. (2019). Qualifying the effects of single and multiple stressors on the food web structure of Dutch drainage ditches using a literature review and conceptual models. Sci. Total Environ. 684, 727–740. doi:10.1016/j.scitotenv.2019.03.497
Bray, J. P., Nichols, S. J., Keely-Smith, A., Thompson, R., Bhattacharyya, S., Gupta, S., et al. (2019). Stressor dominance and sensitivity-dependent antagonism: Disentangling the freshwater effects of an insecticide among co-occurring agricultural stressors. J. Appl. Ecol. 56, 2020–2033. doi:10.1111/1365-2664.13430
Cedergreen, N., Christensen, A. M., Kamper, A., Kudsk, P., Mathiassen, S. K., Streibig, J. C., et al. (2008). A review of independent action compared to concentration addition as reference models for mixtures of compounds with different molecular target sites. Environ. Toxicol. Chem. 27, 1621–1632. doi:10.1897/07-474.1
Cedergreen, N. (2014). Quantifying synergy: A systematic review of mixture toxicity studies within environmental Toxicology. PLoS ONE 9, 965800–e96612. doi:10.1371/journal.pone.0096580
Centofanti, T., Hollis, J. M., Blenkinsop, S., Fowler, H. J., Truckell, I., Dubus, I. G., et al. (2008). Development of agro-environmental scenarios to support pesticide risk assessment in Europe. Sci. Total Environ. 407, 574–588. doi:10.1016/j.scitotenv.2008.08.017
Chará-Serna, A. M., Epele, L. B., Morrissey, C. A., and Richardson, J. S. (2019). Nutrients and sediment modify the impacts of a neonicotinoid insecticide on freshwater community structure and ecosystem functioning. Sci. Total Environ. 692, 1291–1303. doi:10.1016/j.scitotenv.2019.06.301
Chará-Serna, A. M., and Richardson, J. S. (2018). Chlorpyrifos interacts with other agricultural stressors to alter stream communities in laboratory microcosms. Ecol. Appl. 28, 162–176. doi:10.1002/eap.1637
Chen, L., Li, S., Zhou, Y., Zhou, X., Jiang, H., Liu, X., et al. (2020). Risk assessment for pesticide mixtures on aquatic ecosystems in China: A proposed framework. Pest Manag. Sci. 76, 444–453. doi:10.1002/ps.5529
Chen, P., Hertl, P., Chen, S., and Tierney, D. (2002). A pesticide surface water mobility index and its relationship with concentrations in agricultural drainage watersheds. Environ. Toxicol. Chem. 21 (2), 298–308. doi:10.1002/etc.5620210211
Chiaia-Hernandez, A. C., Keller, A., Wächter, D., Steinlin, C., Camenzuli, L., Hollender, J., et al. (2017). Long-term persistence of pesticides and TPs in archived agricultural soil samples and comparison with pesticide application. Environ. Sci. Technol. 51, 10642–10651. doi:10.1021/acs.est.7b02529
Davis, S. J., Ó hUallacháin, D., Mellander, P.-E., Kelly, A.-M., Matthaei, C. D., Piggott, J. J., et al. (2018). Multiple-stressor effects of sediment, phosphorus and nitrogen on stream macroinvertebrate communities. Sci. Total Environ. 637–638, 577–587. doi:10.1016/j.scitotenv.2018.05.052
de Zwart, D. (2005). Ecological effects of pesticide use in The Netherlands: Modeled and observed effects in the field ditch. Integr. Environ. Assess. Manag. 1 (2), 123–134. doi:10.1897/ieam_2004-015.1
EU (2000). Directive 2000/60/EC of the European Parliament and of the Council of 23 October 2000 establishing a framework for Community action in the field of water policy. Off. J. Eur. Commun. L 327, 22.
EU (2005). No 396/2005 of the European Parliament and of the Council of 23 February 2005 on maximum residue levels of pesticides in or on food and feed of plant and animal origin and amending Council Directive 91/414/EECText with EEA relevance. OJ L 70, 16–23.
EU (2006). Directive 2006/118/EC of the European parliament and of the council of 12 december 2006 on the protection of groundwater against pollution and deterioration. Off. J. Eur. Commun. L 327, 27.
EU (2009a). Directive 2009/128/EC of the European Parliament and of the council of 21 October 2009 establishing a framework for Community action to achieve the sustainable use of pesticides.
EU (2009b). No 1107/2009 of the European Parliament and of the Council of 21 October 2009 concerning the placing of plant protection products on the market and repealing Council Directives 79/117/EEC and 91/414/EEC. Available at: https://eur-lex.europa.eu/legal-content/EN/TXT/HTML/?uri=CELEX:32009R1107&from=EN.
EFSA (2013). EFSA Panel on Plant Protection Products and their Residues, Guidance on tiered risk assessment for plant protection products for aquatic organisms in edge-of-field surface waters. EFSA J. 11( 7, 3290, doi:10.2903/j.efsa.2013.3290
Elbrecht, V., Beermann, A. J., Goessler, G., Neumann, J., Tollrian, R., Wagner, R., et al. (2016). Multiple-stressor effects on stream invertebrates: A mesocosm experiment manipulating nutrients, fine sediment and flow velocity. Freshw. Biol. 61, 362–375. doi:10.1111/fwb.12713
European Commission (2020a). Communication From The Commission To The European Parliament, The Council, The European Economic And Social Committee And The Committee Of The Regions. EU Biodiversity Strategy for 2030 Bringing nature back into our lives. Available at: https://eur-lex.europa.eu/resource.html?uri=cellar:a3c806a6-9ab3-11ea-9d2d-01aa75ed71a1.0001.02/DOC_1&format=PDF.
European Commission (2020b). Communication From The Commission To The European Parliament, The Council, The European Economic And Social Committee And The Committee Of The Regions. A Farm to Fork Strategy for a fair, healthy and environmentally-friendly food system. Available at: https://eur-lex.europa.eu/resource.html?uri=cellar:ea0f9f73-9ab2-11ea-9d2d-01aa75ed71a1.0001.02/DOC_1&format=PDF.
European Commission (2006a). A thematic strategy on the sustainable use of pesticides. Available at: http://ec.europa.eu/environment/ppps/home.htm.
European Commission (2006b). Communication from the Commission to the Council and the European Parliament. Development of Agri-environmental indicators for monitoring the integration of environmental concerns into the common agricultural policy/COM.
European Commission (2022). COM(2022) 305 final 2022/0196 (COD) proposal for a regulation of the European parliament and of the council on the sustainable use of plant protection products and amending regulation. Available at: https://ec.europa.eu/info/law/better-regulation/have-your-say/initiatives/12413-Pesticides-sustainable-use-updated-EU-rules-_en.
European Commission (2002). Communication from the commission to the council, the European parliament and the economic and social committee towards A thematic strategy on the sustainable use of pesticides/com.
European Commission (2021). Proposal for a Regulation of the European Parliament and of the Council on statistics on agricultural input and output and repealing Regulations (EC) No 1165/2008. Available at: https://eur-lex.europa.eu/legal-content/EN/TXT/?uri=CELEX:52021PC0037.
European Commission (2015). Report from the Commission to the European Parliament and the Council the mid-term review of the EU biodiversity strategy to 2020. Brussels, Belgium: European Commission.
European Environment Agency (2018). European waters Assessment of status and pressures 2018. Luxembourg: Publications Office of the European Union.
FOCUS (2001). FOCUS surface water scenarios in the EU evaluation process under 91/414/EEC”. Report of the FOCUS working group on surface water scenarios, EC document reference SANCO/4802/2001-rev.2. Available at: https://esdac.jrc.ec.europa.eu/projects/focus-dg-sante.
Footprint (2008). FOOTPRINT SUGAR, the SUrface water/GroundwAter contribution index. Prod. as part EU-funded Footpr. Proj. SSPI-CT-2005-022704. Available at: http://www.herts.ac.uk/aeru/footprint/tools/sugar.htm.
Frische, T., Matezki, S., and Wogram, J. (2014). Environmental risk assessment of pesticide mixtures under regulation 1107/2009/EC: A regulatory review by the German federal environment agency (UBA). J. für Verbraucherschutz und Lebensmittelsicherheit 9, 377–389. doi:10.1007/s00003-014-0916-6
Galimberti, F., Dorati, C., Udias Moinelo, A., and Pistocchi, A. (2020). Estimating pesticide use across the EU. Luxembourg: Publications Office of the European Union.
Gilliom, R. J. (2007). Pesticides in U.S. Streams and groundwater. Environ. Sci. Technol. 41, 3408–3414. doi:10.1021/es072531u
Gutsche, , and Rossberg, D. (1997). SYNOPS 1.1 — A model to assess and to compare the environmental risk potential of active ingredients in plant protection products. Agric. Ecosyst. Environ. 64, 181–188. doi:10.1016/s0167-8809(97)00037-6
HAIR project HAIR project reports on Terrestrial, Aquatic, Consumer indicators. Available at: http://www.rivm.nl/rvs/risbeoor/Modellen/Results_of_HAIR_project.jsp.
Hendley, P., Harbourt, C., Prenger, J., and Milller, P. (2009). Use of SSURGO, NHDPlus and other spatial data to assess potential watershed vulnerability to herbicide runoff and to extend monitoring study findings. Poster Present. UP119, 30th SETAC N. Am. Annu. Meet.
Holman, I. P., Dubus, I., Hollis, J. M., and Brown, C. D. (2004). Using a linked soil model emulator and unsaturated zone leaching model to account for preferential flow when assessing the spatially distributed risk of pesticide leaching to groundwater in England and Wales. Sci. total Environ. 318, 73–88. doi:10.1016/S0048-9697(03)00375-9
Holmstrup, M., Bindesbol, A. M., Oostingh, G. J., Duschl, A., Scheil, V., Köhler, H. R., et al. (2010). Interactions between effects of environmental chemicals and natural stressors: A review. Sci. Total Environ. 408, 3746–3762. doi:10.1016/j.scitotenv.2009.10.067
Jackson, M. C., Loewen, C. J. G., Vinebrooke, R. D., and Chimimba, C. T. (2016). Net effects of multiple stressors in freshwater ecosystems: A meta-analysis. Glob. Change Biol. 22, 180–189. doi:10.1111/gcb.13028
Junghans, M., Backhaus, T., Faust, M., Scholze, M., and Grimme, L. H. (2006). Application and validation of approaches for the predictive hazard assessment of realistic pesticide mixtures. Aquat. Toxicol. 76, 93–110. doi:10.1016/j.aquatox.2005.10.001
Juvigny-Khenafou, N. P. D., Zhang, Y., Piggott, J. J., Atkinson, D., Matthaei, C. D., Van Bael, S. A., et al. (2020). Anthropogenic stressors affect fungal more than bacterial communities in decaying leaf litter: A stream mesocosm experiment. Sci. Total Environ. 716, 135053. doi:10.1016/j.scitotenv.2019.135053
Kim, J., Fischer, M., and Helms, V. (2018). Prediction of synergistic toxicity of binary mixtures to Vibrio fischeri based on biomolecular interaction networks. Chem. Res. Toxicol. 31, 1138–1150. doi:10.1021/acs.chemrestox.8b00164
Knäbel, A., Stehle, S., Schäfer, R. B., and Schulz, R. (2012). Regulatory FOCUS surface water models fail to predict insecticide concentrations in the field. Environ. Sci. Technol. 46 (15), 8397–8404.
Lange, K., Liess, A., Piggott, J. J., Townsend, C. R., and Matthaei, C. D. (2011). Light, nutrients and grazing interact to determine stream diatom community composition and functional group structure. Freshw. Biol. 56, 264–278. doi:10.1111/j.1365-2427.2010.02492.x
Lemm, J. U., and Feld, C. K. (2017). Identification and interaction of multiple stressors in central European lowland rivers. Sci. Total Environ. 603–604, 148–154. doi:10.1016/j.scitotenv.2017.06.092
Liess, M., Foit, K., Knillmann, S., Schäfer, R. B., and Liess, H.-D. (2016). Predicting the synergy of multiple stress effects. Sci. Rep. 6, 32965. doi:10.1038/srep32965
Link, M., Ohevon der, P. C., Voß, K., and Schäfer, R. B. (2017). Comparison of dilution factors for German wastewater treatment plant effluents in receiving streams to the fixed dilution factor from chemical risk assessment. Sci. Total Environ. 598, 805–813. doi:10.1016/j.scitotenv.2017.04.180
Loewe, S., and Muischnek, H. (1926). Über kombinationswirkungen. Schmiedeb. Arch. für Exp. Pathol. Pharmakol. 114, 313–326. doi:10.1007/BF01952257
Magbanua, F. S., Townsend, C. R., Hageman, K. J., and Matthaei, C. D. (2013). Individual and combined effects of fine sediment and the herbicide glyphosate on benthic macroinvertebrates and stream ecosystem function. Freshw. Biol. 58, 1729–1744. doi:10.1111/fwb.12163
Magbanua, F. S., Townsend, C. R., Hageman, K. J., Piggott, J. J., and Matthaei, C. D. (2016). Individual and combined effects of fine sediment and glyphosate herbicide on invertebrate drift and insect emergence: A stream mesocosm experiment. Freshw. Sci. 35, 139–151. doi:10.1086/684363
Martin, O., Martin, S., Ermler, S., McPhie, J., Stephanie, K., Kienzler, A., et al. (2021). Ten years of research on synergisms and antagonisms in chemical mixtures: A systematic review and quantitative reappraisal of mixture studies. Environ. Int. 146, 106206. doi:10.1016/j.envint.2020.106206
Matthaei, C. D., Piggott, J. J., and Townsend, C. R. (2010). Multiple stressors in agricultural streams: Interactions among sediment addition, nutrient enrichment and water abstraction. J. Appl. Ecol. 47, 639–649. doi:10.1111/j.1365-2664.2010.01809.x
Moschet, C., Wittmer, I., Simovic, J., Junghans, M., Piazzoli, A., Singer, H., et al. (2014). How a complete pesticide screening changes the assessment of surface water quality. Environ. Sci. Technol. 48, 5423–5432. doi:10.1021/es500371t
Munira, S., Farenhorst, A., Sapkota, K., Nilsson, D., and Sheedy, C. (2018). Auxin herbicides and pesticide mixtures in groundwater of a canadian prairie province. J. Environ. Qual. 47, 1462–1467. doi:10.2134/jeq2018.05.0202
Delbaere, B., and Nieto Serradilla, A. (2004). Environmental risks from agriculture in Europe: Locating environmental risk zones in Europe using agri-environmental indicators – tilburg. (ECNC).
Norgaard, K. B., and Cedergreen, N. (2010). Pesticide cocktails can interact synergistically on aquatic crustaceans. Environ. Sci. Pollut. Res. 17, 957–967. doi:10.1007/s11356-009-0284-4
Oliver, W., Arle, J., Liebmann, L., Link, M., Schäfer, R. B., Anke Schneeweiss, , et al. (2022). Three reasons why the Water Framework Directive (WFD) fails to identify pesticide risks. Water Res. 208, 117848. doi:10.1016/j.watres.2021.117848
Padovani, L., Trevisan, M., and Capri, E. (2004). A calculation procedure to assess potential environmental risk of pesticides at the farm level, Ecol. Indic. 4, 111. doi:10.1016/j.ecolind.2004.01.002
Piggott, J. J., Salis, R. K., Lear, G., Townsend, C. R., and Matthaei, C. D. (2015). Climate warming and agricultural stressors interact to determine stream periphyton community composition. Glob. Change Biol. 21, 206–222. doi:10.1111/gcb.12661
Pistocchi, A. (2013). Some considerations on the use of simple box models of contaminant fate in soils. Environ. Monit. Assess. 185 (3), 2855–2867. doi:10.1007/s10661-012-2755-1
Pistocchi, A. (2014). GIS based chemical fate modeling: Principles and applications. Hoboken: Wiley, 520. 978-1-.
Pistocchi, A., Dorati, C., Alberto, A., Ginebreda, A.i, and Marcé, R. (2019). River pollution by priority chemical substances under the water framework directive: A provisional pan-European assessment. Sci. Total Environ. 662, 434–445. doi:10.1016/j.scitotenv.2018.12.354
Pistocchi, A. (2010). On the temporal resolution of mass balance models for soluble chemicals in soils. Hydrol. Process 24, 1172–1186. doi:10.1002/hyp.7581
Posthuma, L., van Gils, J., Zijp, M. C., van de Meent, D., and de Zwart, D. (2019). Species sensitivity distributions for use in environmental protection, assessment, and management of aquatic ecosystems for 12 386 chemicals. Environ. Toxicol. Chem. 38, 905–917. doi:10.1002/etc.4373
Reus, J., Lenndertse, C., Bockstaller, C., Fomsgaard, I., Gutsche, V., and Lewis, K. (2002). Comparison and evaluation of eight pesticide environmental risk indicators developed in Europe and recommendations for future use. Agri Ecosyst. Environ. 90, 177–187. doi:10.1016/s0167-8809(01)00197-9
Reus, J. A. W., and Leendertse, A. P. C. (2000). The environmental yardstick for pesticides: A practical indicator used in The Netherlands. Issues 19 (8-10), 637–641. doi:10.1016/s0261-2194(00)00084-3
Sala, O. E., Chapin, F. S., Armesto, J. J., Berlow, E., Bloomfield, J., Dirzo, R., et al. (2000). Global biodiversity scenarios for the year 2100. Science 287, 1770–1774. doi:10.1126/science.287.5459.1770
Schäfer, R. B., Gerner, N., Kefford, B. J., Rasmussen, J. J., Beketov, M. A., de Zwart, D., et al. (2013). How to characterize chemical exposure to predict ecologic effects on aquatic communities? Environ. Sci. Technol. 47, 7996–8004. doi:10.1021/es4014954
Schäfer, R. B., and Piggott, J. J. (2018). Advancing understanding and prediction in multiple stressor research through a mechanistic basis for null models. Glob. Change Biol. 24, 1817–1826. doi:10.1111/gcb.14073
Schell, T., Goedkoop, W., Zubrod, J. P., Feckler, A., Lüderwald, S., Schulz, R., et al. (2018). Assessing the effects of field-relevant pesticide mixtures for their compliance with the concentration addition model – an experimental approach with Daphnia magna. Sci. Total Environ. 644, 342–349. doi:10.1016/j.scitotenv.2018.06.334
Schneider, M. K., Brunner, F., Hollis, J. M., and Stamm, C. (2007). Towards a hydrological classification of European soils: Preliminary test of its predictive power for the base flow index using river discharge data. Hydrol. Earth Syst. Sci. 11, 1501–1513. doi:10.5194/hess-11-1501-2007
Schreiner, V. C., Szöcs, E., Bhowmik, A. K., Vijver, M. G., and Schäfer, R. B. (2016). Pesticide mixtures in streams of several European countries and the USA. Sci. Total Environ. 573, 680–689. doi:10.1016/j.scitotenv.2016.08.163
Schriever, C. A., and Liess, M. (2007). Mapping ecological risk of agricultural pesticide runoff. Sci. Total Environ. 384, 264–279. doi:10.1016/j.scitotenv.2007.06.019
Smetanová, S., Bláha, L., Liess, M., Schäfer, R. B., and Beketov, M. A. (2014). Do predictions from Species Sensitivity Distributions match with field data? Environ. Pollut. 189 (0), 126–133. doi:10.1016/j.envpol.2014.03.002
Stampfli, N. C., Knillmann, S., Liess, M., Noskov, Y. A., Schäfer, R. B., and Beketov, M. A. (2013). Two stressors and a community – effects of hydrological disturbance and a toxicant on freshwater zooplankton. Aquat. Toxicol. 127, 9–20. doi:10.1016/j.aquatox.2012.09.003
Stehle, S., Knabel, A., and Schulz, R. (2013). Probabilistic risk assessment of insecticide concentrations in agricultural surface waters: A critical appraisal. Environ. Monit. Assess. 185 (8), 6295–6310. doi:10.1007/s10661-012-3026-x
Szöcs, E., Brinke, M., Karaoglan, B., and Schäfer, R. B. (2017). Large scale risks from agricultural pesticides in small streams. Environ. Sci. Technol. 51, 7378–7385. doi:10.1021/acs.est.7b00933
Tiktak, A., de Nie, D. S., Pineros Garcet, J. D., Jones, A., and Vanclooster, M. (2004). Assessment of the pesticide leaching risk at the Pan-European level. The EuroPEARL approach. J. Hydrology 289, 222–238. doi:10.1016/j.jhydrol.2003.11.030
Tiktak, A., de Nie, D. S., van der Linden, A. M. A., and Kruijne, R. (2002). Modelling the leaching and drainage of pesticides in The Netherlands: The GeoPEARL model. Agronomie 22, 373–387. doi:10.1051/agro:2002022
Udias, A., Galimberti, F., Dorati, C., and Pistocchi, A. (2022). Emissions of pesticide active substances in the European Union, extrapolated from country reports. Submitted.
Urionabarrenetxea, E., Casás, C., Garcia-Velasco, N., Santos, M., Tarazona, J. V., and Soto, M. (2022). Predicting environmental concentrations and the potential risk of Plant Protection Products (PPP) on non-target soil organisms accounting for regional and landscape ecological variability in European soils. Chemosphere 303, 135045. doi:10.1016/j.chemosphere.2022.135045
Van den Brink, P. J., Bracewell, S. A., Bush, A., Chariton, A., Choung, C. B., Compson, Z. G., et al. (2019). Towards a general framework for the assessment of interactive effects of multiple stressors on aquatic ecosystems: Results from the Making Aquatic Ecosystems Great Again (MAEGA) workshop. Sci. Total Environ. 684, 722–726. doi:10.1016/j.scitotenv.2019.02.455
Vigiak, O., Udias, A., Pistocchi, A., Zanni, M., Alberto, A., and Grizzetti, B. (2021). Probability maps of anthropogenic impacts affecting ecological status in European rivers. Ecol. Indic. 126, 107684. doi:10.1016/j.ecolind.2021.107684
Vogt, J. V. (2007). A pan-European river and catchment database. EC-JRC Rep. Eur. 22920 En. Luxemb., 120. Available at: https://ccm.jrc.ec.europa.eu/documents/CCM2-Report_EUR-22920-EN_2007_STD.pdf.
Vörösmarty, C. J., McIntyre, P. B., Gessner, M. O., Dudgeon, D., Prusevich, A., Green, P., et al. (2010). Global threats to human water security and river biodiversity. Nature 467, 555–561. doi:10.1038/nature09440
Keywords: pesticides, freshwater, cumulative toxicity, spatial model, soil
Citation: Pistocchi A, Dorati C, Galimberti F, Udias A, Bopp S, D’Andrimont R, Catarino R and Schaefer RB (2023) A screening study of the spatial distribution and cumulative toxicity of agricultural pesticides in the European Union’s waters. Front. Environ. Sci. 11:1101316. doi: 10.3389/fenvs.2023.1101316
Received: 17 November 2022; Accepted: 30 March 2023;
Published: 25 April 2023.
Edited by:
Sanjeeb Mohapatra, National University of Singapore, SingaporeReviewed by:
Pooja Sharma, Environmental Research Institute, National University of Singapore, SingaporeCopyright © 2023 Pistocchi, Dorati, Galimberti, Udias, Bopp, D’Andrimont, Catarino and Schaefer. This is an open-access article distributed under the terms of the Creative Commons Attribution License (CC BY). The use, distribution or reproduction in other forums is permitted, provided the original author(s) and the copyright owner(s) are credited and that the original publication in this journal is cited, in accordance with accepted academic practice. No use, distribution or reproduction is permitted which does not comply with these terms.
*Correspondence: A. Pistocchi, YWxiZXJ0by5waXN0b2NjaGlAZWMuZXVyb3BhLmV1
Disclaimer: All claims expressed in this article are solely those of the authors and do not necessarily represent those of their affiliated organizations, or those of the publisher, the editors and the reviewers. Any product that may be evaluated in this article or claim that may be made by its manufacturer is not guaranteed or endorsed by the publisher.
Research integrity at Frontiers
Learn more about the work of our research integrity team to safeguard the quality of each article we publish.