- 1China Three Gorges Corporation, Wuhan, China
- 2National Engineering Research Center of Water Resources Efficient Utilization and Engineering Safety, Nanjing, China
- 3State Key Laboratory of Simulation and Regulation of Water Cycle in River Basin, China Institute of Water Resources and Hydropower Research, Beijing, China
- 4College of Water Resources and Civil Engineering, China Agricultural University, Beijing, China
- 5School of Water Conservancy and Civil Engineering, South China Agricultural University, Guangzhou, China
- 6School of Water Conservancy, North China University of Water Resources and Electric Power, Zhengzhou, China
Aquatic vegetation interferes with river hydrodynamics, thus affecting the mass transport and energy transfer in an ecosystem. The flow over submerged vegetation is characterized by a complex velocity profile and multiple turbulence structures, which have been usually simulated using cylinders or strips in previous studies. Because the simplified vegetation configuration may hide or amplify some physical processes found in natural conditions, we investigate the velocity distribution and turbulence structure in foliaged vegetation flows using both analytical and numerical approaches. The main innovations and findings can be summarized as follows: 1) numerical and analytical models adopted in this paper accurately simulate the flow velocity profile in vegetated channel; 2) the Karman constant is found to be unsuitable for complex vegetation morphologies, so we proposed adjusted coefficient; 3) an image processing method is adopted to quantify the vegetation morphology accurately; 4) the existing mixing-layer thickness formula is found to be unsuitable for vegetation with leaves, an improved formula is proposed showing high correlation coefficient (0.9562) between measured and predicted data; 5) to ensure applicability to larger-scale hydrodynamic simulations, an analytical expression of Manning’s coefficient is proposed based on an analytical multi-layer flow velocity model. These research findings can provide theoretical support for the design of vegetated river and ecological restoration.
1 Introduction
Water flow and associated material, microorganism transport is one of the research hotspots in ecological hydraulics (Wu et al., 2021a; Jiang et al., 2022; Li et al., 2023). The vegetation that is ubiquitous in rivers changes the flow structure, thereby affecting flood conveyance (Katul et al., 2011; Konings et al., 2012), sediment and pollutant transport (Huai et al., 2009; Shucksmith et al., 2010; Huai et al., 2019a; Huai et al., 2019b; Shan et al., 2020; Afzal et al., 2021; Wu et al., 2021b; Zhao and Nepf, 2021), channel evolution (Rominger et al., 2010; Zhao et al., 2021), and creature activity (Kemp et al., 2000; Bornette and Puijalon, 2011). Ecological channels usually grow a large number of aquatic vegetation. Under the given flow conditions, the velocity distribution characteristics in the river are affected by the vegetation and the shape of the river, and the distribution of vegetation affects the shape of the river. The flow blocking mechanism of vegetation and the turbulent characteristics of flow are related to the river boundary, water level, flow and the type, density and shape of vegetation, and the water quality and ecology along the river were directly improved by vegetation (Huai et al., 2018). Studies on the flow characteristics of ecological channels with vegetation help to clarify the physical and ecological functions of river systems.
Analytical method is the application of analytical formula to solve mathematical models. The analytical model has advantages over the actual laboratory experiment in terms of cost, time and limitations of field collection conditions. Therefore, the further study and improvement of the analytical model has always been the focus of attention of scientists. Owing to the drag exerted by plants, the flow passes over submerged vegetation, the velocity distribution becomes vertically discontinuous and an inflection point occurs at the canopy top (Nepf and Vivoni, 2000). Thus, the profile of the velocity U is S-shaped and no longer follows a logarithmic law (Carollo et al., 2002). Some researchers have simulated vegetated flows numerically by modifying the momentum equation with the canopy drag force formula. For example, Fischer-Antze et al. (2001) solved the three-dimensional Navier–Stokes (3D N-S) equations using the SIMPLE method and the k-ε turbulence model, while Erduran and Kutija (2003) proposed a quasi-3D numerical solution that couples the finite volume solution of the shallow water equations with a finite difference solution of the N-S equations. Zeng and Li (2014) incorporated the Spalart–Allmaras turbulence closure into the 3D N-S model, whereas Pu et al. (2020) combined the improved Shiono-Knight model (SKM) with a Multi-Zonal (MZ) method (proposed by Pu et al., 2020) and applied the proposed analytical model to the flow of rectangular channels. These numerical models can capture the hydrodynamic characteristics of the flow at any point (Lu and Dai, 2016; Yan et al., 2017), Pourshahbaz et al. (2022) compared the numerical model with the experimental results in literature, and found that the overall results of the model better reproduced the measured data,.But their accuracy depends on the parameter settings of the model, which are semi-empirical and suffer from a shortage of suitable guidelines. Other scholars have explored the U profile in an analytical manner by directly solving the N-S equations. This approach represents the kinetic viscosity ν through some turbulence characteristic terms, such as the mixing-length, turbulent kinetic energy, or turbulent kinetic energy dissipation rate (Katul et al., 2004; Poggi et al., 2009; Wang et al., 2018). For example, Katul et al. (2011) found that U exhibits exponential and logarithmic profiles within and above the canopy, respectively; and Cheng et al. (2012) showed that the U profile is exponential above the canopy in a depth-limited flow where the submergence degree is less than 2.
Scientists have not only analyzed the influence of canopy resistance formulas on the U profile of submerged vegetation velocity, but several studies have also explored the profile of U by analyzing motions of turbulent vortices. Vegetated flows are generally characterized by the Kelvin–Helmholtz (KH) vortex, which is driven by the KH instability and billows around the canopy top (Nepf, 2012). Ghisalberti and Nepf (2004) defined the waving region of the KH vortex as the vegetal shear layer (VSL), and observed a hyperbolic tangent profile for U in the exact region. Because the flow below and above the VSL is characterized by wake turbulence and boundary shear turbulence, U is assumed to display constant and logarithmic profiles, respectively (Nezu and Sanjou, 2008). Nikora et al. (2013) proposed a general velocity distribution formula that incorporates multiple turbulent mechanisms to depict the profile of U throughout the water depth. The proposed formula is efficient and accurate, but the VSL boundaries must be provided beforehand. The VSL lower boundary Zl can be evaluated according to the Reynolds shear stress profile, canopy density, or zero-plane displacement height (Nepf and Vivoni, 2000; Luhar et al., 2008; Nepf and Ghisalberti, 2008). The VSL upper boundary Zu is assumed to be the critical point at which the U profile deviates downwards from the logarithmic law near the free surface (Nezu and Sanjou, 2008), and can be assessed indirectly by the VSL thickness, which is proportional to the momentum thickness θ. The value of θ is calculated using the flow velocities Ul, Uu at the VSL boundaries and the frequency of the KH vortex fKH, i.e.,
Previous hydrodynamic studies of submerged vegetation have been based on reducing vegetation to cylindrical rods. Finnigan, 2000 pointed out that vegetation cannot be simply considered as a rigid cylinder, because vegetation tends to have complex structural and biomechanical properties, which will produce great deviations in the study of flow resistance and velocity. Recent studies have tended to study vegetated flows with natural-like plant morphologies, because any simplification of the vegetation configuration hides or amplifies some of the physical processes found in natural conditions (Tinoco, 2020). Li et al. (2020) presented the vertical distributions of velocity, Reynolds shear stress, and turbulence intensities in foliaged vegetation flow. Wang et al. (2019) and Zhang et al. (2021) derived analytical solutions for the profile of U in flows over submerged flexible vegetation with variable frontal widths. Tschisgale et al. (2021) explored the interaction between coherent flow structures and vegetation reconfiguration, and discussed the mechanism that drives the wavy motion of the canopy in the Monami regime. Wilson et al. (2003) found that vegetation with foliage increases the canopy drag force and inhibits vertical momentum exchange, thereby inhibiting the vegetal shear turbulence. Chembolu et al. (2019) showed that a mixed arrangement of different morphologies of vegetation reduces the flow velocity and vegetal shear turbulence, and this shifts the peak Reynolds stress distribution upwards from the canopy top.
In summary, the vegetation morphology affects the motion of the KH and wake vortices and changes the U profile by redistributing the canopy drag (Caroppi and Järvelä, 2022). This study investigates hydrodynamic features such as the turbulence motion and velocity distribution law in an open-channel flow with different types of submerged vegetation. Specifically, we explore the profile velocity using both analytical solutions of the N-S equations and turbulence investigations of the vortex structures, different from existing studies on turbulence structures or analytical solutions of the velocity profile.
2 Theory
2.1 Numerical model
By introducing the resistance term of vegetation into the Reynolds-averaged N-S equations, the momentum equation in the flow direction can be obtained as follows (Luhar et al., 2008; Nepf, 2012):
where ν is the kinematic viscosity of water and z is the vertical distance calculated from the bottom of the riverbed.
The critical items in the above equation are
which is the spatially averaged Reynolds stress term,
which is the viscous shear stress, and
which is the vegetation resistance term, i.e., the drag force term. Where
Further studies have been carried out for vegetated water flows in the case of a constant uniform flow, and the pressure term expression is as follows:
Subsequently, the flow control equation for constant uniform flow conditions is simplified as
For Reynolds stress, the standard K-equation is
where Km is the vortex viscosity coefficient. Substituting the above equation into the control equation gives
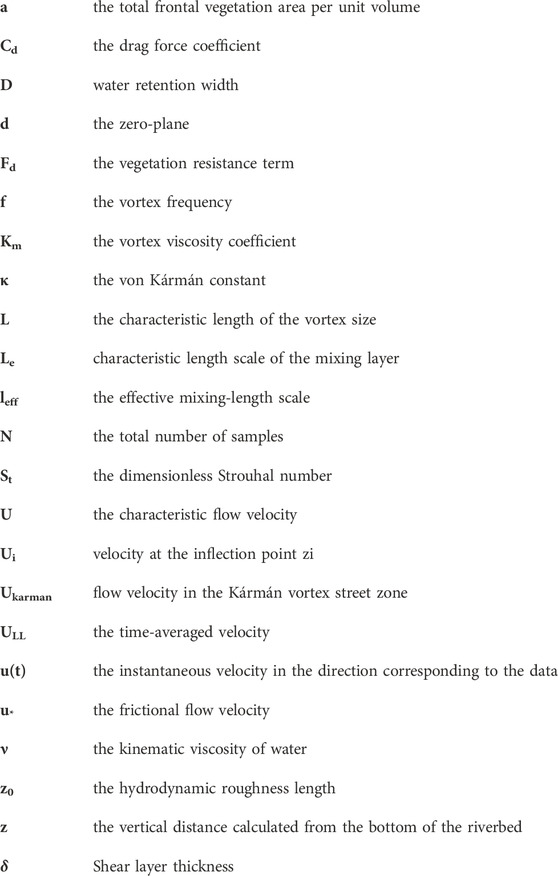
where Cd is the drag force coefficient. D is water retention width that changes along the vegetation stem, and the variation can be derived in a photography-mathematical method in this article.
To resolve the flow velocity using this equation, the distribution law of the vortex viscosity coefficient needs to be tackled. By means of the Prandtl mixing-length model, we can write
where leff is the effective mixing-length scale, which is a function of the dominant vortex size.
For the boundary layer on top of the vegetation, the mixing length is
where d is the zero-plane, which can be determined by the following equation:
The vegetation layer contains the entire Karman vortex zone (lower part of the vegetation layer) as well as part of the mixing layer. Under a simplified approach, the mixing length of the vegetation layer can be written as
where ψ is a constant that can be derived from the assumption of continuity of the mixing length over the entire water depth:
2.2 Analytical model
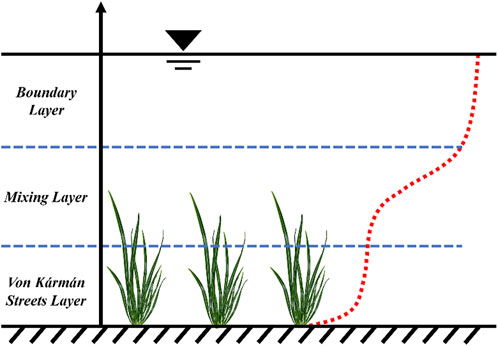
The methods currently used to describe velocity profiles can be divided into three main categories: 1) methods based on the concept of a single profile; 2) methods based on segmented velocity profiles, where the velocity profile is represented by a set of relationships defined for non-overlapping flow zones or segments; and 3) a (linear) superposition based on several traditional concepts applied to the entire flow depth. In contrast to the segment-based model, this paper uses a flow superposition model based on traditional concepts proposed by Nikora et al. (2013), with the innovation that the superposition model is applied to vegetation with a realistic morphology, i.e., the velocity profile can be represented as a superposition of individual profiles formed by specific momentum transport mechanisms. The proposed approach combines these concepts simulatively over the entire flow depth, allowing significant overlaps of momentum transport and turbulence production mechanisms. On this basis, the analysis focuses on the Kármán vortex street zone, the mixing-layer zone, and the boundary layer zone (Figure 1).
2.2.1 Kármán vortex street zone
The vertical variation of the Reynolds stress can be neglected near the bottom, and the vegetation drag force is balanced by the gravity component, so Eq. 6 can be simplified as
Furthermore, following Nikora et al. (2013) and Nepf (2012), we can write
where a is the total frontal vegetation area per unit volume, and Ukarman is flow velocity in the Kármán vortex street zone where the velocity is vertically constant.
2.2.2 Mixing-layer zone
Ei-Hakim and Salama, 1992 argued that Mixing-layer turbulence, formed around the inflectional mean velocity profile which develops between two coflowing streams of different velocities. Ghisalberti and Nepf (2002) implemented this analogy and showed that there is good agreement between velocity profiles measured in their experiments and the hyperbolic tangent law of the mixing layer theory. Nepf and Ghisalberti (2008) proposed two equations to describe the velocity profile gravity. To obtain the complete velocity profile, the submodels proposed for the different layers and zones were combined by imposing various matching conditions (e.g., the velocities and velocity gradients at the boundaries between the different zones should match). Coles (1956) studied the flow velocity distribution by showing that only the logarithmic law occurring in the inner region of the boundary layer is valid and proposed a wake function. Thus, he proposed that the overall velocity profile should be represented “by a linear combination of two universal functions,” the law of the wall and the law of the wake. Later, several researchers demonstrated the applicability of this concept to open channel flow [Zhao et al., 2019 and Stoesser et al., 2009].
where Ui is velocity at the inflection point zi; and Le is characteristic length scale of the mixing layer.
2.2.3 Logarithmic rate zone
The logarithmic component of velocity ULL is mainly caused by the proportional variation of turbulence with distance from the bed, and can be represented by the well-known logarithmic law. Kouwen et al. (1969) use the boundary layer concept and the associated logarithmic formula (or logarithmic law) to calculate the velocity distribution above the canopy as
where ULL is the time-averaged velocity, z is the vertical distance from the canopy top, κ is the von Kármán constant, u* is the frictional flow velocity, and
Ghisalberti and Nepf, 2006 studied the velocity distribution, used the logarithmic section to model, and tried to use the zero plane displacement to move the inflection point. The equation proposed by Kouwen et al. (1969) suffers from the defect that the zero plane, which is the horizontal asymptote of the logarithmic equation, is located at the channel bed. Considering the effect of zero-plane displacement, the logarithmic flow velocity profile of flow above the vegetation should be described as
where
2.3 Turbulent energy spectrum analysis
Spectral analysis of the flow velocity data involves transforming the time domain signal into a frequency domain signal. This enables analysis of the oscillation frequency of the instantaneous flow velocity sequence. The power spectral density is mainly based on the squared value of the flow velocity signal, and the frequency corresponding to the peak power spectral density is the dominant frequency of the vortex. The experimental data are first smoothed and then the power spectral function curve is obtained by applying a Fourier transform to the autocorrelation function of the pulsating flow velocity.
The fast Fourier transform (FFT) is a common method for analyzing the spectral characteristics of turbulent pulsation energy by converting the time-domain flow pulsation signal into a frequency-domain signal. The fluctuating velocity is generally divided into two types: the high frequency and small amplitude fluctuation caused by the small vortex in the turbulence, and the low frequency and large amplitude fluctuation caused by the large vortex. The FFT is applied to the instantaneous flow velocity sequence V, which contains n = 2m samples. The resulting vector F contains j = 1-2m-1 elements, and satisfies the following equation:
where the amplitude of F is related to the sampling epoch and the number of samples.
3 Experimental setup and program
3.1 Experimental equipment and measurement devices
3.1.1 Experimental equipment
Experiments were completed at the State Key Laboratory of China Institute of Water Resources and Hydropower Research. The experimental set consists of a tank-flume system, simulated vegetation, water ruler, Doppler flow velocity measurement instruments, and related auxiliary facilities. The laboratory has constant heating measures and good ventilation, which ensures stabilities of water temperature and the surrounding environment during the experiment measurement. Figure 2 shows a schematic diagram of the tank-flume system that can be divided into four parts, i.e., an inlet head tank, glass flume, tail tank, and circulation pipe. The glass flume is rectangular and 12 m long, 1 m wide, and 1 m high. A honeycomb structure is installed at the flume entrance to make incoming flow uniform. The flume bed is made of PVC board with magnetic suction bases to locate vegetation elements, and a sluice gate is set at the flume end to maintain the flow depth. The head tank and tail tank is connected by a circulation pipe that is equipped with pump-electromagnetic flowmeter to control the inflow discharge of the flume.
3.1.2 Acoustic Doppler velocity meter
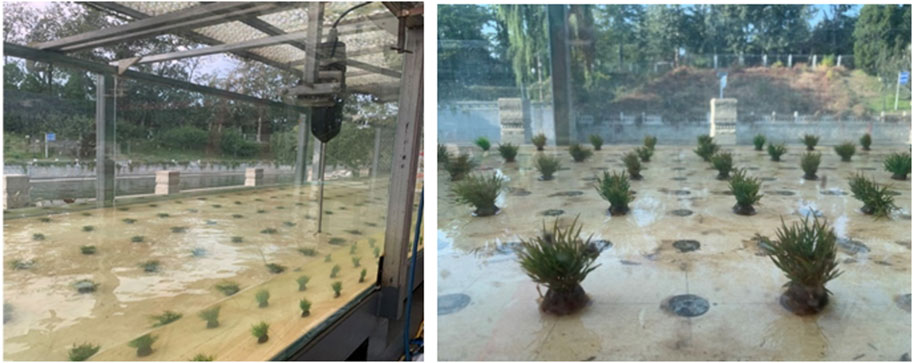
In the experiment, the Acoustic Doppler Velocimeter (ADV) was 200 Hz to measure the velocity field under vegetation flow conditions. The working principle of ADV is based on Doppler Effect, which is mainly composed of signal processing equipment and probe. The probe consists of one transmitter and three receivers. The transmitter generates acoustic waves. If there is a particle movement in the measurement area, the frequency of the acoustic wave reflected by the particles will be different from the original frequency. The three receivers will receive acoustic signals of different frequencies reflected by the particles. The signal processing equipment processes these signals according to the frequency shift principle of Doppler and calculates the instantaneous velocity and movement direction of the particles. The velocity distribution on the whole measuring line is obtained by superimposing the data measured by the probe. The highest sampling frequency is 200 Hz, and the sampling volume is less than 0.09 cm3. In this experiment, ADV uses a lateral probe, the sampling frequency is 200 Hz, and the sampling time of each point is 120 s. The vertical line spacing is 1cm, and the maximum height measured is 3 cm below the water depth because of the lateral probe. The ADV device is fixed on a customized bracket to ensure the measurement stability during the experiment (Figure 3). The bracket is spatially movable, so the flow velocity at any point can be measured.
3.1.3 Experimental materials
According to the experimental requirements, the vegetation covered bed area of 9 m in length and 1 m in width, and distributed 1 m downstream of the flume inlet. The vegetation type and arrangement were designed to be adjustable. Following research on mudflat areas, the simulated vegetation consisted of dwarf grass with 6 cm height and sedge with 13.5 cm height, and specific parameters of the experimental vegetation are shown in Figure 3.
3.2 Experimental process
3.2.1 Experimental working conditions
To study hydrodynamic characteristics and turbulence development in the rectangular flume, tests were carried out under different vegetation densities and submergence degree conditions. Specific parameters of the tests are listed in Table 1.
3.2.2 Measurement point cross-section
To ensure a relatively complete and in-depth study of the vegetation flow, the onset of turbulence was examined in a preliminary analysis. Turbulent flow was found to be fully developed in the longitude region of x = 400–900 cm.
The measurement points include the vegetated and surrounding areas, and the vegetation was arranged symmetrically along the centerline of the flume. The average values of the flow velocity at y = 40 cm and y = 50 cm were taken as the plane mean flow velocity for the vegetation spacing of 20 cm × 15 cm; the average values of the flow velocity at y = 45 cm and y = 50 cm were taken as the plane mean flow velocity for the vegetation spacing of 10 cm × 7.5 cm. The vertical measurement step was set to be 0.05 times the water depth.
3.3 Data processing
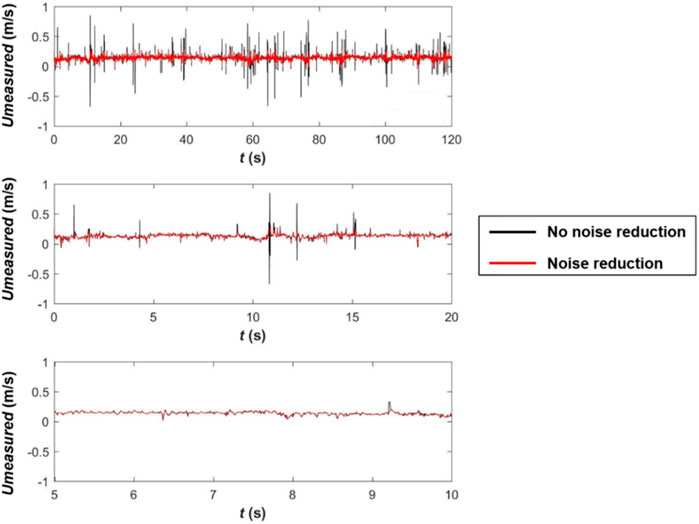
When ADV is used to measure turbulent flow, some invalid signals may be collected because of various environmental factors. Therefore, we take some post-processing methods to remove noise signals before calculating velocity values. When removing the interference values from the sample data, four times the standard deviation of the sample was taken as the interval for filtering. The processing method was performed as follows.
First, the overall flow velocity data were processed to remove the interference values in the sample data, i.e., those greater than four times the sample standard deviation. The flow rate sequence obtained with a sampling time of 2 min and sampling frequency of 200 Hz was taken as the data sample, and mean and variance of the data sequence were calculated. When the absolute value of difference between the flow rate signal value ui(t) and the sample mean was greater than 5 times of the variance, i.e., σ1, the signal value was considered to be interference, and the two adjacent correct signal values were interpolated to replace the interference signal value.
where u(t) is the instantaneous velocity in the direction corresponding to the data, U is the time-averaged value of u(t), and N is the total number of samples.
For smaller disturbance values, it is difficult to distinguish them from turbulent pulsations within the flow velocity time series, mainly in the form of large abrupt changes from the preceding and following adjacent flow velocity values. To reflect the nature of continuous variations in the flow velocity, a subtle correction was made to the local abrupt flow velocity data according to the adjacent flow velocity data. The mean and standard deviation of the five flow velocity values before and after the flow velocity at a given point were used to determine whether the flow velocity value at that point was an interference peak.
where n = 10 is the number of local data. If the flow velocity at the intermediate point was not within 2σ2 of the average value, it was regarded as an interference peak.
The noise reduction process effectively removes the interference signal caused by environmental factors, while retaining the true form of the water flow signal. A comparison of the data before and after noise reduction is shown in Figure 4.
4 Results and discussion
4.1 Morphological characteristics of submerged vegetation
In this study, a simulation method was used to measure the diameter of the plant stems. First, the distance between the shooting point and the plant was measured using laser distance measurement technology, and an image of the plant was collected at the shooting point.
Where, R represents red pixel, G represents green pixel, and B represents blue pixel. Grayscale image is gray and black and white with different depths, which describes the overall and local chroma and brightness of the image and color image.
The column averages of the recorded data were calculated and divided into a predetermined number of consecutive recognition zones. The demarcation points of the recognition zones were calculated, and the length of the pixel corresponding to the diameter of the plant stem was computed using the pixel coordinates of the two adjacent demarcation points. Finally, the diameter of the plant stem was determined using the length of the pixel, the distance between the shooting point and the plant, and the orientation of the image.
The length of the pixel correspond”ng t’ the diameter of the plant stem is given by
The plant stem diameter calculation determines the diameter of the plant stem using the following formula:
This method overcomes the problems of measuring the diameter of plant stems, namely, the low efficiency, poor accuracy, and time-consuming procedure. It also removes the influence of the topography and planting density on the results, and ensures a higher measurement accuracy. Through image processing, the submerged vegetation height hv corresponding to the two groups of working conditions and the vegetation retaining width D along the vertical variation were obtained. On this basis, the “adaptive” characteristics of vegetation morphology under the water flow environment can be qualitatively determined for dwarf grass and sedge. The vegetation water retention width D along the vertical direction is calculated separately for each working condition. The treatment images are shown in Figure 5A.
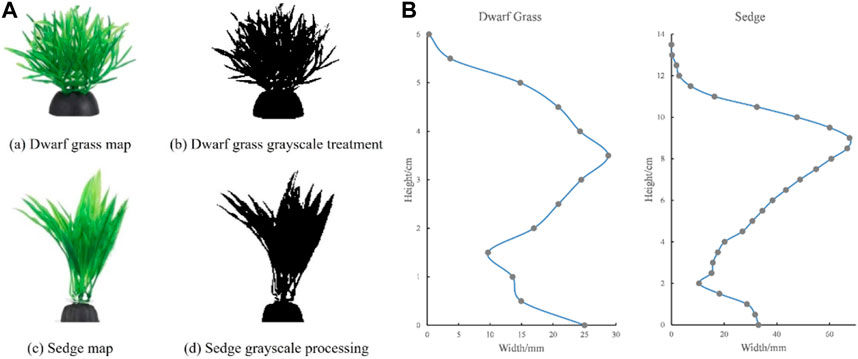
FIGURE 5. (A) Vegetation prototype and grayscale processing; (B) Vertical width of underwater morphology of different vegetation.
The underwater morphology of the vegetation and the vegetation water retention width along the vertical direction corresponding to each working condition are shown in Figure 5B. The equivalent widths of the two types of vegetation are found to be 2.73 cm for dwarf grass and 2.97 cm for sedge.
4.2 First-order closure model validation
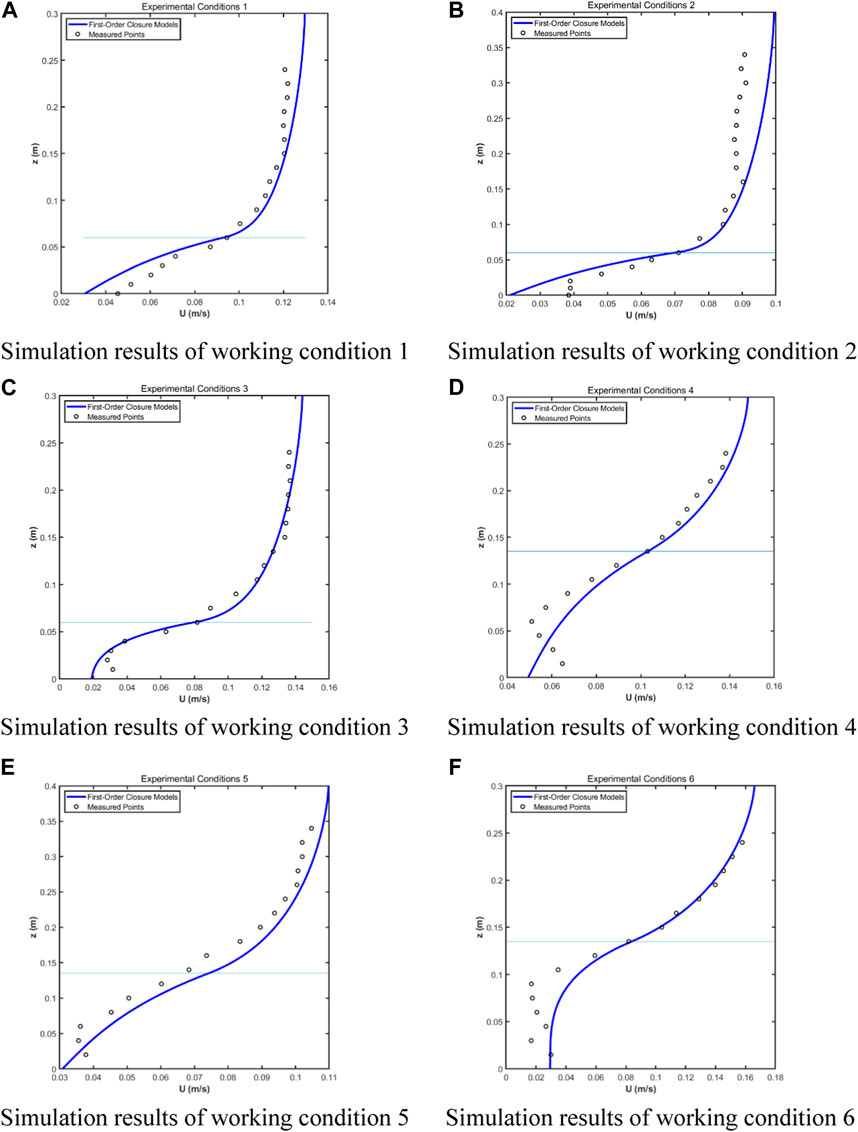
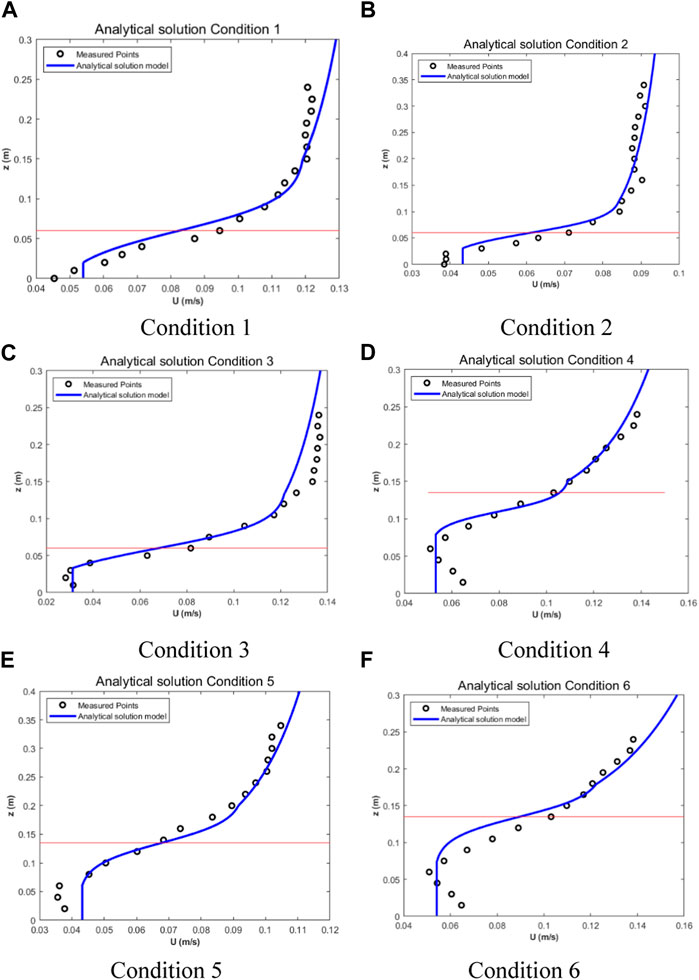
The results of these spatial analyses of canopy flow are reflected in the traditional vertical profiles of velocity moments. As is readily apparent from a statistical examination of the data, the results are highly dependent on the proximity to the canopy, leading to the generation of very large vertical heterogeneity, especially in vegetated environments with variable vertical orientation. The changes in curvature of the velocity profile, from a logarithmic form in the high-momentum layer above the top of the canopy to an exponential form in the resistance layer below, leads to an inflection point near z = hv. The results indicate that an increase in canopy density leads to enhanced flow characteristics, as shown in Figure 6 for various working conditions, where the flow velocity in the canopy decreases and the shear at the top of the canopy increases. The vertical variation in leaf diameter moderates these effects, which tend to be stronger when more leaves are concentrated in the upper layer. This is especially true in the case of denser vegetation, where the turbulent state in the canopy seems to be mainly determined by the upper canopy elements and is minimally influenced by the lower part of the vegetation.
The specific parameters selected for the numerical calculation of the flow velocity distribution using first-order closure are presented in Table 2. Cd is calculated by adopting method of Cheng and Nguyen (2011):
As can be seen from Table 2, there is a high correlation between kv and the vegetation attributes and inundation degree. When the vegetation is relatively short, the value of kv is large, and when the vegetation height is relatively high, the value of kv remains basically unchanged. In the environment where the vegetation is short, an increase in the inundation degree enhances the value of kv, which explains why the vegetation height produces a difference in diameters. Specific simulation results are shown in Figure 6.
4.3 Flow rate superposition model validation
4.3.1 Turbulent energy spectrum analysis
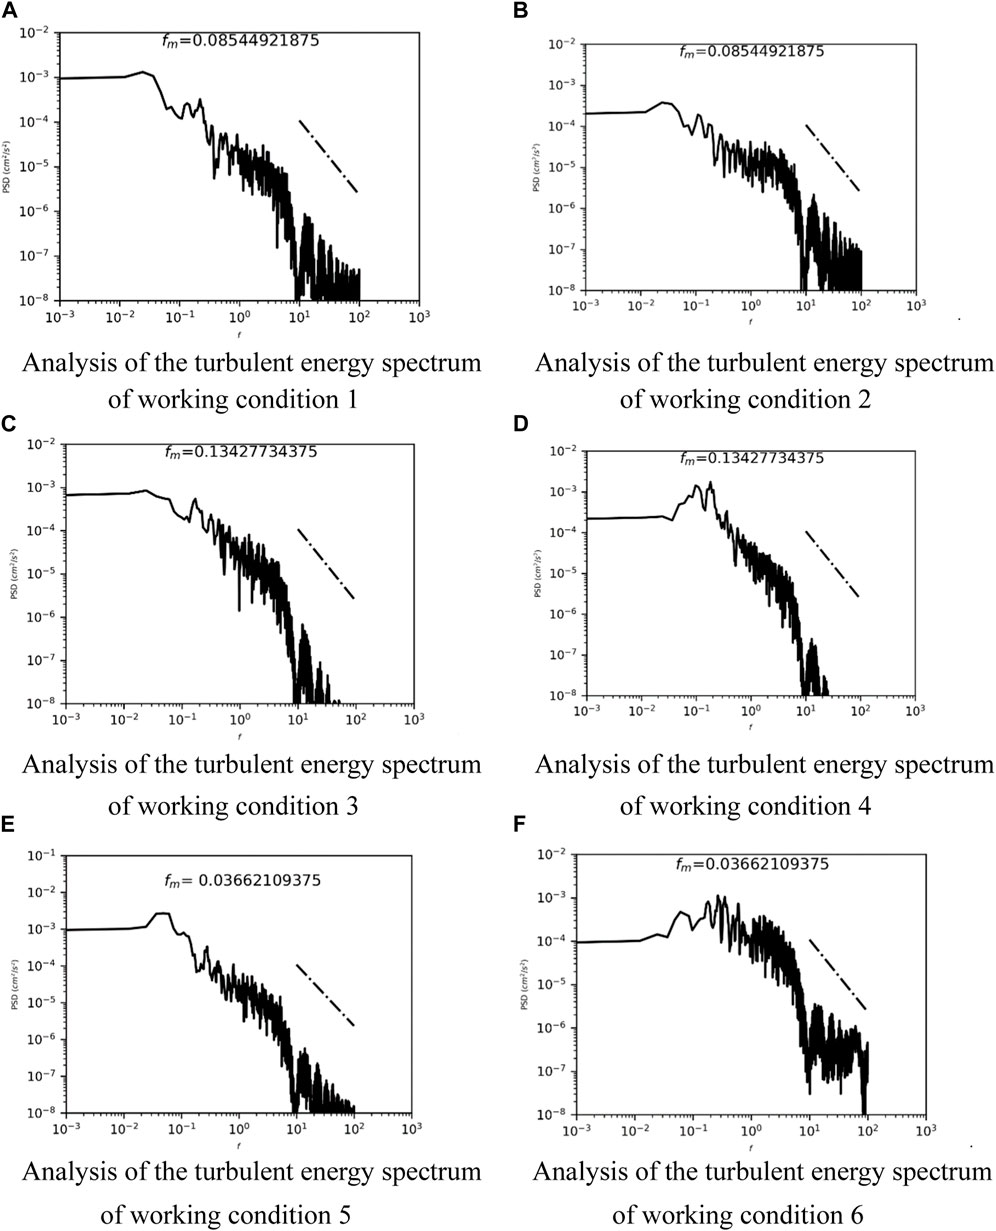
This subsection investigates the turbulent structure of the shear layer formed at the interface between the vegetated and non-vegetated zones. The KH instability leads to the formation of vortex structures within the shear layer. These vortex structures dominate the lateral transport of energy as well as momentum, which is reflected at the interfacial interface, where periodic fluctuations in velocity and Reynolds stress occur. The longitudinal and transverse flow velocities are inversely correlated, indicating that there is a strong momentum exchange at the intersection, and the strong sweep is accompanied by weak promotion. The approximate periodicity of velocity and Reynolds stress proves that there is a dominant frequency of the vortex structures at the intersection, and energy spectrum density analysis can be used to determine this dominant frequency.
The vegetation morphology affects the vortices generated by the water flow when passing through the submerged vegetation. In general, the turbulence intensity of the water flow increases with increasing flow velocity, whereupon the vortex propagation frequency becomes faster. Therefore, the flow velocity sequence on top of the vegetation is analyzed using the energy spectrum, and then the propagation frequency and energy dissipation law of turbulence are determined.
Spectrum analysis indicates that, under the influence of the vegetation properties and the distribution method, the water flow produces large and small vortices near the lower edge of the vegetation cover. These vortices cause strong periodic oscillations and momentum transport in the flow, specifically the periodic oscillation of the longitudinal flow velocity and vertical Reynolds stress. Analysis of the peak frequency of the energy spectrum (Figure 7) shows that the distribution of the energy spectrum satisfies the −5/3 power law.
Further analysis of the water flow in the fully developed region (x/lveg = 0.61) indicates that the dominant frequency of the eddies varies considerably at the vegetation intersections. The dimensionless Strouhal number (St) describes the relationship between the frequency of eddy shedding and the characteristic length of the obstacle, and is widely used in conditions where the Karman vortex street or the stem turbulence generating term Pw is dominant. St is calculated as
where f is the vortex frequency, i.e., the dominant frequency in the energy spectrum analysis, L is the characteristic length of the vortex size, and U is the characteristic flow velocity (usually the traveling flow velocity near the obstacle). For a large range of Reynolds numbers, Huai et al., 2021 noted that St = 0.21. Poggi et al. (2004) found that St tends to remain constant as the rigid vegetation density varies.
Using Nepf’s formula, which differs significantly from our measured values, we have
whereas Ho et al. (1991) suggested that
The presence of vegetation strongly changes the cross-sectional distribution of mean streamwise velocity. This parameter is obtained by separating the average velocity and instantaneous velocity fluctuation of each velocity component (Hopkinson and Wynn, 2009). Compared with non-vegetated flow, the change of vegetation-driven turbulence is a function of physical parameters such as vegetation type (flexibility and rigidity), relative submergence (submergence and outflow) and density (sparse and dense). In the case of complete submergence, the vegetation changes the velocity and turbulence intensity profiles, forming a vertical mixing layer near the top of the S-shaped velocity profile at the inflection point (Ghisalberti and Nepf, 2002). This mixing layer is a large-scale coherent vortex with properties, which convections the high momentum fluid to the low momentum fluid region in the canopy. This mechanism can be further modified. The energy spectrum density analysis method is used to process the interface velocity, and the peak energy spectrum density corresponds to the dominant frequency of the continuous vortex structure.
4.3.2 Flow rate superposition model
Most studies on the hydrodynamic characteristics of aquatic plant canopies under inundation have recognized that their time-averaged flow velocity distributions have inflection points near top of the canopy. Several studies have also recognized hyperbolic-type distributions. Shi et al., 2023 derived hyperbolic sine and hyperbolic cosine distribution patterns above the canopy through an analytical approach. By adjusting each parameter in them, these functional expressions were able to obtain better agreement with the measured values. Researchers believe that the logarithmic distribution of the time-averaged flow velocity is the result of turbulent motion in the boundary layer, while the inverse tangent or hyperbolic distribution with an inflection point is the result of turbulent vertical mixing in the mixed layer. The essence of the former is the submerged aquatic plant canopy forming a rough boundary layer in the flow. The boundary layer above the canopy turbulent vortices does not penetrate the interior of the canopy, and is thus unaffected by the mixing of the two layers of water inside and outside the canopy. The essence of the latter is the plant canopy providing a rough pore medium for water flow through the canopy, whereby the two layers of different velocities inside and outside the canopy mix with each other to produce mixed-layer turbulent vortices, thus causing momentum exchange in the upper region. Nikora et al. (2013) derived a third type of distribution, namely, segmental superposition, which replicates the characteristics of interconnectedness and smoothness between the segments by superposition. A flow velocity superposition diagram is shown in Figure 8.
The analytical model was applied to solve the model using the parameters presented in Table 3.
For experimental conditions including flexible vegetation, a genetic algorithm gives
Compared with Eq. 30, Nepf formula and Eq. 30 were used to calculate fKH. The correlation coefficient of Nepf formula was −0.5015, and that of Eq. 30 was 0.9562, indicating a great improvement in simulation accuracy (see Figure 9).
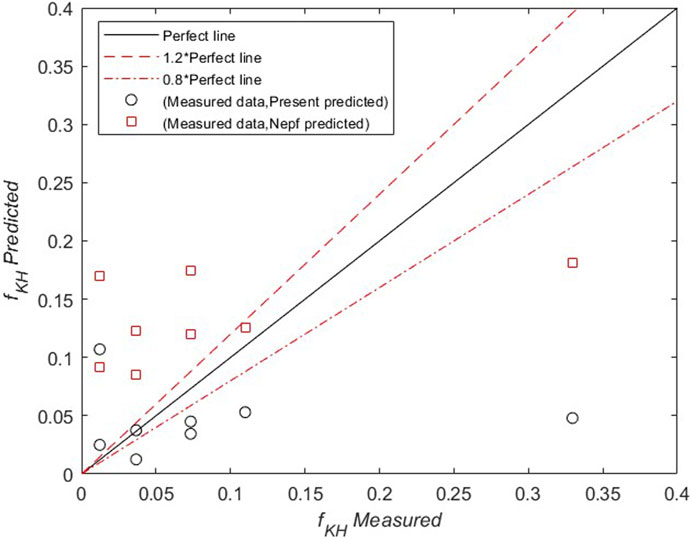
FIGURE 9. Comparison of measurements with fKH of Nepf (2012) and predicted fKH of present study.
4.4 Manning’s coefficient: Theoretical formula to solution
Manning’s formula is used to calculate the resistance coefficient of water flow in rivers and wetlands, such as in river flow calculations, flood control analysis, and watershed water transfer. The complexity of actual river flow states requires extended and modified versions of Manning’s formula. However, the specific expression of Manning’s formula for vegetated rivers under nonuniform hook flow conditions remains unclear. As the core parameter in Manning’s formula, this paper presents an equation for calculating Manning’s coefficient for vegetated rivers. Using this coefficient, we can then derive Manning’s formula in nonuniform flow conditions. Manning’s coefficient can be expressed as
The analytical solution for the flow velocity is averaged in the water depth direction to obtain the section average flow velocity, which is substituted into Eq. 30 to obtain the Manning’s coefficient equation for the reference flow velocity superposition model. The linear superposition model equation can be expressed as
The expression for Manning’s coefficient can be solved by performing a segmental integration of the following terms.
(1) Ukarman
Where 0∼Z1 is the zone of Karman vortex.
(2) UML
Where Z1∼Z2 is the zone of Mixing layer.
(3) ULL
Where Z2∼hw is the Logarithmic rate region.
The resistance of water flow in a river channel directly affects the water level and water distribution in the basin. Simulations of the hydraulic process in a river channel using a mathematical model require the relevant resistance characteristics. The resistance of a vegetated river channel under nonuniform flow conditions mainly consists of two parts: the resistance caused by the rough form of the river itself and the resistance caused by the vegetation blocking water. The presence of vegetation causes the water depth and flow velocity to vary along the course, forming a constant nonuniform flow. In this case, we must consider both along-range energy loss and local resistance energy loss, which leads to the calculation formula for Manning’s coefficient.
Combining Eqs. 30, 35, we obtain
5 Conclusion
The first-order closure model and analytical models were used to calculate and analyze the flow velocity distribution in a vegetated rectangular channel. Using experimental data from actual measurements and correlation coefficients gives results that are in good agreement with the actual measurements. This confirms that the application of both models to vegetated river channels is feasible.
The conclusions from this study can be summarized as follows: 1) Both the numerical model and the analytical model proposed in this paper can accurately simulate the water flow movement under the influence of vegetation. 2) In scenarios where Karman’s constant is not applicable to complex vegetation morphologies, we have proposed a new Karman coefficient. 3) We adopted an image processing method to quantify the vegetation morphology accurately. 4) As the existing mixed-layer thickness formula is not applicable to vegetation with leaves, we have derived an improved approach. 5) To ensure applicability to larger-scale hydrodynamic simulations, we proposed an expression for Manning’s coefficient based on the multi-layer flow velocity analytical solution model. Finally, we demonstrated the variation characteristics of Manning’s coefficient with respect to the inundation degree, which provides theoretical support for vegetated river design and ecological restoration.
Data availability statement
The original contributions presented in the study are included in the article/supplementary material, further inquiries can be directed to the corresponding author.
Author contributions
Conceptualization: WW and HZ, methodology: WW and HZ, data analysis and modelling: WW, FJ, HW, and ZL, writing-original draft: FJ, HZ, and WW, writing-review and editing: WW, HZ, and YX. All authors contributed to the article and approved the submitted version.
Funding
This work was financially supported by a Scientific Research Project of the China Three Gorges Corporation (202103399), and Talent Program of China Institute of Water Resources and Hydropower Research (WE0199A052021), National Natural Science Foundation of China (52209083, 51809286).
Conflict of interest
HZ and ZL were employed by China Three Gorges Corporation.
The remaining authors declare that the research was conducted in the absence of any commercial or financial relationships that could be construed as a potential conflict of interest.
Publisher’s note
All claims expressed in this article are solely those of the authors and do not necessarily represent those of their affiliated organizations, or those of the publisher, the editors and the reviewers. Any product that may be evaluated in this article, or claim that may be made by its manufacturer, is not guaranteed or endorsed by the publisher.
References
Afzal, M. S., Holmedal, L. E., and Myrhaug, D. (2021). Sediment transport in combined wave–current seabed boundary layers due to streaming. J. Hydraulic Eng. 147 (4), 04021007. doi:10.1061/(asce)hy.1943-7900.0001862
Bornette, G., and Puijalon, S. (2011). Response of aquatic plants to abiotic factors: A review. Aquat. Sci. 73, 1–14. doi:10.1007/s00027-010-0162-7
Carollo, F. G., Ferro, V., and Termini, D. (2002). Flow velocity measurements in vegetated channels. J. Hydraulic Eng. 128 (7), 664–673. doi:10.1061/(asce)0733-9429(2002)128:7(664)
Caroppi, G., and Järvelä, J. (2022). Shear layer over floodplain vegetation with a view on bending and streamlining effects. Environ. Fluid Mech. 22, 587–618.
Chembolu, V., Kakati, R., and Dutta, S. (2019). A laboratory study of flow characteristics in natural heterogeneous vegetation patches under submerged conditions. Adv. Water Resour. 133, 103418. doi:10.1016/j.advwatres.2019.103418
Cheng, N. S., and Nguyen, H. T. (2011). Hydraulic radius for evaluating resistance induced by simulated emergent vegetation in open-channel flows. J. hydraulic Eng. 137 (9), 995–1004. doi:10.1061/(asce)hy.1943-7900.0000377
Cheng, N. S., Nguyen, H. T., Tan, S. K., and Shao, S. (2012). Scaling of velocity profiles for depth-limited open channel flows over simulated rigid vegetation. J. Hydraulic Eng. 138 (8), 673–683. doi:10.1061/(asce)hy.1943-7900.0000562
Ei-Hakim, O., and Salama, M. M. (1992). Velocity distribution inside and above branched flexible roughness. J. Irrigation Drainage Eng. 118 (6), 914–927. doi:10.1061/(asce)0733-9437(1992)118:6(914)
Erduran, K. S., and Kutija, V. (2003). Quasi-three- dimensional numerical model for flow through flexible, rigid, submerged and non-submerged vegetation. J. Hydroinformatics 5, 189–202. doi:10.2166/hydro.2003.0015
Fathi-Maghadam, M. N Kouwen. Nonrigid nonsubmerged Vegetative roughness on floodplains.Jounral Hydraulic Eng., 1997,1 23(1):51–57.
Fischer- Antze, T., Stoesser, T., Bates, P., and Olsen, N. (2001). 3D numerical modelling of open-channel flow with submerged vegetation. J. Hydraulic Res. 39 (3), 303–310. doi:10.1080/00221680109499833
Ghisalberti, M., and Nepf, H. M. (2002). Mixing layers and coherent structures in vegetated aquatic flows. J. Geophys. Res. 107 (C2), 3011. doi:10.1029/2001jc000871
Ghisalberti, M., and Nepf, H. M. (2004). The limited growth of vegetated shear layers. Water Resour. Res. 40, W07502. doi:10.1029/2003wr002776
Ghisalberti, M., and Nepf, H. M. (2006). The structure of the shear layer in flows over rigid and flexible canopies. Environ. Fluid Mech. 6, 277–301. doi:10.1007/s10652-006-0002-4
Ho, C. M., and Huerre, P. (1984). Perturbed free shear layers. Annu. Rev. Fluid Mech. 16, 365–422. doi:10.1146/annurev.fl.16.010184.002053
Hopkinson, L., and Wynn, T. (2009). Vegetation impacts on near bank flow[J]. Ecohydrology: Ecosystems, land and water process interactions. Ecohydrogeomorphology 2 (4), 404–418. doi:10.1002/eco.87
Huai, W. X., Shi, H. R., Song, S. W., and Ni, S. (2018). A simplified method for estimating the longitudinal dispersion coefficient in ecological channels with vegetation. Ecol. Indic. 92, 91–98. doi:10.1016/j.ecolind.2017.05.015
Huai, W. X., Li, S., Katul, G. G., Liu, M. y., and Yang, Z. h. (2021). Flow dynamics and sediment transport in vegetated rivers: A review. J. Hydrodynamics 33 (3), 400–420. doi:10.1007/s42241-021-0043-7
Huai, W. X., Yang, L., Wang, W. J., Guo, Y. K., Wang, T., and Cheng, Y. G. (2019a). Predicting the vertical low suspended sediment concentration in vegetated flow using a random displacement model. J. Hydrology 578, 124101. doi:10.1016/j.jhydrol.2019.124101
Huai, W. X., Zeng, Y. H., Xu, Z. G., and Yang, Z. (2009). Three-layer model for vertical velocity distribution in open channel flow with submerged rigid vegetation. Adv. Water Resour. 32, 487–492. doi:10.1016/j.advwatres.2008.11.014
Huai, W. X., Zhang, J., Katul, G. G., Cheng, Y. g., Tang, X., and Wang, W. j. (2019b). The structure of turbulent flow through submerged flexible vegetation. J. Hydrodynamics 31 (2), 274–292. doi:10.1007/s42241-019-0023-3
Jiang, W., Zeng, L., Fu, X., and Wu, Z. (2022). Analytical solutions for reactive shear dispersion with boundary adsorption and desorption. J. Fluid Mech. 947, A37. doi:10.1017/jfm.2022.656
Katul, G. G., Mahrt, L., Poggi, D., and Sanz, C. (2004). One- and two-equation models for canopy turbulence. Boundary- Layer. Meteorol. 113, 81–109. doi:10.1023/b:boun.0000037333.48760.e5
Katul, G. G., Poggi, D., and Ridolfi, L. (2011). A flow resistance model for assessing the impact of vegetation on flood routing mechanics. Water Resour. Res. 47 (8), W08533. doi:10.1029/2010wr010278
Kemp, J. L., Harper, D. M., and Crosa, G. A. (2000). The habitat-scale ecohydraulics of rivers. Ecol. Eng. 16, 17–29. doi:10.1016/s0925-8574(00)00073-2
Konings, A. G., Katul, G. G., and Thompson, S. E. (2012). A phenomenological model for the flow resistance over submerged vegetation. Water Resour. Res. 48 (2), W02522. doi:10.1029/2011wr011000
Li, G., Gong, Z., Jiang, W., Zhan, J., Wang, B., Fu, X., et al. (2023). Environmental transport of gyrotactic microorganisms in an open-channel flow. Water Resour. Res. 59, e2022WR033229. doi:10.1029/2022WR033229
Li, Y., Xie, L., and Su, T. C. (2020). Profile of suspended sediment concentration in submerged vegetated shallow water flow. Water Resour. Res. 56 (4), e2019WR025551. doi:10.1029/2019wr025551
Lu, J., and Dai, H. C. (2016). Large eddy simulation of flow and mass exchange in an embayment with or without vegetation. Appl. Math. Model. 40 (17-18), 7751–7767. doi:10.1016/j.apm.2016.03.026
Luhar, M., Rominger, J., and Nepf, H. M. (2008). Interaction between flow, transport and vegetation spatial structure. Environ. Fluid Mech. 8, 423–439. doi:10.1007/s10652-008-9080-9
Nepf, H. M. (2012). Flow and transport in regions with aquatic vegetation. Annu. Rev. Fluid Mech. 44, 123–142. doi:10.1146/annurev-fluid-120710-101048
Nepf, H. M., and Ghisalberti, M. (2008). Flow and transport in channels with submerged vegetation. Acta Geophys. 56 (3), 753–777. doi:10.2478/s11600-008-0017-y
Nepf, H. M., and Vivoni, E. R. (2000). Flow structure in depth-limited, vegetated flow. J. Geophys. Res. 105 (C12), 28547–28557. doi:10.1029/2000jc900145
Nezu, I., and Sanjou, M. (2008). Turburence structure and coherent motion in vegetated canopy open-channel flows. J. Hydro-environment Res. 2, 62–90. doi:10.1016/j.jher.2008.05.003
Nikora, N., Nikora, V., and O’Donoghue, T. (2013). Velocity profiles in vegetated open-channel flows: Combined effects of multiple mechanisms. J. Hydraulic Eng. 139, 1021–1032. doi:10.1061/(asce)hy.1943-7900.0000779
Poggi, D., Krug, C., and Katul, G. G. (2009). Hydraulic resistance of submerged rigid vegetation derived from first-order closure models. Water Resour. Res. 45, W10442. doi:10.1029/2008wr007373
Poggi, D., Porporato, A., Ridolfi, L., Albertson, J. D., and Katul, G. G. (2004). The effect of vegetation density on canopy sub-layer turbulence. Boundary-Layer Meteorol. 111, 565–587. doi:10.1023/b:boun.0000016576.05621.73
Pourshahbaz, H., Abbasi, S., Pandey, M., Pu, J. H., Taghvaei, P., and Tofangdar, N. (2022). Morphology and hydrodynamics numerical simulation around groynes. ISH J. Hydraulic Eng. 28 (1), 53–61. doi:10.1080/09715010.2020.1830000
Pu, J. H., Pandey, M., and Hanmaiahgari, P. R. (2020). Analytical modelling of sidewall turbulence effect on streamwise velocity profile using 2D approach: A comparison of rectangular and trapezoidal open channel flows. J. Hydro-Environment Res. 32, 17–25. doi:10.1016/j.jher.2020.06.002
Rominger, J. T., Lightbody, A. F., and Nepf, H. M. (2010). Effects of added vegetation on sand bar stability and stream hydrodynamics. J. Hydraulic Eng. 136 (12), 994–1002. doi:10.1061/(asce)hy.1943-7900.0000215
Shan, Y. Q., Zhao, T., and Liu, C. (2020). Turbulence and bed-load transport in channels with randomly distributed emergent patches of model vegetation. Geophys. Res. Lett. 47 (12), e2020GL087055.
Shi, J. Z., Li, Y. H., Hughes, J. M. R., and Zhao, M. (2013). Hydrological characteristics of vegetated river flows: A laboratory flume study. Hydrological Sci. J. 58 (5), 1047–1058. doi:10.1080/02626667.2013.797580
Shucksmith, J. D., Boxall, J. B., and Guymer, I. (2010). Effects of emergent and submerged natural vegetation on longitudinal mixing in open channel flow. Water Resour. Res. 46 (4), W04504. doi:10.1029/2008wr007657
Stoesser, T., Salvador, G. P., Rodi, W., and Diplas, P. (2009). Large eddy simulation of turbulent flow through submerged vegetation. Transp. Porous Media 78 (3), 347–365. doi:10.1007/s11242-009-9371-8
Tinoco, R. O. (2020). Simplification bias: Lessons from laboratory and field experiments on flow through aquatic vegetation. Earth Surf. Process. Landforms 45 (1), 121–143. doi:10.1002/esp.4743
Tschisgale, S., Löhrer, B., Meller, R., and Fröhlich, J. (2021). Large eddy simulation of the fluid-structure interaction in an abstracted aquatic canopy consisting of flexible blades. J. Fluid Mech. 916 (A43), A43–A37. doi:10.1017/jfm.2020.858
Wang, W. J., Huai, W. X., Li, S. L., Wang, P., Wang, Y. F., and Zhang, J. (2019). Analytical solutions of velocity profile in flow through submerged vegetation with variable frontal width. J. Hydrology 578, 124088. doi:10.1016/j.jhydrol.2019.124088
Wang, W. J., Peng, W. Q., Huai, W. X., Katul, G., Liu, X. B., Dong, F., et al. (2018). Derivation of canopy resistance in turbulent flow from first- order closure models. Water 10, 1782. doi:10.3390/w10121782
Wilson, C. A. M. E., Stoesser, T., Bates, P. D., and Pinzen, A. B. (2003). Open channel flow through different forms of submerged flexible vegetation. J. Hydraulic Eng. 129, 847–853. doi:10.1061/(asce)0733-9429(2003)129:11(847)
Wu, H. L., Cheng, N. S., and Chiew, Y. M. (2021a). Bed-load transport in vegetated flows: Phenomena, parametrization, and prediction. Water Resour. Res. 57 (4), e2020WR028143. doi:10.1029/2020wr028143
Wu, H. L., Singh, A., Foufoula-Georgiou, E., Guala, M., Fu, X., and Wang, G. (2021b). A velocity-variation-based formulation for bedload particle hops in rivers. J. Fluid Mech. 912, A33. doi:10.1017/jfm.2020.1126
Yan, C., Nepf, H. M., Huang, W. X., and Cui, G. X. (2017). Large eddy simulation of flow and scalar transport in a vegetated channel. Environ. Fluid Mech. 17 (3), 497–519. doi:10.1007/s10652-016-9503-y
Zeng, C., and Li, C. W. (2014). Measurements and modeling of open-channel flows with finite semi-rigid vegetation patches. Environ. Fluid Mech. 14 (1), 113–134. doi:10.1007/s10652-013-9298-z
Zhang, J., Wang, W. J., Shi, H. R., Li, Z., Tang, X., and Xia, Z. H. (2021). An analytical two-layer model for velocity distribution in open-channel flows with submerged flexible canopies considering multiply fluids mechanics. J. Hydrology 603, 127102. doi:10.1016/j.jhydrol.2021.127102
Zhao, H. Q., Tang, H. W., Yan, J., Dai, H. C., and Liu, Z. W. (2021). Interactions between bedforms and open channel flows through submerged vegetation. Adv. Water Sci. 32 (2), 250–258. (In Chinese).
Zhao, H. Q., Tang, H. W., Yan, J., Liang, D. F., and Zheng, J. Y. (2020). Spectral shortcut in turbulence energy transfer in open channel flow over submerged vegetation. J. Hydro-environment Res. 33, 10–18. doi:10.1016/j.jher.2020.10.002
Zhao, H. Q., Yan, J., Yuan, S. Y., Liu, J. F., and Zheng, J. Y. (2019). Effects of submerged vegetation density on turbulent flow characteristics in an open channel. Water 11, 2154. doi:10.3390/w11102154
Zhao, T., and Nepf, H. (2021). Turbulence dictates bedload transport in vegetated channels without dependence on stem diameter and arrangement. Geophys. Res. Lett. 48, e2021GL095316. doi:10.1029/2021gl095316
Nomenclature
Keywords: numerical model, analytical model, vegetated flow, velocity profile, Manning’s coefficient
Citation: Zhao H, Wang W, Jia F, Wang H, Liu Z and Xu Y (2023) Numerical and analytical flow models in ecological channels with interaction of vegetation and freshwater. Front. Environ. Sci. 11:1098993. doi: 10.3389/fenvs.2023.1098993
Received: 06 January 2023; Accepted: 18 April 2023;
Published: 11 September 2023.
Edited by:
Jaan H. Pu, University of Bradford, United KingdomReviewed by:
Amir Ghaderi, Urmia University, IranManish Pandey, National Institute of Technology Warangal, India
Copyright © 2023 Zhao, Wang, Jia, Wang, Liu and Xu. This is an open-access article distributed under the terms of the Creative Commons Attribution License (CC BY). The use, distribution or reproduction in other forums is permitted, provided the original author(s) and the copyright owner(s) are credited and that the original publication in this journal is cited, in accordance with accepted academic practice. No use, distribution or reproduction is permitted which does not comply with these terms.
*Correspondence: Weijie Wang, d2p3YW5nQHdodS5lZHUuY24=
 Hanqing Zhao1,2
 Weijie Wang
 Huilin Wang
 Zhiwu Liu
 Yuxuan Xu