 Ashenafi Burka
 Birhanu Biazin3
95% of researchers rate our articles as excellent or good
Learn more about the work of our research integrity team to safeguard the quality of each article we publish.
Find out more
ORIGINAL RESEARCH article
Front. Environ. Sci. , 23 June 2023
Sec. Interdisciplinary Climate Studies
Volume 11 - 2023 | https://doi.org/10.3389/fenvs.2023.1098113
This article is part of the Research Topic Advances in Soil and Water Management for Dryland Areas View all 8 articles
Droughts have become more powerful and frequent, affecting more people for longer periods than any other natural disaster, particularly in eastern Africa. The unprecedented climate change has increased the severity, duration, and frequency of droughts. The objectives of this study were to evaluate performances of different drought indices for spatiotemporal drought characterization in the Bilate river watershed that represents part of the rift valley drylands in Ethiopia. Historical data for 39 years (1981–2019) from seven stations were used for drought analyses using the following indices: Standardized Precipitation Index (SPI), Standardized Precipitation Evapotranspiration Index (SPEI), Reconnaissance Drought Index (RDI), enhanced Reconnaissance Drought Index (eRDI) with different time scale and Self-Calibrated Palmer Drought Severity Index (scPDSI). Among them, SPI, SPEI, RDI and eRDI with 6-month and 9-month time scales were found to be the best correlated drought indices to characterize the historical drought events. Then, using the selected drought indices, temporal drought analysis showed occurrence of major drought events in the years: 1984/85, 1999/2000, 2002/3, and 2009. Some of these years are well known as famine years in some parts of Ethiopia including the study area. The results revealed spatial variation the severity of drought with extreme droughts occurred in the southern part of the Bilate watershed. Application of the theory of run confirmed that the maximum severity and duration of drought were observed at the Bilate Tena station that is located in the southern part of the watershed; the most severe being observed on a 9-month scale during 1984/85. Hossana and Wulbareg stations showed the highest frequency of drought over the study period. The Mann-Kendal trend test statistics showed an increasing trend of drought conditions in the study watershed.
Drought is a natural, periodic aspect of climate that occurs in almost all climates (Zarei et al., 2019; Ogunrinde et al., 2020). It is one of the most complicated natural hazards (Vangelis et al., 2013) affecting a wide range of industries and occurring frequently, making it difficult to find a single general description (Vangelis et al., 2013; Tigkas et al., 2017; Zarei et al., 2019). Droughts start slowly and spread over a large area, affecting an area for weeks, months, or even years (Jenkins and Warren, 2015). It starts with a lack of precipitation in terms of timing, distribution, and intensity, leading to water scarcity that affects the ability of natural ecosystem to function properly (Asadi Zarch et al., 2015). This natural process leads to crop failures in agricultural areas, destabilizing food systems and thereby threatening local and global food security (Lesk et al., 2016). Moreover, the consequences of this climate phenomenon on the economy, society, and environment are high, and the harms associated with it are increasing at an unexpected rate. . (Mahmoudi et al., 2019). Hence, at any given time, droughts significantly harm a wide range of economic sectors and populations (Mohammed and Yimam, 2021).
Droughts have been increased dramatically in quantity and intensity in recent decades (Tigkas et al., 2012). Drought is becoming more severe and frequent, affecting more people for longer periods than any other natural disaster (Tigkas et al., 2012). Moreover, as a result of global warming, the severity, duration, and frequency of these unavoidable events are predicted to increase (Guenang & Kamga, 2014). This is also supported by Qi et al. (2022), who reported that as the world warms, potential evapotranspiration rises practically everywhere on earth. As a result, droughts would increase in severity worldwide (Wang et al., 2021). Moreover, according to RCP8.5, drought frequency in currently arid areas will probably increase by the end of the 21st century (IPCC, 2014).
Drought indices are commonly used to characterize droughts (Tigkas et al., 2015; Tigkas et al., 2019) and to quantify the severity of droughts (Tefera et al., 2019; Yihdego et al., 2019). Various indicators based on different hydroclimatic elements such as precipitation, temperature, river flow, and others are used to calculate drought indices (Hao et al., 2016). Accordingly, numerous drought indices have been developed for characterization of meteorological, agricultural, and hydrological droughts (Jenkins and Warren, 2015) and used for monitoring in different locations (Asadi Zarch et al., 2015), such as the Standardized Precipitation Index (McKee et al., 1993; Ionita et al., 2016), Standardized Precipitation Evapotranspiration Index (Vicente-Serrano et al., 2010; Byakatonda, 2018), Reconnaissance Drought Index (Rahmat et al., 2015; Zarei et al., 2019), and Palmer Drought Severity Index (Bai et al., 2020; Ogunrinde et al., 2020).
Although none of the primary drought indices are necessarily better than others in all situations, some indices are better suited than others for specific purposes (Karavitis et al., 2011). Individual drought indices are not able to comprehensively assess drought conditions of a single terrestrial ecosystem (Yihdego et al., 2019); some are used for a wide range of applications, while others are designed to address drought-related challenges in specific systems, depending on their structure, characteristics, and ability to meet specific criteria (Tigkas et al., 2019). Hence, each drought index has unique shortcomings and advantages when calculating drought conditions (Yisehak and Zenebe, 2021). In most cases, it is required to take into account more than one index because no single one is acceptable in all circumstances (Morid et al., 2006). Consequently, determining an acceptable drought index for a given region is critical for preventing and mitigating drought-related crises (Bayissa et al., 2018).
Comparative evaluation has been a subject of many drought studies. For instance, Barua et al. (2011) evaluated performance of four drought indices against five decision criteria in the Yarra River basin in Victoria, Australia, and the results showed that the Aggregated Drought Index (ADI) was superior to the other indices for drought management strategies. Jain et al. (2015) evaluated six drought indices for their suitability in drought-prone districts of the Ken River basin of India and found that the Effective Drought Index (EDI) was the most suitable drought index for the study basin. Bayissa et al. (2018) examined six drought indices to evaluate their effectiveness in identifying past drought episodes in the Upper Blue Nile (UBN) basin in Ethiopia and concluded that none of the six drought indices could individually identify the onset of all historical drought events. Dogan et al. (2012) examined six drought indices for detecting droughts in a semi-arid, closed catchment in Konya, Turkey, and concluded that the Effective Drought Index (EDI) was better for long-term drought monitoring. Morid et al. (2006) evaluated performance of seven drought indices in Tehran Province, Iran, and it was found that EDI was more responsive to the onset of drought and performed better. On the other hand, Payab & Türker, (2019) concluded that the performances of eight drought indices in monitoring the impact of drought on agriculture and groundwater were substantially and significantly connected.
There were few studies carried out to characterize drought in the rift valley of Ethiopia (for example, Edossa et al., 2010; Moloro, 2018; Tesfamariam et al., 2019; Mohammed and Yimam, 2021; Nasir et al., 2021). However, none of them compared the performances of different drought indices in the area. This study compared five drought indices in conjunction with the application of the Theory of Run and trend analysis to evaluate the severity and frequency of drought over the last 4 decades in the Bilate River watershed in Rift Valley Lakes Basin (RVLB). It was hypothesized that there were differences in performances of the different indices and hence, the use of two or more indices may be recommended to more effectively characterize drought conditions in the Rift valley of Ethiopia. The objectives of the study were: 1) to compare different drought indices for further spatiotemporal drought characterization 2) to characterize droughts based on the Theory of Run, and 3) to evaluate the trends of drought in the study area.
The study was undertaken at the Bilate river watershed which is located in the south-western escarpment of the Main Ethiopian Rift Valley (Figure 1). Geographically, it is located between 60 32’40’’—8009’29’’ N and 37046’11’’—38018’43’’ E. The watershed covers about 5,324 Km2. The north and northeastern part of the watershed has steep slopes and the center and the south part has gentle slopes. Bilate river drains into lake Abaya with its tributaries. The altitude of the watershed ranges from 1,116 to 3,373 m above sea level.

FIGURE 1. Location map of the Bilate River Watershed.
The watershed has a bimodal rainfall characteristic with a short and main rainy season. The short rainy season, (locally known as Belg Season) extends from March to April and the main rainy season (locally known as Kiremt season) extends from July to September. The average annual rainfall ranges between 1,276.68 in the central and southwestern parts of the watershed to 1,068.79 mm in the southeastern part of BRW. The Kiremt season receives 477, 457 and 349 mm at the high, medium, and low elevation areas of the watershed, respectively. Similarly, the Belg season receives 375.88 mm, 426.04 mm, and 375.33 mm of rainfall at the high, mid, and low elevation areas of the watershed, respectively. Variability of rainfall is high in November and the Kiremt season (June to August) and low in January and autumn season. Hossana and Wulbareg stations had high precipitation variability compared to other stations (Table 1). In the summer season, the maximum and minimum average temperature is around 20°C and 12°C, respectively and it is almost uniform in the summer season for all stations. The maximum average temperature is observed in the winter season for all stations.
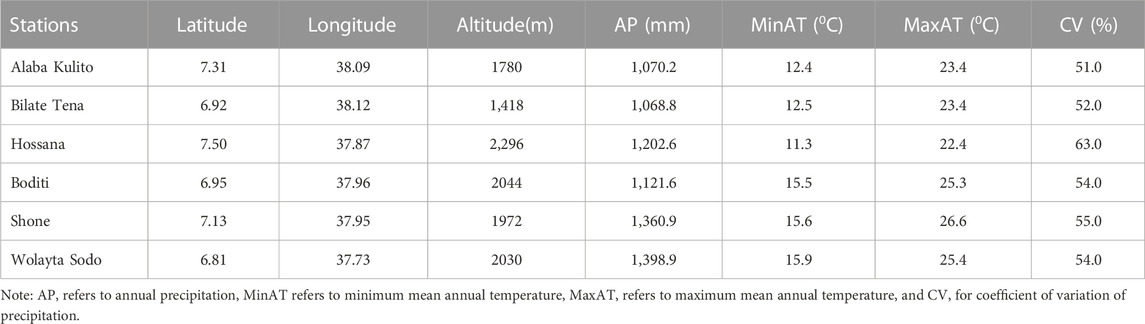
TABLE 1. Meteorological Stations used in Bilate river watershed (Record period: 1981–2019).
Historical climate data, including daily precipitation and daily minimum and maximum temperatures for the period from 1981 to 2019 were collected for seven stations from the National Meteorological Agency of Ethiopia. In the Bilate river watershed, seven stations were selected for this study whose data sets had less than 10% missing values. Quality control of the data was performed using the R software package RClimDex to identify outliers. The list of meteorological stations and their coordinates, annual precipitation (AP), minimum mean annual temperature (MinAT), maximum mean annual temperature (MaxAT), and coefficient of variation (CV) of precipitation used in this study are shown in Table 1.
Although there are several drought indices, there are no clear criteria to identify the most appropriate for a given spatio-temporal condition (Byakatonda, 2018). However, the World Meteorological Organization (WMO) recommends selecting an index based on data availability and simplicity of the index (Svoboda and Fuchs, 2016). Accordingly, SPI, SPEI, RDI, eRDI, and scPDSI were selected for this study. The descriptions of selected indices are presented below.
The SPI depends solely on precipitation and assesses how far precipitation has deviated from historically established norms during a given period (Asadi Zarch et al., 2015). The number of standard deviations of a normally distributed random variable that deviates from its long-term average is measured by the SPI (Guenang & Kamga, 2014). A statistical distribution is fitted to the time series, which is then translated into a normal distribution (Tigkas et al., 2019). The index thus calculates rainfall deficit by combining cumulative rainfall data series for multiple reference time scales (Guenang & Kamga, 2014). It is perhaps the most widely used drought index in the world because it requires only precipitation data (Tigkas et al., 2019). It can be used to characterize drought conditions relevant for meteorological, agricultural, and hydrological purposes (Guenang & Kamga, 2014; Tigkas et al., 2019). The main criticism of the SPI is that it is calculated based solely on rainfall data (Vicente-Serrano et al., 2010; Lee et al., 2017). It does not take into account other factors that may affect droughts, such as temperature, evapotranspiration, wind speed, and soil water storage capacity (Vicente-Serrano et al., 2010; Zhao et al., 2017). The SPI drought classification categories (McKee et al., 1993) are given in Table 2.
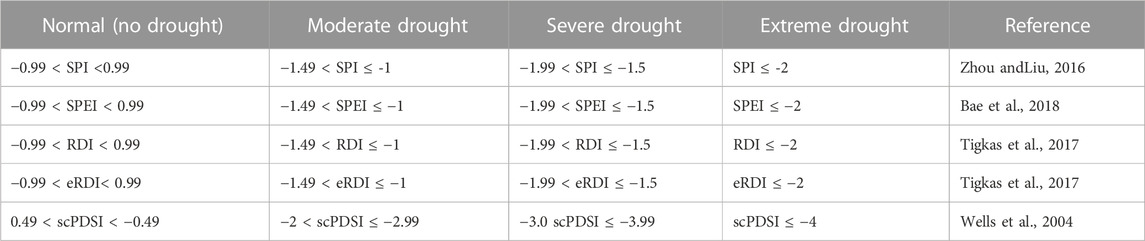
TABLE 2. Drought class description of selected drought Indices.
As precipitation is typically not normally distributed, the SPI overcomes this disadvantage by fitting to suitable distribution (gamma) then transforming into normal and further calculating in a way as presented from Eq. 1.1.9.–.1.1.9.
According to a probability density function, the Gamma distribution is (Thom, 1958):
where α and β are the shape and scale parameters. The larger the shape parameter value is, the closer to normal distribution curve the density curve is. xi (>0) is the precipitation within i consecutive months, namely, i-time scales (Zhou and Liu, 2016):
where Xjk is the precipitation value of kth month of jth year. N is the number of years. For 1-month time scale, i = 1.
The Gamma function Γ(α) is given as:
The alpha and beta parameters of the gamma probability density function are approximately estimated as:
Where
Based on the probability density function (Eq. 1.1), the cumulative probability g xi) at the selected time scale is given as follows:
The probability of no precipitation can be written as (Zhou and Liu, 2016):
where m denotes the number of zero precipitation in the calculated data sequence. In the case of zero precipitation, the cumulative probability can be expressed as:
Finally, as cited by (Zhou and Liu, 2016), H xi) can be transformed to SPI using the following equations by Milton and Stegun (1965).
where c0 = 2.515517, c1 = 0.802853, c2 = 0.010328, d1 = 1.432788, d2 = 0.189269, and d3 = 0.001308.
The monthly difference between precipitation (X) and potential evapotranspiration (PET) is used by SPEI (Vicente-Serrano et al., 2010). Because it can be applied at different time scales, it can be used to analyze both short-term and long-term droughts (Bae et al., 2018; Hui-Mean et al., 2018; Lee et al., 2017; Vicente-Serrano et al., 2010). By normalizing the difference between potential evapotranspiration and precipitation, SPEI describes the degree of deviation of dry and wet conditions from climatological average conditions (Zhao et al., 2017; Vicente-Serrano et al., 2010). The SPEI, which adds the evapotranspiration variables to the SPI and accounts for the Palmer Drought Severity Index (PDSI) property that evapotranspiration is temperature dependent; Vicente-Serrano et al., 2010). It can therefore be compared to the PDSI, which is self-calibrated (scPDSI) (Vicente-Serrano et al., 2010) and regularly used for drought assessments (Zhao et al., 2017).
According to Vicente-Serrano et al. (2010) SPEI is simple to calculate, and is based on the original SPI calculation procedure which is uses the monthly difference between precipitation and PET. With a value for PET, the difference between P and PET for the month i is calculated:
where W =
SPI and SPEI could be calculated using the SPEI package of R statistical software (Vicente-Serrano et al., 2010) and the description is given in Table 2.
The Reconnaissance Drought Index (RDI) is one of the most important indexes for determining the severity of drought (Zarei, et al., 2019) and this measure takes into account both cumulative precipitation (P) and potential evapotranspiration (PET) (Rahmat et al., 2015; Abubakar et al., 2020). It is based on the precipitation-to-potential evapotranspiration ratio (Vangelis et al., 2013; Zarei et al., 2019). RDI is fitted to a gamma distribution that is comparable to that of SPI (Rahmat et al., 2015). The RDI standard is calculated using a technique similar to the one used to calculate the SPI (Rahmat et al., 2015). PET, in addition to precipitation, is a key variable in RDI’s drought severity assessment as a result of rising greenhouse gas concentrations (Asadi Zarch, et al., 2015).
In RDI, drought characterization and monitoring can be done in three ways: the initial value RDI (k), the normalized RDI (nor), and the standardized RDI (std) (Vangelis et al., 2013; Abubakar et al., 2020) and it can be calculated using the following equations (Tigkas et al., 2017).
The initial form of the index (α) within a year for a reference period of k months is calculated as:
The second form is a normalized expression of the index (RDIn), calculated by the following equation: in which ak is the long-term average of a k:
Assuming that the values of ak follow the log-normal distribution, the standardized form of the index (RDIst) is calculated using the following formula (Abubakar et al., 2020):
In which yk is equal to the lnak, while ȳk is its average and
The enhanced Reconnaissance Drought Index created by Tigkas et al. (2016) is one of the newest indices for determining the severity of droughts, with a focus on agricultural droughts (Zarei et al., 2019). For RDI adjustment, the use of effective precipitation rather than total precipitation is advocated, and this method is predicted to improve the index’s applicability for assessing drought effects on agricultural systems, particularly for rainfed farming system (Tigkas, et al., 2016). Effective precipitation replaces precipitation in the upgraded RDI index (Tigkas et al., 2016; Zarei et al., 2019) It improves the index’s performance in agricultural drought analysis (Zarei et al., 2019). When compared to total precipitation, effective precipitation more accurately indicates the amount of water that can be utilized productively by crops (Tigkas, et al., 2017). The eRDI was estimated using the ratio of effective precipitation to potential evapotranspiration (Zarei, et al., 2019). The main modification aspect in the proposed eRDI, is the substitution of the total precipitation by the Pe and the index (αe) is calculated as (Tigkas et al., 2017):
in which Pej is the monthly effective precipitation of the jth month. The input parameter for RDI and eRDI is rainfall and temperature. RDI and eRDI could be calculated using DrinC software (Tigkas et al., 2015) and the description of the indices given in Table 2. The effective precipitation was calculated using U.S.B.R (Unites State Bureau of Reclamation) method since which is mainly proposed for arid and semi-arid region (Tigkas et al., 2016).
The Palmer Drought Severity Index is based on a soil water balance and has been widely used in the past (Vangelis et al., 2013; Zhong et al., 2019). The original PDSI has significant flaws, including a large effect of the calibration period, usage limitations, and geographic comparability issues (Sousa et al., 2011; Hui-Mean et al., 2018). This weakness is somewhat addressed by the Palmer self-calibrating system (Zhong et al., 2019). To calibrate the PDSI, the predefined coefficient is substituted with local conditions in scPDSI. Hence, at different sites, the updated scPDSI performed more consistently and allowed for more accurate drought determinations than the original PDSI (Wells, et al., 2004). As a result, the scPDSI which is spatially comparable and captures extreme dry and wet episodes under unusual conditions has improved this drought indicator (Wells, et al., 2004). The scPDSI suggests that temperature may play a key role in explaining drought conditions as a result of global warming (Vicente-Serrano et al., 2010). There is a series of computations in scPDSI which is indicated from Eqs. 7.1.6.–..7.7.6.
According to Ogunrinde et al. (2020) four soil moisture-related variables and their potential covariates are computed for each month of the study period. Recharge (R), runoff (RO), potential recharge (PRe), potential evapotranspiration (PET), loss (L), potential runoff (PRu), and potential loss (PL) are the variables. The Thornthwaite PET method was used to compute PET. The only factor used to estimate these variables is the soil’s AWC, or available water holding capacity. Four potential values are selected based on the local climate using the weighting factors using α, β, γ and δ and to represent the exiting climatic circumstances. The weighting factors, commonly known as the water-balance coefficients, can be calculated as follows:
The existing climatic conditions potential values are combined to form the existing climatic conditions precipitation, X, which represents the amount of precipitation needed to maintain a normal soil moisture level for a period, e.g., a month.
where X stands for the amount of precipitation needed to maintain a normal soil moisture level for a particular month under consideration.
where X is the actual rainfall that was actually recorded for the month being considered, x is the amount of rainfall needed to stabilize the soil moisture in a normal condition for a month under the current climatic conditions, and d indicates moisture departure.
In order to allow for a strong link between the scPDSI values from a spatiotemporal perspective, Palmer (1965) equation was utilized to complement the d value in accordance with the local climate.
The result of multiplying the moisture departure, d, by K (empirical constant) is called the moisture anomaly index, or the Z index, and is denoted by Z, shown as
Without taking current precipitation trends into account, the Z index is used to describe how dry or wet a month was and the equation is also used to predict the PDSI value for a given month (Ogunrinde et al., 2020):
Where Y is the current value of the index. For example, to calculate the current value of Yi, 0.897 times the previous PDSI value Yi-1 is added to one-third of the current moisture anomaly Zi (Wells et al., 2004).
The sole difference between the PDSI and the scPDSI is that the empirical constants (K) and duration factors (0.897 and 1/3) are replaced with values derived automatically based on the research site’s historical climate data (Ogunrinde et al., 2020).
scPDSI package of R statistical software (Palmer W., 1965; Wells et al., 2004) can be used for the calculation of scPDSI. The input variable for scPDSI is rainfall, temperature, and available water content of soils. Information on the water-holding capacity of soils can be used, however, defaults are also available and a serially complete record of temperature and precipitation data is required (Svoboda and Fuchs, 2016). In this study, only precipitation and temperature were used for the analysis of scPDSI due to the unavailability of available water content of soils (available water content of soil was considered as 100% for all station). The description of scPDSI is given in Table 2.
The potential evapotranspiration (PET) was calculated using Hargraves method in the case of SPI, SPEI, RDI and eRDI, using the minimum and maximum temperature of the stations, while PET was calculated using Thornthwaite method using average temperature of the station in the case of scPDSI.
Each drought index was calculated first, then Pearson’s correlation analysis was conducted for comparison of indices for the five drought indices of seven meteorological stations. The analysis was conducted using a corrplot package of R software and 3,6,9, and 12 months’ time scales were selected. Furthermore, the drought indices that were analyzed by correlation analysis were tested with Kappa statistics. Inverse distance weighting (IDW) was used to visualize the spatial patterns of the drought occurrences in the watershed.
Most of the literature presented reports high correlations between drought indices does not always mean that the indices are similar (Vergni et al., 2021). Hence, the comparison of all potential pairs of indices in terms of the severity category assigned to each time series and subsequent quantification of their degree of agreement using the Cohen’s Kappa test allowed for a more accurate and creative evaluation of the similarity between the indices. (Vergni et al., 2021).
Cohen (1960) introduced the proportion of agreement corrected for chance as a coefficient of agreement for nominal or ordinal scales, and this form of evaluation can be successfully attained by the Cohen’s Kappa test (Vergni et al., 2021). The calculated outcomes range from −1 to 1, where one represents complete agreement while 0 denotes exactly what would be predicted by chance, and negative values denote agreement less than chance (Ezzine et al., 2014).
When there are either two assessment techniques with a single trial or one assessment method with two trials, Cohen’s Kappa is used to measure the degree of agreement, while Fleiss’s Kappa is an extension of Cohen’s Kappa for three or more measurements. Hence, based on these assumptions Fleiss’ kappa statistics was found suitable for this study and used to test the degree of agreement among SPI, SPEI, RDI and eRDI as drought assessment tools.
Because Kappa statistics works well with ordinal or nominal data, the continuous values of each drought assessment value (i.e., SPI, SPEI, RDI and eRDI) were transformed to ordinal data (drought classification in Table 2 i.e., class of extreme drought lebeled as 1, severe drought as 2, moderate drought as 3, etc). Then, the transformed data of each index were then used to calculate the degrees of agreement using Fleiss’ kappa statistics. Then, the calculation of Fleiss’ kappa statistics was caried of using irr package of R statistical software.
The formula for Cohen’s Kappa statistics is given as (Cohen, 1960):
where po is the total observed frequency of agreement and pe is the proportion of agreement expected by chance.
Yevjevich (1967) statistical theory of runs (ToR) is a useful tool for addressing drought features (Samantaray et al., 2019; Jasim & Awchi, 2020). This approach was developed to identify drought duration and severity based on values below a predetermined threshold level, as well as a method to calculate drought variables including duration, severity, and intensity (Lee et al., 2017; Maeng et al., 2017). Although ToR is not a drought indicator, it can be used in combination with others to identify drought parameters, and a drought event is defined as a time series that is less than the crucial threshold level for some time (Rahmat, et al., 2015). The theory of run is simple to use and can be used to analyze hydrometeorological time series (Kwak et al., 2016) to differentiate drought as a feature (Huang et al., 2014). The ToR is applied to a predetermined threshold, which is the point where moisture and dryness meet (Jasim and Awchi, 2020). A run, according to ToR, is a segment of a drought variable’s time series in which each value is either above or below the prescribed truncation level (Huang et al., 2014; Jasim & Awchi, 2020). Drought characteristics include a feature like duration, severity, and intensity of the drought (Bae et al., 2018). A cumulative shortfall of a drought metric below the threshold level indicates drought severity (Lee et al., 2017). The beginning and termination times of a drought, which define the duration of the drought, are critical parameters to quantify (Panu and Sharma, 2002). Hence, Drought severity is the sum of all negative values below the threshold value, drought duration is the time between the onset and termination of the drought events and intensity is the ratio of severity and duration. Therefore, drought severity, duration, intensity, and station-based frequency can be calculated with the following formulas:
Where D is drought duration, t1 and t2 are the onset and termination time of drought, S is the severity of drought, I represent the intensity of drought, F is the station-based frequency of drought, N is the number of drought events and T is the total number of years of the study period.
The Mann-Kendall (MK) approach is frequently used to determine the monotonic trends of various hydro-meteorological data (Gumus et al., 2021). The MK test is a non-parametric (distribution-free) test used to determine whether a variable of interest has a monotonic upward or downward trend over time (Khosravi et al., 2018). Mann (1945) and Kendall (1948) suggested this approach for determining statistically significant trends in hydro-meteorological data (Gumus et al., 2021). The Z value is used to determine a statistically significant trend and an upward or downward trend is indicated by a positive or negative value (Gumus et al., 2021).
In the MK test statistic, the S test statistic, the sign function, the variance of S, and the Z statistics are calculated using the formulas indicated in Eqs. 13–16 (Gumus et al., 2021):
where n is the number of d
where ti is the number of ties of extent i and m is the number of tied groups. For n larger than 10, the standard test statistic Z is computed as the MK test statistic as follows
The presence of a statistically significant trend is evaluated using the Z value. Positive values of Z indicate increasing trends, while negative values show decreasing trends. In the test for either an increase or decrease monotonic trend (a two-tailed test) at the α level of significance, H0 should be rejected if the |Z| > Z1- α/2, where Z1- α/2 is obtained from the standard normal cumulative distribution tables. For instance, at the 5% significance level, the null hypothesis was rejected if |Z|>1.96. A higher severity of the Z value indicates that the trend is more statistically significant. MK trend test was used at a significance level of 0.05 for this study.
The correlations of the drought indices were made separately for all stations. The stations with the lowest elevation at Bilate Tena and the highest elevation at Hossana are presented in Figure 2. The drought indices were highly correlated to each other for a similar time scale. For instance, SPI3, SPI6, and SPI9 were well correlated with most of the other drought indices. Similarly, SPEI3, SPEI6, and SPEI9 showed a very high correlation with a similar time scale of other drought indices (SPI, RDI, and eRDI). The correlation becomes higher on the short-time scale, particularly on the 3-month and 6-month time scales. On the other hand, scPDSI showed a strong correlation (r = 0.80) with SPI3, SPI6, SPEI3, and SPEI6. Similarly, scPDSI showed a strong correlation with RDI3 (r = 0.79) and RDI6 (r = 0.78), but showed a medium correlation (r = 0.73) with eRDI3 and eRDI6 compared to other drought indices. This indicates that scPDSI correlated better with SPI, SPEI, and RDI at the time scale of 3-month and 6-month time scale. The correlation of scPDSI decreases with the increasing time scale of drought indices. In this analysis SPI3 with SPEI3, SPI6 with SPEI6, and SPEI12 with RDI12 had a very strong correlation (r = 0.99) at Bilate Tena station. The index eRDI also showed a high correlation with a similar time scale to other drought indices. Hence, the SPI, SPEI, and RDI were highly correlated for a similar time scale indicating that they can be used interchangeably.
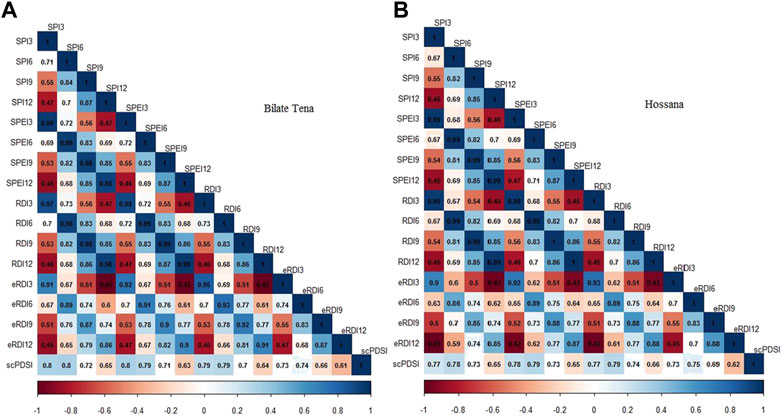
FIGURE 2. Pearson correlation matrix: (A) Bilate Tena Station (B) Hossana station (The number next to the drought index indicates the time scale. i.e., SPI3 indicates the SPI at a 3-month scale and so on). At p < 0.05, all correlation is statistically significant.
At the Hossana station, a similar time scale of the different drought indices showed a very high correlation (Figure 2B). SPI3 with SPEI3, SPI6 with SPEI6, SPI9 with SPEI9, SPI12 with SPEI12, SPEI3 with RDI3, and SPEI6 with RDI6 showed a very strong correlation (r = 0.99). The scPDSI showed a strong correlation with SPI3 (r = 0.77), SPI6r = 0.78), SPEI3 (r = 0.78), SPEI6 (r = 0.79), RDI3 (r = 0.77), and RDI6 (r = 0.79). The study revealed that scPDSI showed a better correlation with SPEI6 and RDI6 compared to other drought indices. Similar to what was shown at Bilate Tena station, the correlation of the scPDSI at Hossana station declined as the time scale of the drought indices increased.
The average correlation values of the drought indices were calculated using the results of the correlation analysis for all stations. The average correlation of all time scales showed that the average correlation value of 0.63 for SPI3 is the paired correlation of SPI3 with SPI6, SPI9, SPI12, SPEI3, SPEI6, SPEI9, SPEI12, RDI3, RDI6, RDI9, RDI12, eRDI3, eRDI6, eRDI9, eRDI12, and scPDSI (Supplementary Figure S2). A similar analysis of all time scales of the other drought indices for all stations showed that the maximum average correlation was observed at the 6-month and 9-month scales. This indicates that the best time scales for identifying historical drought events were the 6-month and 9-month time scales in BRW. Hence, all drought indices with 6-month and 9-month scales better explained the historical drought characterization in BRW. The average correlation of the scPDSI with other drought indices. The average correlation of the scPDSI was higher at the 3-month and 6-month time scales, indicating that the scPDSI better characterizes short-term and medium-term droughts.
The Fleiss’ Kappa Statistics result showed substantial degrees of agreement (0.61–0.80) among SPI, SPEI, RDI, and eRDI in 3-month, 6-month, and 9-month time scales, as well as in 12-month scale a moderate degree of agreement (0.61–0.80) which statistically significant at p < 0.05 at the Bilate station (Table 3). Hossana station also showed comparable outcomes (Table 3). The degree of agreement at the 6-month and 9-month time scales, however, was the closest to each as were observed in correlation analysis, therefore it was chosen for further characterization of historical drought at Bilate river watershed.
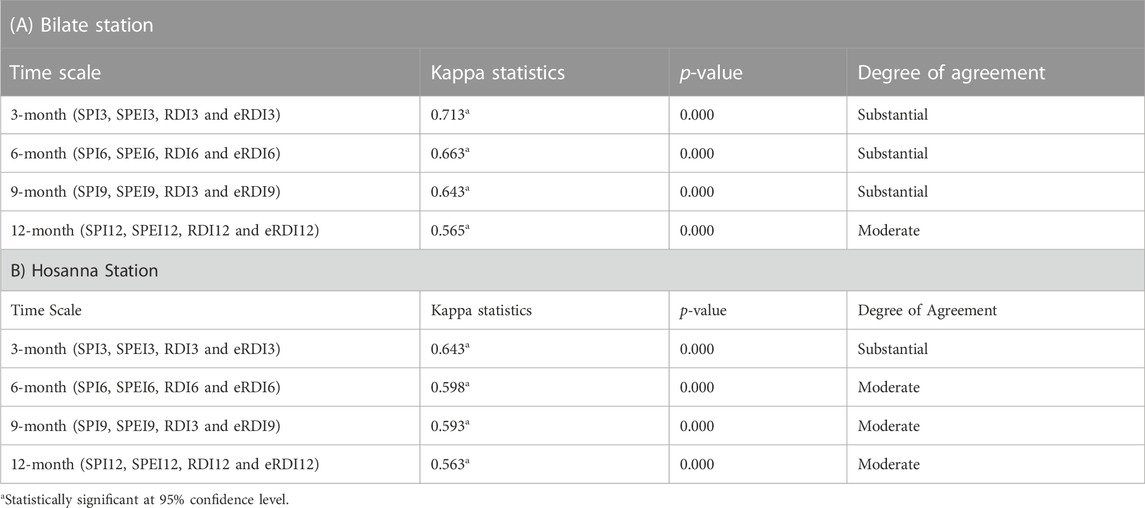
TABLE 3. Fleiss’ kappa test statistics for the degree of agreement among SPI, SPEI, RDI and eRDI at Bilate River Watershed.
The time series (1981–2019) of the drought indices were analyzed for all the stations. However, only the results for Bilate Tena and Hossana stations were selected and shown here in Figure 3 and Figure 4. These two stations were considered as representatives of the lowland and highland parts of the watershed. The temporal analysis of drought indicated that almost all of the drought indices were capable of identifying the major historic drought years such as 1984/85, 2000, 2002, and 2009 (Figures 3, 4 and Table 3; Table 4). Based on the selected drought indices with time scale of 6-month and 9-month, the major drought events identified occurred in 1984/85, 2000, 2002, and 2009 at Bilate Tena and Hossana stations (Figures 3, 4 and Table 3; Table 4). The historical drought years detailed drought severity, duration, intensity, onset, and termination of the events were indicated in Table 3; Table 4. A similar pattern of historical major drought events were detected on the other stations as well (Supplementary Figure S1).
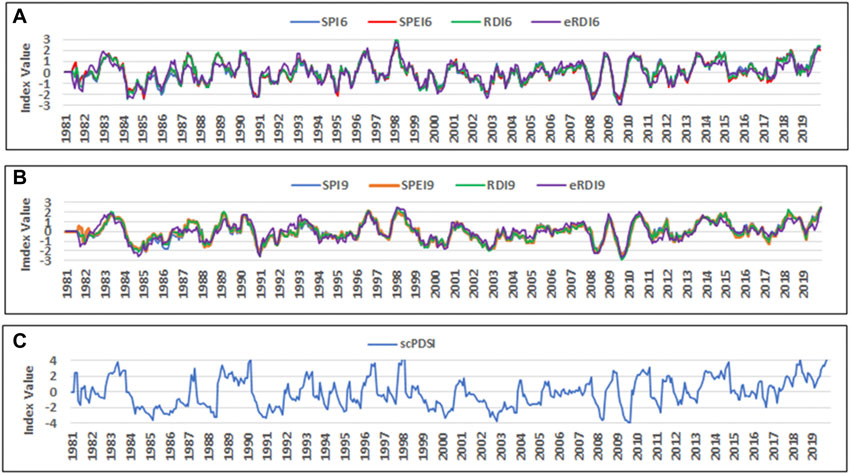
FIGURE 3. Time series drought events with different time scales at Bilate Tena station: (A) 6 months, (B) 9 months, and (C) scPDSI.
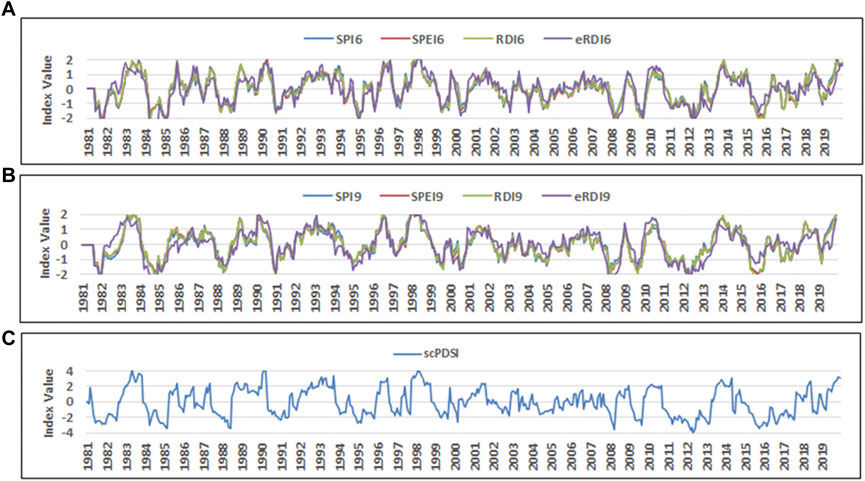
FIGURE 4. Time series drought events with different time scales at Hossana station: (A) 6 months, (B) 9 months, and (C) scPDSI.
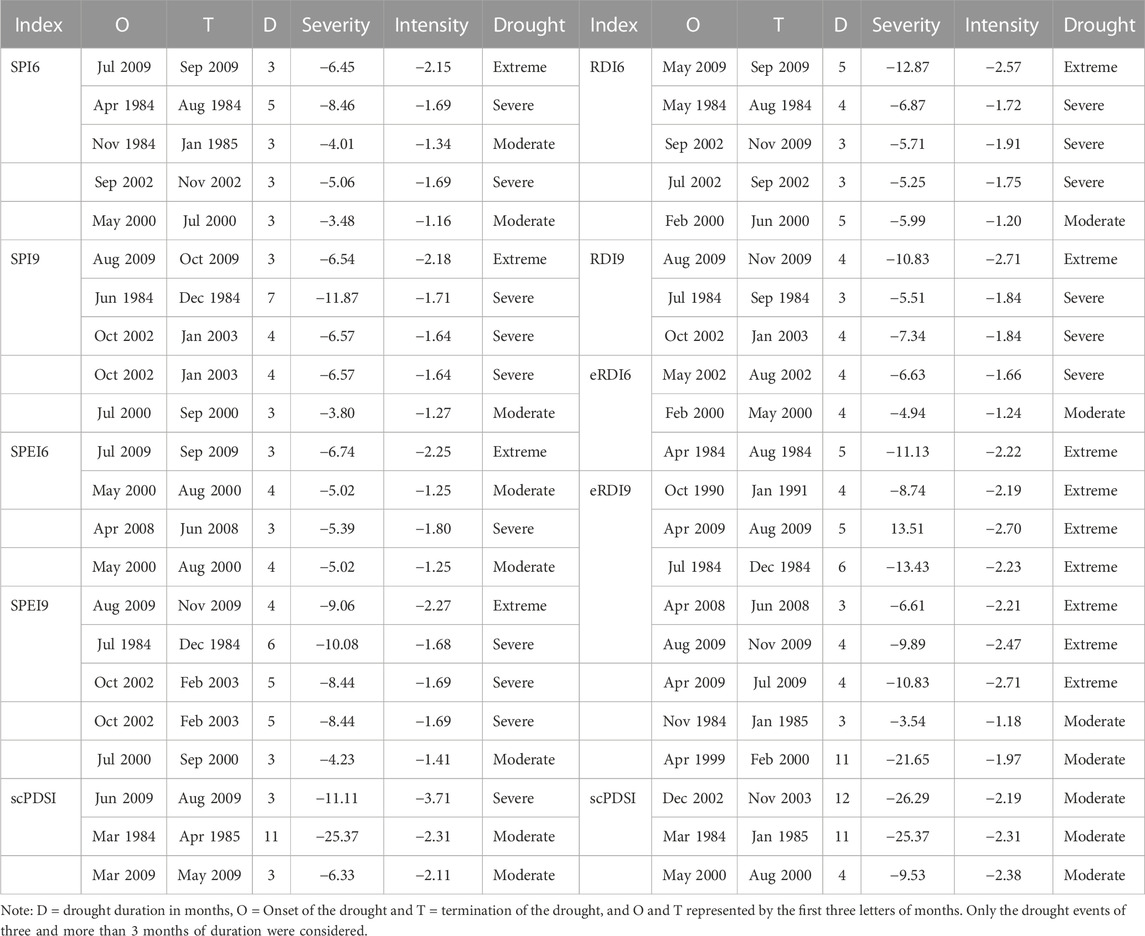
TABLE 4. Major Drought events analyzed using the Theory of run application at Bilate Tena Station during 1981–2019.
At Bilate station, the SPI6 values of extreme drought ranges from −2.46 in 1985 to −2.14 in 2009. The value of maximum severe drought occurred with the values of −1.93 in 1984 and minimum value was −1.52 in 2009. The value of moderate drought ranges from −1.17 in 1984 to −1.05 in 2012. Similarly, the SPEI6 values of extreme drought ranges from −2.36 in 1985 and to −2.25 in 2009. The value of maximum Severe drought was −1.78 in 1984 and the minimum value was −1.50 in 2009. The moderate drought maximum value was −1.48 in 1984 and minimum value of −1.07 in 1984. The RDI6 extreme drought ranges from −2.46 in 1984 to −2.88 in 2009, the maximum severe drought was −1.66 in 1984 and minimum was −1.90 in 2009. The moderate drought showed the maximum value of −1.46 in 2012 and the minimum was −1.00 in 1981. The eRDI extreme drought ranges from −2.38 in 1984 to −3.25 in 2009. eRDI6 showed the highest peak value compared to others drought index (Figure 3A). These drought range records confirmed that the year 1984–2009 were the most intense drought affected years in the watershed. Similar observation was detected in the 9-month time scale of all drought indices.
At Hossana station, the SPI6 showed the extreme drought with a peak value of −2.27 in 1985, a severe drought with peak value of −1.87 in 2015, a moderate drought with a peak value of −1.34 in 1984. Similarly, SPEI6 showed extreme drought with a peak value of −2.15 in 1985, a severe drought with a peak vale of −1.81 in 2009, and moderate drought with the peak value of −1.36 in 1984. RDI6 also showed the extreme drought with the peak value of −2.81 in 1984, severe drought with a peak value of −1.93 in 2009, and a moderate drought with a peak value of −1.34 in 2000. eRDI6 showed extreme drought with a peak value of −2.77 in 1984, severe drought with a peak value of −1.98 in 1984, and moderate drought with a peak value of −1.14 in 2015. Similar pattern of drought identified with the 9-month time scale of all drought indices. Hence, the year 1984, 2009 and 2015 were the most drought affected year at Hossana station (Figure 4A). Similar observation was detected in the 9-month time scale of all drought indices.
The percentage of drought frequency that take into account all stations was assessed using a total of 273 events (39 years of study period × 7 stations). At Bilate station, in the case of SPI6, the results indicate that high extreme drought occurred in 1980 s and 2000 s (0.73%). In the case of SPEI6, high percentage of extreme drought occurred in the 2000 s (1.47%). Whereas in the case of RDI6 and eRDI6 high percentage of drought frequency occurred in 2000 s with the value of 2.20% and 2.56%, respectively indicating that the 2000 s were the extreme drought years throughout the study period (Figure 5A). Severe drought showed high percentage of drought frequency in 1980 s with values of 3.66% of SPI6, 2.93% of RDI6, and 2.56% of eRDI6, but 3.30% of SPEI6 in 1990 s. The severe drought occurrence outweighs in 1980 s than in 1990 s indicating that the 1980 s were the more severe drought affected years. Moderate drought showed high percentage of drought frequency in 1980 s with values of 5.13% of SPI6, 5.86% of SPEI6, 5.13% of RDI6, but 4.76% of eRDI6 in 1990 s. The moderate drought occurrence outweighs in 1980 than in 1990 s indicating that the 1980 s were the more drought affected years. Regarding the pattern of the 4 decades of study period, it can be noted that severe drought pronounced in the 1980 s and 2000 s whereas moderate drought pronounced in the 1980 s and 1990 s. All the drought indices, accounts a total severe drought frequency percentage 11.36% and 18.68% in 1980 s. Thus, 1980 s, 1990 s and 2000 s were drought prone decades specifically in terms of sever and moderate droughts whereas the last decade was less drought affected (Figure 5A). Similar pattern was observed in the 9-month time scale of all drought indices (Figure 5B).
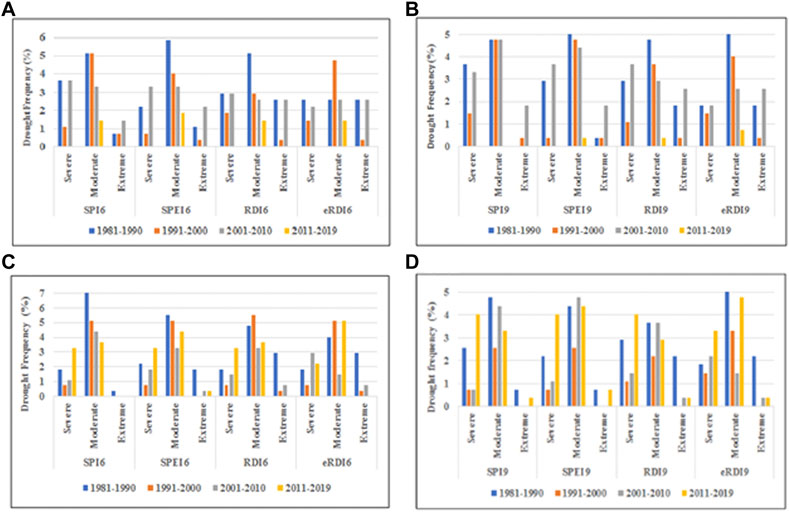
FIGURE 5. Frequencies of drought (number of stations multiplied by years in %) during 1981–2019 at Bilate and Hossana stations: (A) Bilate station in 6-month scale (B) Bilate station in 9-month scale (C) Hossana station in 6-month scale and (D) Hossana station in 9-month scale.
At Hossana Station, in the case of SPI6, the results indicate that high extreme drought occurred in 1980 s (0.73%). In the case of SPEI6, high percentage of extreme drought occurred in the 1980 s (0.37%). Whereas in the case of RDI6 and eRDI6 high percentage of drought frequency occurred in 1980 s with the value of 1.83% and 2.93%, respectively indicating that the 1980 s were the extreme drought years throughout the study period (Figure 5C). Severe drought showed high percentage of drought frequency in 2010 s with values of 3.30% of SPI6, SPEI6 and RDI6, and 2.20% of eRDI6. Moderate drought showed high percentage of drought frequency in 1980 s with values of 7.69% of SPI6 in 1980 s, and 5.49 of SPEI6, and 5.13% of RDI6 in 1990 s. The moderate drought occurrence outweighs in 1980 s and 1990 s indicating that the 1980 s were the more drought affected years (Figure 5C). Regarding the pattern of the 4 decades of study period, it can be noted that extreme drought pronounced in the 1980 s whereas moderate drought pronounced in the 1980 s and 1990 s. All the drought indices, accounts a total extreme, severe and moderate drought frequency percentage 34.81% in 1980 s indicating the most drought affected decade of the study period. Similar pattern was observed in the 9-month time scale of all drought indices (Figure 5D).
Generally, 1980 s, 1990 s and 2000 s were drought prone decades specifically in terms of sever and moderate droughts whereas the last decade was less drought affected. Similar pattern was observed in the 9-month time scale of all drought indices.
The interpolated values of the highest drought severity at each station were used to produce the spatial map of drought events. In 1984, extreme drought was observed in the central and southern parts of BRW using SPI, SPEI, and scPDSI with small variations (Figure 6). However, the SPI indicates that the northern part of the watershed also experiences extreme drought exceptionally due to the higher drought severity recorded at Hossana station in 1984 (Figure 6). In 2009, extreme drought was observed in the central and southern parts of the watershed in all drought indices (Figure 6). Likewise, severe drought is also distributed at the central and southern parts of the watershed using SPEI and scPDSI (Figure 6). In 2009, SPEI and scPDSI showed similar patterns in indicating the distribution of historical drought events. Generally, the interpolated value of the drought maximum severity record at the seven stations indicated that the central and southern parts of the watershed experienced extreme and severe drought.
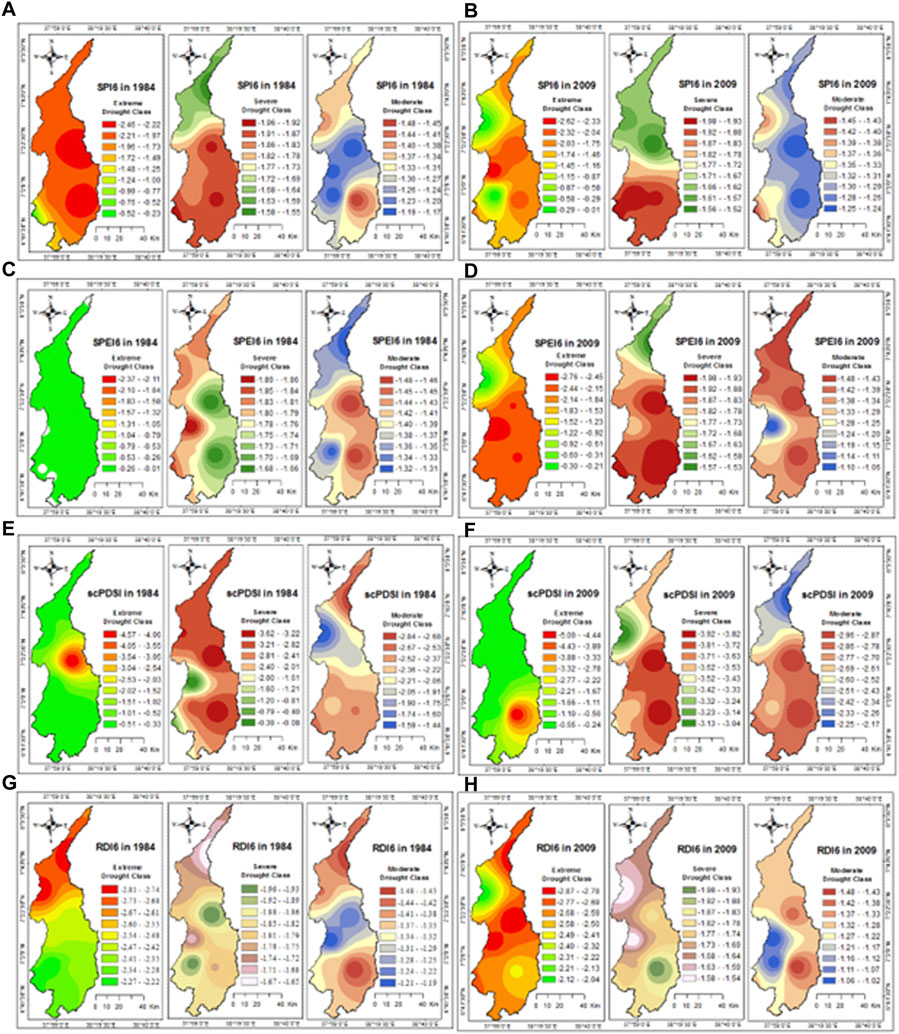
FIGURE 6. Spatial distribution of Extreme, Severe and Moderate droughts (A) SPI6 in 1984 (B) SPI6 in 2009 (C) SPEI6 in 1984 (D) SPEI6 in 2009 (E) scPDSI in 1984 (F) scPDSI in 2009 (G) RDI6 in 1984 and (H) RDI6 in 2009.
The interpolated values of the highest drought severity at each station were used to produce the spatial map of drought events. In 1984, extreme drought was observed in the central and southern parts of BRW using SPI, SPEI, and scPDSI with small variations. Particularly at the central (Alaba station) and the south eastern (Bilate station) part of the watershed showed high extreme value that ranges from −2.46 to −2.22 (Figure 6A). However, the SPI indicates that the northern part of the watershed experiences extreme with the value of −2.21 to −1.97 exceptionally due to the higher drought severity value displayed at Hossana station in 1984. Severe drought also highly distributed in the central part of the watershed with the value of −1.96 to −1.92, southern and small part of the western (Wolayta Sodo station) parts of the watershed in 1984. Similarly, the moderated drought showed the highest distribution in the central part of the watershed with the value of −1.48 to −1.45 in 1984 (Figure 6A). In 2009, extreme drought was observed in the central and southern parts of the watershed in all drought indices in general. Particularly, intense extreme drought was distributed with the values that ranges from −2.6.2 to −2.33 at the western edge of central part of the watershed in 2009 (Figure 6B). The value of SPI6 extreme drought was higher in 2009 than the value of SPI6 in 1984. Severe drought also distributed in the south western part of the watershed with the value that ranges from −1.98 to −1.93 which was higher value compared to the SPI6 value of 1984 (Figure 6B). The distribution of moderate drought showed at the north western and south western part of the watershed with the highest value that ranges from −1.45 to −1.43 in 2009. Hence, the spatial drought distribution showed a shift from the central and southern parts in 1984 to the western edge of the watershed in 2009 with the drought index of SPI6.
SPEI6 in 1984 showed the highest extreme drought distribution at the central, north western and southern part of the watershed with value that ranges from −2.37 to −2.11 in 1984 (Figure 6C). Severe drought showed its distribution at the western part of the watershed with value that ranges from −1.89 to −1.86 in 1984. The moderate drought also distributed at the central and southern part of the watershed with the value that ranges from −1.48 to −1.46 in 1984 (Figure 6C). In 2009, SPEI6 showed the highest extreme drought distribution in the central part of the watershed with the value that ranges −2.76 to −2.45 which was highest to the value of 1984. Severe drought also distributed with high value that ranges from −1.98 to −1.93 at the central and southern part of the watershed. Moderate drought in 2009 was also highly distributed at the northern, north western, central southern part of the watershed with the value that ranges from −1.48 to −1.43 in 2009 (Figure 6D). The distribution of extreme drought shifts from central and southern part of the watershed in 1984 to the western part in 2009 with the drought index of SPEI6. The severe drought also shifts from western part in 1984 to eastern part in 2009. However, the moderate drought did not show a spatial shift from 1984 to 2009. Similar pattern of drought class distribution was observed with the time scale 9-month.
Even though the interpolation was only based on a small number of data (seven stations), it nevertheless depicts the overall pattern of drought in the watershed. Drought spatial distribution for various classes (extreme, severe and moderate drought) and year (1984 and 2009) showed a spatial pattern variation. However, the central and southern portions of the watershed experienced intense (extreme and severe) droughts during the study period, according to the spatial drought distribution map for all drought classes (extreme, severe, and moderate) and timescales (6-month and 9-month).
At the Bilate Tena station, the highest drought was observed from the SPI9, SPEI9, RDI6, and scPDSI indices (Table 4 Figure 6). SPI9 showed a value of −11.87 from June 1984 to December 1984 with a duration of 7 months. Similarly, SPEI9 showed a value of −10.08 from July 1984 to December 1984 with a duration of 6 months, RDI6 showed a severity of −12.87 from May 2009 to September 2009 with a duration of 5 months and eRDI9 showed a severity of −13.43 from July 1984 to December 1984 with a duration of 6 months, the scPDSI index showed a value of −26.29 from 12, 2002 to 11, 2003 with a duration of 12 months. Therefore, SPI detected the drought early compared to SPEI. The longest duration of drought ranged from 3 to 5 months and 3–7 months for the 6-month and 9-month time scales, respectively. The average duration was 4 and 5 months for the 6-month and 9-month time scales, respectively. The maximum drought intensity was −2.29 with SPEI9, -2.57 with RDI6, and −3.71 with scPDSI.
At Hossana station (Table 5; Table 6), the maximum drought severity with SPI9 was −15.70 from July 2015 to March 2016, with a duration of 9 months. SPEI9 was −15.50 from July 2015 to March 2016 with a duration of 9 months, and scPDSI was −29.64 from December 2010 to January 2012, with a duration of 14 months eRDI6 showed a maximum severity of −11.81 from April 1984 to August 1984 with a duration of 5 months and eRDI9 showed a severity of −14.20 from July 1984 to December 1984 with a duration of 6 months. The longest duration of drought ranged from 4 to 6 months and 3–6 months for the 6-month and 9-month time scales, respectively. The average duration was 4 and 3 months for the 6-month and 9-month time scales, respectively. The maximum drought intensity was −2.08 with RDI9, −2.36 with RDI6, and −2.37 with eRDI9.

TABLE 5. Major Drought events analyzed using Theory of run application at Hossana Station from 1981 to 2019.
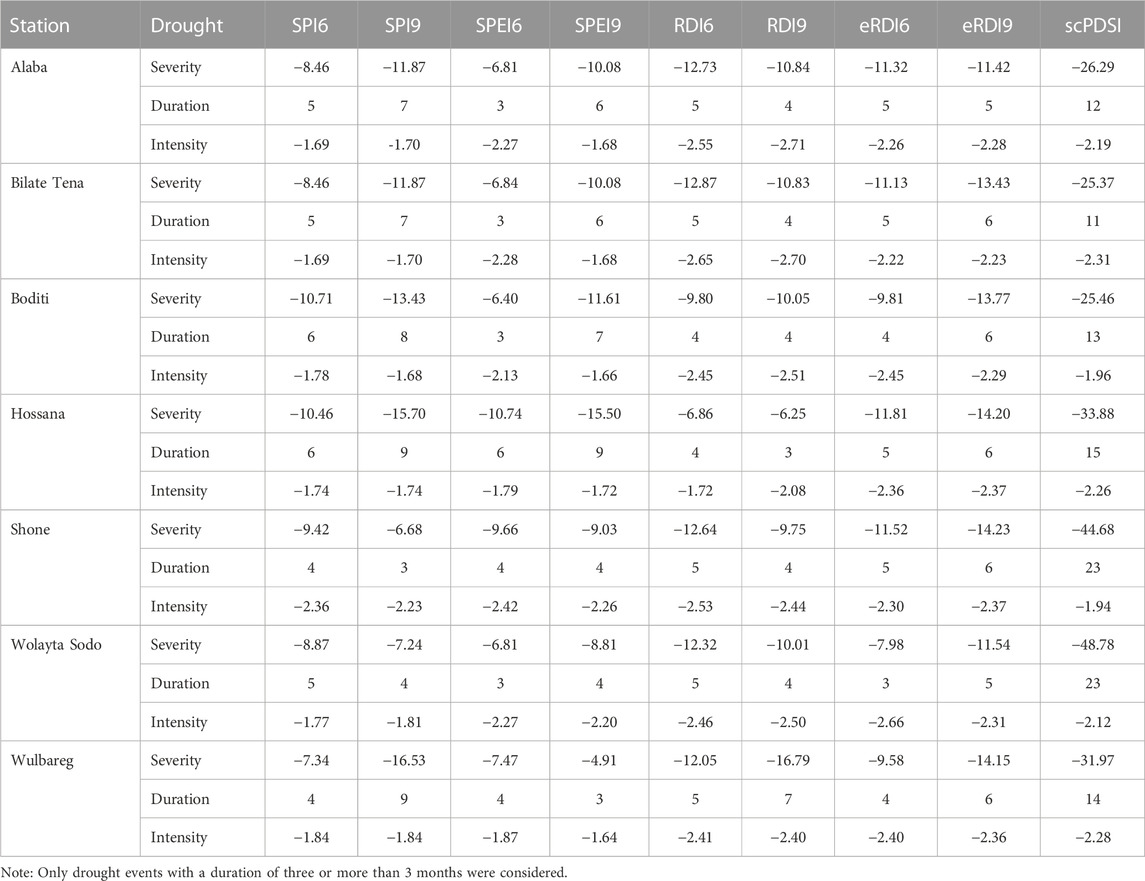
TABLE 6. Maximum drought Severity, Duration (months), and Intensity at each station in the Bilate River watershed from 1981 to 2019.
At Bilate Tena stations, the maximum severity and duration of drought were observed on the time scale of 9 months, especially in 1984/5 (Tables 4–6). The maximum drought severity with SPI6 was shown at Boditi station with a duration of 6 months while the maximum intensity was shown at Shone station (Table 6). SPI9 showed the highest drought severity at Wulbareg station for 9 months. SPEI6 and SPEI9 showed the highest drought severity at Hossana station with values of −10.74 and −15.50, respectively. scPDSI showed the highest drought severity at Wolayta Sodo station with a duration of 23 months. For all drought indices, the highest drought severity was observed at Hossana and Wulbareg stations, while the highest intensity was recorded at Shone station. The longest drought duration was observed from SPI9 and SPEI9 indices with duration ranging from 3 to 9 months at Bilate Tena station. Maximum drought severity was observed at all stations with a duration of 9 months except at Shone and Wolayta Sodo stations. The most intense drought was observed for all drought indices in all stations mostly at a time scale of 9 months. Among all stations, Hossana and Wulbareg showed highest drought severity, particularly on a 9-month scale which was also characterized by a high CV of precipitation (Table 1). The maximum value of drought characteristics identified for all stations with the Theory of run application is shown in Table 6.
In SPI6 index, the maximum number of droughts were observed at Hossana and Wulbareg stations with a value of 93 and 88, respectively (Table 7). In the SPI9 index, showed a maximum number of droughts were at Boditi and Wulbareg stations with the value of 88 and 86 drought events, respectively. SPEI6 showed the highest number of drought events at Hossana and Wulbareg stations with a value of 93 and 89, respectively. SPEI9 showed the highest number of drought events at Hossana and Wulbareg stations with a value of 85 and 83, respectively. Similarly, RDI and eRDI showed the highest number of drought events at Hossana and Wulbareg stations on both time scales. Thus, most drought events were recorded at Wulbareg, Hossana, and Boditi stations compared to the other stations. scPDSI showed the highest number of drought events at Boditi station with a value of 197.
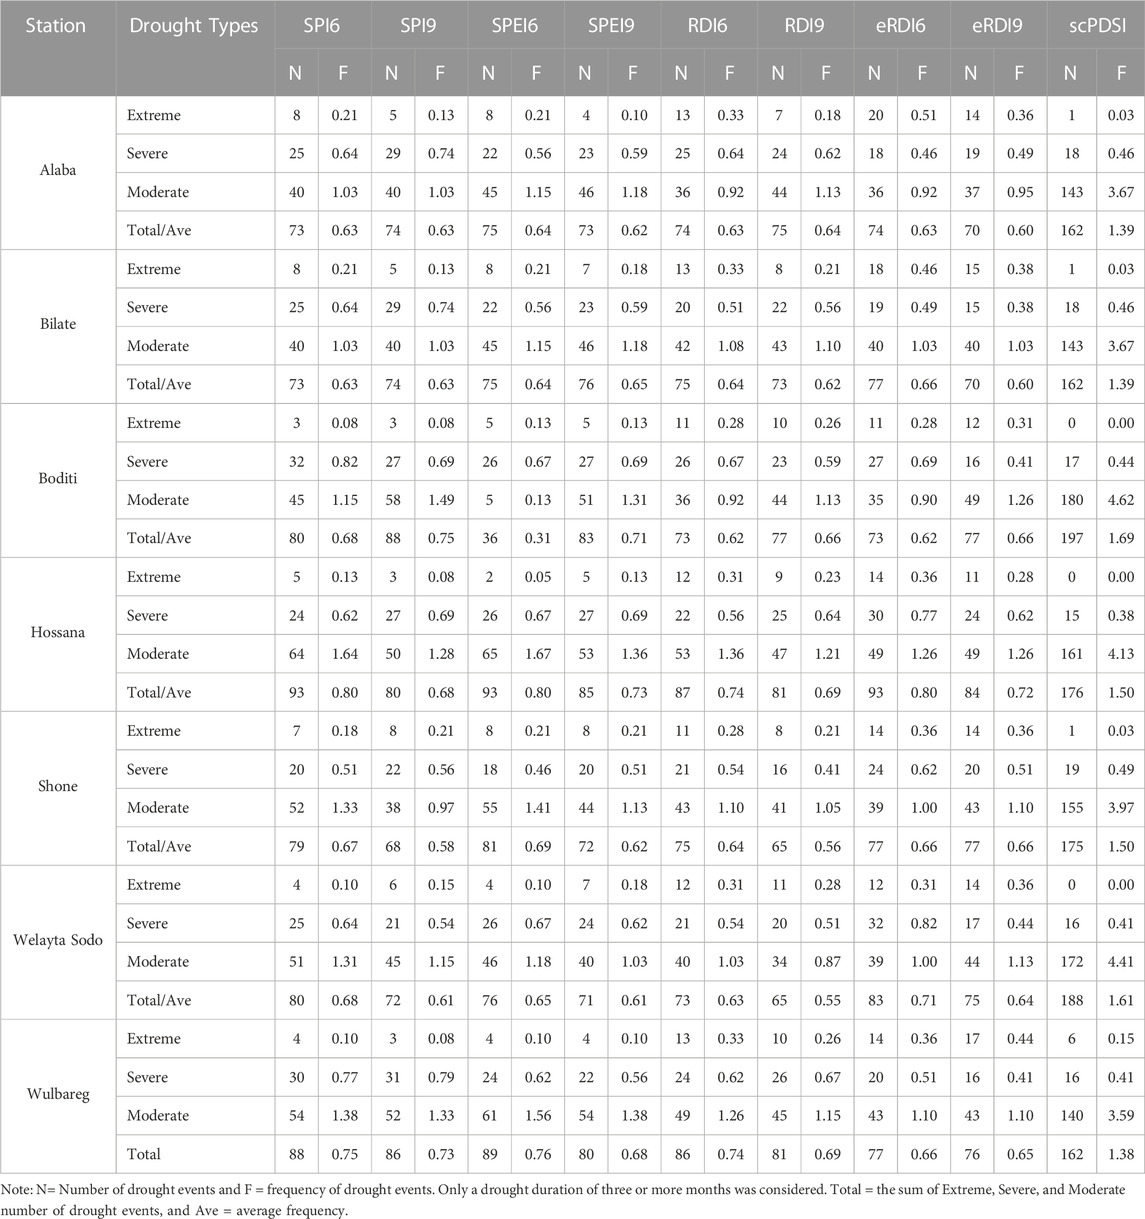
TABLE 7. Total number and frequency of Extreme, Severe, and Moderate drought events at each station from 1981 to 2019.
The minimum and a maximum number of drought events on a time scale of 6 months varied from 73–93 for SPI6 with an average value of 81, 36–93 for SPEI6 with an average value of 75, 73–87 for RDI6 with an average value of 78, and 73–93 for eRDI6 with an average value of 79 (Table 7). Thus, a higher number of historical drought events were identified at a 6-month time scale than at a 9-month time scale. At a 6-month time scale, SPI6, RDI6, and eRDI6 had a higher average number of drought events with a value of 81, 78, and 79, respectively.
Drought frequency was calculated using all drought indices with 6-month and 9-month time scales (Table 7). At Hassanal station, the maximum average frequency of drought on a 6-month time scale with drought indices SPI6, SPEI6, and eRDI6 was 80%. At Wulbareg station, the frequency of drought was 75% for SPI6, 73% for SPI9, 76% for SPEI6, 74% for RDI6, and 69% for RDI9. With SPEI6 and RDI6, Alaba and Bilate Tena stations had a comparable drought frequency of 64%. In Boditi and Wolayta Sodo stations, the drought frequency was 75% with SPI6 and 71% with eRDI6. Consequently, the maximum drought frequency calculated with a 6-month scale was higher than the 9-month scale of drought indices. However, Hossana and Wulbareg stations had the highest percentage of drought frequency on both time scales, indicating that these stations experienced the most frequent drought.
The SPI, SPEI, RDI, eRDI, and scPDSI values derived over 6-month and 9-month time scales were subjected to MK trend analysis. The results (Table 8) revealed that utilizing all drought indices, on all stations except Hossana and Wulbareg showed a statistically significant positive trend from 1981 to 2019, indicating an increasing trend of drought conditions. Therefore, drought conditions at BRW showed mostly an increasing trend from 1981 to 2019.
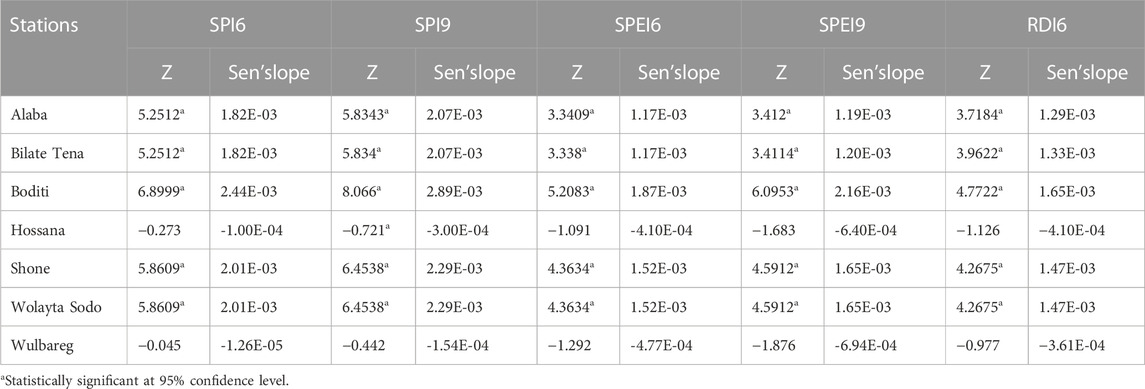
TABLE 8. Menn-Kendel trend test statistics for all stations using selected drought indices (SPI6, SPI9, SPEI6, SPEI9 and RDI6).
The correlation analysis revealed that similar time scales showed a high correlation value of 0.99 in all stations. This result is exactly similar with the research output of Rascón et al. (2021) that showed a correlation coefficient of 0.98 and 0.99 between SPI and SPEI at the same temporal scale. This result also agrees with those obtained by Stojanovic et al. (2018) who determined a correlation value of 0.96 between the SPI and the SPEI at a 1-month scale when assessing droughts in central Europe.
Furthermore, the findings of correlation analysis showed that similar time scales of SPI, SPEI, RDI, and eRDI showed the highest correlation indicating that these indices could be used alternatively, which is similar to the research finding of Jain et al. (2015) and Wable et al. (2019). The correlation of the scPDSI decreased as the time scale of the drought indices increased, indicating that the scPDSI was well suited to detect short-term and medium-term droughts. In addition, the average correlation analysis showed that the 6-month and 9-month time scales were highly correlated and therefore selected to be used for further characterization of drought events in BRW. In the temporal drought analysis, significant drought events were detected in 1984/5, 2000, 2002, and 2009 in BRW. Thus, most of the drought indices were able to identify the historical drought years of 1984/5, 2000, 2002, and 2009, which is consistent with the major historical drought events documented in Ethiopia (Degefu & Bewket, 2015; Suryabhagavan, 2017; Mera, 2018; Mohammed and Yimam, 2021). Drought conditions were prevalent throughout all of Ethiopia in a few years, primarily 1984 and 2009 (Viste et al., 2013).
In Bilate Tena station, the highest drought severity observed with SPI6 and SPI9 were −8.46 and −11.87, respectively in 1984 with a drought class of severe. Likewise, the highest drought severity observed with SPEI6 and SPEI9 were −6.74 and −10.08, respectively in 1984 and 2009 with a drought class of severe. The highest drought severity observed with RDI6 and RDI9 were −12.87 and −10.83, respectively in 2009 with a drought class of extreme. Similarly, scPDSI showed a severity of −25.37 in 1984 with a drought class of moderate. This indicate that the strongest drought was observe in the years 1984 and 2009 (Table 4). Similarly, in Hossana station the highest drought severity observed with SPI6 and SPI9 were −10.46 and -15.70 in 2015 and 2016, respectively with a drought class of severe. The highest drought severity observed with SPEI6 and SPEI9 were −6.87 and −15.50 in 2009 and 2016, respectively with a drought class of severe and moderate. The highest drought severity observed with RDI6 and RDI9 were −6.86 and −6.25 in 2009 and 2015, respectively with a drought class of severe and extreme. Similarly, scPDSI showed a severity of −29.64 in 2012 with a drought class of moderate. This indicate that the strongest drought was observe in the years 1984 and 2009 (Table 5). In general, on applying the theory of run, almost all drought indices, the highest drought was observed at Hossana and Wulbareg stations, which had the highest precipitation variability (Table 1). In addition, Hossana and Wulbareg stations had the highest percentage of drought frequency at both time scales, indicating that they were the stations with the most recurrent drought in the BRW.
Although the spatial distribution of drought events was analyzed using interpolation of only seven-point data that represent meteorological stations, the results were coarse and may not show the real spatial distribution of historical droughts in BRW. This is due to the fact that there was insufficient meteorological data and its accuracy cannot always be guaranteed (Arekhi, et al., 2020). Instead, the spatial distribution of historical drought could be more accurately depicted by the interpolation of gridded meteorological data or through the appropriate analysis of satellite images. The use of satellite imagery is particularly advantageous since it provides timely, accessible, extensive coverage, and continuous data (Orhan et al., 2014; Tran et al., 2017; Wang et al., 2018).
The MK trend analysis showed that almost all drought indices were significantly and positively increasing. However, Hossana and Wulbareg showed a decreasing trend of drought which is not statistically significant. Overall, the Bilate watershed showed an increasing trend of drought throughout the study period and this finding was similar to the findings of previous research in Bilate watershed and in the Rift valley lake basin (Mohammed and Yimam, 2021; Haile et al., 2022).
The correlation analysis revealed three distinct patterns on almost all stations. First, all drought indices were highly correlated with similar time scales. Second, all drought indices were strongly associated with scPDSI at 3-month and 6-month time scales. Third, as the time scale increases, the correlation of the scPDSI with other drought indices decreases. As a result, the scPDSI can only detect drought events in a short and medium period.
To analyze the performance of drought indices and select the best-correlated one, an average correlation analysis of all drought indices was calculated. The result was that the 6-month and 9-month time scales had the highest average correlation, indicating that they were the best indices compared to other time scales. Thus, to identify and describe droughts in terms of duration, severity, intensity, and frequency, the theory of run was applied using 6-month and 9-month time scales for all drought variables. The most significant drought events identified at the Bilate Tena and Hossana stations based on the selected 6-month and 9-month drought index time scales occurred in 1984/85, 2000, 2002, and 2009. At the other stations, a similar trend was mostly observed for major drought episodes. The greatest severity and longest duration of the drought were observed at Alaba and Bilate Tena stations for 9 months, especially in 1984/5. With a severity of −48.78 and a duration of 23 months, the scPDSI at Wolayta Sodo station indicated the greatest drought. The greatest drought severity was observed at Wulbareg station, while the maximum intensity for all drought indices was observed at Shone stations. At Hossana station, a maximum average frequency of 80% was observed on a 6-month time scale with drought indices of SPI6, SPEI6, and eRDI6. Moreover, Hossana and Wulbareg stations had the highest percentage of drought frequency in both periods, indicating that they suffered from recurrent drought during 1981–2019. The results of the MK trend test statistics also showed an increasing trend in drought conditions at all stations except Hossana and Wulbareg. Most drought indices also showed an increasing trend at all stations except Hossana and Wulbareg. This study used sparse and interpolated point data from a few meteorological stations to depict the spatial distribution of drought. Therefore, additional research utilizing geospatial data was recommended in order to comprehend the actual spatial distribution of historical drought in the watershed.
The raw data supporting the conclusion of this article will be made available by the authors, without undue reservation.
Data collection, analysis and writing of the manuscript was done by AB, BB, and WB reviewed and edited the manuscript. All authors contributed to the article and approved the submitted version.
The authors are very grateful to Ethiopian National Meteorological Agency for providing the meteorological data for this study. We appreciate the reviewers' time and work spent reading the manuscript, and we thank them for it. We really appreciate all of your insightful comments and suggestions, which helped us improve the standard of the manuscript.
The authors declare that the research was conducted in the absence of any commercial or financial relationships that could be construed as a potential conflict of interest.
All claims expressed in this article are solely those of the authors and do not necessarily represent those of their affiliated organizations, or those of the publisher, the editors and the reviewers. Any product that may be evaluated in this article, or claim that may be made by its manufacturer, is not guaranteed or endorsed by the publisher.
The Supplementary Material for this article can be found online at: https://www.frontiersin.org/articles/10.3389/fenvs.2023.1098113/full#supplementary-material
Abubakar, H. B., Newete, S. W., and Scholes, M. C. (2020). Drought characterization and trend detection using the reconnaissance drought index for setsoto municipality of the free state Province of south Africa and the impact on maize yield. Water 12, 2993. doi:10.3390/w12112993
Arekhi, M., Saglam, S., and Ozkan, U. Y. (2020). Drought monitoring and assessment using Landsat TM/OLI data in the agricultural lands of Bandar-e-Turkmen and Gomishan cities, Iran. Environ. Dev. Sustain. 22, 6691–6708. doi:10.1007/s10668-019-00509-y
Asadi Zarch, M. A., Sivakumar, B., and Sharma, A. (2015). Droughts in a warming climate: A global assessment of standardized precipitation index (SPI) and reconnaissance drought index (RDI). J. Hydrology 526, 183–195. doi:10.1016/j.jhydrol.2014.09.071
Bae, S., Lee, S.-H., Yoo, S.-H., and Kim, T. (2018). Analysis of drought intensity and trends using the modified SPEI in South Korea from 1981 to 2010. Water 10, 327. doi:10.3390/w10030327
Bai, X., Shen, W., Wu, X., and Wang, P. (2020). Applicability of long-term satellite-based precipitation products for drought indices considering global warming. J. Environ. Manag. 255, 109846. doi:10.1016/j.jenvman.2019.109846
Barua, S., Ng, A. W. M., and Perera, B. J. C. (2011). Comparative evaluation of drought indexes: Case study on the Yarra River catchment in Australia. J. Water Resour. Plan. Manag. 137, 215–226. doi:10.1061/(ASCE)WR.1943-5452.0000105
Bayissa, Y., Maskey, S., Tadesse, T., van Andel, S., Moges, S., van Griensven, A., et al. (2018). Comparison of the performance of six drought indices in characterizing historical drought for the upper Blue nile basin, Ethiopia. Geosciences 8, 81. doi:10.3390/geosciences8030081
Byakatonda, J., Parida, B., Moalafhi, D., and Kenabatho, P. K. (2018). Analysis of long term drought severity characteristics and trends across semiarid Botswana using two drought indices. Atmos. Res. 213, 492–508. doi:10.1016/j.atmosres.2018.07.002
IPCC (2014). “Summary for policymakers,” in Climate change 2014: Impacts, adaptation, and vulnerability. Part A: Global and sectoral aspects. Contribution of working group II to the fifth assessment report of the intergovernmental panel on climate change [field. Editors C. B. Field, V. R. Barros, D. J. Dokken, K. J. Mach, M. D. Mastrandrea, T. E. Biliret al. (Cambridge, UK: Cambridge University Press), 1–32.
Cohen, J. (1960). A coefficient of agreement for nominal scales. Educ. Psychol. Meas. 20, 37–46. doi:10.1177/001316446002000104
Degefu, M. A., and Bewket, W. (2015). Trends and spatial patterns of drought incidence in the omo-ghibe river basin, Ethiopia. Geogr. Ann. Ser. A, Phys. Geogr. 97, 395–414. doi:10.1111/geoa.12080
Dogan, S., Berktay, A., and Singh, V. P. (2012). Comparison of multi-monthly rainfall-based drought severity indices, with application to semi-arid Konya closed basin, Turkey. J. Hydrology 470-471, 255–268. doi:10.1016/j.jhydrol.2012.09.003
Edossa, D. C., Babel, M. S., and Das Gupta, A. (2010). Drought analysis in the awash River basin, Ethiopia. Water Resour. Manag. 24, 1441–1460. doi:10.1007/s11269-009-9508-0
Ezzine, H., Bouziane, A., and Ouazar, D. (2014). Seasonal comparisons of meteorological and agricultural drought indices in Morocco using open short time-series data. Int. J. Appl. Earth Observation Geoinformation 26, 36–48. doi:10.1016/j.jag.2013.05.005
Guenang, G. M., and Kamga, F. M. (2014). Computation of the standardized precipitation index (SPI) and its use to assess drought occurrences in Cameroon over recent decades. J. Appl. Meteorology Climatol. 53, 2310–2324. doi:10.1175/JAMC-D-14-0032.1
Gumus, V., Simsek, O., Avsaroglu, Y., and Agun, B. (2021). Spatio-temporal trend analysis of drought in the GAP Region, Turkey. Nat. Hazards 109, 1759–1776. doi:10.1007/s11069-021-04897-1
Haile, B. T., Bekitie, K. T., Zeleke, T. T., Ayal, D. Y., Feyisa, G. L., and Anose, F. A. (2022). “Drought analysis using standardized evapotranspiration and aridity index at Bilate watershed: Sub-basins of Ethiopian Rift Valley,” in The Scientific World Journal. Editor X. Qin, 2022. doi:10.1155/2022/1181198
Hao, Z., Hao, F., Singh, V. P., Xia, Y., Ouyang, W., and Shen, X. (2016). A theoretical drought classification method for the multivariate drought index based on distribution properties of standardized drought indices. Adv. Water Resour. 92, 240–247. doi:10.1016/j.advwatres.2016.04.010
Huang, S., Chang, J., Huang, Q., and Chen, Y. (2014). Spatio-temporal changes and frequency analysis of drought in the wei River basin, China. Water Resour. Manag. 28, 3095–3110. doi:10.1007/s11269-014-0657-4
Hui-Mean, F., Yusop, Z., and Yusof, F. (2018). Drought analysis and water resource availability using standardised precipitation evapotranspiration index. Atmos. Res. 201, 102–115. doi:10.1016/j.atmosres.2017.10.014
Ionita, M., Scholz, P., and Chelcea, S. (2016). Assessment of droughts in Romania using the standardized precipitation index. Nat. Hazards 81, 1483–1498. doi:10.1007/s11069-015-2141-8
Jain, V. K., Pandey, R. P., Jain, M. K., and Byun, H.-R. (2015). Comparison of drought indices for appraisal of drought characteristics in the Ken River Basin. Weather Clim. Extrem. 8, 1–11. doi:10.1016/j.wace.2015.05.002
Jasim, A. I., and Awchi, T. A. (2020). Regional meteorological drought assessment in Iraq. Arabian J. Geosciences 13, 284. doi:10.1007/s12517-020-5234-y
Jenkins, K., and Warren, R. (2015). Quantifying the impact of climate change on drought regimes using the standardised precipitation index. Theor. Appl. Climatol. 120 (1–2). doi:10.1007/s00704-014-1143-x
Karavitis, C. A., Alexandris, S., Tsesmelis, D. E., and Athanasopoulos, G. (2011). Application of the standardized precipitation index (SPI) in Greece. Water 3, 787–805. doi:10.3390/w3030787
Khosravi, H., Dameneh, H. E., Dameneh, H. E., Borji, M., and Nejadfard, N. (2018). Drought trend assessment in riverheads of karkheh and dez basins based on streamflow drought index (SDI). Desert Ecosyst. Eng. J. 1 (2), 45–54. doi:10.22052/jdee.2018.101087.1019
Kwak, J., Kim, S., Jung, J., Singh, V. P., Lee, D. R., and Kim, H. S. (2016). Assessment of meteorological drought in korea under climate change. Adv. Meteorology 2016, 1–13. doi:10.1155/2016/1879024
Lee, S.-H., Yoo, S.-H., Choi, J.-Y., and Bae, S. (2017). Assessment of the impact of climate change on drought characteristics in the hwanghae plain, north Korea using time series SPI and SPEI: 1981–2100. Water 9, 579. doi:10.3390/w9080579
Lesk, C., Rowhani, P., and Ramankutty, N. (2016). Influence of extreme weather disasters on global crop production. Nature 529, 84–87. doi:10.1038/nature16467
Maeng, S., Azam, M., Kim, H., and Hwang, J. (2017). Analysis of changes in spatio-temporal patterns of drought across South Korea. Water 9, 679. doi:10.3390/w9090679
Mahmoudi, P., Rigi, A., and Miri Kamak, M. (2019). A comparative study of precipitation-based drought indices with the aim of selecting the best index for drought monitoring in Iran. Theor. Appl. Climatol. 137, 3123–3138. doi:10.1007/s00704-019-02778-z
McKee, T. B., Doesken, N. J., and Kleist, J. (1993). “The relationship of drought frequency and duration to time scales,” in 8th Conference on Applied Climatology, Anaheim, January 17-22, 1993, 179–184.
Mera, G. A. (2018). Drought and its impacts in Ethiopia. Weather. Clim. Extremes 22. doi:10.1016/j.wace.2018.10.002
Milton, A., and Stegun, I. A. (1965). Handbook of mathematical functions: With formulas, graphs, and mathematical tables. New York, NY, United States: Courier Corporation.
Mohammed, Y., and Yimam, A. (2021). Analysis of meteorological droughts in the Lake’s Region of Ethiopian Rift Valley using reconnaissance drought index (RDI). Geoenvironmental Disasters 8, 13. doi:10.1186/s40677-021-00183-1
Moloro, T. L. (2018). Spatio-temporal analysis of rainfall variability and meteorological drought: A case study in Bilate River basin, southern Rift Valley, Ethiopia. Int. J. Environ. Sci. Nat. Resour. 14. doi:10.19080/IJESNR.2018.14.555891
Morid, S., Smakhtin, V., and Moghaddasi, M. (2006). Comparison of seven meteorological indices for drought monitoring in Iran. Int. J. Climatol. 26, 971–985. doi:10.1002/joc.1264
Nasir, J., Assefa, E., Zeleke, T., and Gidey, E. (2021). Meteorological drought in northwestern escarpment of Ethiopian Rift Valley: Detection seasonal and spatial trends. Environ. Syst. Res. 10, 16. doi:10.1186/s40068-021-00219-3
Ogunrinde, A. T., Oguntunde, P. G., Olasehinde, D. A., Fasinmirin, J. T., and Akinwumiju, A. S. (2020). Drought spatiotemporal characterization using self-calibrating Palmer Drought Severity Index in the northern region of Nigeria. Results Eng. 5, 100088. doi:10.1016/j.rineng.2019.100088
Orhan, O., Ekercin, S., and Dadaser-Celik, F. (2014). Use of landsat land surface temperature and vegetation indices for monitoring drought in the salt lake basin area, Turkey. Sci. World J. 2014. doi:10.1155/2014/142939
Panu, U. S., and Sharma, T. C. (2002). Challenges in drought research: Some perspectives and future directions. Hydrological Sci. J. 47, S19–S30. doi:10.1080/02626660209493019
Payab, A. H., and Türker, U. (2019). Comparison of standardized meteorological indices for drought monitoring at northern part of Cyprus. Environ. Earth Sci. 78, 309. doi:10.1007/s12665-019-8309-x
Qi, Y., Yu, H., Fu, Q., Chen, Q., Ran, J., and Yang, Z. (2022). Future changes in drought frequency due to changes in the mean and shape of the PDSI probability density function under RCP4.5 scenario. Front. Earth Sci. 10, 857885. doi:10.3389/feart.2022.857885
Rahmat, S. N., Jayasuriya, N., and Bhuiyan, M. (2015). Assessing droughts using meteorological drought indices in Victoria, Australia. Hydrology Res. 46, 463–476. doi:10.2166/nh.2014.105
Rascón, J., Gosgot Angeles, W., Quiñones Huatangari, L., Oliva, M., and Barrena Gurbillón, M. Á. (2021). Dry and wet events in andean populations of northern Peru: A case study of chachapoyas, Peru. Front. Environ. Sci. 9, 614438. doi:10.3389/fenvs.2021.614438
Samantaray, A. K., Singh, G., Ramadas, M., and Panda, R. K. (2019). Drought hotspot analysis and risk assessment using probabilistic drought monitoring and severity–duration–frequency analysis. Hydrol. Process. 33, 432–449. doi:10.1002/hyp.13337
Sousa, P. M., Trigo, R. M., Aizpurua, P., Nieto, R., Gimeno, L., and Garcia-Herrera, R. (2011). Trends and extremes of drought indices throughout the 20th century in the Mediterranean. Nat. Hazards Earth Syst. Sci. 11, 33–51. doi:10.5194/nhess-11-33-2011
Stojanovic, M., Drumond, A., Nieto, R., and Gimeno, L. (2018). Variations in moisture supply from the mediterranean sea during meteorological drought episodes over central Europe. Atmosphere 9, 278. doi:10.3390/atmos9070278
Suryabhagavan, K. V. (2017). GIS-based climate variability and drought characterization in Ethiopia over three decades. Weather. Clim. Extremes 15(1), 11–23. doi:10.1016/j.wace.2016.11.005
Svoboda, M. D., and Fuchs, B. A. (2016). “Integrated drought management programme,” in Handbook of drought indicators and indices (Geneva, Switzerland: World Meteorological Organization, Global Water Partnership, University of Nebraska--Lincoln and National Drought Mitigation Center).
Tefera, A. S., Ayoade, J. O., and Bello, N. J. (2019). Drought occurrence pattern in tigray region, northern Ethiopia. J. Appl. Sci. Environ. Manag. 23, 1341. doi:10.4314/jasem.v23i7.23
Tesfamariam, B. G., Gessesse, B., and Melgani, F. (2019). Characterizing the spatiotemporal distribution of meteorological drought as a response to climate variability: The case of rift valley lakes basin of Ethiopia. Weather Clim. Extrem. 26, 100237. doi:10.1016/j.wace.2019.100237
Thom, H. C. S. (1958). A note on the gamma distribution. Mon. Weather Rev. 86, 117–122. doi:10.1175/1520-0493(1958)086<0117:ANOTGD>2.0.CO;2
Tigkas, D., Vangelis, H., and Tsakiris, G. (2017). An enhanced effective reconnaissance drought index for the characterisation of agricultural drought. Environ. Process. 4, 137–148. doi:10.1007/s40710-017-0219-x
Tigkas, D., Vangelis, H., and Tsakiris, G. (2015). DrinC: A software for drought analysis based on drought indices. Earth Sci. Inf. 8, 697–709. doi:10.1007/s12145-014-0178-y
Tigkas, D., Vangelis, H., and Tsakiris, G. (2012). Drought and climatic change impact on streamflow in small watersheds. Sci. Total Environ. 440, 33–41. doi:10.1016/j.scitotenv.2012.08.035
Tigkas, D., Vangelis, H., and Tsakiris, G. (2019). Drought characterisation based on an agriculture-oriented standardised precipitation index. Theor. Appl. Climatol. 135, 1435–1447. doi:10.1007/s00704-018-2451-3
Tigkas, D., Vangelis, H., and Tsakiris, G. (2016). Introducing a modified reconnaissance drought index (RDIe) incorporating effective precipitation. Procedia Eng. 162, 332–339. doi:10.1016/j.proeng.2016.11.072
Tran, H. T., Campbell, J. B., Tran, T. D., and Tran, H. T. (2017). Monitoring drought vulnerability using multispectral indices observed from sequential remote sensing (Case Study: Tuy Phong, Binh Thuan, Vietnam). GIScience Remote Sens. 54, 167–184. doi:10.1080/15481603.2017.1287838
Vangelis, H., Tigkas, D., and Tsakiris, G. (2013). The effect of PET method on Reconnaissance Drought Index (RDI) calculation. J. Arid Environ. 88, 130–140. doi:10.1016/j.jaridenv.2012.07.020
Vergni, L., Todisco, F., and Di Lena, B. (2021). Evaluation of the similarity between drought indices by correlation analysis and Cohen’s Kappa test in a Mediterranean area. Nat. Hazards 108, 2187–2209. doi:10.1007/s11069-021-04775-w
Vicente-Serrano, S. M., Beguería, S., and López-Moreno, J. I. (2010). A multiscalar drought index sensitive to global warming: The standardized precipitation evapotranspiration index. J. Clim. 23, 1696–1718. doi:10.1175/2009JCLI2909.1
Viste, E., Korecha, D., and Sorteberg, A. (2013). Recent drought and precipitation tendencies in Ethiopia. Theor. Appl. Climatol. 112, 535–551. doi:10.1007/s00704-012-0746-3
Wable, P. S., Jha, M. K., and Shekhar, A. (2019). Comparison of drought indices in a semi-arid River basin of India. Water Resour. Manag. 33, 75–102. doi:10.1007/s11269-018-2089-z
Wang, F., Wang, Z., Yang, H., Zhao, Y., Li, Z., and Wu, J. (2018). Capability of remotely sensed drought indices for representing the spatio–temporal variations of the meteorological droughts in the yellow River basin. Remote Sens. 10, 1834. doi:10.3390/rs10111834
Wang, T., Tu, X., Singh, V. P., Chen, X., and Lin, K. (2021). Global data assessment and analysis of drought characteristics based on CMIP6. J. Hydrology 596, 126091. doi:10.1016/j.jhydrol.2021.126091
Wells, N., Goddard, S., and Hayes, M. J. (2004). A self-calibrating palmer drought severity index. J. Clim. 17, 2335–2351. doi:10.1175/1520-0442(2004)017<2335:ASPDSI>2.0.CO;2
Yevjevich, V. (1967). “An objective approach to definitions and investigations of continental hydrologic droughts,” in Hydrology Papers No. 23 (Fort Collins, CO: Colorado State University).
Yihdego, Y., Vaheddoost, B., and Al-Weshah, R. A. (2019). Drought indices and indicators revisited. Arab. J. Geosci. 12 (3). doi:10.1007/s12517-019-4237-z
Yisehak, B., and Zenebe, A. (2021). Modeling multivariate standardized drought index based on the drought information from precipitation and runoff: A case study of hare watershed of southern Ethiopian Rift Valley basin. Model. Earth Syst. Environ. 7, 1005–1017. doi:10.1007/s40808-020-00923-6
Zarei, A. R., Moghimi, M. M., and Bahrami, M. (2019). Comparison of reconnaissance drought index (RDI) and effective reconnaissance drought index (eRDI) to evaluate drought severity. Sustain. Water Resour. Manag. 5, 1345–1356. doi:10.1007/s40899-019-00310-9
Zhao, H., Gao, G., An, W., Zou, X., Li, H., and Hou, M. (2017). Timescale differences between SC-PDSI and SPEI for drought monitoring in China. Phys. Chem. Earth, Parts A/B/C 102, 48–58. doi:10.1016/j.pce.2015.10.022
Zhong, Z., He, B., Guo, L., and Zhang, Y. (2019). Performance of various forms of the palmer drought severity index in China from 1961 to 2013. J. Hydrometeorol. 20, 1867–1885. doi:10.1175/JHM-D-18-0247.1
Keywords: drought indices, drought characterization, theory of run, drought frequency, bilate river watershed, rift valley, Ethiopia
Citation: Burka A, Biazin B and Bewket W (2023) Drought characterization using different indices, theory of run and trend analysis in bilate river watershed, rift valley of Ethiopia. Front. Environ. Sci. 11:1098113. doi: 10.3389/fenvs.2023.1098113
Received: 15 November 2022; Accepted: 02 June 2023;
Published: 23 June 2023.
Edited by:
Celso Santos, Federal University of Paraíba, BrazilReviewed by:
Zerouali Bilel, University of Chlef, AlgeriaCopyright © 2023 Burka, Biazin and Bewket. This is an open-access article distributed under the terms of the Creative Commons Attribution License (CC BY). The use, distribution or reproduction in other forums is permitted, provided the original author(s) and the copyright owner(s) are credited and that the original publication in this journal is cited, in accordance with accepted academic practice. No use, distribution or reproduction is permitted which does not comply with these terms.
*Correspondence: Ashenafi Burka, YXNoZW5hZmlidUBnbWFpbC5jb20=
Disclaimer: All claims expressed in this article are solely those of the authors and do not necessarily represent those of their affiliated organizations, or those of the publisher, the editors and the reviewers. Any product that may be evaluated in this article or claim that may be made by its manufacturer is not guaranteed or endorsed by the publisher.
Research integrity at Frontiers
Learn more about the work of our research integrity team to safeguard the quality of each article we publish.