 Chen Gao
 Mingshuo Cao2
 Ya Wen
 Chenqi Li
- 1China Economics and Management Academy, Central University of Finance and Economics, Beijing, China
- 2Freeman School of Business, Tulane University, New Orleans, LA, United States
- 3School of Economics, Beijing Technology and Business University, Beijing, China
Exploring the coupling and coordination between science and technology finance and green development is a critical action that needs to be addressed in achieving high-quality development in China. Based on the coupling coordination degree model and panel vector autoregression (PVAR) model, this paper uses the relevant data of 274 cities in China from 2003 to 2020 to study the relationship between science and technology finance and green development. The results show that: 1) The relationship between science and technology finance and green development has changed from low coupling coordination to medium coupling coordination in the sample period. 2) The Beijing-Tianjin-Hebei, Yangtze River Delta, and Pearl River Delta regions are at a relatively high level of coupling and coordination as a whole, while other regions are at a relatively low level of coupling and coordination. 3) Through the analysis of the spatial characteristics of the coupling coordination degree, it is found that the coupling coordination degree of China’s urban science and technology finance and green development is generally positive spatial autocorrelation. Spatial correlations continue to strengthen over time. 4) By establishing a PVAR model, we examined the interaction between science and technology finance, green development, and their coupling coordination. Science and technology finance, green development and their coupling coordination degree are themselves affected. We have comprehensively and objectively grasped the matching status of China’s urban science and technology finance and green development, providing a reference for promoting the adaptation of science and technology finance to green development.
1 Introduction
Climate and global warming have emerged as significant issues facing people worldwide. Numerous scholars have studied economic development, financial development, energy consumption, and carbon dioxide emissions and obtained valuable results (Mitić et al., 2023; Usman et al., 2022; Cheng et al., 2023; Khan, 2023). Scientific and technological innovation is the first driving force of green development and is crucial to promoting the construction of ecological civilization (Cao et al., 2021). Since the 1980s, a new round of scientific and technological innovation represented by information, network, digital, and biotechnology has provided technical support and fundamental guarantee for the development of a green economy (Kim, 2019). The role of information technology in economic and social progress has long been recognized (Rehman et al., 2022). As a development mode with less environmental pollution, low energy consumption, and high scientific and technological content, green development cannot be achieved by relying solely on traditional production methods. It must rely on scientific and technological innovation (Dunn, 2002; Aqib and Zaman, 2023). The 2020 Green Development Science and Technology Innovation Conference, with the theme of “enabling green development through digital economy,” emphasized the relationship between scientific and technological innovation and green development. The conference proposed that high-quality green development must be led and supported by science and technology. However, an essential institutional problem in China’s current scientific and technological development is the lack of a long-term stable source of capital (Wu et al., 2021).
Many scholars have studied the impact of scientific and technological innovation on the ecological environment using the IPAT or STIRPAT method (Dietz and Rosa, 1994; York et al., 2003). Regardless of the form of technological innovation, it affects energy efficiency through technology spillover effects. Most studies showed that technological progress can improve energy efficiency (Lin and Moubarak, 2014; Sun et al., 2019). However, some scholars believe scientific and technological innovation negatively related with energy efficiency (Hübler and Keller, 2010; Adom and Amuakwa-Mensah, 2016). Nathaniel et al. (2021) believed that technological innovation could directly improve environmental quality via developing technologies related to environmental protection. Usman and Hammar (2021) believed that technological innovation was not conducive to improving environmental quality. As technological innovation optimizes the ecological footprint of the region, the ecological environment is more vulnerable to damage. These findings may be due to different methods and sample data selected by the scholars.
Technological innovation, financial markets and their combinations are playing an increasingly important role in economic construction and social progress (Perrons, 2004). How to accelerate the development of science and technology finance, promote independent innovation and achieve high-quality economic growth has become a hot issue in recent years (Gao et al., 2022). Huang (2019) used the VAR model to investigate the relationship between science and technology finance and economic growth in Shanghai based on the data of Shanghai’s science and technology finance investment and high-tech industry output value from 2004 to 2016. He found that investment in science and technology finance is conducive to raising the output value of high-tech industries. Therefore, the Shanghai municipal government should increase the investment in scientific and technological financial capital to deepen the positive role of science and technology finance in the development of high-tech industries. Hua et al. (2021) employed the entropy weight method and super efficiency DEA model to measure China’s science and technology finance index and ecological efficiency, respectively, then constructed a spatial econometric model to empirically analyze the influence of science and technology finance on regional ecological efficiency. The study denoted that science and technology finance and industrial structure optimization have failed to effectively optimize ecological efficiency. Financial development can only exert positive spillover impact on ecological efficiency under the supervision of industrial structure optimization.
The profit-seeking nature of capital makes it difficult for scientific and technological financial resources to break this law. In their pursuit of maximizing economic benefits, they often neglect the governance of the ecological environment. In addition, China’s scientific and technological financial development is still in its infancy, and the overall level is not high. The combination of science, technology and finance plays a more critical role in the efficiency of production technology than environmental protection. At least some technologies have not yet achieved the transformation of green achievements, but may have a negative impact on the environment (Asche et al., 2009). Shi and Xia (2022), based on the perspective of the industrial life cycle, adopted the Logistic model to analyze the impact of science and technology finance in 11 provinces and cities of the Yangtze River Economic Belt on the development of high-tech industries. They found that science and technology resources, market financing and government investment in science and technology are crucial channels for science and technology finance to stimulate the development of high-tech industries. The development of high-tech industries in the middle and lower reaches of the Yangtze River Economic Belt requires more financial innovation tools to support it.
Several scholars have studied technology finance in terms of coupling relations. Zhou and Feng (2020) investigated the coupling and interaction between science and technology finance and high-quality economic development in 31 provinces of China. They noted that science and technology finance and high-quality economic development had improved from 2008 to 2017, and the coupling degree between them showed a steady upward trend. In terms of interaction, high-quality economic development has significantly boosted the development of science and technology finance. In contrast, science and technology finance has no significant influence on high-quality economic development. Liu et al. (2021) studied the dynamic coupling nexus between sci-tech finance and advanced manufacturing innovation in 30 provinces of China during 2007–2019. They proposed that the degree of coupling coordination in each region shows a trend of continuous optimization overall, but there are differences in the degree of coupling in different regions. Feng et al. (2022) explored the coupling relationship between science and technology finance and industrial structure in China using the coupling model. They found that the two couplings exhibit an overall upward trend, but there are large differences in each region, with the mean value of the couplings decreasing successively from east to west.
In order to promote the balanced and coordinated development of science and technology finance and urban green development, this paper examines the coupling mechanism of science and technology finance and green development from the elements of the comprehensive indicator system of science and technology finance and green development. The culmination of this paper will not only help governments formulate scientific and sound policy recommendations but will also be of the great reference value and practical importance for countries around the world to build a new development model and promote high-quality economic and social development.
The main contributions are as follows: First, there are still significant differences in the construction of this metric as different scholars have not yet reached a consensus on the understanding of science and technology finance. In this paper, we will construct a comprehensive index of science and technology finance based on existing research and multiple dimensions. At the same time, a comprehensive system of indicators for green development will be established based on four levels of economic growth, social welfare, ecological construction, and institutional provision. Second, from the coupling perspective, we use the coupling coordination degree model to calculate the coupling coordination between science and technology finance and green development. Then, we use the PVAR model to investigate their dynamic relationship. This paper addresses the lack of empirical evidence on the relationship between science and technology finance and green development. Finally, this paper provides empirical evidence for city-level data with a larger sample size.
The remainder of this study is organized as follows: Section 2 describes the system coupling mechanism of science and technology finance and green development. Section 3 provides the methodology, which mainly introduces variables and model settings. Section 4 reports the results and discussion. Section 5 includes the conclusion and policy recommendations of this study.
2 The system coupling mechanism of science and technology finance and green development
There is no unified definition of “science and technology finance,” and most of the literature only focuses on scientific and technological innovation and financial support. The first domestic proposal of “science and technology finance” was in the Law of the People’s Republic of China on Science and Technology Progress in 1993. Subsequently, Zhao et al. (2009)’s definition of “science and technology finance” was recognized by some scholars. Science and technology finance is a systematic arrangement of financial systems, policies and tools to facilitate the transformation of the achievements, research and development of science and technology and high-tech industries. Therefore, based on the existing research, this paper will judge the development of science and technology finance in four aspects: resources, funding, financing and output. In addition, according to the contents of the “14th Five Year Plan” and the outline of the 2035 long-term goals, green development involves many aspects. This paper will analyze the coupling mechanism between regional science and technology finance and green development from the perspective of ecological construction, economic development, social welfare and institutional supply, as shown in Figure 1.
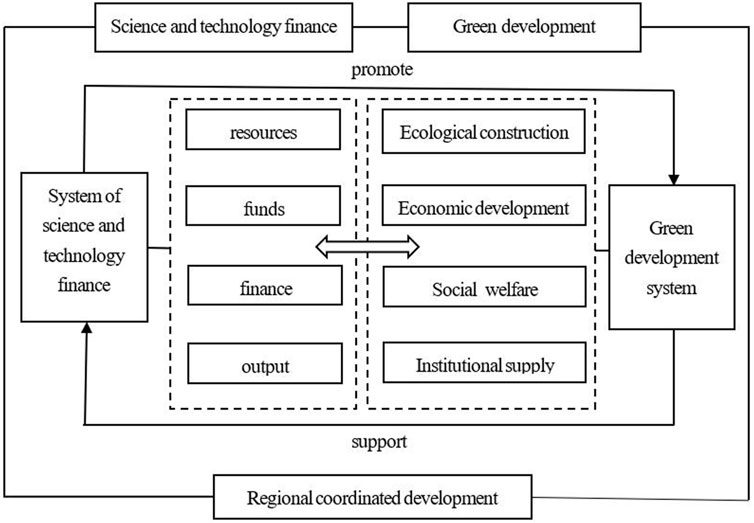
FIGURE 1. Coupling mechanism between science and technology finance and green development.
2.1 Science and technology finance promotes green development
As the two most active factors in economic and social development, the combination of technology and finance has transformed the development mode from factor-driven to innovation-driven (Xu, 2022). Science and technology are the primary productive forces. Scientific and technological advances require financial support. Continuously improving the combination of science, technology, and finance is significant for promoting independent innovation and improving total factor productivity (Xue et al., 2022). Due to the lack of direct research on the impact of science and technology finance on green development, this paper analyzes the impact of science and technology finance on green development in four dimensions. The detailed analysis proceeds as follows.
Firstly, some scholars believe that traditional technologies will lead to excessive energy use and increase carbon emissions, leading to the deterioration of environmental quality (Jin et al., 2014). Advances in traditional technologies are essential in environmental pollution, and developing green technologies is imminent. The progress of green technology is an important means to improve environmental quality, which indicates that government departments need to pay more attention to green technology innovation to achieve environmental governance effect (Hou et al., 2022). The development of green technologies requires strong support from financial development, and the deep integration of science and technology with finance provides the necessary material foundation for urban ecological construction.
Secondly, according to Solo’s economic growth model, technological progress is a crucial factor in promoting a country’s economic growth, which has also been recognized by many scholars (Coe and Helpman, 1995; Brouhel and Thierer, 2019). At the same time, financial development can not only mitigate the financing constraints of high-tech industries, but also support enterprise R&D innovation, thus promoting economic growth (Hu et al., 2017). Therefore, the effective combination of scientific and technological innovation and financial development plays a vital role in economic construction.
Third, science and technology finance can improve the economic development of cities and thus increase the total social wealth. The local government can get more income from it and master more resources to increase the investment in education, medical care, transportation, commercial support, etc. At the same time, the government will inject more resources into the social security system as the level of social income rises. After the basic life of residents is guaranteed, they will turn to human capital investment, which not only brings positive externalities to create a favorable economic environment but also improves the innovation ability of the whole society (Stahl et al., 2020). As a result, scientific and technological innovation promotes social wellbeing by increasing wealth.
Fourth, institutional regulations mainly include infrastructure and environmental governance. On the one hand, with the iteration of cutting-edge technologies such as blockchain, cloud computing and big data, the economic environment will develop in-depth and intelligently, which is bound to drive the rapid development of regional infrastructure (Su et al., 2021). On the other hand, the role of science and technology finance in environmental governance. Science and technology finance has been incorporated into national strategic planning related to the country’s overall stability. Green development puts higher demands on the development of green industries and innovation in green technology, thus constantly pushing local governments to improve their environmental governance systems.
2.2 Green development supports science and technology finance
First, green development will encourage local governments to increase investment in green innovation R&D projects for technology-based enterprises, especially bringing high-quality infrastructure, innovative R&D capital, and other elements for small and medium-sized technology-based enterprises (Chen et al., 2017). The increasing accumulation of resources, such as talent, knowledge and technology, provides necessary material guarantees and convenient conditions for scientific and technological enterprises in the research and development process. The accumulation of human capital has improved the overall efficiency of the innovation system of science and technology finance and injected new impetus into the development of science and technology finance (Bergek et al., 2013).
Second, green development creates broader market demand for the development of science and technology finance and helps improve the environment for science and technology finance. To achieve the goal of green development, rational development, optimization and upgrading traditional industrial structures is imperative. In this process, financial innovation is indispensable to provide more market demand for developing science and technology finance (Irfan et al., 2022). At the same time, the development of science and technology finance is often based on the traditional financial industry, which significantly impacts the development of traditional industries. In recent years, China’s economic development model has undergone significant changes, and traditional forms of financing, dominated by banks, are no longer applicable. The future financing system should be a diversified form dominated by the market mechanism and combined with direct financing and indirect financing, which broadens the financing channels of scientific and technological enterprises and improves the scientific and technological financial environment (Zhao, 2008).
Finally, green development provides an excellent institutional environment for science and technology finance and avoids risks to developing the science and technology finance industry. Governments at all levels have formulated many green development policies and plans, which will create necessary constraints and guarantees for scientific and technological financial activities to avoid risk sources in scientific and technological development (ElMassah and Mohildin, 2020). At the same time, green development can drive institutional innovation and promote the continuous improvement of the legal system related to science and technology finance. The steady development of the regional economy and the stability of financial markets have provided guarantees for the development of science and technology finance. Based on the analysis of the theoretical mechanism described above, we propose the following research hypothesis.
Hypothesis 1. There is a coordinated development relationship between science and technology finance and green development.
Hypothesis 2. There is an interactive causal relationship between science and technology finance and green development.
3 Methodology
3.1 Indicator system
3.1.1 Indicator system of science and technology finance
Scholars have not precisely defined “science and technology finance" (Ma et al., 2013). Currently, most research is conducted from the perspective of scientific and technological innovation, financing, and financial support. “Science and technology finance” was first proposed in the Law of the People’s Republic of China on Science and Technology Progress in 1993. In recent years, numerous scholars have adopted different methods to build the indicator system of science and technology finance (Cao et al., 2011; Xu et al., 2015; Wang et al., 2022). This paper constructs a comprehensive indexing system for science and technology finance from four aspects: resources, funding, financing, and output.
Financial resources for science and technology include: Human resources for science and technology are measured as the ratio of the number of scientific and technological personnel to the total population of the region at the end of the year. R&D personnel, as measured by the proportion of R&D personnel in the total population of the region at the end of the year. Financial human resources are measured by the number of financial practitioners at the end of the year as a percentage of the total population of the region. Higher education resources are measured by the number of college students per 10,000 population.
Financial support for science and technology includes: Financial support is primarily measured by the ratio of financial science and technology spending to total financial spending. R&D spending is measured as a percentage of GDP.
Financing of science and technology finance includes: Financial depth is mainly measured by the proportion of the loan balances of financial institutions in the regional GDP. Credit capacity is measured by the ratio of the balance of deposits held by financial institutions to GDP. The number of regional listings measures the state of the listed companies. Insurance depth is measured as the proportion of insurance revenues in GDP.
Scientific and technological financial output includes: Patent yield rate is measured as the ratio of the number of patents granted to the amount spent on scientific research. Patent intensity is mainly measured by the ratio of patent ownership to the labour force.
3.1.2 Indicator system of green development
Under the background of ecological civilization construction, economic growth transformation and social governance modernization, this paper constructs a more comprehensive and systematic green development measurement index with the general direction of “efficiency, harmony and sustainability”. Meanwhile, according to the contents of the Assessment Target System for Ecological Civilization Construction and the Green Development Indicator System, and referring to the research of Huang and Wu (2019) and Hu et al. (2021), from four aspects of ecological construction, economic development, social welfare and system supply, this paper selects 40 relevant indicators to build a comprehensive indicator system for green development (see Table 1).
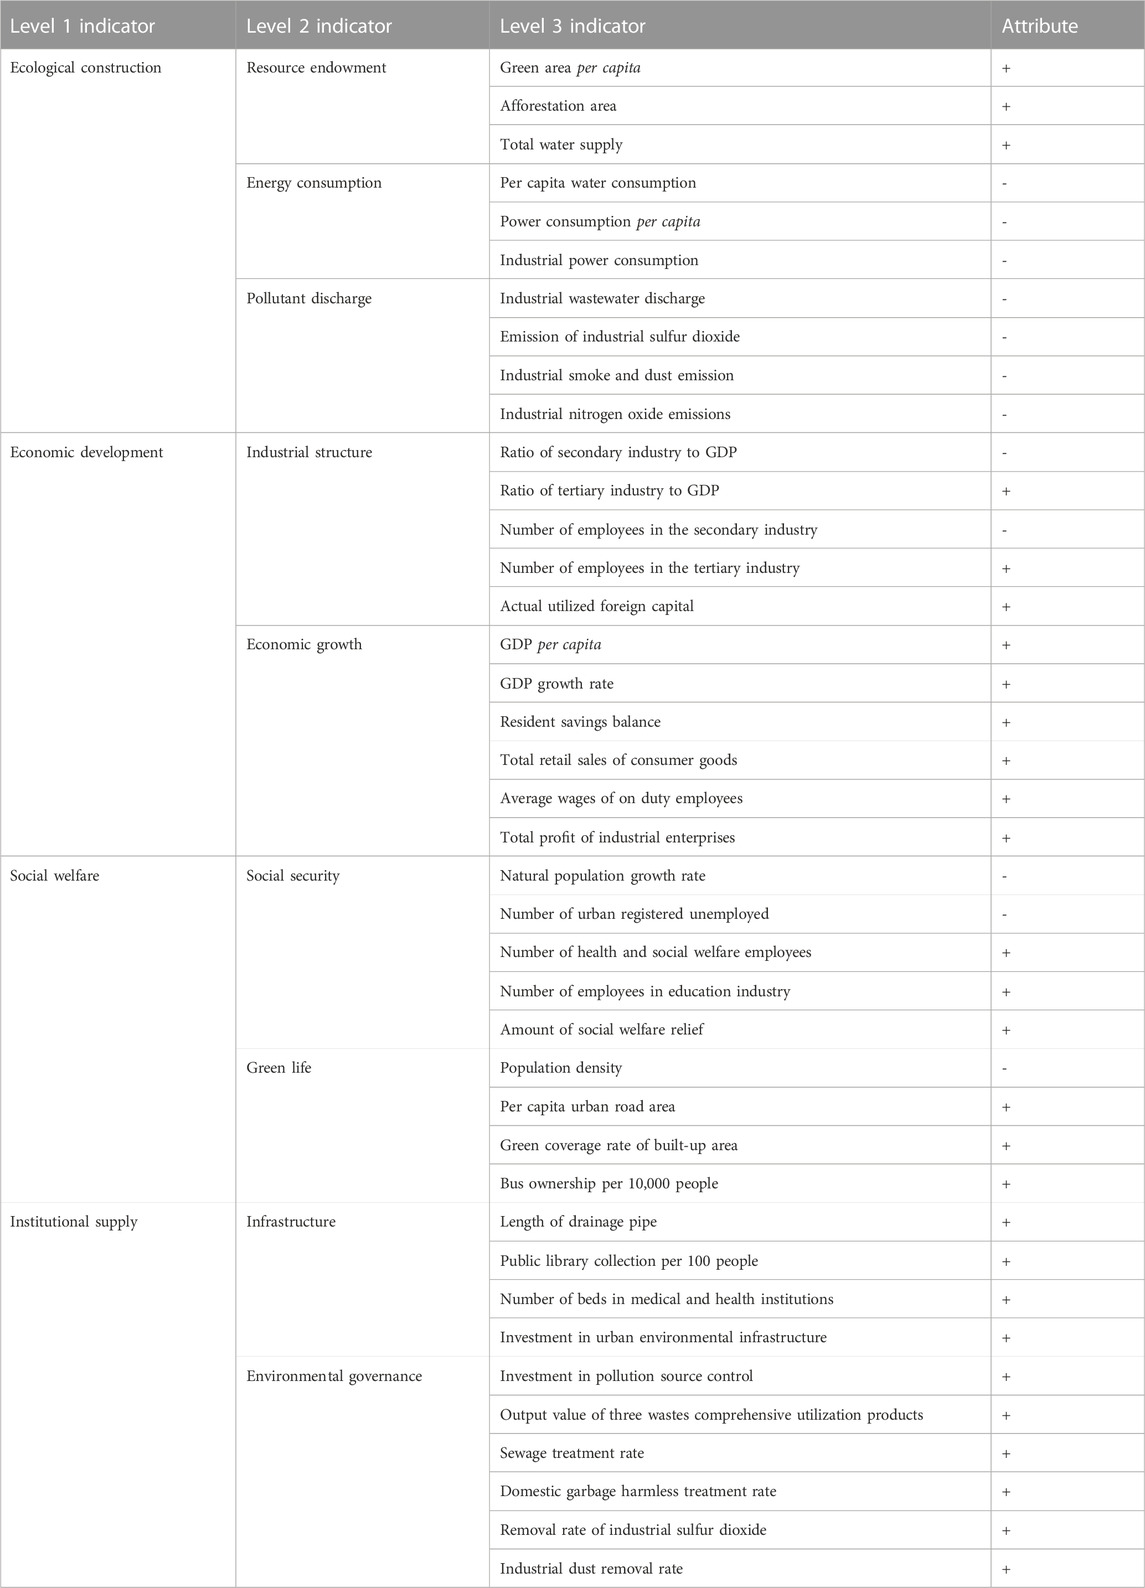
TABLE 1. Green development indicator evaluation system.
3.1.3 Determination of index weight by entropy method
Based on the above indicators of science and technology finance and green development, as well as their data characteristics, this paper uses entropy method to calculate the comprehensive indicators of science and technology finance and green development. The entropy method determines the weight according to the dispersion degree of the index, which is an objective method of giving weight, avoiding the interference of subjective factors, to ensure the accuracy and reliability of the index information entropy (Bai et al., 2020). The greater the degree of dispersion, the more information, the greater the weight, but the smaller the entropy. The original data of indicators can be expressed in
1) To avoid the impact of different dimensions of indicators on the evaluation results, this paper conducts dimensionless processing of indicators. For positive indicators, the normalized value can be measured by the following formula:
For negative indicators, the normalized value can be calculated with the following formula:
Where
2) Calculate the proportion of index
3) Calculate the entropy value e of the
4) Calculate the weight w of the
5) Calculate the comprehensive score of indicators:
3.1.4 Science and technology finance and green development in China
In this paper, we adopt the entropy method introduced above to build an indicator system for the financial and green development of China’s urban science and technology sector. We calculate the average composite index of these two indicators from 2003 to 2020. In order to more intuitively see the changing trend of science and technology finance and green development over time, this paper has drawn a line chart of the average composite index of science and technology finance and green development from 2003 to 2020 (Figure 2). Overall, the average composite index of science and technology finance and green development shows an upward trend. However, the science and technology finance index peaked in 2017 and recovered from a stable upward trend. According to the records of major events in science and technology finance, the Chinese government paid enough attention to the development of science and technology finance in 2017 and wrote “science and technology finance ecology” into the 13th Five-Year National Science and Technology Innovation Plan for the first time. The concept of science and technology finance ecology was also widely accepted. In addition, the trend of the average composite index for green development is relatively steep, as seen from the figure. In contrast, the trend of the average composite index of science and technology finance is relatively flat, indicating that the green development of Chinese cities has achieved more notable results. As a developing country, China’s integration of science, technology and finance has achieved phased results, but it is still in its infancy. The development of science and technology finance still faces enormous risks and challenges.
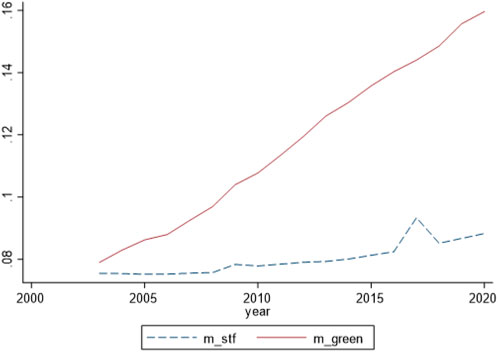
FIGURE 2. Broken line chart of average comprehensive index of science and technology finance and green development from 2003 to 2020.
3.2 Coupling coordination degree model
The coupling degree is originally a concept in the computer field, which is a measure of the degree of correlation between modules. In this paper, the interaction between the science and technology finance subsystem and the green development subsystem is understood as the degree of coupling between the two. In order to quantitatively analyze the coupling level of the compound system of science and technology finance and green development, we have established a coupling degree model that can reflect the interaction between the subsystems of science and technology finance and green development.
However, the degree of coupling can only represent the degree of interaction between the systems in the time dimension (Pan and Dong, 2023). In contrast, for multi-area comparisons in spatial dimensions, the method of computing the coupling degree may lead to spurious evaluation results. The coupling degree can judge the degree of coordination between the two systems (Tao et al., 2023). However, if each system has a relatively low level of development, a high coupling degree may still be obtained, which is contrary to the actual situation (Xu et al., 2023). Because the subsystems of science and technology finance and green development are interlaced, unbalanced and dynamic, this paper can not accurately reflect their interaction’s synergy and overall effectiveness by only using the coupling degree. Therefore, to further analyze the degree of coordination of the composite system, in this paper, we introduce the coupled degree of coordination model, which is calculated as follows:
Where
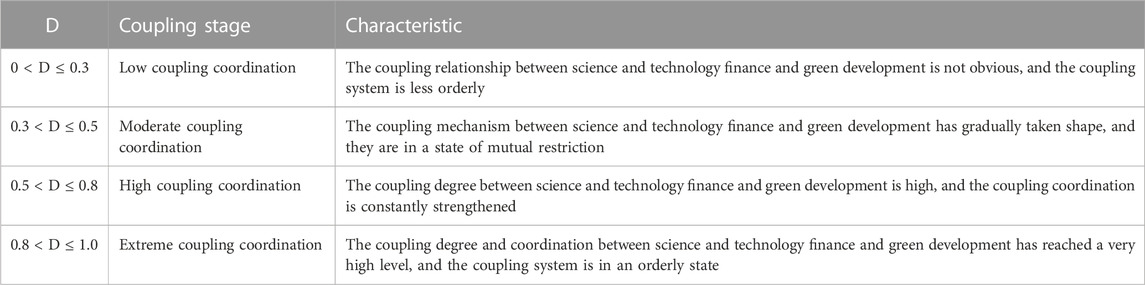
TABLE 2. Classification of coupling coordination types.
3.3 Preliminary preparation of PVAR model
3.3.1 Model setting
We believe that this work also contributed to the achievement of sustainable development goals (SDGs) and ecological civilization, which are important directions for China (Bryan et al., 2018; Sun et al., 2018; Jiang et al., 2022). In order to study the interaction between science and technology finance, green development and their coupling and coordination levels, this paper constructs a panel vector autoregression model (PVAR) for analysis. The PVAR model does not need to set the causal relationship between variables and distinguish between endogenous and exogenous variables in advance but regards all variables as endogenous variables and then analyzes the interaction between each variable and the lagging term (Feng and Yang, 2023; Sharif et al., 2023). The model is set in the following formula.
Where
3.3.2 Stationarity test
In order to ensure the accuracy of the model estimation and avoid the “spurious regression” phenomenon, this paper first tests the stationarity of the three variables of science and technology finance, green development, and their coupling coordination level before estimating the model. Common unit root test methods for panel data include the following four methods: LLC test, IPS test, HT test, and ADF test. The above unit root test methods have different conditions to apply, but the initial assumption is that all variables have unit roots; the data is unstable. Assume that the result of the original data is not stable. In that case, it is necessary to perform first-order difference processing on the data and then re-perform the unit root test on the differential sequence until the result is stable. In order to ensure the stability of the results, in this paper, we will check the existence of a root of unity in the variables simultaneously using the above four methods. See Table 3 for the test results. It can be found that science and technology finance and green development cannot be significant at the level of 5%, indicating that these two variables are unstable. All variables after the first order difference pass the 1% significance level test, indicating that the data obtained after the first order difference is stable for science and technology finance, green development and their coupling coordination level.
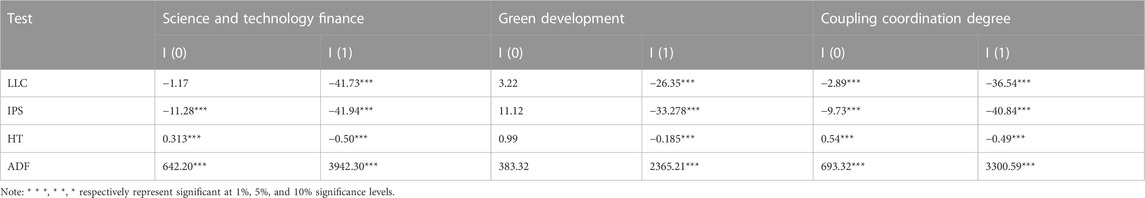
TABLE 3. Unit root test.
In order to verify whether there is a long-term stable equilibrium relationship between science and technology finance, green development and their coupling coordination levels, we employ the Kao test method to carry out a cointegration test on the data after the first-order difference of all variables. Kao test results show that the t-statistic value of ADF is -13.4828, and the p-value is 0.0000, which means that the original hypothesis is rejected, indicating a stable equilibrium relationship between science and technology finance, green development and their coupling coordination levels.
3.3.3 Selection of optimal lag order of PVAR model
Before PVAR model regression, it is necessary to determine the optimal lag order of the model. This paper refers to Yang (2017)’s practice and determines the optimal lag order according to the minimum values of AIC, BIC and HQIC. The results are shown in Table 4. It can be found that the optimal lag order of AIC, BIC and HQIC is order 1. Therefore, the lag order of the PVAR model is set as order one in this paper.
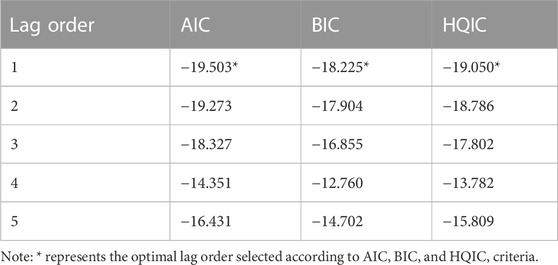
TABLE 4. Selection of optimal lag order of PVAR model.
4 Results and discussion
4.1 Time analysis of the systematic coupling between science and technology finance and green development
4.1.1 Overall time characteristics
Based on the coupling coordination model, this paper uses panel data of 274 cities in China from 2003 to 2020 to calculate the coupling coordination of science and technology finance and green development. In Table 5,
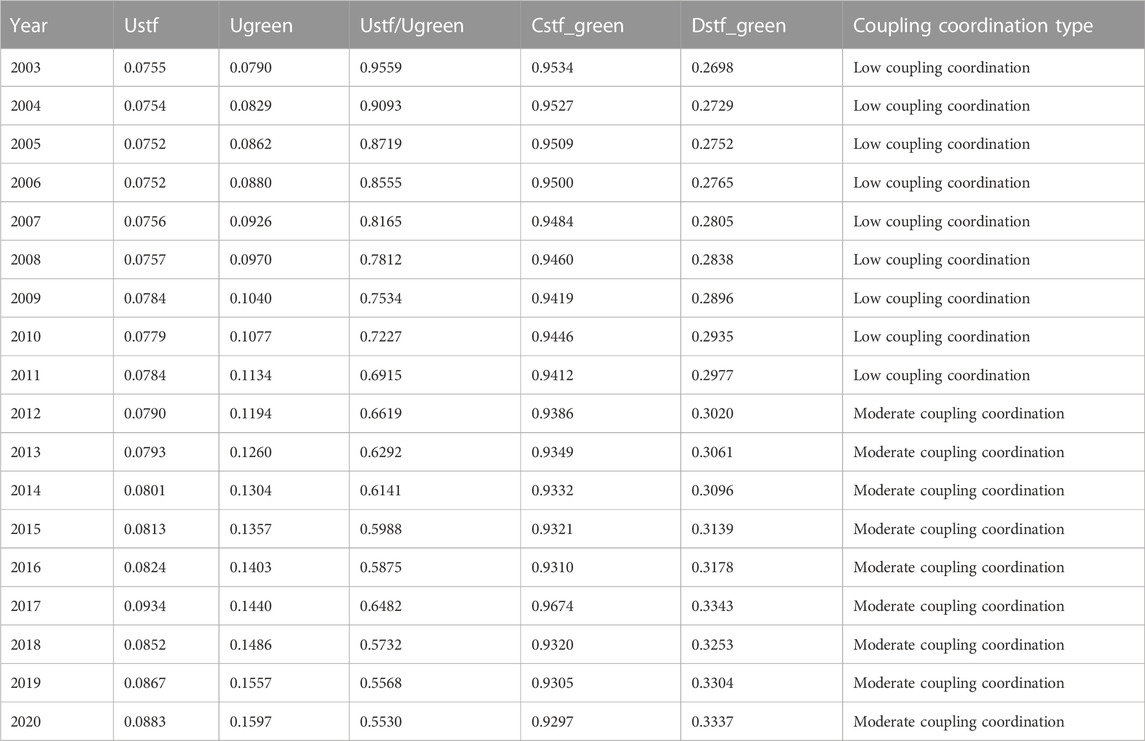
TABLE 5. The overall characteristics of the coupling and coordination relationship between science and technology finance and green development.
Table 5 shows that science and technology finance and green development have relatively high coupling. The average coupling degree is 0.9421 through calculation, conveying that science and technology finance and green development have a high correlation, and the correlation is decreasing year by year. However, the relationship between science and technology finance and green development was low coupling and coordination before 2011. In 2011 and later, their relationship changed from low coupling and coordination to medium coupling and coordination. Throughout the sample period, the degree of coupling and coordination between science and technology finance and green development is rising yearly, which shows that the mutual support and promotion between the two have been strengthened. At the same time, it can also be found that the science and technology finance system continues to lag behind the green development system. The gap between the two systems gradually increases over time, which may be why the coupling and coordination level of science and technology finance and green development cannot be further improved (Yin et al., 2022). Therefore, this conclusion implies that improving the development level of science and technology finance is the key to optimizing the high coupling and coordination between science and technology finance and green development.
In order to more intuitively analyze the dynamic evolution and spatial pattern of the coupling and coordination degree of science and technology finance and green development in cities across the country, this paper takes 2015 and 2020 as time nodes to visualize the coupling and coordinated development of science and technology finance and green development in 274 cities in China, as shown in Figure 3. It can be seen that in these four periods, the coupling and coordination degree of science and technology finance and green development system showed a gradient change trend in space, that is, from inland areas to coastal areas. The coupling and coordination degree of eastern cities with the more developed economy is generally higher than that of central and western cities with lower economic development and northeast cities. In addition, in 2005, the coupling coordination degree of most cities in China was mainly concentrated in the range of 0.1622524–0.30844205. By 2020, most cities’ coupling and coordination degree will rise to 0.4546327–0.60082335, which indicates that the coupling and coordination degree between science and technology finance and green development will increase significantly over time (Yin and Xu, 2022).
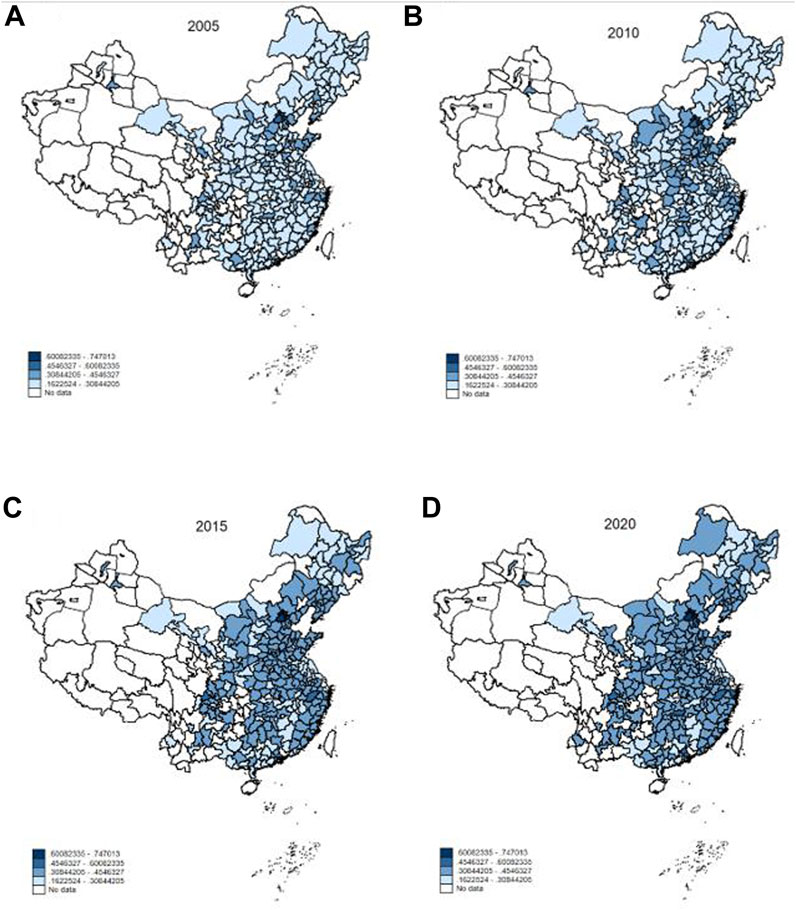
FIGURE 3. The spatial pattern evolution of the coupling coordination degree between the scientific and technological finance system and the green development system. (A) The coupling and coordination of science and technology finance and green development in 2005; (B) The coupling and coordination of science and technology finance and green development in 2010; (C) The coupling and coordination of science and technology finance and green development in 2015; (D) The coupling and coordination of science and technology finance and green development in 2020.
4.1.2 Characteristics of seven urban agglomerations
Table 6 shows the basic characteristics of the coupling and coordination degree between science and technology finance and green development of China’s seven urban agglomerations from 2003 to 2020. The Beijing-Tianjin-Hebei, Yangtze River Delta and Pearl River Delta regions have a high level of coordination between science and technology finance and green development, which belongs to the first ladder level at the level of urban agglomeration. Among them, the coupling coordination degree of the Beijing-Tianjin-Hebei region has increased from 0.3108 in 2003 to 0.3950 in 2020, which is in a moderate coupling coordination within the observation period. The coupling coordination degree of the Yangtze River Delta and the Pearl River Delta increased from 0.2693 to 0.2644 in 2003 to 0.3717 and 0.3865 in 2020, respectively, from low coupling coordination to medium coupling coordination. The turning points were in 2009 and 2010, respectively.
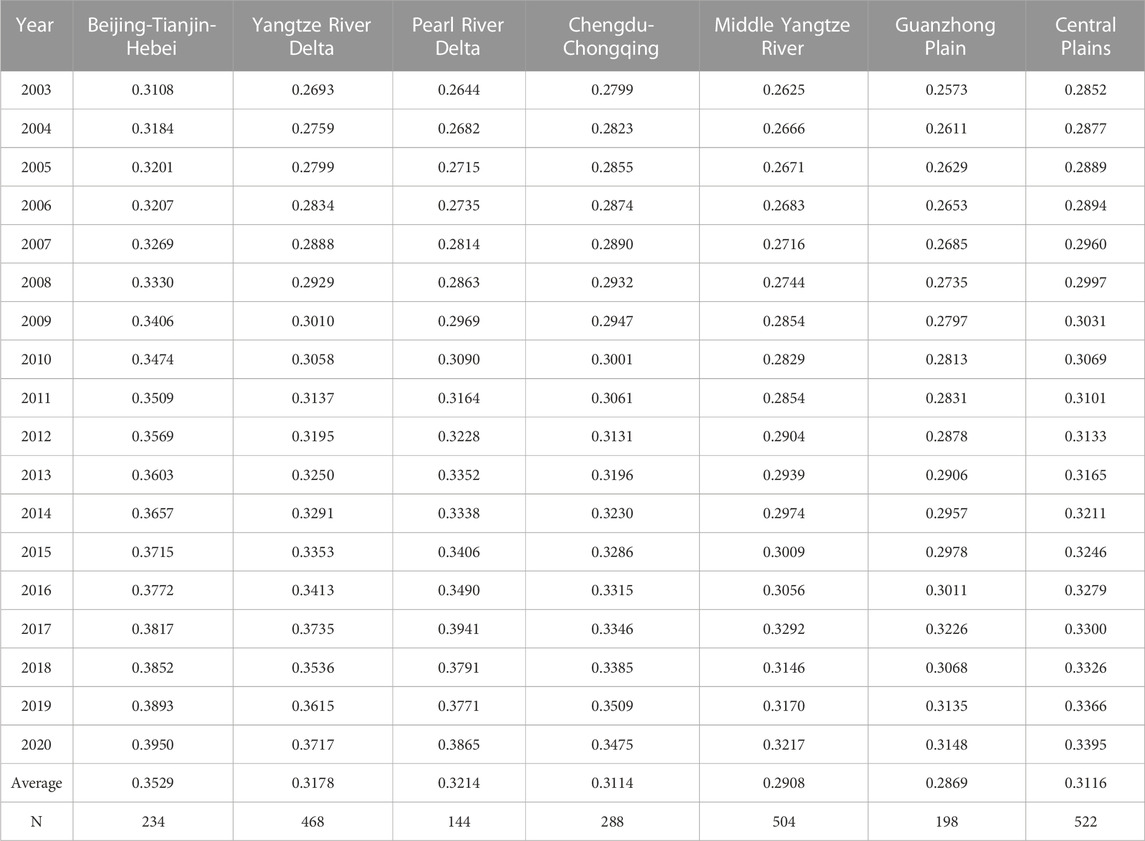
TABLE 6. The coupling coordination of science and technology finance and green development in China’s seven urban agglomerations.
The level of coupling and coordination between science, technology, finance and green development in Chengdu-Chongqing and Central Plains is relatively close, belonging to the second ladder level at the level of urban agglomeration. The coupling and coordination degree of the two increased from 0.2799 to 0.2852 in 2003 to 0.3475 and 0.3395, respectively, from low coupling and coordination to medium coupling and coordination. The turning point occurred in 2010 and 2009, respectively.
The coupling coordination level of the middle reaches of the Yangtze River, and the Guanzhong Plain is relatively low, belonging to the third ladder level at the level of urban agglomeration. The coupling coordination degree of the two areas has risen from 0.2625 to 0.2573 in 2003 to 0.3217 and 0.3148 in 2020, respectively, from low coupling coordination to medium coupling coordination. The turning points occurred in 2015 and 2016, respectively.
From the average value of the coupling coordination of each urban agglomeration, it is found that the average coupling coordination level of the seven urban agglomerations is ranked in the order of large to small: Beijing-Tianjin-Hebei > Pearl River Delta > Yangtze River Delta > Central Plains > Chengdu-Chongqing > Yangtze River Delta > Guanzhong Plain.
In order to further analyze the reasons for the imbalance of the coupling and coordination between science and technology finance and green development among urban agglomerations, this paper makes descriptive statistics on the comprehensive scores of science and technology finance and green development of the seven urban agglomerations in the observation period, as shown in Table 7. It can be found that the regional difference between science and technology finance is lower than that of green development. The maximum value of the average comprehensive score of science and technology finance is 0.104, and the minimum value is 0.074; that is, the maximum value is 1.41 times the minimum value. The maximum average comprehensive score of green development is 0.174, and the minimum is 0.103; that is, the maximum is 1.69 times the minimum. The considerable difference in green development among urban agglomerations may be the key reason for the imbalance of coupling and coordination between science and technology finance and green development, which is similar to the explanation of Hou et al. (2022). The average comprehensive scores of science and technology finance and green development in Guanzhong Plain urban agglomeration are low, which leads to the lowest coupling coordination between science and technology finance and green development. The Beijing-Tianjin-Hebei urban agglomeration is the only region where the average comprehensive science and technology finance score is greater than 0.1. The enormous advantages of science and technology finance make the Beijing-Tianjin-Hebei urban agglomeration’s average coupling coordination degree rank first among the seven urban agglomerations.
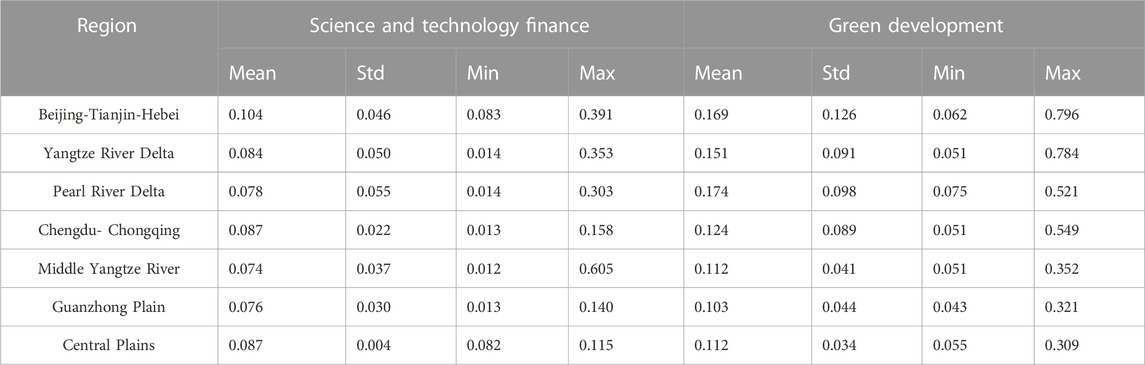
TABLE 7. Descriptive statistics of comprehensive scores of science and technology finance and green development in China’s seven urban agglomerations.
4.2 Spatial analysis of the systematic coupling between science and technology finance and green development
Based on the nested matrix of spatial economic geography, this paper verifies the spatial relevance of the coupling and coordination relationship between science and technology finance and green development by calculating Moran’s I index.
4.2.1 Overall spatial effect
Table 8 reports the overall Moran index of the coupling and coordination of science, technology, finance, and green development in 274 cities in China. During the observation period, the Moran index of coupling coordination degree was positive. However, it did not pass the 10% significance level test between 2003 and 2005, indicating no spatial autocorrelation between the coupling coordination level of early science and technology finance and green development. Since 2006, the Moran index of coupling coordination degree has begun to be significant, and the significance level is also gradually increasing. In 2010 and later, the Moran index passed the significance level of 1%. Therefore, we believe that the coordinated and interactive relationship between science and technology finance and green development positively correlates in space. At the same time, from the perspective of the evolution trend, the Moran index of the coupling and coordination degree shows an overall upward trend of fluctuation, indicating the spatial correlation between the coupling and coordination of science and technology finance and green development is growing. Guo et al. (2021) confirmed this conclusion.
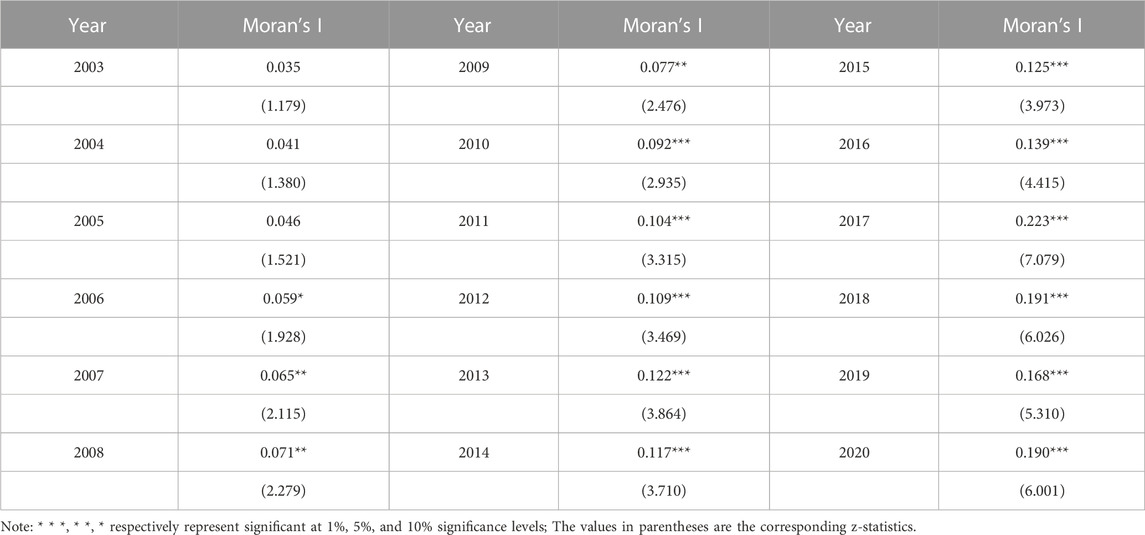
TABLE 8. Global Moran index of the coupling and coordination degree of science and technology finance and green development.
4.2.2 Spatial effect of seven urban agglomerations
Furthermore, this paper calculates the Moran index of the coupling and coordination degree of science, technology, finance, and green development of China’s seven urban agglomerations. The results are shown in Table 9. Overall, only the Beijing-Tianjin-Hebei urban agglomeration and the Yangtze River Delta urban agglomeration have significantly positive Moran exponents for coupling coordination. The Moran index of the Pearl River Delta urban agglomeration did not pass the 10% significance level test in 2018 and was significant in other years. From the value of the coefficient, the Moran index of the Yangtze River Delta urban agglomeration is increasing yearly, indicating the spatial relevance of the coupling and coordination relationship between science, technology and finance and green development in the region continues to increase. The Moran index of the Beijing-Tianjin-Hebei urban agglomeration rose slowly until 2012 but declined thereafter. The Moran index of the Pearl River Delta urban agglomeration is mainly volatile. The Moran index of Chengdu-Chongqing, the middle reaches of the Yangtze River, the Guanzhong Plain, the Central Plains, and other urban agglomerations is positive or negative. However, they have not passed the significance test, indicating no spatial correlation between the coupling and coordination of science and technology finance and green development in such urban agglomerations. To sum up, the imbalance and disharmony between science and technology finance and green development in various regions of China still exist (Tian and Wang, 2022). The development process of the coupling and coordination of science and technology finance and green development is relatively long. In the future, cities need to cooperate, improve the circulation of innovation elements, build a joint governance mechanism for the ecological environment, and jointly promote high-quality regional development (Han et al., 2021).
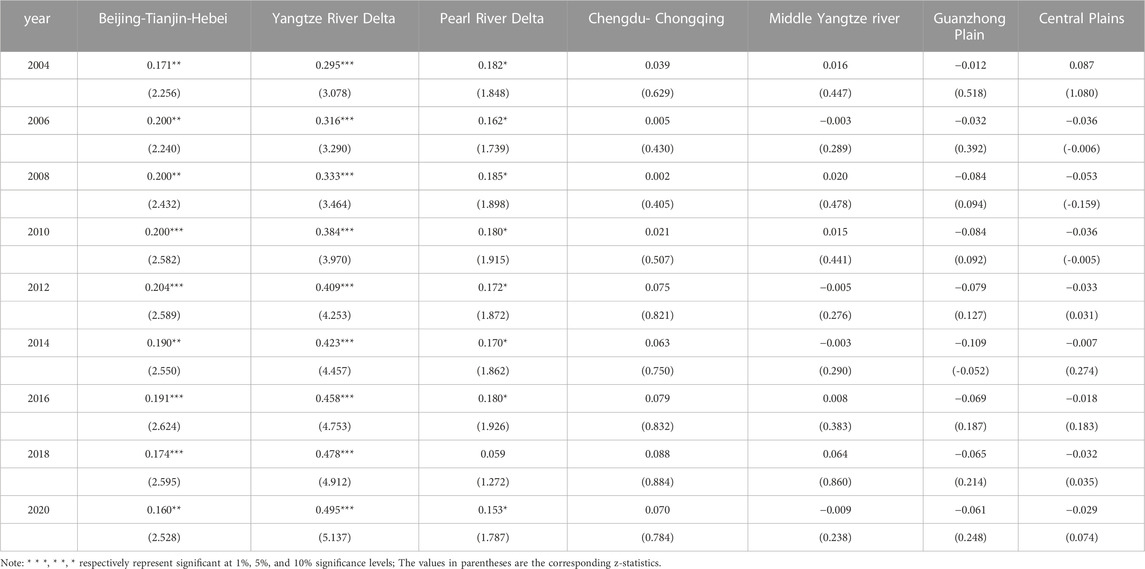
TABLE 9. The spatial relevance of the coupling coordination degree of science and technology finance and green development in China’s seven urban agglomerations.
Based on the above analysis of the Moran index of the coupling and coordination of the seven urban agglomerations, the spatial correlation of the coupling and coordination of science and technology finance and green development needs to attach importance to the development of its subsystems (Fan et al., 2019). The development of the subsystem not only refers to the development of the green economic system but also includes the development of the scientific and technological financial system. Coupling coordination’s spatial relevance can be reflected when the level of science and technology finance and green development systems is high. When both systems’ development level is low, the coupling system will fall into a “low-end equilibrium” (Lai et al., 2020). Meanwhile, combining the above analysis of the temporal properties of the coupling and coordination of the seven urban agglomerations, it can be seen that the spatial radiation effect is strong when the level of coupling and coordination between the systems is in the high-coupling regime. When the level of coupling and coordination between the two systems is low, the spatial radiation effect is also weakened (Ge et al., 2022).
4.3 The interaction between science and technology finance, green development and their coupling coordination
4.3.1 Analysis of PVAR model results
This paper estimates the GMM of the PVAR model for 274 cities, analyzes the long-term interaction between science and technology finance, green development and their coupling coordination levels, and the results are shown in Table 10. It can be seen that there is a significant positive correlation between science and technology finance lagging by one period and its current level, and the estimated coefficient is 0.214, representing that science and technology finance has a self-promoting effect.
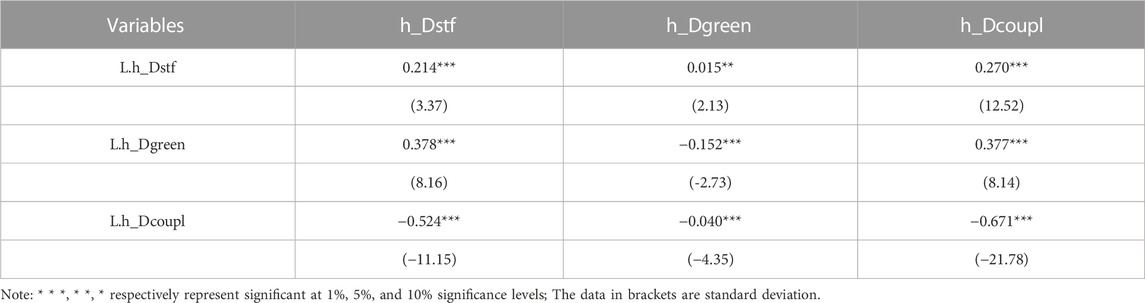
TABLE 10. GMM estimation results of PVAR model.
At the same time, it is found that the estimated coefficients of the current green development level and coupling coordination level of science and technology finance lagging by one period are 0.015 and 0.270, respectively. Both pass the 5% significance level test, indicating that science and technology finance can significantly improve urban green development and the coordinated development level between the two. The green development lagging by one period significantly negatively affects its current level. The estimated coefficient is −0.152, indicating that the green development level has a self-inhibition effect. One possible reason is that the four dimensions of green development, namely ecological construction, economic development, social welfare, and institutional supply, are still unbalanced. The estimation coefficient of green development lags by one period to the current science and technology finance level. The level of coupling and coordination is significantly positive, indicating that green development is at a higher level, requiring a higher level of science and technology finance development to serve it (Ibrahim et al., 2022). It is more conducive to coordination and progress between the two.
In addition, the coefficient of the coupling coordination lagging behind Phase 1 to the current coupling coordination level, science and technology finance and green development is significantly negative, indicating that the higher coordinated development of science and technology finance and green development in the early stage is not conducive to their respective development in the current period and the coupling coordination level between them. The possible reason is that the level of coordinated development between science and technology finance and green development is relatively high, which will restrict their development (Wang and Wang, 2021). It can be seen from the estimation coefficient of the regression of the coupling coordination level lagging behind the first period to the current science and technology finance and green development that the impact of the coupling coordination level on their development is quite different, which will also aggravate the imbalance between science and technology finance and green development.
Before equation decomposition analysis, it is necessary to ensure the stability of the PVAR model system (Apostolakis and Papadopoulos, 2019). First, calculate the unit root eigenvalue of the model and then check whether all the eigenvalues fall within the unit circle to judge the stability of the PVAR model system. The results are displayed in Figure 4. It can be seen that the three estimation points all fall within the unit circle; that is, the mean values of the three characteristic values are less than 1, implying that the impact of one variable on the other variable will gradually weaken until it disappears. The model system tends to be stable. Therefore, the PVAR model built in this paper is stable.
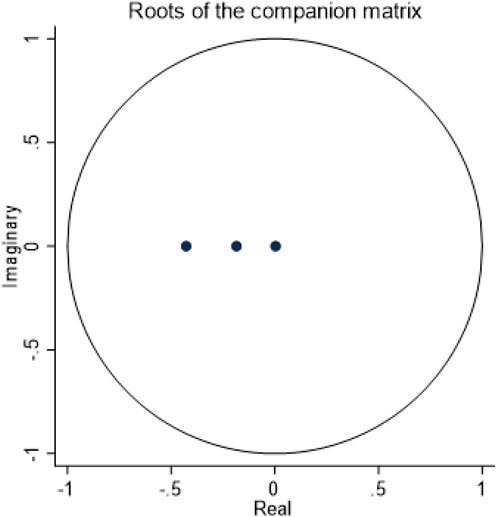
FIGURE 4. Stability test.
4.3.2 Variance decomposition
Variance decomposition is mainly used to measure the contribution of different random error terms to the fluctuation of endogenous variables. It can accurately reflect the degree of interaction between various variables (Huang et al., 2009). Therefore, to further measure the relationship between science and technology finance, green development, and their coupling and co-scheduling, this paper conducts variance decomposition for the prediction errors of all variables. The variance decomposition results can be calculated simultaneously during the impulse response function analysis. The number of periods is set as 10, and the results are reported in Table 11.
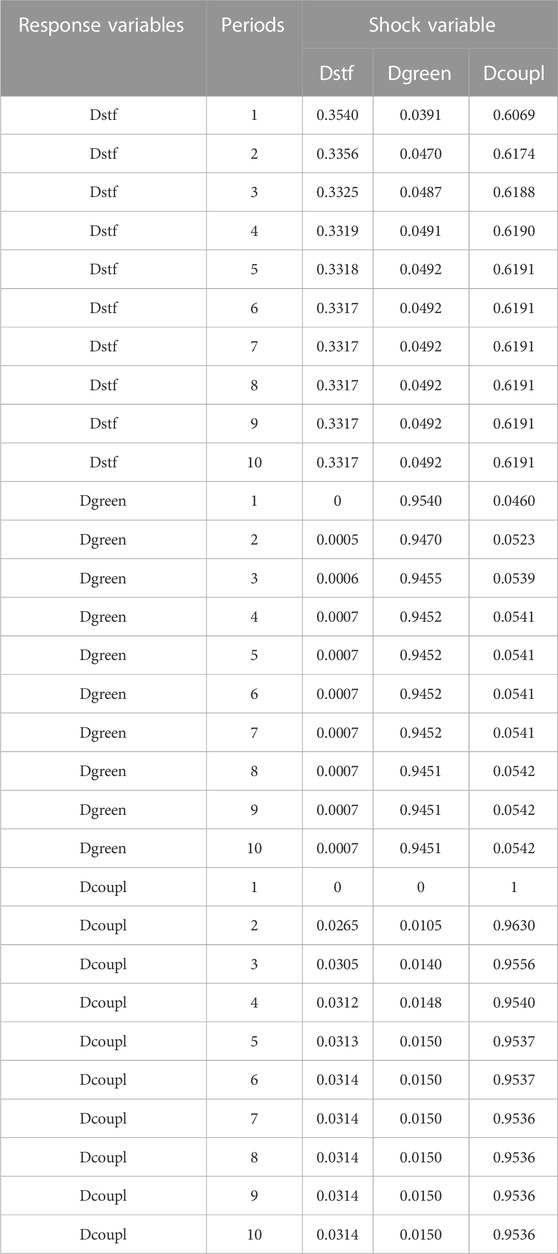
TABLE 11. Variance decomposition result.
Science and technology finance is affected by three aspects. Among them, the impact of the coupling coordination level is the main one. The impact of the first phase is 60.69% from the coupling coordination level, increasing gradually to 61.91% in the fifth phase. The self-development of science and technology finance is the second long-term influencing factor. The self-contribution of the first period is 35.4%, and the second period has weak growth, but then it decreases gradually until the sixth period is 33.17% and tends to be stable. The impact of green development is relatively small, 3.91% in the first phase, and then gradually increases to the fifth phase and tends to be stable.
Green development is mainly affected by the following two aspects: its development and the improvement of the level of coupling and coordination. The contribution of green development began to appear in the first phase and reached the maximum value, and then gradually decreased from 95.40% to 94.51% and became stable. The influence of the improvement of the coupling coordination level also appeared in the first phase and increased gradually until the eighth phase became stable, from 4.6% to 5.42%. The impact of science and technology finance is relatively small. It began contributing to green development in Phase 2 and was stable at 0.07% in Phase 4.
The coupling and coordination degree improved due to its contribution in the first phase. Since the second phase, the impact of science and technology finance and green development has gradually emerged. The impact of science and technology finance is more prominent. The influence of coupling coordination degree decreases gradually from the first phase to the seventh phase and tends to be stable. The contribution of science and technology finance and green development increased gradually from the second phase. The contribution rate of science and technology finance reached the maximum and stabilized in the sixth phase. The impact of green development on the coupling coordination degree reaches the maximum and tends to be stable when it reaches the fifth stage, with a contribution rate of 1.5%.
From the above analysis of the equation decomposition of science and technology finance, green development, and their coupling coordination degree, it can be seen that these three have mutual influence in the long run. Although science and technology finance plays a relatively minor role in improving urban green development, it is still an essential factor that cannot be ignored. The interaction between science and technology finance and the level of coupling and coordination is relatively large. Therefore, when pursuing the coordinated development of science and technology finance and green development, we should pay more attention to the development of science and technology finance (Lv et al., 2021).
5 Conclusion and policy recommendations
This paper uses the coupling coordination model to study the interaction between science and technology finance and green development and evaluate their coordinated development level. Then we adopt the PVAR model and impulse response function to examine the dynamic causal relationship between science and technology finance and green development. The research shows that.
1) The coupling coordination model calculates the coupling degree and coordination of China’s urban science and technology finance and green development. The average coupling degree results show a high correlation between them. However, the type of coupling coordination rises from low to medium in the sample period.
2) The Beijing-Tianjin-Hebei, Yangtze River Delta, and Pearl River Delta have a high level of coupling and coordination, which is at the first ladder level. Chengdu-Chongqing and the Central Plains belong to the second step, while the middle reaches of the Yangtze River and the Guanzhong Plain belong to the third step.
3) The degree of coupling and coordination between China’s urban science and technology finance and green development is generally positive spatial autocorrelation, and the spatial correlation is growing with time. Among the seven urban agglomerations, the coupling coordination degree of Beijing-Tianjin-Hebei, Yangtze River Delta and Pearl River Delta show a positive spatial autocorrelation. In contrast, the coupling coordination degree of other regions does not have a spatial correlation.
4) Science and technology finance, green development, and their coupling coordination are all affected by themselves. For science and technology finance and green development, the coupling and coordination degree impact on both is greater than the mutual impact between them. For the coupling coordination degree, the impact of science and technology finance is more significant than that of green development.
Based on the conclusions of this study, policy recommendations are presented in the following aspects. First, local governments should emphasize the positive externalities of scientific and technological financial policies on urban green development. Consider bringing cities with suitable innovation environments and substantial financial resources into the policy pilot scope. At the same time, when formulating relevant policies to promote urban green development, policymakers should actively guide various social capitals to support the green economy.
Second, considering the time-varying impact of science and technology finance policies on urban green development, local governments should formulate science and technology finance policies from a development and forward-looking perspective. In the policy implementation process, the government should give full play to its guiding role, scientifically evaluate the policy effect, and flexibly use the policy advantages to maximize the sustainable green development of the city. In addition, the introduction of policies should not be too hasty. There is a time lag between the implementation of policies and their effectiveness. Policymakers should avoid issuing too many policies of the exact nature in a short time.
Finally, differentiated policies should be formulated, considering regional imbalances in economic development and innovation. For eastern, high-level and innovative cities, it is necessary further to strengthen the combination of science and technology and finance and stimulate the policies of science and technology and finance to play a more prominent role. For cities in the central and western regions, low level and low innovation level, we should not only build a sound interaction mechanism between science and technology finance and economic development but also accelerate the introduction and application of advanced technology and give full play to its supporting role in driving urban green development.
Some study limitations must be considered when interpreting our findings. First, the evaluation indicator system and coupling model adopted in this study emphasize results and representations and lack in-depth exploration of the process mechanism. Second, the lack of data in some cities will lead to deviations in the statistical results. In our future research, we can explore the process mechanism of coupling through quantitative analysis of the internal relations between various systems. Additionally, we can use remote sensing technology, big data, and other new methods to obtain real-time relevant data to build a more comprehensive and comprehensive indicator system of science and technology finance and green development.
Data availability statement
Publicly available datasets were analyzed in this study. This data can be found here: China urban statistical yearbook, China economic net statistical database and EPS statistical database from 2003 to 2020.
Author contributions
CG: Conceptualisation, writing—original draft, formal analysis; MC: Data curation, methodology, software; YW: Visualization, investigation; CL: Writing—review and editing, supervision.
Funding
This paper is funded by the Projects of National Social Science Fund of China (20FJLB010).
Conflict of interest
The authors declare that the research was conducted in the absence of any commercial or financial relationships that could be construed as a potential conflict of interest.
Publisher’s note
All claims expressed in this article are solely those of the authors and do not necessarily represent those of their affiliated organizations, or those of the publisher, the editors and the reviewers. Any product that may be evaluated in this article, or claim that may be made by its manufacturer, is not guaranteed or endorsed by the publisher.
References
Adom, P. K., and Amuakwa-Mensah, F. (2016). What drives the energy saving role of FDI and industrialization in East Africa? Renew. Sust. Energ. Rev. 65, 925–942. doi:10.1016/j.rser.2016.07.039
Apostolakis, G., and Papadopoulos, A. P. (2019). Financial stability, monetary stability and growth: A PVAR analysis. Open Econ. Rev. 30 (1), 157–178. doi:10.1007/s11079-018-9507-y
Aqib, M., and Zaman, K. (2023). Greening the workforce: The power of investing in human capital. Archives Soc. Sci. A J. Collab. Mem. 1 (1), 31–51. doi:10.5281/zenodo.7620041
Asche, F., Roll, K. H., and Tveteras, R. (2009). Economic inefficiency and environmental impact: An application to aquaculture production. J. Environ. Econ. Manag. 58 (1), 93–105. doi:10.1016/j.jeem.2008.10.003
Bai, L., Han, Z., Ren, J., and Qin, X. (2020). Research on feature selection for rotating machinery based on supervision kernel entropy component analysis with whale optimization algorithm. Appl. Soft Comput. 92, 106245. doi:10.1016/j.asoc.2020.106245
Bergek, A., Berggren, C., Magnusson, T., and Hobday, M. (2013). Technological discontinuities and the challenge for incumbent firms: Destruction, disruption or creative accumulation? Res. Policy 42 (6-7), 1210–1224. doi:10.1016/j.respol.2013.02.009
Broughel, J., and Thierer, A. D. (2019). Technological innovation and economic growth: A brief report on the evidence. Virginia: Mercatus Research Paper.
Bryan, B. A., Gao, L., Ye, Y., Sun, X., Connor, J. D., Crossman, N. D., et al. (2018). China’s response to a national land-system sustainability emergency. Nature 559 (7713), 193–204. doi:10.1038/s41586-018-0280-2
Cao, H., You, J. X., Lu, R., and Chen, H. Y. (2011). Empirical research on finance of science and technology development index in China. Chin. Manag. Sci. 19 (03), 134–140. doi:10.16381/j.cnki.issn1003-207x.2011.03.020
Cao, J., Law, S. H., Samad, A. R. B. A., Mohamad, W. N. B. W., Wang, J., and Yang, X. (2021). Impact of financial development and technological innovation on the volatility of green growth—Evidence from China. Environ. Sci. Pollut. R. 28 (35), 48053–48069. doi:10.1007/s11356-021-13828-3
Chen, J., Cheng, J., and Dai, S. (2017). Regional eco-innovation in China: An analysis of eco-innovation levels and influencing factors. J. Clean. Prod. 153, 1–14. doi:10.1016/j.jclepro.2017.03.141
Cheng, M., Li, Q., and Wen, Z. (2023). Coupling coordination degree analysis and driving factors of innovation network and eco-efficiency in China. Environ. Impact Asses. 99, 107008. doi:10.1016/j.eiar.2022.107008
Coe, D. T., and Helpman, E. (1995). International R&D spillovers. Eur. Econ. Rev. 39 (5), 859–887. doi:10.1016/0014-2921(94)00100-e
Dietz, T., and Rosa, E. A. (1994). Rethinking the environmental impacts of population, affluence and technology. Hum. Ecol. Rev. 1 (2), 277–300.
Dunn, S. (2002). Hydrogen futures: Toward a sustainable energy system. Int. J. Hydrogen Energ. 27 (3), 235–264. doi:10.1016/s0360-3199(01)00131-8
Elmassah, S., and Mohieldin, M. (2020). Digital transformation and localizing the sustainable development goals (SDGs). Ecol. Econ. 169, 106490. doi:10.1016/j.ecolecon.2019.106490
Fan, Y., Fang, C., and Zhang, Q. (2019). Coupling coordinated development between social economy and ecological environment in Chinese provincial capital cities-assessment and policy implications. J. Clean. Prod. 229, 289–298. doi:10.1016/j.jclepro.2019.05.027
Feng, H., and Yang, F. (2023). Does environmental psychology matter: Role of green finance and government spending for sustainable development. Environ. Sci. Pollut. R., 1–15. doi:10.1007/s11356-022-24969-4
Feng, X. M., Yin, Q., and Zhang, Y. F. (2022). Research on coupling relationship between sci-tech finance and industrial structure upgrading in China. Sci. Tec. Manag. R. 42 (01), 79–85.
Gao, C., Song, P., Wen, Y., and Yang, D. (2022). Effect of science and technology finance policy on urban green development in China. Front. Env. Sci. 10, 918422. doi:10.3389/fenvs.2022.918422
Ge, K., Zou, S., Lu, X., Ke, S., Chen, D., and Liu, Z. (2022). Dynamic evolution and the mechanism behind the coupling coordination relationship between industrial integration and urban land-use efficiency: A case study of the Yangtze River Economic zone in China. Land 11 (2), 261. doi:10.3390/land11020261
Guo, H., Cen, X., Luo, T., and Zhang, Y. (2021). Research on the spatio-temporal coupling level measurement and influencing factors of rural population structure and financial resource allocation. Macroeconomics 6, 146–160. doi:10.16304/j.cnki.11-3952/f.2021.06.013
Guo, H., Yi, X., Pan, C., Yang, B., and Li, Y. (2021). Analysis on the temporal and spatial features of the coupling and coordination of industrialization and agricultural green development in China during 1990–2019. Int. J. Env. Res. Pub. He. 18 (16), 8320. doi:10.3390/ijerph18168320
Han, Y. N., Ge, P. F., and Zhou, B. L. (2021). Evolution and differentiation of coupling coordination between technological innovation and green development in Chinese cities. Econ. Geogr. 41 (6), 12–19. doi:10.15957/j.cnki.jjdl.2021.06.002
Hou, C., Chen, H., and Long, R. (2022). Coupling and coordination of China's economy, ecological environment and health from a green production perspective. Int. J. Environ. Sci. Te. 19 (5), 4087–4106. doi:10.1007/s13762-021-03329-8
Hou, H., Zhu, Y., Wang, J., and Zhang, M. (2022). Will green financial policy help improve China’s environmental quality? The role of digital finance and green technology innovation. Environ. Sci. Pollut. R. 30, 10527–10539. doi:10.1007/s11356-022-22887-z
Hu, J., Li, G., and Zhu, F. (2017). Regional financial developments and research and development investment-cash flow sensitivity: Evidence on Chinese public high-tech companies. Int. Rev. Financ. 17 (4), 627–643. doi:10.1111/irfi.12122
Hu, S., Zeng, G., Cao, X., Yuan, H., and Chen, B. (2021). Does technological innovation promote green development? A case study of the Yangtze River Economic Belt in China. Int. J. Env. Res. Pub. He. 18 (11), 6111. doi:10.3390/ijerph18116111
Hua, J., Shi, M. Y., and Wang, Y. F. (2021). Technology finance, industrial structure optimization and regional ecological efficiency: Empirical analysis based on spatial econometric model. J. Tec. Econ. 40 (05), 16–26.
Huang, F., Jin, L., and Sun, X. (2009). Relationship between scale of higher education and economic growth in China. Asian J. Soc. Sci. 5 (11), 55–60. doi:10.5539/ass.v5n11p55
Huang, J. (2019). “Relationship between science and technology finance and economic growth—based on VAR model,” in International Conference on Big Data Analytics for Cyber-Physical-Systems, China, 28-29 December 2019.
Huang, L., and Wu, C. Q. (2019). Industrial green development efficiency and spatial driven mechanism in cities of the Yangtze River Economic Belt. China Popul. Resour. Environ. 29 (08), 40–49.
Hübler, M., and Keller, A. (2010). Energy savings via FDI? Empirical evidence from developing countries. Environ. Dev. Econ. 15 (1), 59–80. doi:10.1017/s1355770x09990088
Ibrahim, R. L., Ozturk, I., Al-Faryan, M. A. S., and Al-Mulali, U. (2022). Exploring the nexuses of disintegrated energy consumption, structural change, and financial development on environmental sustainability in BRICS: Modulating roles of green innovations and regulatory quality. Sustain. Energy Techn. 53, 102529. doi:10.1016/j.seta.2022.102529
Irfan, M., Razzaq, A., Sharif, A., and Yang, X. (2022). Influence mechanism between green finance and green innovation: Exploring regional policy intervention effects in China. Technol. Forecast. Soc. 182, 121882. doi:10.1016/j.techfore.2022.121882
Jiang, Y., Tian, S., Xu, Z., Gao, L., Xiao, L., Chen, S., et al. (2022). Decoupling environmental impact from economic growth to achieve Sustainable Development Goals in China. J. Environ. Manage. 312, 114978. doi:10.1016/j.jenvman.2022.114978
Jin, P. Z., Zhang, Y. B., and Peng, X. (2014). The double-edged effect of technological progress in carbon dioxide emissions reduction: Empirical evidence from 35 sub-industrial sectors in China. Stud. Sci. Sci. 32 (05), 706–716. doi:10.16192/j.cnki.1003-2053.2014.05.006
Khan, M. (2023). Shifting gender roles in society and the workplace: Implications for environmental sustainability. Politica 1 (1), 9–25. doi:10.5281/zenodo.7634130
Kim, S. Y. (2019). Hybridized industrial ecosystems and the makings of a new developmental infrastructure in East Asia’s green energy sector. Rev. Int. Polit. Econ. 26 (1), 158–182. doi:10.1080/09692290.2018.1554540
Lai, Z., Ge, D., Xia, H., Yue, Y., and Wang, Z. (2020). Coupling coordination between environment, economy and tourism: A case study of China. Plos One 15 (2), e0228426. doi:10.1371/journal.pone.0228426
Lin, B., and Moubarak, M. (2014). Renewable energy consumption–economic growth nexus for China. Renew. Sust. Energ. Rev. 40, 111–117. doi:10.1016/j.rser.2014.07.128
Liu, Y. C., Shen, W. K., and Liu, L. J. (2021). A study on the dynamic coupling coordination degree between science and technology finance and advanced manufacturing innovation development. Econ. Probl. 12, 36–43. doi:10.16011/j.cnki.jjwt.2021.12.007
Lv, C., Shao, C., and Lee, C. C. (2021). Green technology innovation and financial development: Do environmental regulation and innovation output matter? Energ. Econ. 98, 105237. doi:10.1016/j.eneco.2021.105237
Ma, L., Jin, F., Song, Z., and Liu, Y. (2013). Spatial coupling analysis of regional economic development and environmental pollution in China. J. Geogr. Sci. 23 (3), 525–537. doi:10.1007/s11442-013-1026-6
Mitić, P., Fedajev, A., Radulescu, M., and Rehman, A. (2023). The relationship between CO2 emissions, economic growth, available energy, and employment in SEE countries. Environ. Sci. Pollut. Res. 30, 16140–16155. doi:10.1007/s11356-022-23356-3
Nathaniel, S. P., Murshed, M., and Bassim, M. (2021). The nexus between economic growth, energy use, international trade and ecological footprints: The role of environmental regulations in N11 countries. Energy Ecol. Environ. 6 (6), 496–512. doi:10.1007/s40974-020-00205-y
Pan, Y., and Dong, F. (2023). Green finance policy coupling effect of fossil energy use rights trading and renewable energy certificates trading on low carbon economy: Taking China as an example. Econ. Anal. Policy 77, 658–679. doi:10.1016/j.eap.2022.12.014
Perrons, D. (2004). Globalization and social change: People and places in a divided world. England: Routledge.
Rehman, A., Radulescu, M., Ahmad, F., Kamran Khan, M., Iacob, S. E., and Cismas, L. M. (2022). Investigating the asymmetrical influence of foreign direct investment, remittances, reserves, and information and communication technology on Pakistan’s economic development. Econ. Research-Ekonomska Istraživanja, 1–21. doi:10.1080/1331677x.2022.2131591
Sharif, A., Kocak, S., Khan, H. H. A., Uzuner, G., and Tiwari, S. (2023). Demystifying the links between green technology innovation, economic growth, and environmental tax in ASEAN-6 countries: The dynamic role of green energy and green investment. Gondwana Res. 115, 98–106. doi:10.1016/j.gr.2022.11.010
Shi, A. N., and Xia, W. H. (2022). Research on the impact of science and technology finance on the development of high-tech industry in the Yangtze River Economic Belt from the perspective of industrial life cycle. Sci. Tec. Manag. R. 42 (05), 85–92.
Stahl, G. K., Brewster, C. J., Collings, D. G., and Hajro, A. (2020). Enhancing the role of human resource management in corporate sustainability and social responsibility: A multi-stakeholder, multidimensional approach to hrm. Hum. Resour. Manage. R. 30 (3), 100708. doi:10.1016/j.hrmr.2019.100708
Su, J., Su, K., and Wang, S. (2021). Does the digital economy promote industrial structural upgrading? A test of mediating effects based on heterogeneous technological innovation. Sustainability 13 (18), 10105. doi:10.3390/su131810105
Sun, H., Edziah, B. K., Sun, C., and Kporsu, A. K. (2019). Institutional quality, green innovation and energy efficiency. Energ. Policy 135, 111002. doi:10.1016/j.enpol.2019.111002
Sun, X., Gao, L., Ren, H., Ye, Y., Li, A., Stafford-Smith, M., et al. (2018). China’s progress towards sustainable land development and ecological civilization. Landsc. Ecol. 33 (10), 1647–1653. doi:10.1007/s10980-018-0706-0
Tao, C. Q., Yi, M. Y., and Wang, C. S. (2023). Coupling coordination analysis and Spatiotemporal heterogeneity between data elements and green development in China. Econ. Anal. Policy 77, 1–15. doi:10.1016/j.eap.2022.10.014
Tian, L. T., and Wang, S. T. (2022). Coupling and coordinated development between technological innovation and ecological environment in the Pearl River Delta region. Acta Ecol. Sin. 42 (15), 6381–6394.
Usman, M., and Hammar, N. (2021). Dynamic relationship between technological innovations, financial development, renewable energy, and ecological footprint: Fresh insights based on the STIRPAT model for asia pacific economic cooperation countries. Environ. Sci. Pollut. R. 28 (12), 15519–15536. doi:10.1007/s11356-020-11640-z
Usman, M., Radulescu, M., Balsalobre-Lorente, D., and Rehman, A. (2022). Investigation on the causality relationship between environmental innovation and energy consumption: Empirical evidence from EU countries. Energ. Environ. 0958305X221120931. doi:10.1177/0958305X221120931
Wang, X., and Wang, Q. (2021). Research on the impact of green finance on the upgrading of China's regional industrial structure from the perspective of sustainable development. Resour. Policy 74, 102436. doi:10.1016/j.resourpol.2021.102436
Wang, X. W., Xie, M. L., and Tian, Y. Q. (2022). Calculation of technology finance efficiency and influencing factor analysis in digital economy era. Sci. Technol. Manag. R. 42 (02), 61–69.
Wu, F., Hu, H. Z., Lin, H. Y., and Ren, X. Y. (2021). Enterprise digital transformation and capital market performance: Empirical evidence from Stock Liquidity. Manag. World 27 (07), 130–144+10. doi:10.19744/j.cnki.11-1235/f.2021.0097
Xu, R. J., Long, Z. W., and Yao, X. Y. (2015). Efficiency evaluation research of development technology and finance based on DEA-Malmquist index method. Sci. Technol. Manag. R. 35 (13), 188–191.
Xu, X., Wang, M., Wang, M., Yang, Y., and Wang, Y. (2023). The coupling coordination degree of economic, social and ecological resilience of urban agglomerations in China. Int. J. Env. Res. Pub. He. 20 (1), 413. doi:10.3390/ijerph20010413
Xu, Y. (2022). The strategy of how to deeply integrate technology and finance in the internet environment. J. Environ. Public Hea. 5018160. doi:10.1155/2022/5018160
Xue, W., Hu, B., and Wei, S. (2022). Deepen combination of science, technology and finance to empower enterprises to carry out high-quality innovation. Bull. Chin. Acad. Sci. 37 (9), 1206–1215. doi:10.16418/j.issn.1000-3045.20220715004
Yang, J. (2017). Research on the relationship between new urbanization and the scale and specialization of agricultural industry: Based on PVAR method. Financ. Econ. 4, 65–76.
Yin, K., Zhang, R., Jin, X., and Yu, L. (2022). Research and optimization of the coupling and coordination of environmental regulation, technological innovation, and green development. Sustainability 14 (1), 501. doi:10.3390/su14010501
Yin, X., and Xu, Z. (2022). An empirical analysis of the coupling and coordinative development of China's green finance and economic growth. Resour. Policy 75, 102476. doi:10.1016/j.resourpol.2021.102476
York, R., Rosa, E. A., and Dietz, T. (2003). STIRPAT, IPAT and ImPACT: Analytic tools for unpacking the driving forces of environmental impacts. Ecol. Econ. 46 (3), 351–365. doi:10.1016/s0921-8009(03)00188-5
Zhang, Y., Pu, Y. J., and Chen, L. T. (2013). Urbanization and service industry agglomeration: A view based on system coupling interaction. China Ind. Econ. 6, 57–69.
Zhao, J. (2008). Research on the financing of small and medium enterprises. Int. J. Bus. Manag. 3 (11), 171–174. doi:10.5539/ijbm.v3n11p171
Keywords: science and technology finance, green development, coupling coordination degree, spatial effect, PVAR model
Citation: Gao C, Cao M, Wen Y and Li C (2023) Coupling and interaction between science and technology finance and green development: Based on coupling coordination degree model and panel vector autoregression model. Front. Environ. Sci. 11:1090998. doi: 10.3389/fenvs.2023.1090998
Received: 06 November 2022; Accepted: 20 February 2023;
Published: 28 February 2023.
Edited by:
Xiaowei Chuai, Nanjing University, ChinaReviewed by:
Baogui Xin, Shandong University of Science and Technology, ChinaAbdul Rehman, Henan Agricultural University, China
Khalid Zaman, The University of Haripur, Pakistan
Copyright © 2023 Gao, Cao, Wen and Li. This is an open-access article distributed under the terms of the Creative Commons Attribution License (CC BY). The use, distribution or reproduction in other forums is permitted, provided the original author(s) and the copyright owner(s) are credited and that the original publication in this journal is cited, in accordance with accepted academic practice. No use, distribution or reproduction is permitted which does not comply with these terms.
*Correspondence: Chenqi Li, bGNxMjAyMDA4QDEyNi5jb20=