 Adnane Beniaich1*
 Wilfred Otten2
 Ho-Chul Shin3Hannah V Cooper3
 Jane Rickson2Aziz Soulaimani1
 Mohamed El Gharous1
- 1Agricultural Innovation and Technology Transfer Center (AITTC), Mohammed VI Polytechnic University, Ben Guerir, Morocco
- 2School of Water, Energy and Environment, Cranfield University, Bedford, England
- 3Sustainable Soils and Crops, Rothamsted Research, Harpenden, England
Soil hydraulic properties are an important factor to optimize and adapt water management for a given crop. Pedotransfer functions (PTFs) present a solution to predict soil variables such as hydraulic properties, using fundamental soil properties. In this research, we compared two sources of soil information: iSDAsoil data and field data, in four regions in Morocco. We then used this data to evaluate published data and developed new PTFs using soil information to estimate soil gravimetric moisture content at saturation (w0), field capacity (w330) and permanent wilting point (w15000). A total of 331 samples were collected from four regions: Doukkala, Gharb-Loukous, Moulouya and Tadla. The data was divided into calibration and validation datasets. For development of different PTFs, we used simple linear regression, multiple linear regression, regression tree, Cubist algorithm, and random forest approaches. PTFs developed by Dijkerman (Geoderma, 1988, 42, 29–49) presented the best performance, showing lower RMSE, Bias and MAE compared to other PTFs. Using multiple linear regression to develop PTFs, models based on clay, silt and soil organic matter as input variables showed the best performance after calibration (R2 of 0.590, 0.785, 0.786 for w0, w330, and w15000, respectively). Regarding the techniques based on machine learning, random forest showed the best performance after calibration compared with other algorithms (R2 of 0.930, 0.955, 0.954 for w0, w330, and w15000, respectively). PTFs represent a low cost and easy technique to estimate soil hydraulic properties, to improve water management efficiency for the farmers.
1 Introduction
Agricultural intensification coupled with changing climate are causing soils to become increasingly vulnerable to stresses; of particular concern and importance is the effect of drought. Specifically, within African countries that presented large agricultural areas with arid and semi-arid climates, and low water availability for agriculture. These countries are characterized by high soil diversity and limited financial resources (Diop et al., 2022).
During the last decades, water scarcity has become an important issue in African agriculture, due to the high space-temporal variability of rainfall, elevated rate of evaporation, groundwater depletion, and continuing degradation of water quality. Therefore, irrigation management is crucial for sustainable water use by increasing water use efficiency, water productivity, and reducing water waste. Scientists developed several models based on soil characterization and other parameters to help the farmers in deciding different irrigation strategies to be adopted. These models include SPAW model (Saxton and Willey, 2005), the AquaCrop model (Steduto et al., 2009), and the IRRINET model (Mannini et al., 2013). They use principally data related to soil hydraulic properties and water retention curve (Strati et al., 2018).
The water retention curve (WRC) is a soil hydraulic property that describes the behavior of water storage in the soil in different tensions, giving the relationship between matric potential and soil water content at equilibrium (Klute, 1986). Two specific points in this WRC are important: field capacity (FC) and permanent wilting point (PWP). FC corresponds to the upper limit of available water in the soil, which can be determined in the laboratory by evaluating soil water content at a matric potential of -33 kPa in almost all of the soils (Cassel and Nielsen, 1986). Soil moisture at FC corresponds to the optimum hydraulic condition for plant growth, by allowing higher absorption of water and nutrients by the plants. PWP corresponds to lower limit of available water in the soil. At this stage, the soil still contains some water, but it is difficult for the roots to extract it from the soil (Rai et al., 2017). Therefore, available water capacity (AWC) for each soil type is defined as the amount of water retained between the FC and PWP.
Standard methods for determining soil hydraulic properties (WRC, FC, and PWP) are performed in the laboratory using a series of equilibria between water in the soil sample and matric potential applied. At each equilibrium, the volumetric or gravimetric water content of the soil is determined and paired with a value of the matric potential. Several methods are used to measure soil hydraulic properties with different ranges of matric potential, such as the hanging water column, the pressure cell, the long Column, the Pressure Plate Extractor, and the Suction Table (Klute, 1986).
Soil hydraulic properties have different applications compared to agriculture and environment. Such as its use in smart irrigation monitoring to define the amount of water, and to define the starting time of irrigation events, principally based on the FC as the upper limit of soil moisture in the soil and lower threshold value at management allowable depletion, which presents 40–50% of AWC depending on climate conditions, soil, and crop demands (Allen et al., 1998). AWC can be used also as an indicator of water storage (Reynolds et al., 2002), for modeling of water drainage (Pires et al., 2008), and for water flow forecasting (Zhuang et al., 2017). However, determination of soil hydraulic properties is a time consuming task given the high variability of the soil and the limited number of laboratories carrying out this type of analysis across Africa (Gupta and Larson, 1979).
In some cases, soil properties modelled using pedotransfer functions (PTFs) can present a solution to overcome the limitation of infrastructure and facilities. PTFs are predictive models based on statistical techniques to estimate soil properties. These models use easily measurable soil properties (soil texture and soil organic matter) to predict complex soil properties. Several PTFs were developed to estimate different soil properties such as bulk density (Brahim et al., 2012; Sevastas et al., 2018), soil erodibility (Zhu et al., 2022), cation exchange capacity (Enang et al., 2022), and soil hydraulic properties (Rudiyanto et al., 2021; Amorim et al., 2022; Acevedo et al., 2023).
In African conditions, the development, and evaluation of a PTF is needed because the continent presents a high diversity and variability of soil and there are only a few laboratories that have the capacity and resources to perform the analysis of hydraulic soil properties. The development of PTFs on regional and continental scales is very limited. Few works focused on the development of PTFs for African soils. The first study that developed PTFs on this continent was the research conducted by Pidgeon (1972), which involved 44 soil samples of Ferratilic soil from Uganda. This research used multiple regression equations to estimate field capacity and permanent wilting point from soil texture and Soil Organic Matter (SOM). Later, Lal (1978), Aina and Periaswamy (1985), and Dijkerman (1988) developed PTFs to estimate available water-holding capacity from soil texture, bulk density, and SOM. Further, Botula et al. (2012) presented pedotransfer functions for predicting water retention of soils in Lower Congo. This research was performed using 60 samples mainly from sandy soil using PTFs developed in tropical and temporal regions.
Moreover, according to the literature, there are two approaches used by the researchers in the development of PTFs regarding soil data information used. Firstly, can be used specific dataset related to soil sampled from the study area. Almost of PTFs developed for African soil used soil data generated in a specific study or project (e.g., PTFs developed by Lal (1978) using 199 samples of Nigerian soil, PTFs developed by Dijkerman (1988) using 166 samples from 13 regions in Sierra Leone). Secondly, PTFs have been developed regional or continental soil information databases (e.g., Hydrophysical Database for Brazilian Soils (Brazil) (Ottoni et al., 2018), Grenoble Catalogue of Soils for French soils - GRIZZLY (Haverkamp et al., 1997), Unsaturated Soil Hydraulic Database for the soils the United States - UNSODA (Nemes et al., 2001)).
The lack of soil information in Africa is a constraint for the development of sustainable agriculture, improvement of crops management systems, and reducing yield-gap (Maynard et al., 2022). Technological progress and digital soil mapping have allowed the production of soil maps with high resolution and low cost. However, the use of this technologies is limited in Africa, due to unavailability of soil information at national or regional scales (Bodenstein et al., 2022). Chen et al. (2022) reported that publications related to soil mapping are less than 10% in this continent. Despite several projects trying to map the soils of Africa, there are only few studies evaluating this product by the final users (Maynard et al., 2022).
Therefore, this study aimed: 1) to evaluate published pedotransfer functions for their application to Moroccan soils, 2) to assess whether the improvement can be obtained by fitting new equations and models using regressions and machine learning algorithms, and 3) to compare soil hydraulic properties estimate with PTF’s and soil data from the iSDA with those using measured soil data.
2 Material and methods
2.1 Study area
The study area spans four important agricultural areas in Morocco, which have a marked contrast regarding ecological, pedological and climate condition. These regions are: Doukkala, Gharb-Loukous, Tadla and Moulouya (Figure 1).

FIGURE 1. Location of study areas and sampling regions in Morocco.
Doukkala is a region located in the west-central Morocco, covering an area of 1,328,500 ha. Agricultural area is 428,000 ha, divided into rainfed agriculture (75%) and irrigated agriculture (25%) (Doumali and Ibno Namr, 2018). This region is characterized by a semi-arid Mediterranean climate, with rainy winter and dry summer. Rainfall distribution is irregular throughout the months and years, with an annual average of about 322 mm, mostly occurring from October to February. The soils of the region are constituted by six types: poorly developed soils (16.5%), vertisols (30%), calcimagnetic soils (9.4%), isohumic soils (36%), soils with iron sesquioxides (6.7%), and hydromorphic soils (1.4%) (Doumali and Ibno Namr, 2018).
Gharb-Loukous region is constituted by the plain of Gharb and the watershed of Loukous. Gharb -Loukous region is in the northwest Morocco. It is a large plain with very flat relief and an altitude bellow 50 m (Bounouira et al., 2018). Agricultural area is 616,000 ha, divided into rainfed agriculture (40%) and irrigated agriculture (60%). This region is impacted by the oceanic influence, and according to Emberger classification, it is a subhumid bioclimatic stage with temperate winter with a gradual transition to the semi-arid level going east (FAO, 2015). Gharb plain is constituted by the following soil types: poorly developed soils (33%), vertisols (57%), hydromorphic soils (8.5%), and calcimagnetic soils (1.5%).
Moulouya region is located in the lower of the Moulouya watershed, which is the largest watershed in North Africa (Tovar-Sánchez et al., 2016). Climate in the basin is typically Mediterranean to semi-arid, characterized by large variability in precipitation with yearly accumulated values ranging between 230 and 380 mm.
Tadla region is in the central Morocco, with an area of 360,000 ha constituted by the Tadla plain. The average altitude is 400 m. The climate is arid to semi-arid. The dry season extends from April to October, while the wet season occurs during the period from October to March. The summer is very hot because of the scorching winds from the south-west called Chergui which raises the temperatures above 40°C. Tadla plain is constituted by the following soil types: isohumic (83%), calcimagnetic soils (11%), and hydromorphic soils (6%).
2.2 Soil sampling
Disturbed soil, sampled from topsoil (0–20 cm). We selected to sample the topsoil because this layer presents the layer most affected by the soil management systems principally the alteration in soil organic matter, compared deeper layers. The samples were collected from four agricultural regions in Morocco and georeferenced using a handheld GPS (model Garmin GPSMAP 64s), with a resolution of 3.65 m. These samples were collected in different periods from 2019 to 2022. Total of 331 samples were collected from four regions in Morocco: Doukkala (78 samples), Gharb-Loukous (116 samples), Moulouya (73 samples), and Tadla (74 samples). Location of studied regions is shown in Figure 1. In the laboratory, samples were air-dried, crushed, mixed, and sieved through 2-mm mesh. Soil samples were classified following the USDA soil texture classification, and the textural triangle was plotted using R package soil texture ‘soiltexture’ (Moeys et al., 2018).
2.3 Soil physical and chemical analysis
Determination of soil organic carbon was performed using sulfochromic oxidation of carbon in a mixture of potassium dichromate (K2Cr2O7) and sulphuric acid (H2SO4) at of 135°C, according to Walkley and Black (1934). Particle size distribution was conducted using a hydrometer method (Bouyoucos, 1962), using a sodium hexametaphosphate with a concentration of 5% as dispersing solution, and recording the hydrometer reading at 40 s, 2 h, 4 h, 6h, and 24h. Soil water content at field capacity (FC) and permanent wilting point (PWP) were measured following the methodology proposed by Klute (1986). Disturbed samples using approximately 40 g of soil put in soil rings (0.053 m of diameter and 0.01 m of height) without packeting. Soil samples were saturated by capillarity with water up to two-thirds of the ring height, and submitted after saturation, to the matric potentials of -33 kPa (FC) and -1,500 kPa (PWP) (Klute, 1986; Vomocil, 1986). The use of disturbed samples to determine FC and PWP was used in different previous studies (Shaykewich, 1970; Jong et al., 1983). Available water capacity for plants (AWC) was calculated using the Equation (1). Water content at saturation, FC and PWP is expressed in gravimetric moisture content as mass of water by mass of dry soil, presented by w0 at saturation, w330 at FC, and w15000 at PWP.
2.4 Soil map acquisition and processing
The field dataset was compared with the regional soil information iSDAsoil dataset, which was from a soil map published by Hengl et al. (2021), with 30 m of resolution. To obtain soil information regarding clay, sand, silt, and total soil organic carbon, digital soil maps were downloaded from the site https://www.isda-africa.com/isdasoil/. For the calculation of the soil organic matter (SOM) from total soil organic carbon, we used the factor of 1.724 by multiplying the total soil organic carbon to obtain SOM (Khatoon et al., 2017). To avoid the effect of spatial autocorrelation, we used average nearest neighbor analyses to remove spatially correlated data (Fortin et al., 2001). After this selection, 282 samples were kept from 331, to compare between both sources of data (field and iSDAsoil); for the modeling all samples (331) were included.
2.5 Pedotransfer functions (PTFs)
PTFs were evaluated based on gravimetric soil moisture. We selected PTFs used and tested in different studies from literature to predict soil moisture at field capacity (w330) and permanent wilting point (w15000) (Pidgeon, 1972; Lal, 1978; Arruda et al., 1987; Dijkerman, 1988). The selection of PTFs was based on the selection of PTFs that used soil texture, and soil organic matter as input variables, and gravimetric soil moisture as output. PTFs assessed in this study are summarized in Table 1.
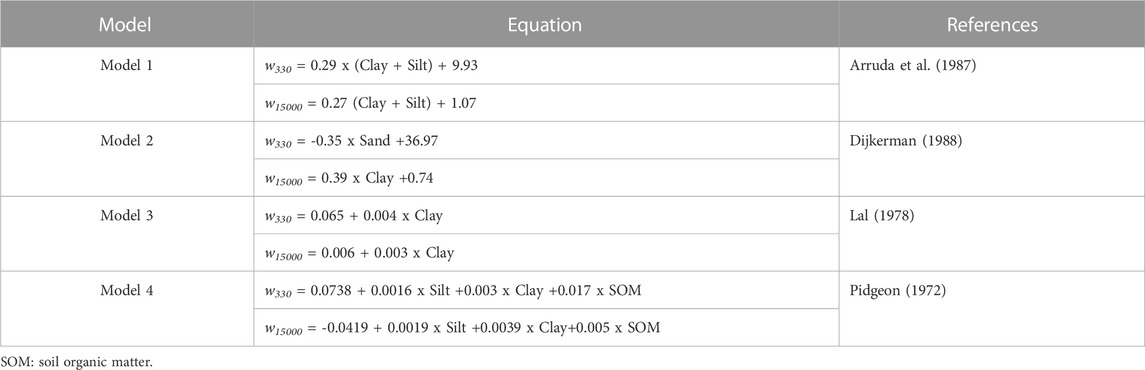
TABLE 1. Selected PTFs from literature to predict soil moisture at field capacity (w330) and permanent wilting point (w15000) using water expressed in gravimetric moisture (g.g−1).
2.6 Calibration and validation procedures of PTFs
For the evaluation of the PTFs, we followed two procedures. The first procedure is the calibration procedure by building models using the equation developed by other authors, selected in the Table 1 (Contreras and Bonilla, 2018). The second procedure is the validation procedure, by changing the parameters of the PTF equation (Contreras and Bonilla, 2018). Soil database was separated in two subsets, 50% of samples were used for calibration, and 50% of samples were used for validation. Random numbers were generated to split and to select points from each subset as recommended by Minasny and McBratney (2002), using R software (R Core Team, 2017).
2.7 Machine learning techniques
In general, the PTFs were based on simple linear regression, to look for the relationship between the estimated variable and an available soil information property (soil texture or soil organic matter). We tested different models of simple linear regressions using different soil properties using the version 4.1.3 of R software (R Core Team, 2017). In addition, we tested new PTFs by using multiple linear regression following a stepwise procedure. For this, we included all soil variables in the model, then we selected models that presented high coefficient of determination (R2) and significant p-value. Furthermore, we evaluated models based on machine learning and non-linear algorithms such as regression tree, Cubist algorithm and random forest.
Regression tree was described by Breiman et al. (1984), as an algorithm using a binary recursive partitioning to split the data into partitions or branches, and then continues splitting each partition into smaller groups as the method moves up each branch.
Random forest is an algorithm constructed using an ensemble of decision trees. The tree is created randomly from different samples of rows and different sample of features is selected for splitting. Each tree performed its own individual prediction, then the prediction of the model is averaged using the prediction of each tree (Breiman, 2001).
Cubist algorithm is a rule-based model based on the predictors used in previous splits, and the prediction is made at the terminal node. Linear models are used at each step of the tree, and the tree is reduced to a set of rules (Kuhn and Johnson, 2013).
These algorithms were performed using the specific R packages and adjusted parameters following the methodology used by Cueff et al. (2021). Regression tree was carried out using “rpart” package (Therneau et al., 2022); the minimum number of observations that must exist in a node was 50 (minsplit = 50). Cubist algorithm was performed using “cubist” package (Kuhn et al., 2022), using the following parameters: number of rules by node (rules = 5). The predictions rules are adjusted to value of extrapolation of 5 (extrapolation = 5), number of the models used (committees = 1). Random forest was performed using “randomForest” package (Liaw and Wiener, 2018), using the following parameters: number of trees in the model (ntrees = 1,000), number of variables in each node (node size = 10), and number of variables randomly sampled in each division (mtry = 2).
2.8 Evaluation of the PTFs performance
The evaluation of the PTFs performances was carried out using different metrics: coefficient of determination (R2) (Eq.2), mean absolute error (MAE) (Eq.3), and root mean square error (RMSE) (Eq.4), BIAS (Eq.5), and the concordance correlation coefficient (CC) (Eq.6). All statistical analysis and modeling equations were performed using the version 4.1.3 of R (R Core Team, 2017).
where Ŷi is predicted value for observation i, Yi is observed value for i, Ȳ is the average for soil variable selected, n is the number of observations.
where
3 Results and discussion
3.1 Preliminary analysis of the dataset
Soil texture distribution is presented in Figures 2, 3 following the USDA classification. Clay is the dominant class (38.07%), followed by Clay Loam (20.24%) and Sandy Clay Loam (9.97%), representing the different soil textures which could be present in arid and semi-arid regions (Figure 3). Figure 4 shows the results of hydraulic properties in different sampled regions. Soil hydraulic properties presented the same trend comparing the four regions, increasing from left to right side of the textural triangle (Figure 3). However, the lower values of w0 and w330 were in Doukkala region, 0.55 g g−1 and 0.15 g g−1 respectively (Figure 4). Though, the highest values were in Gharb-Loukous region with value of 0.76 gg−1 and 0.30 gg−1, respectively. Moulouya region presented the highest value of AWC of 0.11 gg−1. In other words, the results show that both the w330 and w15000 increase with decreasing of soil particle size.
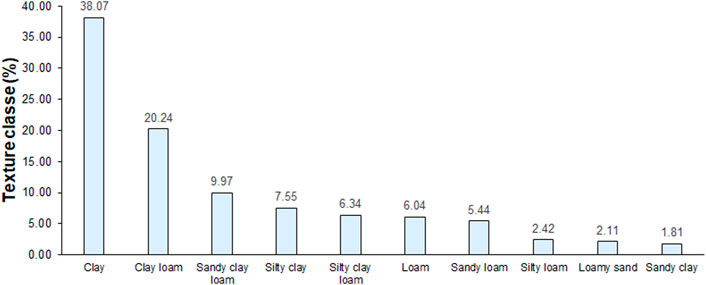
FIGURE 2. Distribution of texture classes of soil samples for all regions.
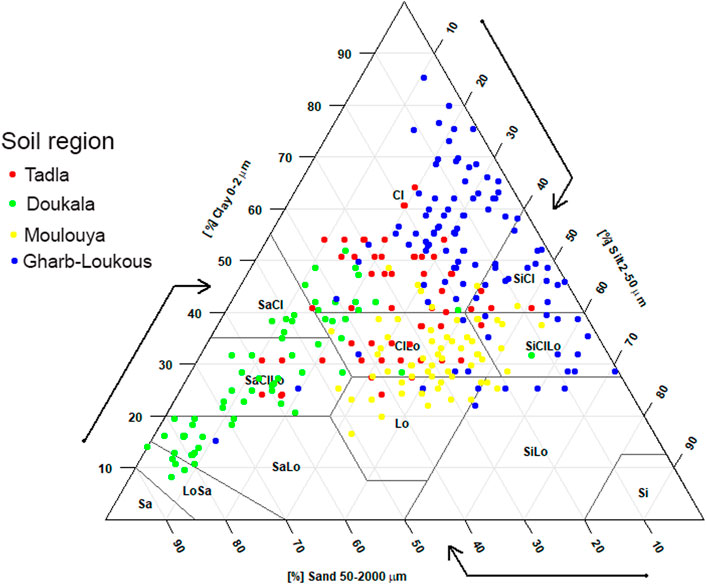
FIGURE 3. Soil texture of the collected samples plotted by soil region based on USDA texture classification.
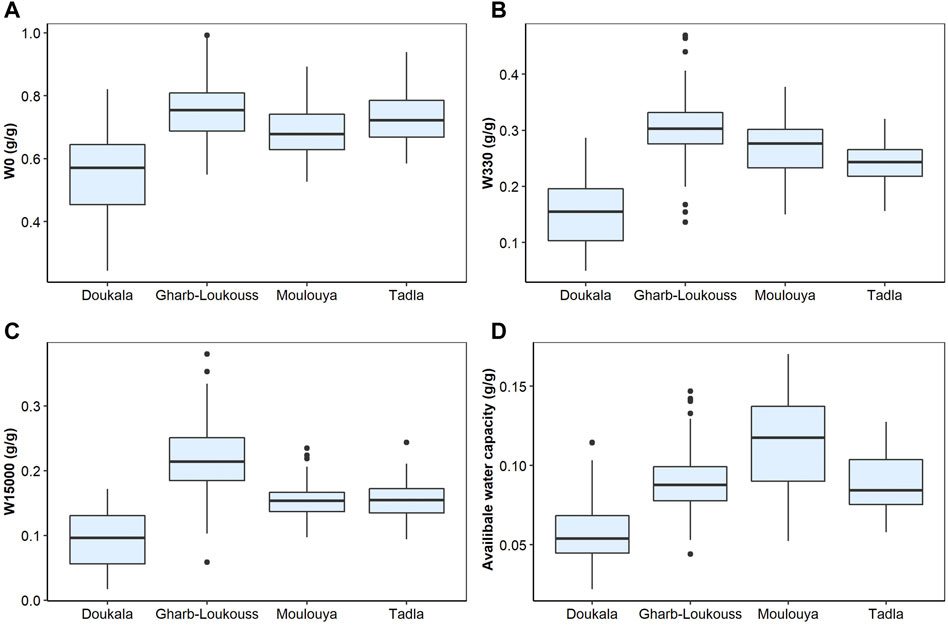
FIGURE 4. Gravimetric water content at (A) saturation (w0), (B) field capacity (w330), (C) wilting point (w15000), and (D) available water capacity for different regions in Morocco.
3.2 Comparison between iSDAsoil and field dataset
In general, field data have a high variability when comparing the coefficient of variation (CV), and the classification of soil variability established by Oku et al. (2010), which classifies soil variability in the following classes: low variability (CV: 0%–15%), medium variability (CV: 16%–35%), high variability (CV>36%).
For the Doukkala region, iSDAsoil dataset presented low variability, with CV less than 15% in all soil properties studied. In Table 2, it is observed that the CV is higher than 35% for clay, silt, and SOM in the collected samples of the Doukkala region. Gharb-Loukous region presented the same trend regarding the low variability in soil information used from iSDAsoil dataset. However, the field data presented high variability with values of CV of 85.16%, 38.16%, and 40.01% in the sand, silt, SOM, respectively. In the Moulouya region, moderate variability was observed in the clay fraction in field data and iSDAsoil dataset. Regarding the field data, this region presented lower soil variability when compared to other regions. In the Tadla region, low variability in all soil properties in iSDAsoil data, contrariwise moderate to high variability was observed in the field data. In general, in all studied regions, iSDAsoil dataset tended to underestimate clay and silt content, and overestimate sand content and SOM (Table 2).
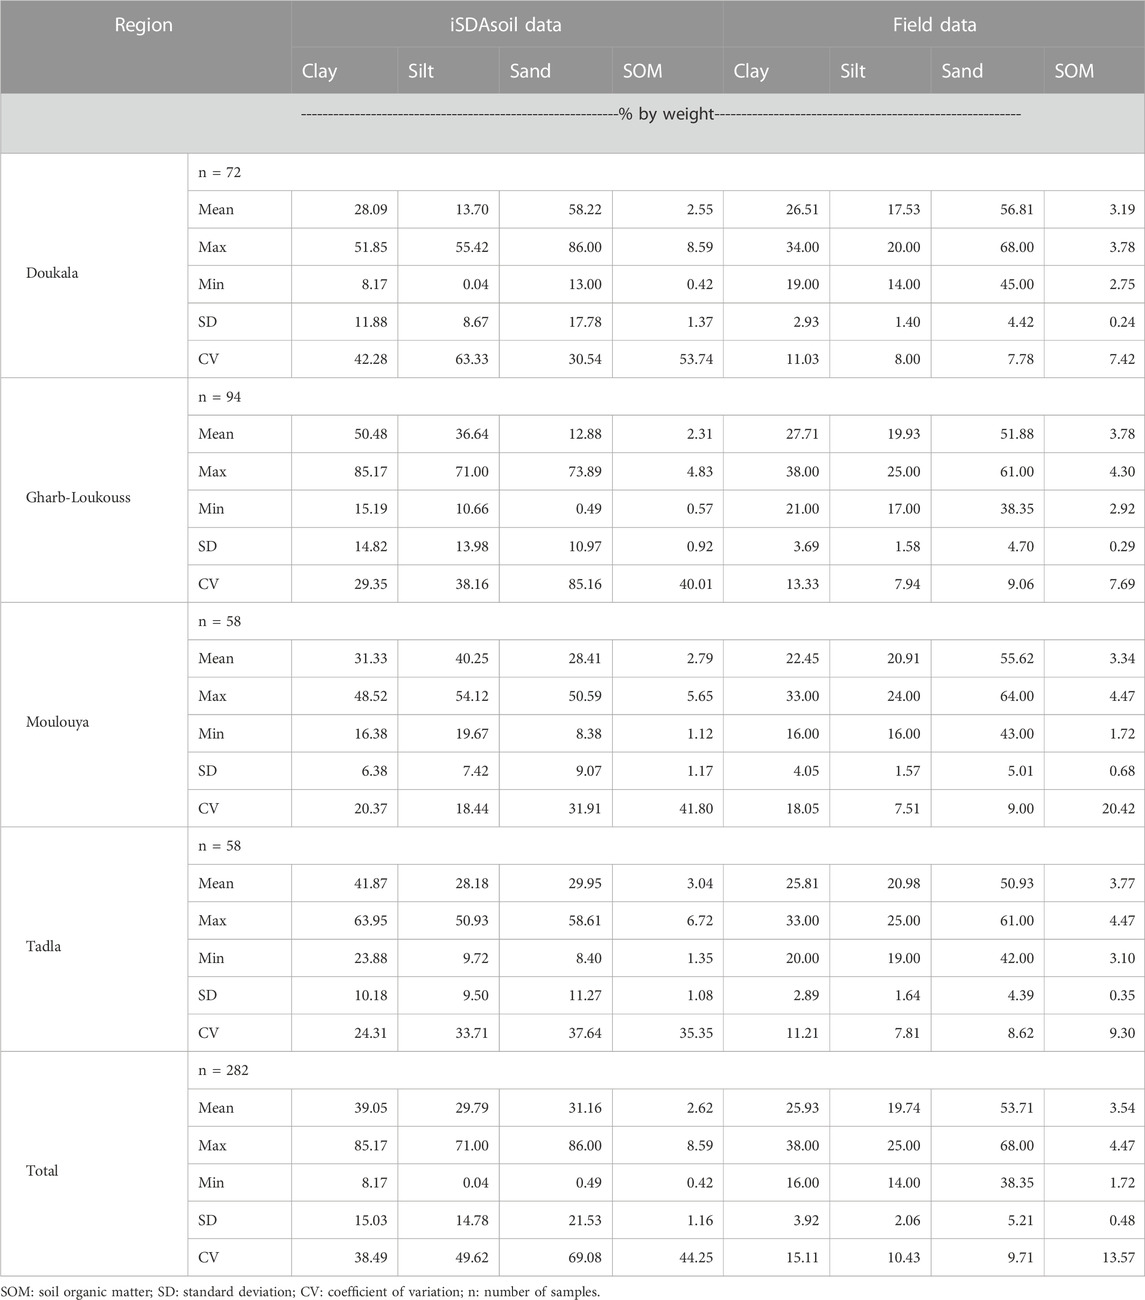
TABLE 2. Descriptive statistics of the soil sampled from four regions in Morocco (282 samples).
Regarding the performance of iSDAsoil data among studied regions, Gharb-Loukous region presented higher value of RMSE and MAE in all soil variables, principally for clay with RMSE 27.32%. According to Minai et al. (2021), clay prediction in digital soil mapping is based on the position on landscape using the information derived from digital elevation model. High clay content was predicted in flat depositional area and low clay contend in the alluvial area characterized by slopy and erosional landscape. We noted high clay content in the studied soil compared with Mediterranean soils, which could be explained by the position in landscape of the sampling points, as described in previous sections the studied regions constituted by plains and flat landscape. Field dataset with similar results were obtained by Eljebri et al. (2019) in the Doukkala region.
3.3 Evaluation of the performance of iSDAsoil data
ISDAsoil data presents an ambitious project of mapping African soil with 30 m of resolution. This project was modelled using a machine learning framework with a compilation of 150,000 soil samples and different covariate layers representing information related to land cover, land use, land surface temperature, digital terrain parameters and bioclimatic variables.
Different criteria of evaluation of the performance of iSDAsoil data (predicted) and field data (observed) are presented in Table 3, comparing studied variables in the four regions. Silt showed lower values of RMSE and MAE. RMSE ranged from 11.22% to 27.32%, 9.34%–20.92%, 16.44%–40.31%, and 1.37% to 1.86, for clay, silt, sand, and SOM, respectively. Gharb-Loukous region presented highest values of RMSE and MAE in all soil variables, and the lower values are presented in the Moulouya region and Doukkala region. Regarding the SOM, Tadla region presented low values of RMSE (1.37%) and MAE (1.17%).
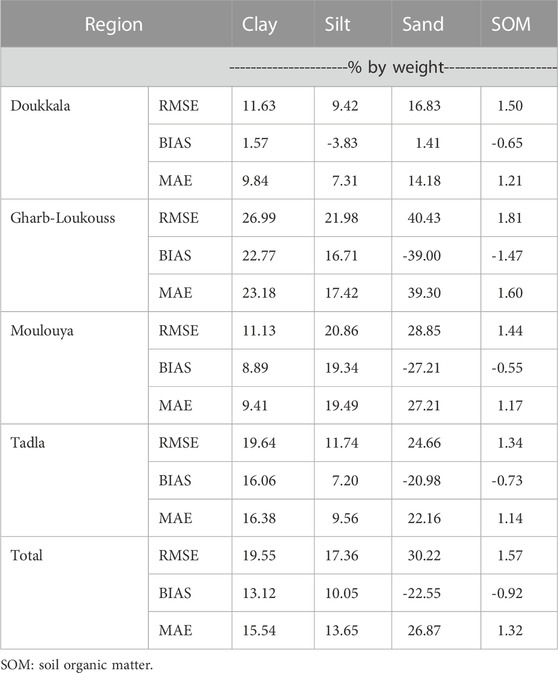
TABLE 3. Evaluation of the performance of iSDAsoil data compared to field data using root mean square error (RMSE), BIAS, mean absolute error (MAE).
Variables used in the present study had a good accuracy and performance (Hengl et al., 2021). Using this iSDAsoil dataset allowed to predict hydraulic properties with different accuracies. However, iSDAsoil data tended to overestimate soil moisture content using PTFs, that could be explained by the overestimation of the soil properties used as input variables in the models. In addition, PTFs developed and selected presented the same trend regarding the performance in both data (iSDAsoil and field data).
The comparison between field and iSDAsoil data showed high values of RMSE and MAE in the Gharb-Loukous region. The clay soil in Gharb-Loukous region is a Vertisol formed on marl or on alluvial and colluvial material, as described by Moussadek et al. (2017), with clay content that could reach 80%. The solum formed by marl can reach several meters before finding a calcareous crust or a sandy horizon (Moussadek et al., 2017). However, the soils in Doukkala region are clay sandy soil as confirmed by ours results (Moussadek et al., 2017). Low accuracy to predict SOM could be explained by under-representation of the studied regions, and soil organic carbon dynamic in the soil, affected by the soil management system, crop systems, and climate change (rainfall, temperature, and mineralization) (Hengl et al., 2021).
3.4 Evaluation of the performance of the PTFs
3.4.1 Dataset calibration
Results of the evaluation of the pedotransfer functions using the calibration dataset is shown in Table 4. Comparing different PTFs using the same parameters that constituted different PTFs as published in the literature are presented in the Table 1. PTFs developed by Dijkerman (1988) had the best performance with low errors using the RMSE, Bias and MAE, followed by the PTFs developed by Arruda et al. (1987). However, PTFs developed by Lal (1978) and Pidgeon (1972) presented high error in the prediction of hydraulic properties for Moroccan soils.
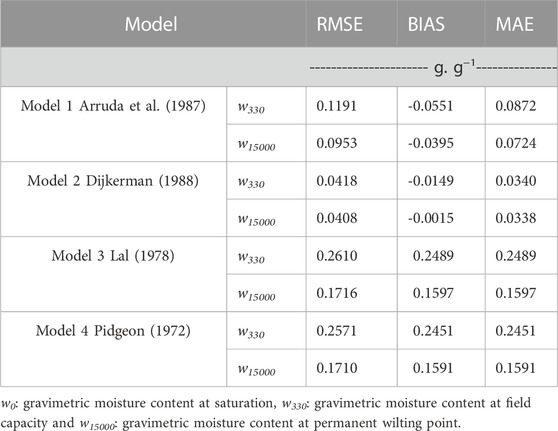
TABLE 4. Evaluation of the pedotransfer functions published using root mean square error (RMSE), BIAS, mean absolute error (MAE).
Table 5 summarized different equations using calibration dataset, for performing simple linear regression to predict gravimetric soil moisture at saturation w0, FC (w330) and PWP (w15000). The results showed that higher values were obtained using the sand content as predictor variable, with R2 values were 0.49, 0.75, and 0.72, for w0, w330, and w15000, respectively. Followed by the model constituted by clay, which had the best performance for predicting soil moisture content at PWP with value of R2 of 0.60. Other models based on SOM, silt, clay + silt, and clay/silt, presented poor performance between selected soil properties and soil hydraulic properties in the study regions.
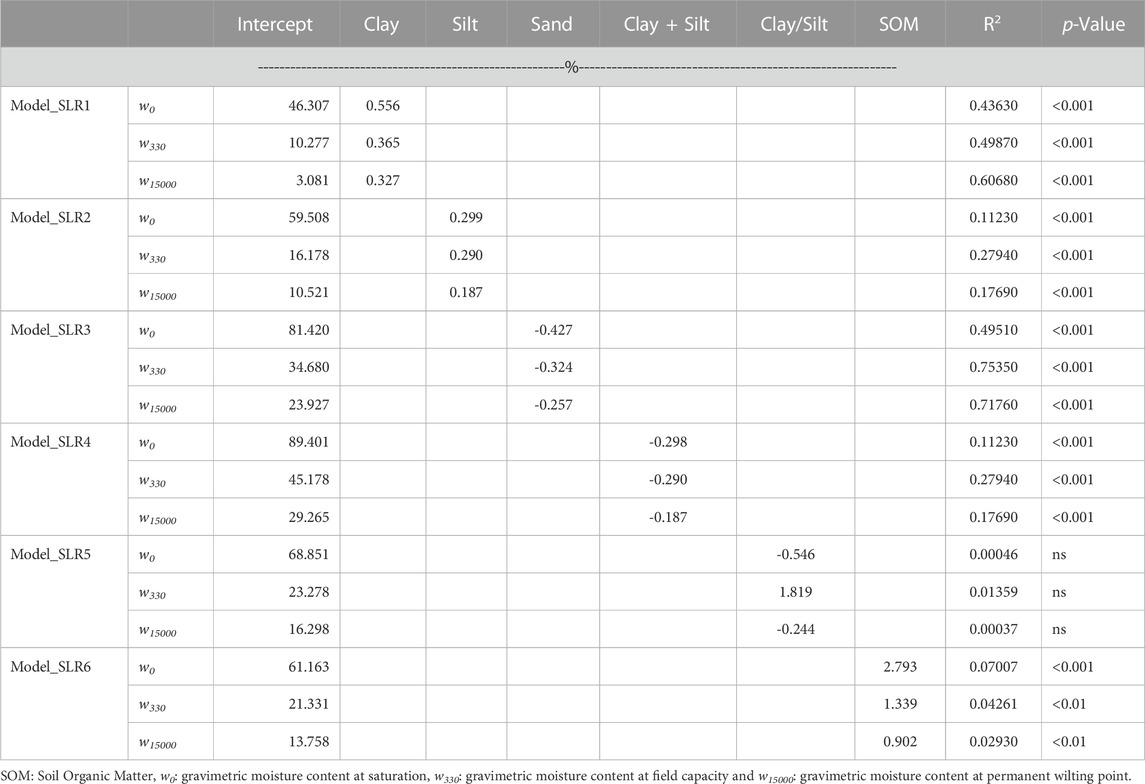
TABLE 5. Pedotransfer functions parameters using simple linear regression.
To assess the contribution of different predictor variables to estimate different soil moisture, we used the multiple linear regression, and the result is presented in Table 6. From the 30 plausible models, we kept only five models that had high R2 and significant statistical test for multiple regression (R2 ≥ 0.5 or p-value ≤0.001), as showed in Table 6. Silt and sand models presented a negative coefficient, which indicates an inverse relationship between soil moisture and silt and sand content. Model_MLR2 and Model_MLR5 presented the best performance with R2 value of 0.785 and 0.786 for predicting soil moisture content at FC and PWP, respectively. In all five selected multiple regression models the prediction of the soil moisture content at FC and PWP were better than the prediction of soil moisture at saturation.
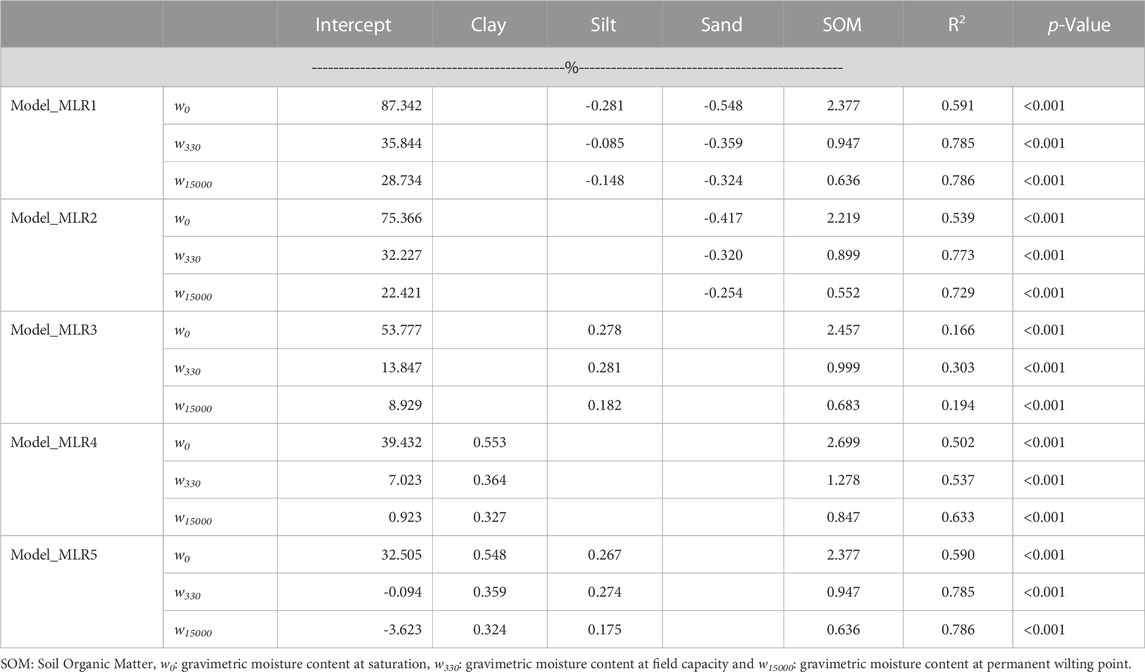
TABLE 6. Pedotransfer functions parameters using multiple linear regression.
3.4.2 Evaluation of PTF using validation dataset
Table 7 presents the performance of the PTFs using simple and multiple linear regression. For predicting w0, RMSE ranged from 0.06335 g.g−1 to 0.12844 g.g−1, while MAE ranged from 0.05143 g.g−1to 0.09719 g g−1. Regarding, w330 RMSE varied from 0.03247 g.g−1 to 0.07639 g.g−1, while MAE ranged from 0.02668 g.g−1 to 0.05961 gg−1.
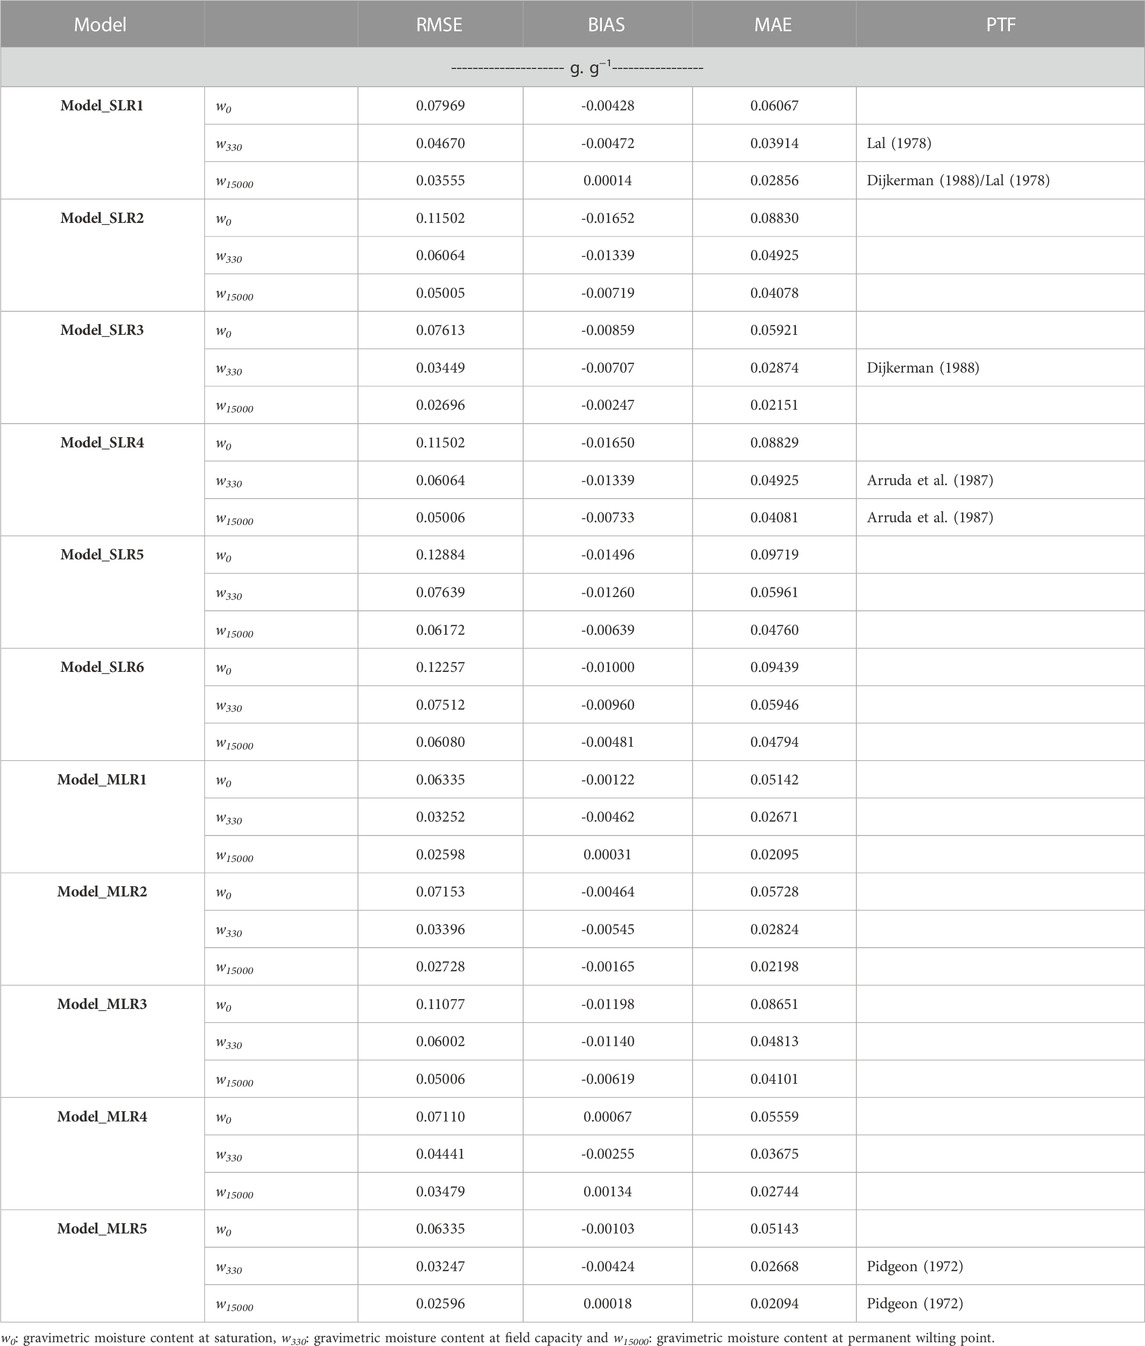
TABLE 7. Evaluation of pedotransfer functions based on simple linear regression (Model_SLR1 to Model_SLR6) and multiple linear regression (Model_MLR1 to Model_MLR5) using field data in four regions in Morocco, assessed by root mean square error (RMSE), BIAS, mean absolute error (MAE).
For w15000 estimation, RMSE was between 0.02596 g.g−1and 0.06172 g.g−1, and MAE varied from 0.02094 g.g−1 to 0.04794 g.g−1. Overall, w0 is more difficult to predict compared to w330 and w15000, showing high error. However, RMSE and MAE were higher in w0 compared to other soil moisture levels.
For w0 prediction, the lower values of RMSE and MAE were obtained using the Model_SLR3 for simple linear regression model with values of RMSE and MAE of 0.07613 g.g−1 and 0.05921 g.g−1, respectively. Using multiple linear regression two models presented good performance for predicting soil water content at saturation (w0): Model_MLR1 and Model_MLR5, with values of RMSE of 0.06335 g g−1 for both models.
For w330 prediction, using simple linear regression the Model_SLR3 presented the best performance with value of RMSE and MAE of 0.03449 g g−1 and 0.02874 g g−1, respectively. The model_SLR3 corresponded to PTF developed by Dijkerman (1988) for the prediction of soil moisture at FC.
Regarding the use of simple linear regression to develop PTFs, the results showed that the best performance was presented by model formed by sand as input variables, followed by the model constituted by clay. Botula et al. (2012) found that Dijkerman (1988) and Pidgeon (1972) performed the best result for estimating at FC and PWP. This result indicated that sand content is the major determining variable for predicting soil moisture in these soils for low absolute value of matric potentials and can be explained by the mechanisms of water retention in different fraction of the soil (sand and clay).
Water retention is controlled in soil by two mechanisms: adsorption at surface particles and capillarity in the pores (Marshall et al., 1996). In the sand fraction of the soil, the quartz surfaces are not reactive, and water adsorption is limited to inferior surfaces of quartz, and water can be drawn in the pores by capillarity, principally. For the sand fraction, at low absolute value of matric potential the water flow is principally controlled by capillarity through pores formed by sand particles. However, in clay faction of soil, clay particles can adsorb water and the swelling can occur as consequence (Marshall et al., 1996). Therefore, high absolute value of matric potential is needed to move water in the clay fraction (Medina et al., 2002; Wang et al., 2021).
Using multiple linear regression, the best performance to predict soil water moisture at FC was obtained by the Model_SLR5 with values of RMSE and MAE of 0.03247 g.g−1 and 0.02668 g.g−1, respectively. For w15000 prediction, using the simple linear regression in Model_SLR3 as in the case of w330 pointed out the best performance with values of RMSE and MAE of 0.02696 g.g−1 and 0.02151 g.g−1, respectively. Regarding the PWP prediction using multiple linear regression, the lower error was obtained using Model_MLR5 with values of RMSE and MAE of 0.02596 g.g−1 and 0.02.094 g.g−1, respectively. Model_SLR5 corresponds to model developed by Pidgeon (1972).
The results of the evaluation of PTFs using iSDAsoil data are presented in Table 8. Overall, the results presented low level of prediction quality for all properties (w0, w330, and w15000) compared to field data. Model performance was different for each hydraulic property. For w0 predicting, iSDAsoil data tended to overestimate soil moisture at saturation, FC, and PWP, mainly using simple linear regression, observed by the positive value of BIAS. However, multiple linear regression models tended to underestimate soil hydraulic properties. Regarding the performance of different models for estimating different soil hydraulic properties, the Model_MLR5 using multiple linear regression presented the best performance, showing lower value of RMSE with values 0.08714 g.g−1, 0.03887 g.g−1, and 0.03016 g.g−1, respectively for w0, w330, and w15000. Multiple linear regression models presented best performance compared to simple linear regression.

TABLE 8. Evaluation of pedotransfer functions based on simple linear regression (Model_SLR1 to Model_SLR6) and multiple linear regression (Model_MLR1 to Model_MLR5) using iSDAsoil in four regions in Morocco, assessed by root mean square error (RMSE), BIAS, mean absolute error (MAE).
For PTFs using multiple linear regression tested in the present study, two models presented good performance. The best performance was obtained by using clay, silt, and SOM (Model_MLR5), followed by Model_MLR2 constituted by sand and SOM as predictive variables.
Figure 5 presents the comparison between different models using RMSE and MAE as criteria for w0, w330, and w15000 using field and iSDAsoil data. For field data concerning the estimation of field capacity and permanent welting point, two main groups of models can be distinguished: first group with low value of RMSE and MAE, constituted by the following models: Model_MLR5, Model_MLR1, Model_MLR4, Model_MLR2, Model_SLR1, and Model_SLR3. Second group with high value of RMSE and MAE, constituted by the following models: Model_MLR3, Model_SLR4, Model_SLR2, Model_SLR6, and Model_SLR5. Concerning iSDAsoil data, the same structure of models was presented in the prediction of w0, and w15000. However, for w330 prediction, three groups were constituted: first group formed by the models presenting lower values of RMSE and MAE, Model_SLR3, Model_MLR1, Model_MLR2, and Model_MLR5. Second group constituted a transition between model with high and low performance, this group is constituted by Model_SLR1, Model_MLR3, and Model_MLR4. Third group constituted by the same models that constituted the second group using the field data, without Model_MLR3. Different group confirmed the variability of the accuracy obtained by different models combined with different sources of data.
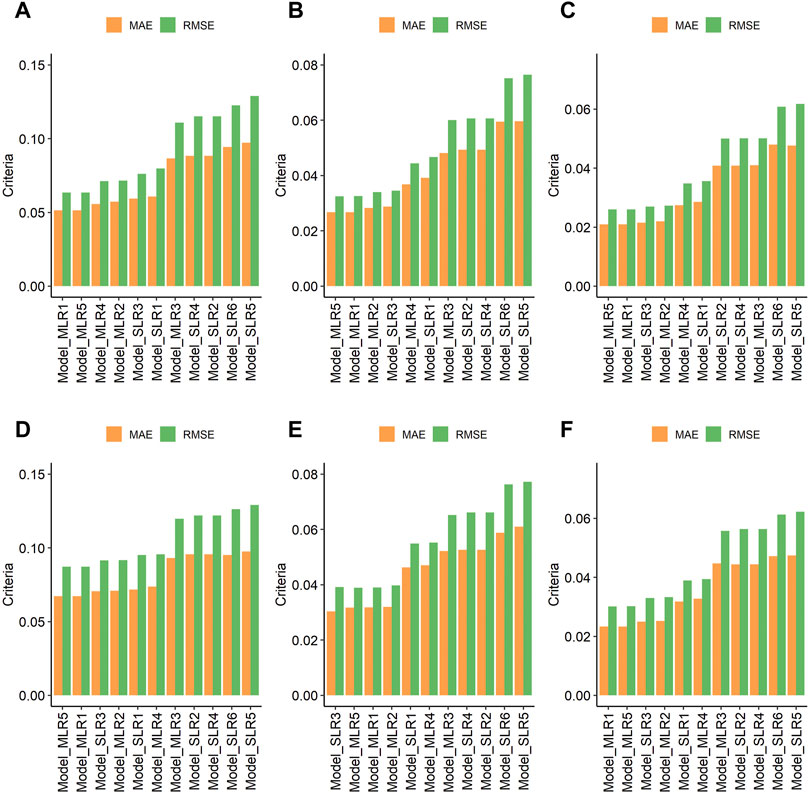
FIGURE 5. Comparison between RMSE (root mean square error) and MAE (Mean absolute error) for pedotransfer functions tested using simple linear regression (Model_SLR1 to Model_SLR6) and multiple linear regression (Model_MLR1 to Model_MLR5), for dataset based on field data (A): predicting w0; (B) predicting w330; (C) predicting w15000), and for iSDAsoil data (D): predicting w0; (E) predicting w330; (F) predicting w15000).
3.5 Machine learning to predict soil hydraulic properties
Table 9 shows results of calibration and validation of new pedotransfer functions using different algorithms. Overall, calibration dataset exhibited slight improvement compared to validation dataset for all hydraulic properties. Nevertheless, both variables w330 and w15000 presented the best performance compared to w0 in all algorithms.
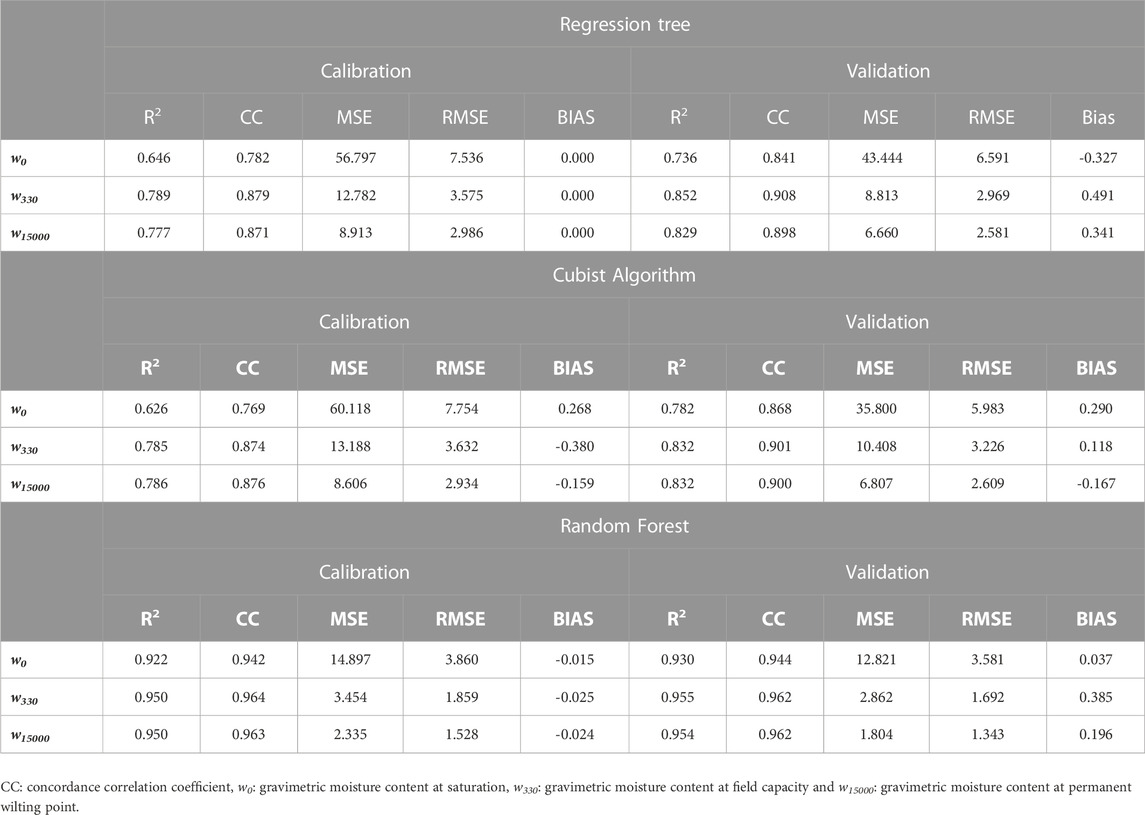
TABLE 9. Evaluation of new pedotransfer functions using regression tree, Cubist algorithm, and random forest in four regions in Morocco, assessed by the following criterion (coefficient of determination (R2), concordance correlation coefficient (CC), root-mean-square error (RMSE), BIAS, mean absolute error (MAE)).
The results revealed better performance of random forest compared to other algorithms for all properties (w0, w330, and w15000). Prediction of w0 showed low performance compared to w330 and w15000 with high value of RMSE and low value of R2. Clay presented the most important variable for the prediction of w0, w330, and w15000, with variable importance of 35.42%, 33.27% and 37.40%, respectively, followed by sand, with variable importance of 33.16%, 32.18% and 31.48%, respectively (Figure 6). Variable importance order presented almost the same behavior for all predicted properties. Clay has the most important variable. Finally, SOM was less important variable.
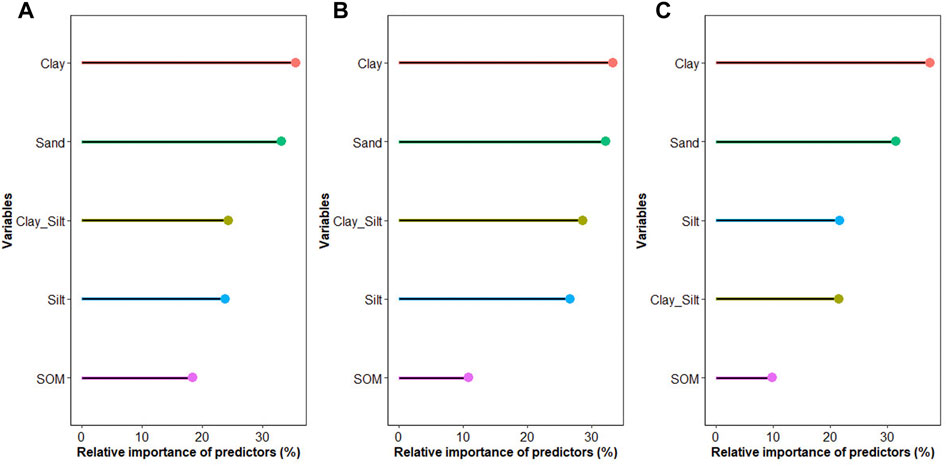
FIGURE 6. Variable importance of the predictor used in random forest models to predict soil water content: (A) at saturation (w0), (B) at field capacity point (w330), and (C) at permanent wilting point (w15000) using the following variables: Clay, Sand, Clay_Silt (clay content + silt content), silt and soil organic matter (SOM).
Regarding regression tree algorithm, the results showed R2 from 0.646 to 0.789 in the calibration dataset and ranged from 0.736 to 0.852 in the validation dataset: higher value of R2 associated with w330 prediction, medium value with w15000 prediction, and lower value with w0 prediction. Concerning Cubist algorithm, R2 ranged from 0.626 to 0.786 in calibration dataset and from 0.782 to 832 in validation dataset. In Cubist algorithm, w330, and w15000 presented the same performance and low R2 values were observed in w0 prediction.
Several studies used models based on machine learning to predict water retention properties (Lamorski et al., 2008; Al Majou et al., 2018; Kotlar et al., 2020; Cueff et al., 2021). In general, random forest presented the best performance compared to other models based on machine learning or not. For example, Kotlar et al. (2020) compared random forest with linear regression using 192 samples collected in different land used (native forest, integrated crop livestock systems and grazing pastures. Similar results were obtained by Cueff et al. (2021) regarding the performance of random forest compared to other algorithms. In the present study, random forest showed the best performance compared with regression tree and Cubist algorithm.
Performance variability and low-quality prediction of published PTFs, could be explained by different reasons: 1) lack of harmonization of the protocol used in the determination of soil moisture at field capacity and wilting point, 2) difference in sampling, quantity and representativity of soil used, 3) difference in sample size and number of replicates to perform the analysis (Román Dobarco et al., 2019; Cueff et al., 2021), and 4) difference in selected soil properties (chemical, physical and mineralogical properties) used to develop these PTFs.
3.6 PTFs development for sustainable water management
PTFs developed is this study can estimate soil hydraulic properties from soil particle size distribution, and soil organic matter, and to understand soil hydraulic pattern in Moroccan conditions. This is particularly the case in the current context of climate change impact and the increasing demand for agricultural production. Sustainable water management is still a challenge to reconcile the increasing demand for irrigation water and the optimization of the use of resources. Therefore, sustainable water management can be performed using crop water productivity models (e.g., AquaCrop), to define the net irrigation and water requirements of the crops. The estimation of soil hydraulic properties using regional PTFs could improve the accuracy and precision of these type of models, increase water use efficiency, avoid waste of water by evaporation or deep percolation. In addition, crop water productivity models request a large databases and soil information as inputs for to give good results. Soil properties estimated by PTFs could be an alternative to fill the information gap, and to run these models with low cost.
3.7 Future directions and perspectives
The present research allowed to develop PTFs for Moroccan soils, and to constitute the first database of soil hydraulic properties in the region. However, further studies are needed to improve and to upgrade the models developed in the present study to integrate other soil properties, pedological information and soil management systems, using a whole approach from the modeler to field user of soil information. In addition, there is a need to harmonize methodologies, and to develop an easily accessible database of soil information in the region. This database that could be integrated to regional or continental geographic information system, including databases of soils information, natural and climatic variables, which could be easily updated to respond to various requests from users at different levels (famers, agronomists, researchers, and decision makers).
4 Conclusion
This study aimed to evaluate a database of soil physical properties in Morocco based on field sampling. In addition, we evaluated the performance of two sources of soil information: iSDAsoil data and field data. The results showed that iSDAsoil data tended to underestimate clay, sand and silt content and overestimate SOM in studied regions. In addition, soil hydraulic properties estimated using iSDAsoil data presented an overestimation. The evaluation of selected PTFs to predict soil water content using gravimetric soil moisture at field capacity and wilting point showed that the PTFs developed by Dijkerman (1988) presented the best performance showing lower RMSE, Bias and MAE compared to other PTFs. Using multiple linear regression to develop PTFs, model based on clay, silt, and SOM as input variables showed the best performance.
In addition, new models were tested to estimate soil hydraulic properties such as random forest, regression tree and Cubist algorithm. Random forest showed the best performance compared with other algorithms. PTFs based on random forest showed that clay and sand were the predictor variable most important in the prediction, and higher value of R2 associated with w330 prediction, medium value with w15000 prediction, and lower value with w0 prediction. The use of PTFs represents a useful tool, a low-cost method, and an easy technique to estimate soil hydraulic properties, to evaluate soil water retention capacity, and to optimize water management for farmers Hounkpatin et al., 2022.
Data availability statement
The original contributions presented in the study are included in the article, further inquiries can be directed to the corresponding author.
Author contributions
Conceptualization was completed by AB and AS. The methodology was created by AB. The software modeling, and research activities were handled by AB and AS. The writing—original draft preparation was handled by AB while writing—review and editing were completed by AB, WO, HC-S, HC, JR, AS, and ME; and supervision was done by WO and ME.
Funding
This study was financially supported by OCP Group, as part of the FPO3 “Technical and practical innovations to reduce soil and water losses by improving soil physical properties”. The funder was not involved in the study design, collection, analysis, interpretation of data, the writing of this article, or the decision to submit it for publication.
Acknowledgments
The authors want to thank Mohammed VI Polytechnic University (UM6P) and OCP group, for the technical and financial support. The authors would also like to thank Younes Chitaoui and Youssef Zeroual for their support in the project coordination.
Conflict of interest
The authors declare that the research was conducted in the absence of any commercial or financial relationships that could be construed as a potential conflict of interest.
Publisher’s note
All claims expressed in this article are solely those of the authors and do not necessarily represent those of their affiliated organizations, or those of the publisher, the editors and the reviewers. Any product that may be evaluated in this article, or claim that may be made by its manufacturer, is not guaranteed or endorsed by the publisher.
Abbreviations
PTF, Pedotransfer Function; PWP, Permanent Wilting Point; AWC, Available Water Capacity; R2, Coefficient of Determination; CC, Concordance Correlation Coefficient; RMSE, Root Mean Square Error; FC, Field Capacity; SOM, Soil Organic Matter; MAE, Mean Absolute Error.
References
Acevedo, S. E., Martínez, S. I., Contreras, C. P., and Bonilla, C. A. (2023). Effect of data availability and pedotransfer estimates on water flow modelling in wildfire-affected soils. J. Hydrol. 617, 128919. doi:10.1016/j.jhydrol.2022.128919
Aina, P. O., and Periaswamy, S. P. (1985). Estimating available water-holding capacity of Western Nigerian soils from soil texture and bulk density, using core and sieved samples. Soil Sci. 140, 55–58. doi:10.1097/00010694-198507000-00007
Al Majou, H., Hassani, B., and Bruand, A. (2018). Transferability of continuous- and class-pedotransfer functions to predict water retention properties of semiarid Syrian soils. Soil Use Manag. 34, 354–369. doi:10.1111/sum.12424
Allen, R. G., Pereira, L. S., Raes, D., and Smith, M. (1998). FAO irrigation and drainage paper No. 56 - crop evapotranspiration, Food and Agriculture Organisation, 300.
Amorim, R. S. S., Albuquerque, J. A., Couto, E. G., Kunz, M., Rodrigues, M. F., Silva, L. de C. M. da, et al. (2022). Water retention and availability in Brazilian Cerrado (neotropical savanna) soils under agricultural use: Pedotransfer functions and decision trees. Soil Tillage Res. 224, 105485. doi:10.1016/j.still.2022.105485
Arruda, F., Júnior, J. Z., and Oliveira, J. (1987). Parâmetros de solo para o cálculo da água disponível com base na textura do solo. Rev. Bras. Ciência do Solo 11, 11–15.
Bodenstein, D., Clarke, C., Watson, A., Miller, J., van der Westhuizen, S., and Rozanov, A. (2022). Evaluation of global and continental scale soil maps for southern Africa using selected soil properties. Catena 216, 106381. doi:10.1016/j.catena.2022.106381
Botula, Y. D., Cornelis, W. M., Baert, G., and Van Ranst, E. (2012). Evaluation of pedotransfer functions for predicting water retention of soils in Lower Congo (D.R. Congo). Agric. Water Manag. 111, 1–10. doi:10.1016/j.agwat.2012.04.006
Bounouira, H., Embarch, K., Amsil, H., Bounakhla, M., Foudeil, S., Ait lyazidi, S., et al. (2018). Study of heavy metal assessment in the Gharb plain along Sebou river (Morocco) using k0-NAA method at the Moroccan Triga Mark II research reactor. Ann. Agrar. Sci. 16, 376–388. doi:10.1016/j.aasci.2018.08.002
Bouyoucos, G. J. (1962). Hydrometer method improved for making particle size analyses of Soils1. Agron. J. 54, 464–465. doi:10.2134/AGRONJ1962.00021962005400050028X
Brahim, N., Bernoux, M., and Gallali, T. (2012). Pedotransfer functions to estimate soil bulk density for northern Africa: Tunisia case. J. Arid. Environ. 81, 77–83. doi:10.1016/j.jaridenv.2012.01.012
Breiman, L., Jerome, F., Olshen, R. A., and Stone, C. J. (1984). “Regression trees,” in Classification and regression trees (Boca Raton, Florida: CRC Press LLC), 246–280. doi:10.4018/9781591405573.ch027
Cassel, D. K., and Nielsen, D. R. (1986). Field capacity and available water capacity. Methods Soil AnalysisPhysical Mineralogical Methods 1, 901–926. doi:10.2136/sssabookser5.1.2ed.c36
Chen, S., Arrouays, D., Leatitia, V., Poggio, L., Minasny, B., Roudier, P., et al. (2022). Digital mapping of GlobalSoilMap soil properties at a broad scale: A review. Geoderma 409, 115567. doi:10.1016/j.geoderma.2021.115567
Contreras, C. P., and Bonilla, C. A. (2018). A comprehensive evaluation of pedotransfer functions for predicting soil water content in environmental modeling and ecosystem management. Sci. Total Environ. 644, 1580–1590. doi:10.1016/j.scitotenv.2018.07.063
Cueff, S., Coquet, Y., Aubertot, J. N., Bel, L., Pot, V., and Alletto, L. (2021). Estimation of soil water retention in conservation agriculture using published and new pedotransfer functions. Soil Tillage Res. 209, 104967. doi:10.1016/j.still.2021.104967
Dijkerman, J. C. (1988). An Ustult-Aquult-Tropept catena in Sierra Leone, West Africa, II. Land qualities and land evaluation. Geoderma 42, 29–49. doi:10.1016/0016-7061(88)90021-3
Diop, M., Chirinda, N., Beniaich, A., El Gharous, M., and El Mejahed, K. (2022). Soil and water conservation in Africa: State of play and potential role in tackling soil degradation and building soil health in agricultural lands. Sustain 14, 13425. doi:10.3390/su142013425
Doumali, K., and Ibno Namr, K. (2018). The assessment of soil quality in the irrigated area in the perimeter low-service of Doukkala for the two lockers sidi bennour and sidi S’mail in Morocco. J. Life Sci. 12, 195–201. doi:10.17265/1934-7391/2018.04.005
Eljebri, S., Mounir, M., Faroukh, A. T., Zouahri, A., and Tellal, R. (2019). Application of geostatistical methods for the spatial distribution of soils in the irrigated plain of Doukkala, Morocco. Model. Earth Syst. Environ. 5, 669–687. doi:10.1007/s40808-018-0558-2
Enang, R. K., Kips, P. A., Yerima, B. P. K., Kome, G. K., and Van Ranst, E. (2022). Pedotransfer functions for cation exchange capacity estimation in highly weathered soils of the tropical highlands of NW Cameroon. Geoderma Reg. 29, e00514. doi:10.1016/j.geodrs.2022.e00514
Food and Agriculture Oraganization, (2015). Assistance technique au projet de modernisation de la grande irrigation. Food and Agriculture Organisation, Rome, Italy.
Fortin, M., Dale, M. R. T., and Hoef, J. (2001). Spatial analysis in ecology. Encycl. Environmetrics. 4, 2051-2058. doi:10.1002/9780470057339.vas039
Gupta, S. C., and Larson, W. E. (1979). Estimating soil water retention characteristics from particle size distribution, organic matter percent, and bulk density. Water Resour. Res. 15, 1633–1635. doi:10.1029/WR015i006p01633
Haverkamp, R. C., Zammit, F., Bouraoui, K., Rajkai, J. L. A., and Heckman, N. (1997). Grenoble soil catalogue: Soil survey of field data and description of particle-size, soil water retention and hydraulic conductivity functions, Laboratoire d’Etude des Transferts en Hydrologie et Environnement, 9.
Hengl, T., Miller, M. A. E., Križan, J., Shepherd, K. D., Sila, A., Kilibarda, M., et al. (2021). African soil properties and nutrients mapped at 30 m spatial resolution using two-scale ensemble machine learning. Sci. Rep. 11, 1–18. doi:10.1038/s41598-021-85639-y
Hounkpatin, K. O. L., Bossa, A. Y., Yira, Y., Igue, M. A., and Sinsin, B. A. (2022). Assessment of the soil fertility status in Benin (West Africa) – digital soil mapping using machine learning. Geoderma Reg. 28, e00444. doi:10.1016/j.geodrs.2021.e00444
Jong, R. D. E., Campbell, C. A., and Nicholaichuk, W. (1983). Water retention equations and their relationship to soil organic matter and particle size distribution for disturbed samples. Can. J. soil Sci. 63, 291–302. doi:10.4141/cjss83-029
Khatoon, H., Solanki, P., Narayan, M., Tewari, L., Rai, J., and Hina Khatoon, C. (2017). Role of microbes in organic carbon decomposition and maintenance of soil ecosystem. Int. J. Chem. Stud. 5, 1648–1656.
Klute, A. (1986). Methods of Soil Analysis, Part 1: Physical and Mineralogical Methods. American Society of Agronomy, 635–660. 5, doi:10.2136/sssabookser5.1.2ed.c26
Kotlar, A. M., de Jong van Lier, Q., and de Souza Brito, E. (2020). Pedotransfer functions for water contents at specific pressure heads of silty soils from Amazon rainforest. Geoderma 361, 114098. doi:10.1016/j.geoderma.2019.114098
Kuhn, M., Weston, S., Keefer, C., Coulter, N., and Quinlan, R. (2022). Package “cubist. https://topepo.github.io/Cubist//.
Lal, R. (1978). Physical properties and moisture retention characteristics of some nigerian soils. Geoderma 21, 209–223. doi:10.1016/0016-7061(78)90028-9
Lamorski, K., Pachepsky, Y., Sławiński, C., and Walczak, R. T. (2008). Using support vector machines to develop pedotransfer functions for water retention of soils in Poland. Soil Sci. Soc. Am. J. 72, 1243–1247. doi:10.2136/sssaj2007.0280n
Liaw, A., and Wiener, M. (2018). Package “randomForest. University of California, California, CA, USA.
Mannini, P., Genovesi, R., and Letterio, T. (2013). Irrinet: Large scale DSS application for on-farm irrigation scheduling. Procedia Environ. Sci. 19, 823–829. doi:10.1016/j.proenv.2013.06.091
Marshall, T. J., Holmes, J. W., and Rose, C. W. (1996). Soil physics, Cambridge, England: Cambridge University), 29–32.
Maynard, J. J., Yeboah, E., Owusu, S., Buenemann, M., Neff, J. C., and Herrick, J. E. (2022). Accuracy of regional-to-global soil maps for on-farm decision making: Are soil maps “good enough”, EGUsphere. 1-35. 246, doi:10.5194/egusphere-2022-246
Medina, H., Tarawally, M., del Valle, A., and Ruiz, M. E. (2002). Estimating soil water retention curve in Rhodic Ferralsols from basic soil data. Geoderma 108, 277–285. doi:10.1016/S0016-7061(02)00135-0
Minai, J. O., Libohova, Z., and Schulze, D. G. (2021). Spatial prediction of soil properties for the Busia area, Kenya using legacy soil data. Geoderma Reg. 25, e00366. doi:10.1016/j.geodrs.2021.e00366
Minasny, B., and McBratney, A. B. (2002). Uncertainty analysis for pedotransfer functions. Eur. J. Soil Sci. 53, 417–429. doi:10.1046/j.1365-2389.2002.00452.x
Moeys, J., Shangguan, W., Petzold, R., Minasny, B., Rosca, B., Jelinski, N., et al. (2018). Package ‘soiltexture’. https://github.com/julienmoeys/soiltexture.
Moussadek, R., Laghrour, M., Mrabet, R., Van Ranst, E., Badraoui, M., and Mekkaoui, M. (2017). Morocco’s Vertisol characterization (Tirs). J. Mat. Environ. Sci. 8, 3932–3942.
Nemes, A., Schaap, M. G., Leij, F. J., and Wösten, J. H. M. (2001). Description of the unsaturated soil hydraulic database UNSODA version 2.0. J. Hydrol. 251, 151–162. doi:10.1016/S0022-1694(01)00465-6
Oku, E., Essoka, A., and Thomas, E. (2010). Variability in soil properties along an Udalf toposequence in the humid forest zone of Nigeria. Kasetsart J. - Nat. Sci. 44, 564–573.
Ottoni, M. V., Ottoni Filho, T. B., Schaap, M. G., Lopes-Assad, M. L. R. C., and Rotunno Filho, O. C. (2018). Hydrophysical database for Brazilian soils (HYBRAS) and pedotransfer functions for water retention. Vadose Zo. J. 17, 1–17. doi:10.2136/vzj2017.05.0095
Pidgeon, J. D. (1972). The measurement and prediction of available water capacity of ferrallitic soils in Uganda. J. Soil Sci. 23, 431–441. doi:10.1111/j.1365-2389.1972.tb01674.x
Pires, L. F., Cássaro, F. A. M., Reichardt, K., and Bacchi, O. O. S. (2008). Soil porous system changes quantified by analyzing soil water retention curve modifications. Soil Tillage Res. 100, 72–77. doi:10.1016/j.still.2008.04.007
R Core Team (2017). R: A language and environment for statistical computing. doi:10.1007/978-3-540-74686-7
Rai, R. K., Singh, V. P., and Upadhyay, A. (2017). Planning and evaluation of irrigation projects: Methods and implementation. Plan. Eval. Irrig. Proj. Methods Implement., 1–660. doi:10.1016/B978-0-12-811748-4.00017-0
Reynolds, W. D., Bowman, B. T., Drury, C. F., Tan, C. S., and Lu, X. (2002). Indicators of good soil physical quality: Density and storage parameters. Geoderma 110, 131–146. doi:10.1016/S0016-7061(02)00228-8
Román Dobarco, M., Cousin, I., Le Bas, C., and Martin, M. P. (2019). Pedotransfer functions for predicting available water capacity in French soils, their applicability domain and associated uncertainty. Geoderma 336, 81–95. doi:10.1016/j.geoderma.2018.08.022
Rudiyanto, , Minasny, B., Chaney, N. W., Maggi, F., Goh Eng Giap, S., Shah, R. M., et al. (2021). Pedotransfer functions for estimating soil hydraulic properties from saturation to dryness. Geoderma 403, 115194. doi:10.1016/j.geoderma.2021.115194
Saxton, K. E., and Willey, P. H. (2005). The SPAW model for agricultural field and pond hydrologic simulation. Watershed Model, 400–435. doi:10.1201/9781420037432.ch17
Sevastas, S., Gasparatos, D., Botsis, D., Siarkos, I., Diamantaras, K. I., and Bilas, G. (2018). Predicting bulk density using pedotransfer functions for soils in the Upper Anthemountas basin, Greece. Geoderma Reg. 14, e00169. doi:10.1016/j.GEODRS.2018.e00169
Shaykewich, C. F. (1970). Hydraulic properties of disturbed and undisturbed soils. Can. J. Soil Sci. 50, 431–437. doi:10.4141/cjss70-056
Steduto, P., Hsiao, T. C., Raes, D., and Fereres, E. (2009). Aquacrop-the FAO crop model to simulate yield response to water: I. Concepts and underlying principles. Agron. J. 101, 426–437. doi:10.2134/agronj2008.0139s
Strati, V., Albéri, M., Anconelli, S., Baldoncini, M., Bittelli, M., Bottardi, C., et al. (2018). Modelling soilwater content in a tomato field: Proximal gamma ray spectroscopy and soil–crop system models. Agric 8, 60. doi:10.3390/agriculture8040060
Therneau, T., Atkinson, B., and Ripley, B. (2022). Package “rpart.” 1–34. Available at: https://github.com/bethatkinson/rpart. (Accessed November, 2022).
Tovar-Sánchez, A., Basterretxea, G., Ben Omar, M., Jordi, A., Sánchez-Quiles, D., Makhani, M., et al. (2016). Nutrients, trace metals and B-vitamin composition of the Moulouya river: A major North african river discharging into the mediterranean sea. Estuar. Coast. Shelf Sci. 176, 47–57. doi:10.1016/j.ecss.2016.04.006
Vomocil, J. A. (1986). “Porosity,” in Methods of soil analysis: Part 1 physical and mineralogical methods. Editor (New York, NY, USA: American Society of Agronomy), 299–314. doi:10.2134/agronmonogr9.1.c21
Walkley, A., and Black, I. A. (1934). An examination of the degtjareff method for determining soil organic matter, and a proposed modification of the chromic acid titration method. Soil Sci. 37, 29–38. doi:10.1097/00010694-193401000-00003
Wang, C., Li, S. Y., He, X. J., Chen, Q., Zhang, H., and Liu, X. (2021). Improved prediction of water retention characteristic based on soil gradation and clay fraction. Geoderma 404, 115293. doi:10.1016/j.geoderma.2021.115293
Zhu, X., Li, T., Tian, Z., Qu, L., and Liang, Y. (2022). Building pedotransfer functions for estimating soil erodibility in southeastern China. Ecol. Indic. 145, 109720. doi:10.1016/j.ecolind.2022.109720
Keywords: soil hydraulic properties, wilting point, field capacity, multiple linear regression, regression tree, cubist algorithm, random forest, ensemble classifier
Citation: Beniaich A, Otten W, Shin H-C, Cooper HV, Rickson J, Soulaimani A and El Gharous M (2023) Evaluation of pedotransfer functions to estimate some of soil hydraulic characteristics in North Africa: A case study from Morocco. Front. Environ. Sci. 11:1090688. doi: 10.3389/fenvs.2023.1090688
Received: 05 November 2022; Accepted: 20 January 2023;
Published: 08 February 2023.
Edited by:
Dionisios Gasparatos, Agricultural University of Athens, GreeceReviewed by:
Saad Shauket Sammen, University of Diyala, IraqAsish Saha, University of Burdwan, India
Copyright © 2023 Beniaich, Otten, Shin, Cooper, Rickson, Soulaimani and El Gharous. This is an open-access article distributed under the terms of the Creative Commons Attribution License (CC BY). The use, distribution or reproduction in other forums is permitted, provided the original author(s) and the copyright owner(s) are credited and that the original publication in this journal is cited, in accordance with accepted academic practice. No use, distribution or reproduction is permitted which does not comply with these terms.
*Correspondence: Adnane Beniaich, YWRuYW5lLmJlbmlhaWNoQHVtNnAubWE=