 Fu Luo1
 Yuanjian Yang
94% of researchers rate our articles as excellent or good
Learn more about the work of our research integrity team to safeguard the quality of each article we publish.
Find out more
ORIGINAL RESEARCH article
Front. Environ. Sci., 10 February 2023
Sec. Atmosphere and Climate
Volume 11 - 2023 | https://doi.org/10.3389/fenvs.2023.1084473
This article is part of the Research TopicClimate-Environment Interactions under Global WarmingView all 25 articles
Under the background of global warming, interaction between heat waves (HWs) and urban heat island (UHI) has led to trends of increase in the intensity, frequency, and duration of extreme heat events in urban areas, seriously threatening the health of urban populations. Taking Guangzhou (a tropical megacity in China) as an example, this study used automatic weather station data and ERA5 reanalysis data to explore the interaction between HWs and UHI, and to elucidate the effects of wind speed and local climate zones (LCZs) on such interaction. Results revealed obvious HWs–UHI interaction in Guangzhou, whereby HWs induces an amplification effect on UHI intensity (UHII) that was most significant at night. In the main urban area, UHII and HWs both weakened with increasing wind speed, indicating that low wind speeds contribute to increased occurrence of HWs and enhancement of UHII. Differently, in some areas peripheral to the main urban area, the UHII at medium wind speeds was stronger than that at low wind speeds, which reflect the impact of heat advection from the urban center. For different LCZs in the main urban area, the strongest UHII, highest risk of HW occurrence, and most significant HWs–UHI interaction were found in the compact mid-rise buildings and compact low-rise buildings (LCZ2 and LCZ3, respectively), followed by the compact high-rise buildings (LCZ1), which was mainly affected by the shading effect of high-rise buildings. The weakest UHII and lowest risk of HW occurrence were found in open high-rise buildings and open mid-rise buildings (LCZ4 and LCZ5, respectively), which generally have good ventilation conditions. Our findings will help to understand urban warming and its association with UHI and HW events in tropical urban regions, which has implications for rational improvement of the urban thermal environment in other tropical urban regions globally.
Heat waves (HWs) show trends of increase in intensity, frequency, and duration under the background of global warming (Meehl and Tebaldi, 2004; You et al., 2017; Wang and Yan, 2021). Persistent HWs bring considerable harm to human health and extreme HWs are the leading cause of increased weather-related human mortality (Basu and Samet, 2002; Tan et al., 2007). An HW event is a period of intense heat that persists for days or weeks that is usually accompanied by a high-pressure synoptic system (e.g., an anticyclone) (Zong et al., 2022), and is affected by multiple factors such as soil desiccation, climate variability, urbanization, and urban heat island (UHI). (Perkins, 2015; Yang et al., 2017; Liao et al., 2018; Luo et al., 2020; Luo & Lau, 2021).
The UHI refers to the phenomenon whereby the center of an urban or metropolitan area is warmer than surrounding rural areas owing to changes in the surface energy balance attributable to urbanization (Oke, 1982). Earlier studies showed that the combined effect of HWs and UHI is greater than the sum of their individual effects (Li and Bou-Zeid, 2013; Sun et al., 2017). In other words, when an HW event occurs, the increased urban heat stress will be even greater than that attributable to the sum of the background UHI effect and background HW effect (Li and Bou-Zeid, 2013). Interaction between HWs and UHI is mainly reflected in the strong impact that HW occurrence imparts on the spatiotemporal characteristics of UHI intensity (UHII), which is modulated mainly by changes in the radiation budget, differences in turbulent heat fluxes, and changes in cloud cover and wind conditions (Li et al., 2016; Zhong et al., 2017; Kong et al., 2021). Additionally, HWs further increase temperatures in urban areas (Li and Bou-Zeid, 2013; Kong et al., 2021). Moreover, continued urbanization leads to intensification of HWs and UHI (especially at night), while enhanced UHI increases the risk and duration of extreme heat events (Ren et al., 2008; Yang et al., 2017; Shi et al., 2021). Previous studies showed that HWs–UHI interaction is largely attributable to the contrasting responses of urban and rural surface energy budgets to HWs (Li et al., 2015) and changes in wind speed (Li et al., 2016; Yang et al., 2022).
The interaction between HWs and UHI remains a controversial topic. On the one hand, many studies have demonstrated amplification of UHII by HWs, although the degree of amplification and the characteristics of UHII vary between different cities (Ramamurthy and Bou-Zeid, 2016; Ao et al., 2019; Jiang et al., 2019; Ngarambe et al., 2020; Zong et al., 2021). On the other hand, some studies have observed a steady or even declining trend in UHII during HW periods, which imply that climate differences or changes in soil moisture have certain impact on HWs–UHI interaction (Chew et al., 2020; Richard et al., 2021) because differences in the background climate contribute significantly to changes in UHII (Zhao et al., 2014).
In addition to the influence of background climate differences, local climate zones (LCZs) also have important impact on the spatiotemporal distribution of UHII (Stewart and Oke, 2012; Ngarambe et al., 2020; Chen et al., 2021; Zong et al., 2021). Generally, that climate change at the surface and boundary layers is driven by the surface energy balance. Studies have considered differences in turbulent heat fluxes to be the main cause of temperature differences between urban and rural areas (Khan et al., 2020). Generally, LCZs are clustered by their approximate ability to modify the local surface climates by their fabric, land cover, structure, and metabolism, which are factors defined to better express the physical properties that control the climatic responses at a particular station (Stewart and Oke, 2012; Mu et al., 2020). Based on LCZs classification, the potential impact of the surface properties at each station on the UHI and various elements of the surface energy balance can be described more effectively (Oke et al., 2017). Therefore, it is of great importance to investigate the change of UHII for different LCZs and its relationship with HWs.
Guangzhou, a megacity, located on the subtropical coast of China, has a marine subtropical monsoon climate. The total built-up area in 2020 was 1,350.95 km2, and the permanent population comprised 18.68 million people. The annual average temperature in Guangzhou has risen continuously since 1953, the change rates from 1953 to 2009, 1973 to 2009, and 1983 to 2009 were 0.22°C/10a, 0.38°C/10a, 0.49°C/10a, respectively. The rise in temperature over the past 30 years has been consistent with the urbanization process. Urbanization factors are positively correlated with the annual average temperature, with the correlation coefficients higher than 0.80 (Feng and Pan, 2011). In Guangzhou, UHI classified at the level of strong or above mainly occurs in the central area of the city, the daytime UHI in the main urban area is particularly serious in summer and autumn, and more than 95% of the city blocks have different degrees of UHI effect (Deng et al., 2018). Additionally, previous studies have found interaction between HWs and UHI in Guangzhou. For example, the nighttime maximum UHII in Guangzhou was enhanced by 0.8°C ± 0.20°C during HWs, and the surface solar radiation during HWs was approximately 1.5 times greater than the normal level (Jiang et al., 2019). However, the effects of different LCZs and of urban ventilation conditions on HWs and UHI in Guangzhou and their interactions remain unclear.
Using both hourly observations of temperature and wind speed recorded from automatic weather stations in the warm season (May–September) in Guangzhou during 2013–2018 and corresponding ERA5 reanalysis data, this study aims to investigate the influencing and modulating effects of different wind speed conditions and LCZs on HWs and UHI in Guangzhou. The findings will help improve understanding and awareness of the causes of extreme heat stress and climate change in tropical megacities.
Considering that the heat wave events in Guangzhou in recent decades are concentrated from May to September, this study used hourly observations of temperature, wind speed, and wind direction data (http://data.cma.cn/en) recorded by automatic weather stations in this warm period in Guangzhou during 2013–2018. In studies of HWs and UHI, abnormal temperature data are generally considered as missing, and missing temperature data are replaced using the linear interpolation method. Among the 126 weather stations in Guangzhou, data from 10 urban stations (including one national station) and 5 rural stations (including two national stations) were selected in this study. As shown in Figure 1 (source: Google Earth), the urban stations are distributed in the southern, central and northern parts of the main built-up area. The rural stations are all located outside the built-up area in regions where the coverage of surrounding vegetation is greater.
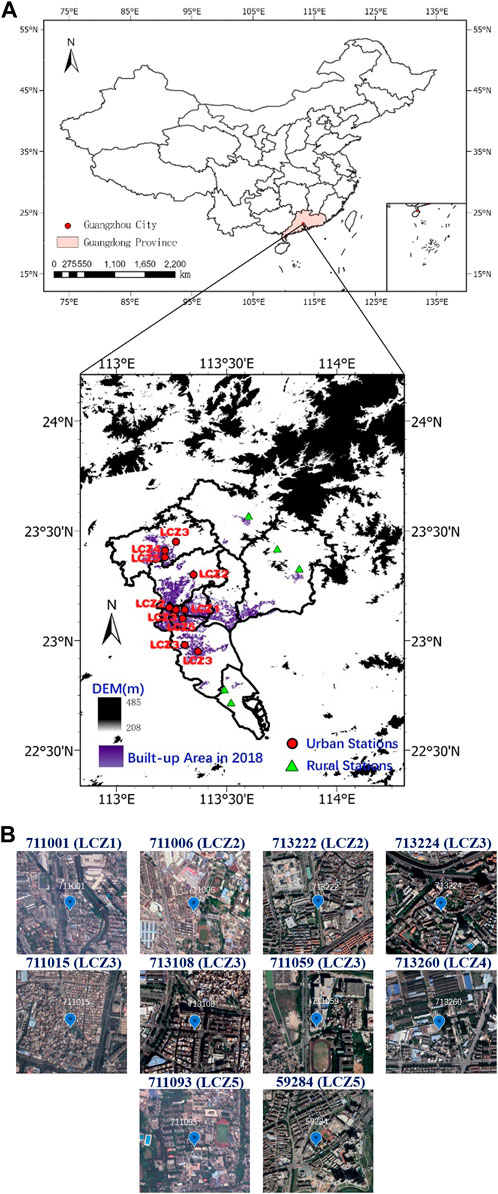
FIGURE 1. (A) Geographical locations of the urban and rural stations in Guangzhou, and; (B) Google Earth images of the locations of the urban stations.
Previous studies show that heat waves were related to both large-scale weather system and local urbanization (Perkins, 2015; Liao et al., 2018; Luo et al., 2020). For studying urbanization effects, five rural stations were selected as background stations, which can reflect the modulation of large-scale weather background with marginal impacts of human activity. Figure 2. Shows the heat waves and daily maximum temperatures averaged by rural stations, which are lower than those of urban stations. Here we mainly study the contribution of the diversity of complex urban underlying surfaces to UHI and HWs. Therefore, we can compare the temperature at urban and rural station to extract the impacts of local urbanization effects under certain large-scale weather conditions (e.g., heat wave context), especially for checking the contributions of the LCZs within the city and to UHI and HWs.
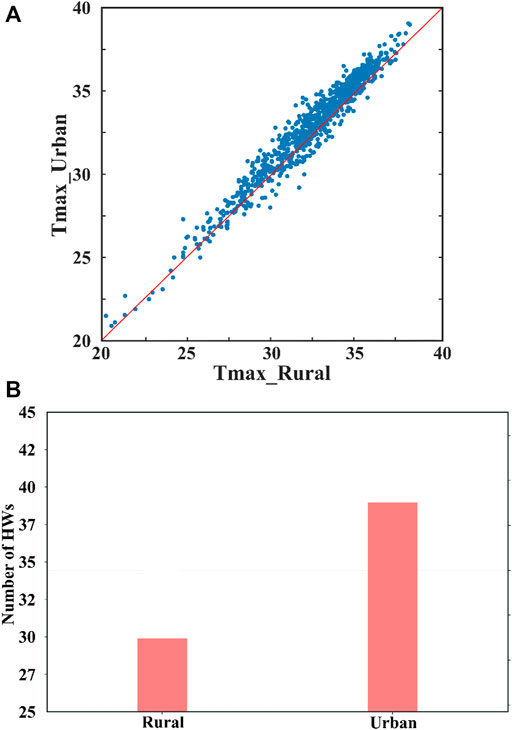
FIGURE 2. (A) Average daily maximum temperature at urban and rural stations during study period, and (B) average number of Heat Waves and UHII at urban and rural stations during study period.
When choosing a rural station for study of UHI, it is important to note the direction of the local prevailing wind. Generally, rural stations located downwind of built-up urban areas are not considered to avoid the influence of heat advection, which lead to large errors in the calculation of UHII. The classification of LCZs, as defined by Steward and Oke (2012), combines local floor heights and regional building densities. Stations near water bodies or at high elevations were also avoided. The classification of each station into the LCZs is shown in Table 1. The urban stations consisted of three compact types (LCZ1, LCZ2, and LCZ3) and two open types (LCZ4 and LCZ5). The characteristics of the vegetation at the rural stations comprised dense trees (LCZA), bush and scrub (LCZC), and low plants (LCZD).
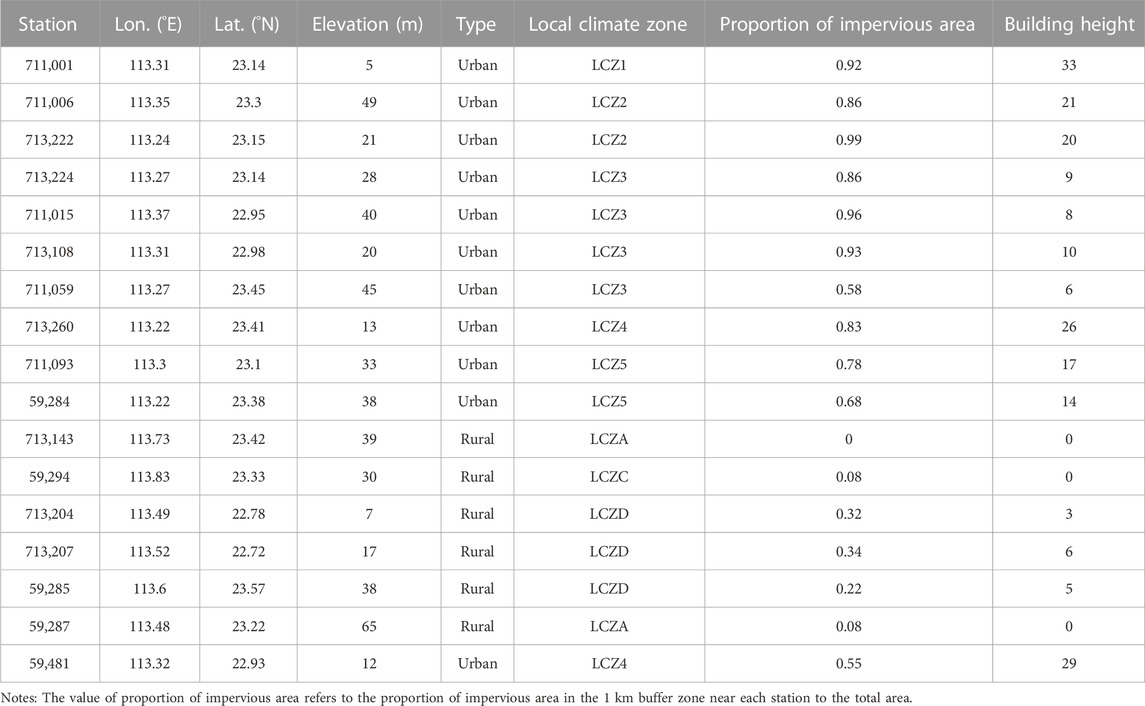
TABLE 1. Geographical location and classification of each of the urban and rural stations.
This study also used contemporaneous ERA5 reanalysis data that comprised boundary layer height (BLH) data and surface solar radiation (downward) data (https://cds.climate.copernicus.eu/cdsapp#!/dataset/reanalysis-era5-single-levels?tab=overview) with 0.25 × 0.25 grid resolution. In this study, we selected three grid points (23°00′N, 113°15′E, 23°15′N, 113°15′E, and 23°30′N, 113°15′E) for which the BLH and surface solar radiation data were positioned reasonably close to the overall built-up area of Guangzhou. This study focused on the canopy layer UHII, which is defined as the near-surface air temperature at each urban station minus the average air temperature at all rural stations (Oke et al., 2017; An et al., 2020). The definition of HWs used in different studies varies (You et al., 2017). This study considered the definition of a high-temperature day given by the China Meteorological Administration, and defined an HW event as when the daily maximum temperature exceeded 35°C for three or more days consecutively.
When considering the effect of wind speed, the distributions among the various stations of days with high wind speeds and days with low wind speeds are heterogenous. For example, some stations have very few days with high wind speeds, resulting in fewer UHII data, which will cause large errors in some statistical results. To reduce such influence, wind speed data from two national stations (59,287 and 59,481, as national stations with representative observation environment) were regarded as the background prevailing wind. The study used k-means clustering to classify the daily average wind speed data of the two national stations. We obtained three grades of wind speed: low wind speed (0–1.34 m/s), medium wind speed (1.34–2.34 m/s), and high wind speed (2.34–6.70 m/s). The characteristics of HWs and UHII at each station under the three wind speeds were evaluated based on this standard.
Additionally, the urban surface transport index (USTI) was introduced to supplement the effect of wind direction HWs–UHI interaction. The USTI is defined as follows:
where Ws, u, v, and n represent the wind speed, zonal wind speed, meridional wind speed, and number of samples, respectively (Berkovic, 2016). The USTI indicates the consistency and stability of the local wind direction. When the USTI value is large (close to 1), the wind direction is broadly consistent; conversely, when the USTI value is small, the wind direction is more chaotic. In the analysis of wind speed, n was set to the total number of wind speed data at each station, thereby the clutter in wind direction for each single station over the 6-year study period was calculated.
The significance of any differences between the mean UHII under different wind speeds and the LCZs was determined using analysis of variance (at a 0.001 confidence level) and Tukey’s test.
The various temporal-scale characteristics of air temperature and HW events in the Guangzhou area during 2013–2018 are shown in Figure 3. Generally, the average temperature at the urban stations in Guangzhou was approximately 1.00°C higher than that at the rural stations (Figure 3A). The overall average UHII in 2017 was higher than in other years (red line in Figure 3B), reaching 1.12°C, which was approximately 0.2°C higher than in the years with the lowest UHII (2013 and 2018). During the study period, HW events were concentrated in May–August (Figure 3C). The highest total number of HWs (114) was in 2014, with average duration of 53 days per station. The lowest total number of HWs (46) was in 2018, with average duration of 23 days per station (the “average duration” refers to the sum of heat wave duration of all stations divided by ten). In other years, there were approximately 60 HW events with average duration at a single station of approximately 30 days. It can also be seen from Figure 3B that the interannual fluctuation of high temperature (yellow line in Figure 3B) and UHII changes greatly, suggesting that HWs with high temperature might interact with UHI.
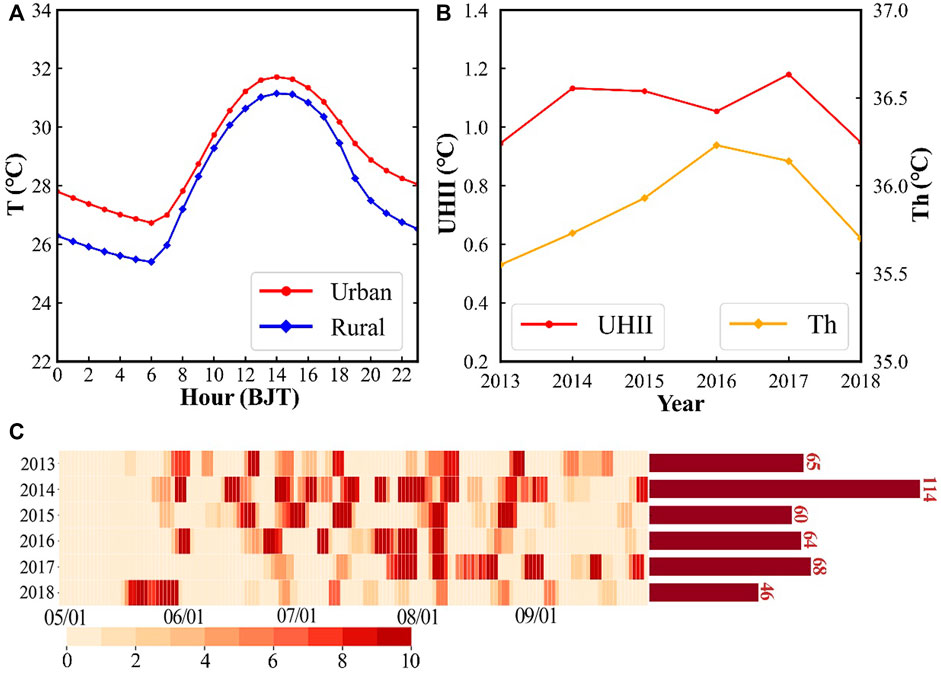
FIGURE 3. (A) Diurnal variation of temperature at the urban and rural stations in Guangzhou during 2013–2018 (BJT: Beijing time), (B) line graph of the annual average UHII (red) and annual average high temperature (yellow), where high temperature (Th) refers to temperatures no lower than 35°C, and (C) the general situation of HW events in Guangzhou during 2013–2018. The time resolution of calendar chart is daily. The color scale of the calendar graph represents the number of stations with HW events on a given day, and the bar graph represents the sum of HW events that occurred at all urban stations each year.
The diurnal variation of UHII during 2013–2018 is shown in Figure 4, where the red and blue lines represent the diurnal variation of UHII during HW and non-HW (NHW) periods. It can be seen that the overall diurnal variation of UHII in Guangzhou was unimodal, and that the UHII at night was significantly stronger than that during daytime, consistent with the findings of Jiang et al. (2019). This is the typical diurnal variation of UHII. The range of the 6-year average UHII in HW and NHW periods was −0.28 –3.80 and −1.30°C–3.05°C, respectively, and the average values were 1.76°C and 0.87°C, respectively. Compared with NHW periods in each year, UHII in HW periods increased by 0.58°C–1.33°C (77%–176%), 0.37°C–1.16°C (44%–137%), 0.11°C–1.12°C (14%–148%), 0.18°C–0.89°C (25%–124%), 0.49°C–1.26°C (47%–121%), 0.46°C–1.18°C (47%–120%), respectively (Here we used the hourly average UHII of each year in the HW and NHW periods to calculate the magnification and get their upper and lower limits). HWs amplified UHII by nearly 0.9°C on the whole, and the 6-year average UHII was increased by 103%. The overall amplification effect (calculated as the average UHII of the HW period minus the average UHII of the NHW period) was relatively strong in both 2013 and 2017, reaching 1.08°C and 1.04°C, respectively. Conversely, the amplification effect in both 2015 and 2016 was relatively weak at 0.72°C and 0.76°C, respectively.
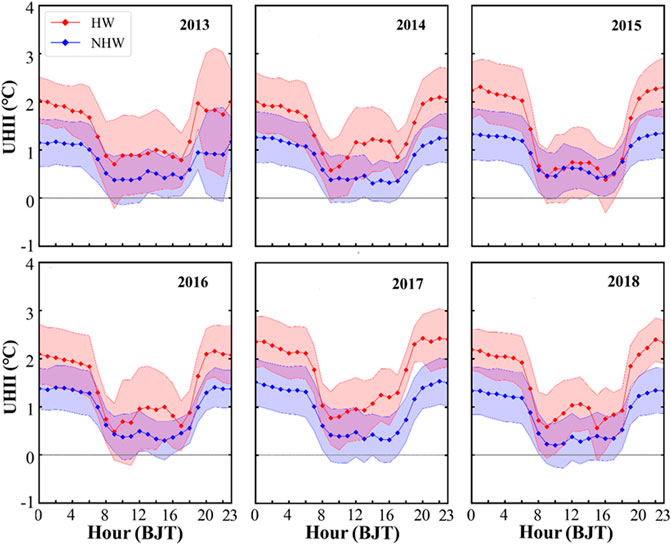
FIGURE 4. Diurnal variation in UHII in Guangzhou during HW and NHW periods during 2013–2018 (BJT: Beijing time). The red and blue shaded areas represent the annual standard deviation of HW and NHW periods, respectively.
Figure 5, produced using the differences in diurnal variation of UHII in HW and NHW periods during 2013–2018, shows that the ΔUHII was W-shaped and almost always positive with a clear peak at night (form approximately 20:00 to 06:00 Beijing time (BJT) on the following day). Larger ΔUHII also appeared during daytime (09:00–17:00 BJT), which indicates that the HW occurrence had strong amplification effect on UHI.
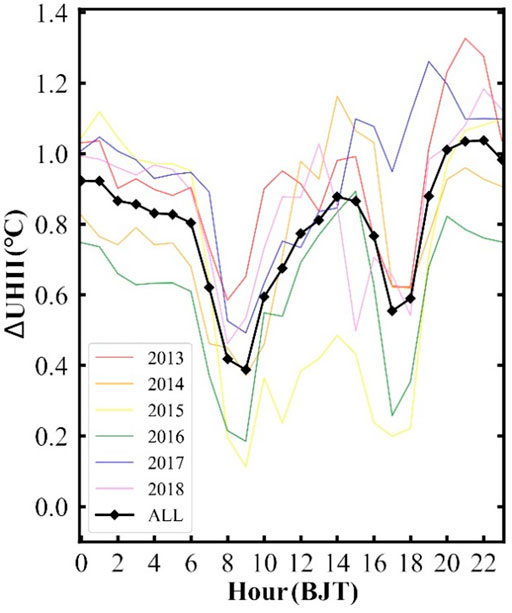
FIGURE 5. Diurnal variation in UHII difference (ΔUHII) between HW and NHW periods in Guangzhou during 2013–2018 (BJT: Beijing time).
To evaluate the role of wind speed, the characteristic of HW events and UHII under three different wind speed conditions were obtained by applying k-means clustering to the of wind speeds recorded at the two national stations considered in this study. First, the total duration of HW events at each urban station under the conditions of the three wind speeds was determined. At each of the urban station, the total number of HW days at low wind speeds was higher than that at medium and high wind speeds (Figure 6A). The most significant differences under the different wind speed conditions were observed at stations 713,222 (LCZ2), 713,224 (LCZ3), and 713,108 (LCZ3), i.e., the number of HW days at low wind speeds was more than 100 days longer than that at medium and high wind speeds. Boxplots of the daily average UHII for different wind speeds at each urban station are shown in Figure 6B. Generally, higher values of UHII were found to correlate with lower wind speeds. The average value of UHII at high, medium, and low wind speeds were 0.46, 1.02, and 1.11°C, respectively.
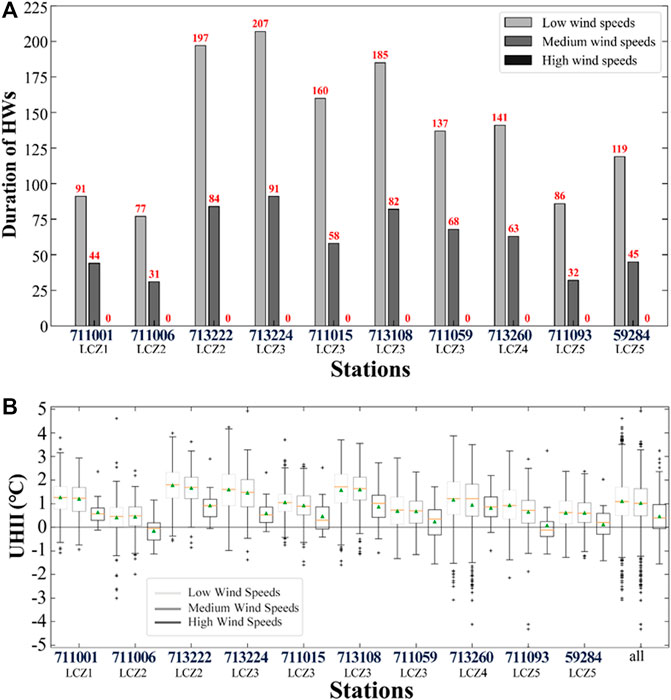
FIGURE 6. (A) Duration of HWs at each urban station under different wind speeds, and (B) UHII at each urban station under different wind speed conditions.
Comparison of Figures 6A, B reveals that the HW and UHII characteristics at each station under different wind speeds had strong consistency. The higher the number of HW days at a certain station, the higher the UHII; however, both decreased with the increasing wind speed, which again confirms the effect of HWs–UHI interaction. Results of the analysis of variance and Tukey’s test showed that the mean UHII at each station under three wind speeds was significantly different (p < 0.001).
Certain abnormalities were evident at individual stations, e.g., station 711,006 (LCZ2), which showed that the average UHII at medium wind speeds was slightly higher than that at low wind speeds (Figure 6B) with an average difference of 0.03°C–0.04°C. Statistics showed that the 6-year prevailing wind direction at this station is mainly 190°–270°, i.e., from southwest direction (Figure 7A), and that the number of days on which the wind direction within a 24-h period was entirely from this quadrant accounted for more than 57% of the total number of days. Considering that this station is located at the northeastern edge of the built-up area, we considered the wind direction to be from the southwest and observed the variation of the daily average UHII at the station (Figure 7B). It was found that when the wind speed increased, the UHII increased significantly within a certain range of wind speed, which indicated certain impact of the local prevailing wind on the energy balance in peripheral urban areas. At moderate wind speeds, heat from the warmer urban center could be transported downwind to peripheral areas, causing them to warm to some extent.
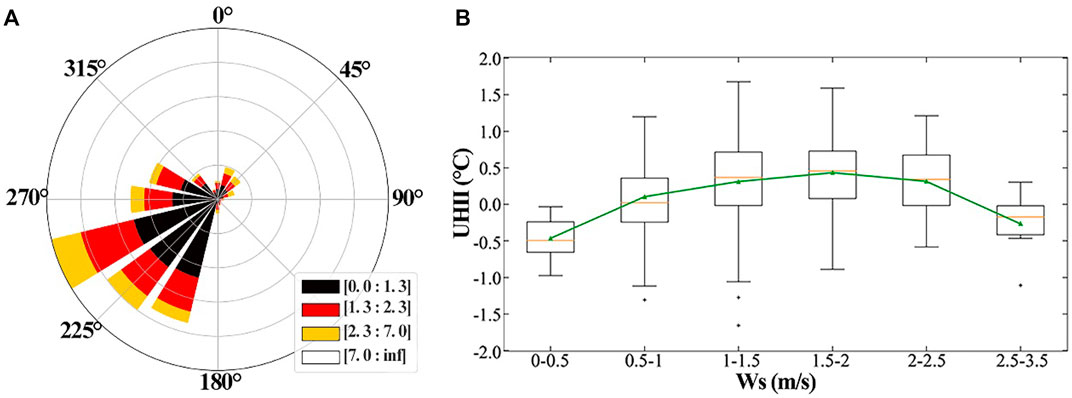
FIGURE 7. (A) Rose diagram of wind direction at station 711,006 (LCZ2), and (B) relationship between daily average UHII and wind speed at station 711,006 (LCZ2) (range: 190°–270°; when the wind direction was from within this range for 16 h or more within a 24-h period, it was considered that the wind was from the southwest all day). All wind vectors in the interval were uniformly projected to the direction of 225° to obtain the projected wind speed.
The frequency of HW events and the overall level of UHII at each urban station are shown in Figures 8A, B, respectively. Stations in LCZ2 and LCZ3, especially 713,222 (LCZ2) and 713,224 (LCZ3) located in the central urban area of Guangzhou, had the highest number of HW events (Figure 8A) and the strongest UHII (Figure 8B), i.e., the frequency of occurrence of HW events was 59 and 55 times and the average UHII was 1.66°C and 1.47°C at stations 713,222 (LCZ2) and 713,224 (LCZ3), respectively. Despite all being classified as type LCZ3, the frequency of occurrence of HW events and the strength of the UHII at station 711,015 (located in the southern urban area), station 711,059 (located in the northern urban area) were not as great as at station 713,224 (located in the central urban area). The frequency of occurrence of HW events and the strength of the UHII at station 711,006 (LCZ2) were weaker than at most of the other stations, i.e., the average UHII was only approximately 0.35°C, much lower than that at station 713,222 (LCZ2) and 713,224 (LCZ3) in the urban center, mainly because station 711,006 (LCZ2) is located at the periphery of the built-up area close to the mountains. LCZ4 and LCZ5 (three stations in total as shown in Figure 8) are open building zones for which the strength of the UHII was lower than that of LCZ1, 2, and 3 (Figure 8B), i.e., the average UHII of stations classified as type LCZ4 or LCZ5 were 1.09, 0.82°C and 0.60°C, respectively, and the average number of HWs was approximately 35. Remarkably, in the central urban area, the frequency of occurrence of HW events (28 times) and the strength of the UHII (average: 1.23°C) at station 711,001 (LCZ1) were inferior to those in nearby areas, e.g., at stations 713,222 (LCZ2) and 713,224 (LCZ3). Statistical results showed that the overall average temperature at station 711,001 (LCZ1) was approximately 0.4°C lower than that at station 713,222 (LCZ2) and 713,224 (LCZ3), even though all three stations are located in the city center. The temperature difference increased sharply after 07:00–08:00 BJT, and the maximum difference could reach approximately 1°C. The temperature difference decreased slightly at noon and then decreased rapidly after 17:00 BJT (Figure 9). For more robust results, we made statistics on more ground stations with 31 urban stations and 6 rural stations in Guangzhou (as shown in Figure 8C), that there were significant differences among UHII groups in different LCZs. The differences in HW between the same LCZ types caused by the various geographical environment near the urban stations with different location.
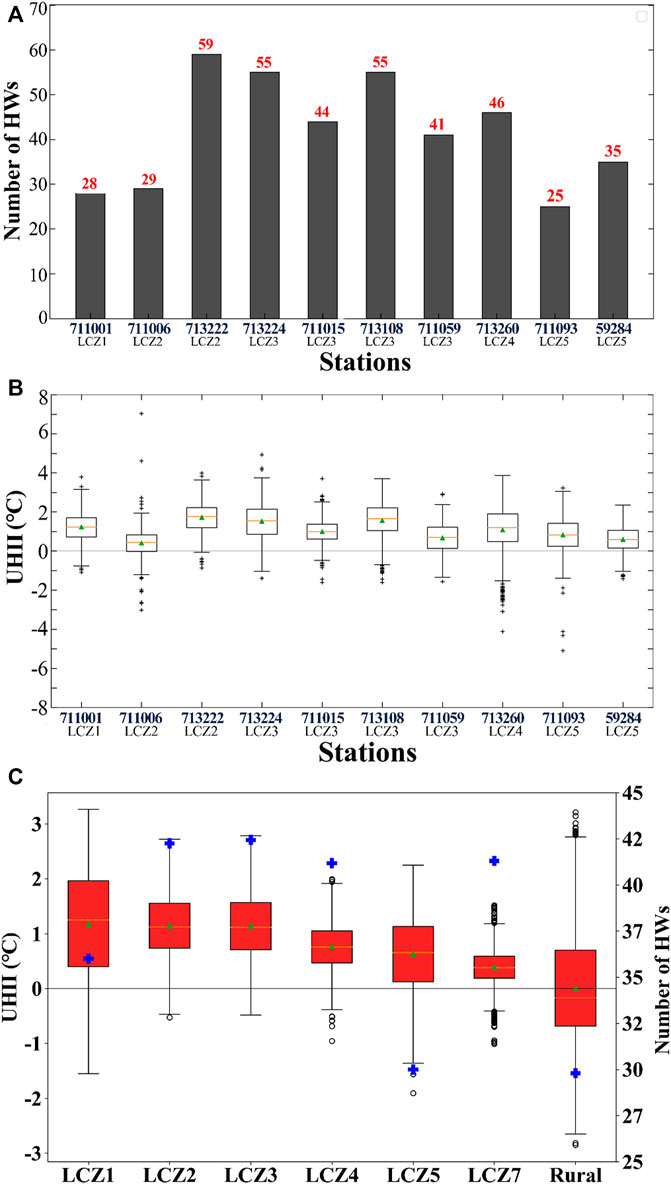
FIGURE 8. (A) Frequency of HW events for each urban station and LCZ, and (B) overall UHII level for each urban station and LCZ, and (C) number of HWs and averaged UHII in different LCZs with 31 urban and 6 rural stations in total.
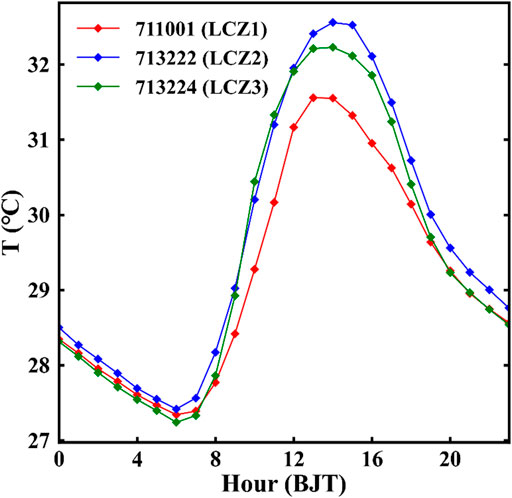
FIGURE 9. Diurnal variation of temperature at stations 711,001 (LCZ1), 713,222 (LCZ2), and 713,224 (LCZ3) (BJT: Beijing time).
The analysis of variance and Tukey’s test showed that the mean UHII at each LCZ station was significantly different (p < 0.001).
About research in Guangzhou, namely Jiang et al. (2019), they mainly focused the diurnal variation of UHII during heat waves and the contribution of solar radiation to UHII. In contrast, our present work aims to reveal the influence of different local climate and environment on the UHII under the large-scale heat wave weather system, that is, the contribution of LCZ and ventilation are also considered on a local scale. More importantly, we introduced the urban surface transport index (USTI) to explore the effect of wind direction HWs–UHI interaction. At the local scale in the urban area, particularly, the integrated influence of ventilation, heat advection and different underlying surface has important impacts on local UHII.
By comparing the differences in UHII between HW and NHW periods, this study analyzed the interaction between HWs and UHI in Guangzhou. Results confirmed that HWs–UHI interaction occurred in Guangzhou, and that the occurrence of HWs resulted in significant enhancement of UHII during both daytime and nighttime (but stronger at night). Generally, open and exposed surfaces have higher rates of heating and cooling (unless the soil is very wet), meaning that rural areas gain heat quickly in the morning and lose it quickly in the evening. Conversely, the high thermal admittance of urban materials and local shadow blocking mean that the temperature response in urban areas is not so fast and thus the UHII in urban areas exhibits abrupt change in the morning and evening (Yow, 2007; Oke et al., 2017). Rural areas have larger vegetation coverage and more abundant water resources, and heat is mainly exchanged in the form of latent heat (Kong et al., 2021). Previous research showed that the average temperature of vegetated surfaces is generally lower than that of impervious surfaces (Sun et al., 2012; Song et al., 2014; Estoque et al., 2016). However, the unique radiative properties of urban materials cause urban areas to have greater heat storage capacity during daytime than rural areas, and this heat is released at night in the form of sensible heat that becomes confined in the near-surface layer owing to the presence of the stable nocturnal boundary layer and reduced vertical mixing, contributing to the peak of UHII at night (Ramamurthy et al., 2014). This process is further enhanced when an HW occurs. Studies have shown that HW occurrence is usually accompanied by a persistent high pressure anticyclone system, as well as enhanced solar radiation, lower cloud cover, and lower wind speed (Hong et al., 2019; Ngarambe et al., 2020). Figure 10A shows that the solar radiation at noon generally was increases by about 1.4 times during HW periods with respect to NHW periods. During daytime, especially at noon, the increased shortwave radiation and decreased wind speed resulted in increased heat storage when an HW event occurs (Sun et al., 2017), while high air temperatures lead to the release of more anthropogenic heat from sources such as air conditioning. This may explain why ΔUHII has a peak at noon. The BLH data partly support this because an elevated urban boundary layer is observed during daytime when an HW occurs (Figure 10B), indicating enhancement of near-surface thermal effects. At night, the high value of ΔUHII means that the amplification effect of UHII during an HW period is more severe than that during the day because more heat stored in the urban surfaces is released at night. When an HW occurs, a stable anticyclonic system and lower wind speeds reduce the effect of advective cooling (Ngarambe et al., 2020; Kong et al., 2021). Furthermore, suppression of boundary layer development by descending air (Figure 10B) further weakens vertical mixing.
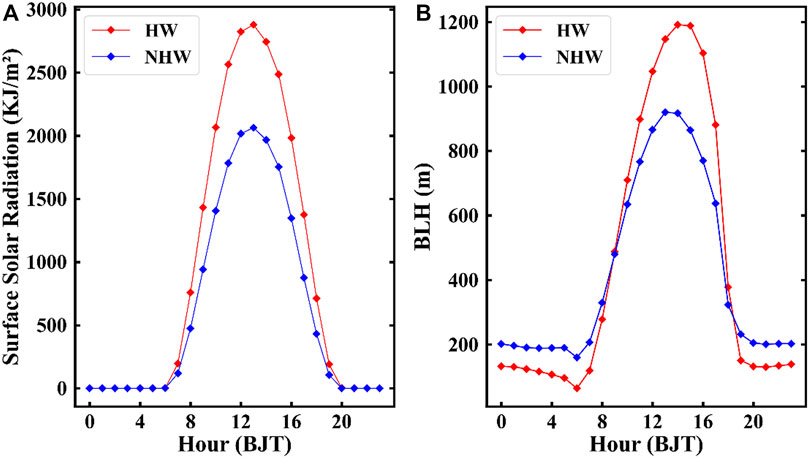
FIGURE 10. (A) Diurnal variation of surface solar radiation (downward), and (B) diurnal variation of average boundary layer height (BLH). The criterion for determining HW is that at least 6 or more stations are in HW period on that day. (BJT: Beijing time).
Given that weather and surface conditions are important factors that affect UHII (Memon et al., 2008; Tzavali, 2015), this study explored the effects of wind speed and LCZs on the HWs–UHI interaction. Results showed that lower wind speeds and high-density building clusters contributed to more frequent and stronger HW events and higher UHII. Generally, wind can largely mitigate the UHI effect (Kim and Baik, 2005; Yow, 2007) both by introducing cooler air that mixes with the urban hot air, resulting in a drop in the urban temperature, and by the stirring effect of wind to that can dissipate urban heat (He, 2018). Lower wind speeds that mean less advective cooling and increased surface roughness that blocks the natural wind flow are both conducive to restricted ventilation and heat dissipation. The wind speed data from each station in Guangzhou were analyzed according to the definition of WsR used by Liu et al. (2022), where WsR represents the ratio of the average wind speed at each urban station to the average wind speed at all rural stations, which can effectively reflect the ventilation capacity. It can be seen from Figure 11 that UHII and WsR are inversely proportional. It indicates that urbanization reduces the near-surface wind speed at some stations (WsR <1), which is accompanied by an increase in UHII; when the wind speed increases, UHII decreases accordingly. It can also be seen that the slope of the fitting line at 14:00 BJT is slightly greater than that at 02:00 BJT, which to a certain extent means that the ventilation effect during daytime has greater impact on UHII than that at night. The relationship between wind speed and USTI at each station is shown in Figure 12. It can be seen that the UHII at each station decreased with the increase of wind speed and USTI, excepting for station 713,224 (the red dot in the lower right corner of Figure 12, this may be due to local traffic emission sources and ventilation corridor effect), indicating that a higher wind speed and a more uniform wind direction are beneficial to reduction of UHII. Generally, when the wind speed is low and the wind direction is disordered, the ventilation effect is weak, which is not conducive to mitigation of the UHI effect.
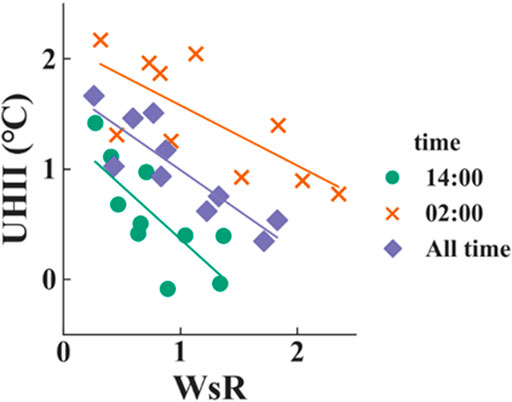
FIGURE 11. Relationship between UHII and WsR at each urban station. The straight line in the figure represents the linear trend of each time.
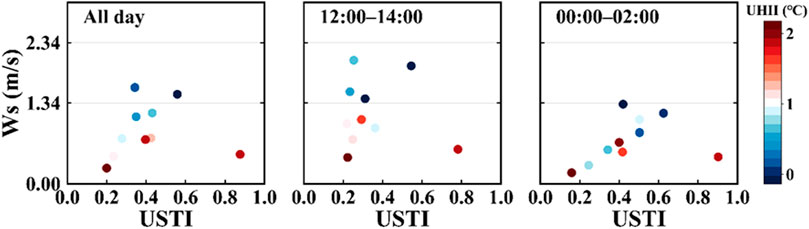
FIGURE 12. Relationship between USTI, wind speed (Ws), and UHII at each urban station (The dots in the figure represent each station and darker blue(red) dots indicate weaker(stronger) UHII).
At the periphery of the built-up area, e.g., station 711,006 (LCZ2), we found that when the wind speed increased to a certain extent, the UHII actually increased. Note that the average wind speed at station 711,006 was 1.48 m/s, second only to that at station 59,284 (LCZ5), and that the USTI value was 0.56. Referring to analysis of heat advection in earlier studies (Heaviside et al., 2014; Bassett et al., 2016; Dinda and Chatterjee, 2022), and considering the influence of wind sources on UHI (He, 2018), this station had been influenced by upstream heat advection. However, when the wind speed continued to increase and reached a higher level, the UHII decreased significantly (Figure 7B), indicating that the ventilation and cooling effects exceeded the effect of advected heat. It should be noted that we did not consider the influence of factors such as precipitation and clouds, which represents an obvious shortcoming of this study.
Considering the differences between LCZ types, it is recognized that building density and the canyon aspect ratio have substantial impact on radiant energy interception and heat storage (Oke et al., 2017), while building form and spatial pattern can cause obstruction and disturbance to wind (Mou et al., 2017). Previous studies have shown that LCZ2 and LCZ3 are relatively warm areas in some cities (Geletič et al., 2016; Zhou et al., 2021), and as areas with dense mid-rise buildings and dense low-rise buildings, respectively, both have high areas of impervious surfaces, and compact arrangement of buildings. High-density buildings and tall buildings upwind hinder ventilation downwind, resulting in relatively high surface temperatures (Yang et al., 2019), implying increased surface heat storage. Dense building groups are also conductive to intercepting more shortwave radiation energy. Therefore, in comparison with other LCZs in Guangzhou, the UHII of LCZ2 and LCZ3 is stronger and the frequency of HW occurrence is higher (Figure 8).
The air temperature at 02:00 BJT at all urban stations during HW and NHW periods was also investigated in this study. To reduce the temperature difference caused by different months, temperature samples of each month were calculated separately. Results showed that in the first third of the high-temperature descending sequence, station 713,222 (LCZ2), 713,224 (LCZ3), 713,108 (LCZ3), and 711,001 (LCZ1) appeared more frequently, accounting for 15%, 14%, 13%, and 14%, respectively, and indicating that LCZ1, LCZ2, and LCZ3 (Especially stations in the central area of Guangzhou) contributed more to HWs and UHI and their interaction. Meanwhile, the UHII of these four stations increased by 46%, 71%, 42%, and 55%, respectively, during HW periods. LCZ4 and LCZ5, as open high-rise building zones and open mid-rise building zones, respectively, have lower building density and smaller canyon aspect ratios, which reduce the effect of blocking of the natural wind flow and reduce the interception of shortwave radiation by buildings. One effect of reduction in impervious area and increase in vegetation coverage is increased latent heat flux, which is beneficial to cooling of the near-surface atmosphere (Oke et al., 2017); however, the specific local environment still has an impact. For example, the four urban stations of classified as LCZ3 show certain inherent differences attributable to their urban characteristics at different geographical location.
Tall and compact buildings can weaken the ventilation effect; thus, for LCZ1 in particular, the increase in air temperature may have been limited owing to the possible shading effect (Oke, 1982; Bourbia and Awbi, 2004). Therefore, the frequency, intensity, of HW events and the strength of UHII in LCZ1 with a higher building group were lower than in LCZ2 and LCZ3 with lower buildings, especially regarding the limitation of the maximum daily temperature that greatly affected the determination of HWs. Statistical results also showed that LCZ1 did not warm as much as LCZ2 (station 713,222) and LCZ3 (station 713,224) in the morning (Figure 9), and that the overall average temperature was also slightly lower.
In this study, the interaction between HWs and UHI was explored in combination with consideration of LCZs and wind speed conditions using hourly data recorded by automatic weather stations in Guangzhou during 2013–2018. The main conclusions derived can be summarized as follows.
The interaction between HWs and UHI in Guangzhou was obvious, which amplifies urban warming. HWs can amplify the intensity of UHI and the amplification effect was more significant at night. The average UHII during HW and NHW periods was 1.76°C and 0.87°C, respectively. The occurrence of HWs caused the overall UHII to be amplified by approximately 0.9°C.
HWs–UHI interaction was strongly influenced by urban ventilation conditions. For the entire main urban area, the number of HW days with low wind speeds was higher than that with medium and high wind speeds, and the difference between them in some areas was >100 days. The UHII under low wind speed conditions was also higher than that under medium and high wind speed conditions. It shows that lower wind speed is conducive to strengthening of HWs and UHI and their interaction, whereas higher wind speed conditions have a mitigating effect on HWs, UHI and their interaction. However, urban heat advection from the urban center that leads to a certain degree of warming in peripheral areas. Overall, HWs, UHI, and their interaction were found correlated negatively with wind speed.
For various LCZs, The UHII was highest in the compact mid-rise buildings (LCZ2) and compact low-rise buildings (LCZ3), and both the highest risk of HW occurrence and the most significant HWs–UHI interaction were found in such areas. Especially at stations 713,222 (LCZ2) and 713,224 (LCZ3) located in the urban center of Guangzhou. The UHII and risk of HW occurrence in the compact high-rise buildings (LCZ1) were second highest. This was mainly attributable to the shading effect of high-rise buildings. The UHII and risk of HWs in open high-rise buildings (LCZ4) and open mid-rise buildings (LCZ5) were smaller, mainly attributable to better urban ventilation conditions. Generally, the compact built-up zones (LCZ1, LCZ2, and LCZ3) contributed more to HWs and UHII, whereas the contributions by open high-rise buildings and open mid-rise buildings (LCZ4 and LCZ5, respectively) were smallest.
In summary, our present work provided a convinced evidence that urban warming amplified by HWs–UHI interaction were mainly modulated by both urban ventilation conditions and LCZs in the tropical Guangzhou mega city. Our findings will help improve understanding of the changes and causes of UHI and HWs in tropical urban regions, and support rational improvement of the urban thermal environment in other tropical urban regions globally.
The raw data supporting the conclusion of this article will be made available by the authors, without undue reservation.
Conceptualization, YY; methodology and software, FL; formal analysis, FL, LZ, YY, and XB; data curation, FL, LZ, and XB; writing—original draft preparation, FL; writing—review and editing, FL, LZ, YY, and XB; supervision, YY; funding acquisition, YY. All authors have read and agreed to the submitted version of the manuscript.
This study is supported by Natural Science Foundation of China (42175098 and 42222503).
We thank Institute of Urban Meteorology of CMA for providing LCZ data and Guangdong Meteorological Service for providing automatic weather stations data. We acknowledge the High Performance Computing Center of Nanjing University of Information Science and Technology for their support of this work.
The authors declare that the research was conducted in the absence of any commercial or financial relationships that could be construed as a potential conflict of interest.
All claims expressed in this article are solely those of the authors and do not necessarily represent those of their affiliated organizations, or those of the publisher, the editors and the reviewers. Any product that may be evaluated in this article, or claim that may be made by its manufacturer, is not guaranteed or endorsed by the publisher.
An, N., Dou, J., Gonzalez-Cruz, J. E., Bornstein, R. D., Miao, S., and Li, L. (2020). An observational case study of synergies between an intense heat wave and the urban heat island in beijing. J. Of Appl. Meteorology Climatol. 59, 605–620. doi:10.1175/JAMC-D-19-0125.1
Ao, X., Wang, L., Zhi, X., Gu, W., and Yang, H. (2019). Observed synergies between urban heat islands and heat waves and their controlling factors in Shanghai, China. J. Appl. Meteorology Climatol. 58, 1955–1972. doi:10.1175/JAMC-D-19-0073.1
Bassett, R., Cai, X., Chapman, L., Heaviside, C., Thornes, J. E., Muller, C. L., et al. (2016). Observations of urban heat island advection from a high-density monitoring network: Urban Heat Advection. Q. J. R. Meteorological Soc. 142, 2434–2441. doi:10.1002/qj.2836
Basu, R., and Samet, J. (2002). Relation between elevated ambient temperature and mortality: A review of the epidemiologic evidence. Epidemiol. Rev. 24, 190–202. doi:10.1093/epirev/mxf007
Berkovic, S. (2016). Synoptic classes as a predictor of hourly surface wind regimes: The case of the central and southern Israeli coastal plains. J. Of Appl. Meteorology And Climatol. 55, 1533–1547. doi:10.1175/JAMC-D-16-0093.1
Bourbia, F., and Awbi, H. B. (2004). Building cluster and shading in urban canyon for hot dry climate Part 1: Air and surface temperature measurements. Renew. Energy 29, 249–262. doi:10.1016/S0960-1481(03)00170-8
Chen, G., Li, N., Cai, Y. N., and He, M. J. (2021). Characteristic analysis of Guangzhou summer heat island intensity based on LCZ. Archit. Sci. 37 (06), 96–104. (in Chinese). doi:10.13614/j.cnki.11-1962/tu.2021.06.13
Chew, L. W., Liu, X., Li, X. X., and Norford, L. K. (2020). Interaction between heat wave and urban heat island: A case study in a tropical coastal city, Singapore. Atmos. Res. 247, 105134. doi:10.1016/j.atmosres.2020.105134
Deng, Y. J., Wang, J. C., He, Q. J., and Chen, D. C. (2018). Analysis of the characteristics and evolution of Guangzhou urban heat island in recent 15 years based on MODIS data. Chin. J. Trop. Meteorology 34 (06), 755–762. (in Chinese). doi:10.16032/j.issn.1004-4965.2018.06.004
Dinda, A., and Chatterjee, S. (2022). Assessing the local-impacts of heat advection on urban heat islands in Kolkata Metropolitan Area. Urban Clim. 42, 101139. doi:10.1016/j.uclim.2022.101139
Estoque, R., Murayama, Y., and Myint, S. W. (2016). Effects of landscape composition and pattern on land surface temperature: An urban heat island study in the megacities of Southeast Asia. Sci. Total Environ. 577, 349–359. doi:10.1016/j.scitotenv.2016.10.195
Geletič, J., Lehnert, M., and Dobrovolny, P. (2016). Land surface temperature differences within local climate zones, based on two central European cities. Remote Sens. 8, 788. doi:10.3390/rs8100788
He, B.-J. (2018). Potentials of meteorological characteristics and synoptic conditions to mitigate urban heat island effects. Urban Clim. 24, 26–33. doi:10.1016/j.uclim.2018.01.004
Heaviside, C., Cai, X., and Vardoulakis, S. (2014). The effects of horizontal advection on the urban heat island in Birmingham and the West Midlands, United Kingdom during a heatwave. Q. J. R. Meteorological Soc. 141, 1429–1441. doi:10.1002/qj.2452
Hong, J.-W., Kwon, E. E., and Yoon, D. (2019). Temporal dynamics of urban heat island correlated with the socio-economic development over the past half-century in Seoul, Korea. Environ. Pollut. 254, 112934. doi:10.1016/j.envpol.2019.07.102
Jiang, S., Lee, X., Wang, J., and Wang, K. (2019). Amplified urban heat islands during heat wave periods. J. Geophys. Res. Atmos. 124, 7797–7812. doi:10.1029/2018JD030230
Feng, J., and Pan, A. (2011). Characteristics of temperature variation in Guangzhou and its relationship with urbanization process. J. Guangzhou Univ. Nat. Sci. Ed. (06), 89–94. (in Chinese).
Khan, H., Paolini, R., Santamouris, M., and Caccetta, P. (2020). Exploring the synergies between urban overheating and heatwaves (HWs) in western sydney. Energies 13, 470. doi:10.3390/en13020470
Kim, Y.-H., and Baik, J.-J. (2005). Spatial and temporal structure of the urban heat island in seoul. J. Appl. Meteorology - J APPL METEOROL 44, 591–605. doi:10.1175/JAM2226.1
Kong, J., Zhao, Y., Carmeliet, J., and Lei, C. (2021). Urban heat island and its interaction with heatwaves: A review of studies on mesoscale. Sustainability 13, 10923. doi:10.3390/su131910923
Li, D., Sun, T., Liu, M., Wang, L., and Gao, Z. (2016). Changes in wind speed under heat waves enhance urban heat islands in the beijing metropolitan area, 2369–2375. doi:10.1175/JAMC-D-16-0102.1
Li, D., and Bou-Zeid, E. (2013). Synergistic interactions between urban heat islands and heat waves: The impact in cities is larger than the sum of its parts. J. Of Appl. Meteorology And Climatol. 52, 2051–2064. doi:10.1175/JAMC-D-13-02.1
Li, D., Sun, T., Liu, M., Yang, L., Wang, L., and Gao, Z. (2015). Contrasting responses of urban and rural surface energy budgets to heat waves explain synergies between urban heat islands and heat waves. Environ. Res. Lett. 10, 054009. doi:10.1088/1748-9326/10/5/054009
Liao, W., Liu, X., Li, D., Luo, M., Wang, D., Wang, S., et al. (2018). Stronger contributions of urbanization to heat wave trends in wet climates. Geophys. Res. Lett. 45. doi:10.1029/2018GL079679
Liu, Y., Xuan, C., Xu, Y., Fu, N., Xiong, F., and Gan, L. (2022). Local climate effects of urban wind corridors in Beijing. Urban Clim. 43, 101181. doi:10.1016/j.uclim.2022.101181
Luo, M., and Lau, N.-C. (2021). Increasing human-perceived heat stress risks exacerbated by urbanization in China: A comparative study based on multiple metrics. Earth's Future 9. doi:10.1029/2020EF001848
Luo, M., Ning, G., Xu, F., Wang, S., Liu, Z., and Yang, Y. (2020). Observed heatwave changes in arid northwest China: Physical mechanism and long-term trend. Atmos. Res. 242, 105009. doi:10.1016/j.atmosres.2020.105009
Meehl, G., and Tebaldi, C. (2004). More intense, more frequent, and longer lasting heat waves in the 21st century. Sci. (New York, N.Y.) 305, 994–997. doi:10.1126/science.1098704
Memon, R., Dennis, L. Y., and Liu, C. (2008). A review on the generation, determination and mitigation of Urban Heat Island. J. Environ. Sci. (China) 20, 120–128. doi:10.1016/s1001-0742(08)60019-4
Mou, Ben, He, B. J., Zhao, D. X., and Chau, K. w. (2017). Numerical simulation of the effects of building dimensional variation on wind pressure distribution. Eng. Appl. Comput. Fluid Mech. 11, 293–309. doi:10.1080/19942060.2017.1281845
Mu, Q., Miao, S., Wang, Y., Li, Y., He, X., and Yan, C. (2020). Evaluation of employing local climate zone classification for mesoscale modelling over Beijing metropolitan area. Meteorology Atmos. Phys. 132, 315–326. doi:10.1007/s00703-019-00692-7
Ngarambe, J., Nganyiyimana, J., Kim, I., Santamouris, M., and Yun, G. Y. (2020). Synergies between urban heat island and heat waves in Seoul: The role of wind speed and land use characteristics. Plos One 15, e0243571. doi:10.1371/journal.pone.0243571
Oke, T. R., Mills, G., Christen, A., and Voogt, J. A. (2017). Urban climates. Urban Clim. doi:10.1017/9781139016476
Oke, T. (1982). The energetic basis of the urban heat island. Q. J. R. Meteorological Soc. 108, 1–24. doi:10.1002/qj.49710845502
Perkins, S. E. (2015). A review on the scientific understanding of heatwaves—their measurement, driving mechanisms, and changes at the global scale. Atmos. Res. 164, 242–267. doi:10.1016/j.atmosres.2015.05.014
Ramamurthy, P., and Bou-Zeid, E. (2016). Heatwaves and urban heat islands: A comparative analysis of multiple cities. J. Geophys. Res. Atmos. 122, 168–178. doi:10.1002/2016JD025357
Ramamurthy, P., Bou-Zeid, E., Smith, J. A., Wang, Z., Baeck, M. L., Saliendra, N. Z., et al. (2014). Influence of sub-facet heterogeneity and material properties on the urban surface energy budget. J. Of Appl. Meteorology And Climatol. 53, 2114–2129. doi:10.1175/JAMC-D-13-0286.1
Ren, G., Zhou, Y., Chu, Z., Zhou, J., Zhang, A., Guo, J., et al. (2008). Urbanization effects on observed surface air temperature trends in north China. J. Clim. - J Clim. 21, 1333–1348. doi:10.1175/2007JCLI1348.1
Richard, Y., Pohl, B., Rega, M., Pergaud, J., Thevenin, T., Emery, J., et al. (2021). Is Urban Heat Island intensity higher during hot spells and heat waves (Dijon, France, 2014–2019)? Urban Clim. 35, 100747. doi:10.1016/j.uclim.2020.100747
Shi, Z., Xu, X., and Jia, G. (2021). Urbanization magnified nighttime heat waves in China. Geophys. Res. Lett. 48. doi:10.1029/2021GL093603
Song, J., Du, S., Feng, X., and Guo, L. (2014). The relationships between landscape compositions and land surface temperature: Quantifying their resolution sensitivity with spatial regression models. Landsc. Urban Plan. 123, 145–157. doi:10.1016/j.landurbplan.2013.11.014
Stewart, I. D., and Oke, T. (2012). Local climate zones for urban temperature studies. Bull. Am. Meteorological Soc. 93, 1879–1900. doi:10.1175/BAMS-D-11-00019.1
Sun, Q., Wu, Z., and Tan, J. (2012). The relationship between land surface temperature and land use/land cover in Guangzhou, China. Environ. Earth Sci. - Environ. EARTH Sci. 65, 1687–1694. doi:10.1007/s12665-011-1145-2
Sun, T., Kotthaus, S., Li, D., Ward, H. C., Gao, Z., Ni, G. H., et al. (2017). Attribution and mitigation of heat wave-induced urban heat storage change. Environ. Res. Lett. 12, 114007. doi:10.1088/1748-9326/aa922a
Tan, J., Zheng, Y., Song, G., Kalkstein, L. S., Kalkstein, A. J., and Tang, X. (2007). Heat wave impacts on mortality in Shanghai, 1998 and 2003. Int. J. Biometeorology 51, 193–200. doi:10.1007/s00484-006-0058-3
Tzavali, A. (2015). Urban heat island intensity: A literature review. Fresenius Environ. Bull. 24 (12), 4537–4554. a1-a2.
Wang, J., and Yan, Z. (2021). Rapid rises in the magnitude and risk of extreme regional heat wave events in China. Weather Clim. Extrem. 34, 100379. doi:10.1016/j.wace.2021.100379
Yang, J., Jin, S., Xiao, X., Jin, C., Xia, J. C., Li, X., et al. (2019). Local climate zone ventilation and urban land surface temperatures: Towards a performance-based and wind-sensitive planning proposal in megacities. Sustain. Cities Soc. 47, 101487. doi:10.1016/j.scs.2019.101487
Yang, X., Ruby Leung, L., Zhao, N., Zhao, C., Qian, Y., Hu, K., et al. (2017). Contribution of urbanization to the increase of extreme heat events in an urban agglomeration in east China. Geophys. Res. Lett. 44 (13), 6940–6950. doi:10.1002/2017GL074084
Yang, Y., Guo, M., Ren, G., Liu, S., Zong, L., Zhang, Y., et al. (2022). Modulation of wintertime canopy urban heat island (CUHI) intensity in beijing by synoptic weather pattern in planetary boundary layer. J. Geophys. Res. Atmos. 127. doi:10.1029/2021JD035988
You, Q., Jiang, Z., Kong, L., Wu, Z., Bao, Y., Kang, S., et al. (2017). A comparison of heat wave climatologies and trends in China based on multiple definitions. Clim. Dyn. 48, 3975–3989. doi:10.1007/s00382-016-3315-0
Yow, D. (2007). Urban heat islands: Observations, impacts, and adaptation. Geogr. Compass 1, 1227–1251. doi:10.1111/j.1749-8198.2007.00063.x
Zhao, L., Lee, X., Smith, R. B., and Oleson, K. (2014). Strong contributions of local background climate to urban heat islands. Nature 511, 216–219. doi:10.1038/nature13462
Zhong, S., Qian, Y., Zhao, C., Leung, R., Wang, H., Yang, B., et al. (2017). Urbanization-induced urban heat island and aerosol effects on climate extremes in the Yangtze River Delta region of China. Atmos. Chem. Phys. 17, 5439–5457. doi:10.5194/acp-17-5439-2017
Zhou, L., Yuan, B., Hu, F., Wei, C., Dang, X., and Sun, D. (2021). Understanding the effects of 2D/3D urban morphology on land surface temperature based on local climate zones. Build. Environ. 208, 108578. doi:10.1016/j.buildenv.2021.108578
Zong, L., Liu, S., Yang, Y., Ren, G., Yu, M., Zhang, Y., et al. (2021). Synergistic influence of local climate zones and wind speeds on the urban heat island and heat waves in the megacity of beijing, China. Front. Earth Sci. 9, 458. doi:10.3389/feart.2021.673786
Keywords: urban heat island, heat waves, wind speed, local climate zones, ventilation, urban warming
Citation: Luo F, Yang Y, Zong L and Bi X (2023) The interactions between urban heat island and heat waves amplify urban warming in Guangzhou, China: Roles of urban ventilation and local climate zones. Front. Environ. Sci. 11:1084473. doi: 10.3389/fenvs.2023.1084473
Received: 30 October 2022; Accepted: 27 January 2023;
Published: 10 February 2023.
Edited by:
Haipeng Yu, Northwest Institute of Eco-Environment and Resources (CAS), ChinaReviewed by:
Qian Cao, China University of Geosciences Wuhan, ChinaCopyright © 2023 Luo, Yang, Zong and Bi. This is an open-access article distributed under the terms of the Creative Commons Attribution License (CC BY). The use, distribution or reproduction in other forums is permitted, provided the original author(s) and the copyright owner(s) are credited and that the original publication in this journal is cited, in accordance with accepted academic practice. No use, distribution or reproduction is permitted which does not comply with these terms.
*Correspondence: Yuanjian Yang, eXlqMTk4NUBudWlzdC5lZHUuY24=
Disclaimer: All claims expressed in this article are solely those of the authors and do not necessarily represent those of their affiliated organizations, or those of the publisher, the editors and the reviewers. Any product that may be evaluated in this article or claim that may be made by its manufacturer is not guaranteed or endorsed by the publisher.
Research integrity at Frontiers
Learn more about the work of our research integrity team to safeguard the quality of each article we publish.