 Zunyan Wang
 Qi Li
Qi Li- Shaanxi Key Laboratory of Earth Surface System and Environmental Carrying Capacity, College of Urban and Environmental Sciences, Northwest University, Xi’an, China
The Qinghai-Tibet Plateau is an ecologically fragile region. The changes in physicochemical parameters of water quality [PPOWQ] and land use types [LUT] in different regions will affect the phytoplankton community in rivers, thus threatening the ecosystem. Taking the phytoplankton community as an indicator variable, it is of great significance to study the relative influence of symbiotic factors on regulating human activities and river ecological protection. The results showed that the proportions of Bacillariophyta, Cyanophyta, and Chlorophyta were >84% in the phytoplankton community of taxa composition. The abundance of the phytoplankton community varied from 1.47 × 10⁵ to 7.58 × 10⁵ cells/L. Bacillariophyta had the highest average abundance (>82%). The results of the variance partitioning analysis showed that PPOWQ was the main variable affecting the changes in the phytoplankton community. Redundancy analysis showed that local factors (total nitrogen, salinity, water temperature) and regional factors (forestland, grassland, unused land) (p < 0.05) were the main factors causing the changes in community structure and abundance of dominant algae. The analysis of structural equation models showed that LUT had the least direct impact on the abundance of the phytoplankton community, mainly through changing nutrients and physical parameters. Water temperature and nutrients are still the main factors affecting phytoplankton community abundance. Farmland and forestland are the main sources of total nitrogen in rivers. In general, in the ecologically vulnerable area, it is of guiding significance for the ecological monitoring and management of plateau rivers. In addition to considering water quality, it is also necessary to reasonably plan the LUT around rivers.
1 Introduction
As the primary producer in the river ecosystem, planktonic algae play an important role in energy flow and material cycle, and are often used as indicator organisms (Feio et al., 2009; Ding et al., 2022). The changes of phytoplankton community structure and abundance are closely related to local and regional environmental factors (Li et al., 2021). As an important part of the river ecosystem in the eastern part of the Qinghai-Tibet Plateau, the upper reaches of the Yangtze River may endanger aquatic organisms due to frequent human activities (Kuzmanovic et al., 2015; Liu et al., 2020). Therefore, exploring the coupling effect of LUT and PPOWQ on the composition and abundance of phytoplankton communities will help to better understand the mechanism of environmental factors affecting phytoplankton biodiversity and community distribution characteristics (Reichwaldt and Ghadouani, 2012; Paerl and Paul, 2015).
The spatial characteristics of planktic algal communities are affected by differences in regional and local environmental factors, and there are great differences between seasons and regions (Siegel et al., 2013). Overall, local factors (PPOWQ), such as temperature, salinity, flow rate, nutrients, are the main factors influencing the variation (Hallegraeff, 2010; Michalak et al., 2016). Local nutrient (total nitrogen load) inputs from other tributaries and global climate change (extreme rainfall and long periods of drought) lead to the replacement of planktonic algal communities (Maberly and Elliott, 2012; Richardson et al., 2018). Nutrients (diffuse nitrogen and phosphorus losses) carried by local point sources have long-term effects on phytoplankton community structure and function (Le et al., 2019). Otherwise, the social and environmental problems caused by phytoplankton communities have also been reported in China and abroad (Liu et al., 2010; Liu et al., 2012; Harke et al., 2016). On the other hand, phytoplankton communities can respond to threats from water quality factors (Michalak et al., 2008). For example, salinity, particulate organic carbon and WT, etc., (Shan et al., 2019; Navas-Parejoa et al., 2020). Salinization of freshwater environment can indirectly affect the abundance of planktonic algae by changing water quality or increasing the intake rate of planktonic algae by zooplankton (Lin et al., 2017; Kaushal et al., 2019). Meanwhile, phytoplankton communities are also sensitive to environmental changes and can reflect changes in aquatic ecosystems in a short time (Suikkanen et al., 2007). However, several usually normally neglected regional factors (such as LUT) can also be linked to the river ecosystem through surface runoff (Benda et al., 2004). Different LUTs (farmland, buildingland) can change the PPOWQ of rivers, affect the material cycle, disrupt the balance of aquatic ecosystems, and thus alter phytoplankton communities (Bao et al., 2020). Farmland and buildingland are major sources of river pollutants, and water quality deteriorates when pollutants exceed a certain threshold (Liberoff et al., 2019). Farmland and urbanization have reduced native forestland, with a predominance of Bacillariophyta and Cyanophyta, in the Mediterranean ecoregion of Chile. (Fierro et al., 2019). However, most studies have focused on the effects of nutrients (Torremorell et al., 2009), hydrology (Townsend and Douglas, 2017) or adverse weather factors (Jones et al., 2013) on the composition and diversity of phytoplankton communities.
In recent years, the Yangtze River has experienced environmental problems, such as reduced runoff, increased nutrient concentrations, and water quality degradation (Zhang and Liu, 2011; Yuan and Yang, 2021). The response of phytoplankton communities to the environment is constantly changing (Jones et al., 2013). Previous studies on phytoplankton community in the Yangtze River mainly focused on phytoplankton community abundance and diversity to assess water quality (Wang et al., 2019). However, these studies are mainly limited to the lower reaches of the Yangtze River and near the haikou, and the influencing factors mainly focus on nutrients (TN, TP, COD, DO) and hydrographic (temperature, flow rate, turbidity) factor (Lai et al., 2013; Jiang et al., 2014; Han et al., 2020). Previous researchers have used linear regression models to demonstrate the relationship between phytoplankton and environmental factors (Zhang et al., 2022; Schermelleh-Engel et al., 2003). However, structural equation models can handle not only the relationship between visible variables, but also the causal relationship between potential variables (Jia et al., 2020). Assessment of the effects of LUT on phytoplankton is limited in the upper Yangtze River basin. Some scholars used generalized additive model and structural equation model to prove the coupling effect among land use type, lake form and water quality (Peng et al., 2021; Fu et al., 2022). Therefore, when we explore the influence of multiple factors on phytoplankton community, we should consider the interaction of symbiotic factors.
The effects of environmental factors on phytoplankton community were analyzed by RDA and Correlation Heat Map. We hypothesized that Ele, WT, nutrients, physical parameters, and LUT interactions (direct and indirect) are potential effects on phytoplankton at high altitudes in the upper reaches of the Yangtze River. Structural equation modeling was used to test the hypotheses. The purpose was 1) To study the species composition, distribution and diversity of phytoplankton in rivers; 2) To reveal the influence of LUT, PPOWQ and climatic conditions on dominant algae, and to discuss the coupling effect of LUT and PPOWQ on phytoplankton abundance; 3) Clarify the role of LUT in the process of affecting phytoplankton community. Finally, the influence mechanism of symbiotic factors on phytoplankton was revealed, which provided a theoretical basis for aquatic ecological evaluation in the upper reaches of the Yangtze River.
2 Materials and methods
2.1 Study area
In May 2021, a systematic survey was conducted in the Shigu—Zhiduo section of the Yangtze River Basin, including physical, chemical and biological indicators. The terrain factor, tributary inflow, transportation facilities and other factors were fully considered. A total of 29 sampling sections were set up in the main reaches near the Jinsha River and Tongtian River (Supplementary Table S1). These sections ranged from 100°E–95°E–26°N–34°N (Figure 1) and covered the eastern region of the Qinghai-Tibet Plateau, from arid valleys to alpine forest shrubs and alpine meadows and plateau deserts (Chen et al., 2020).
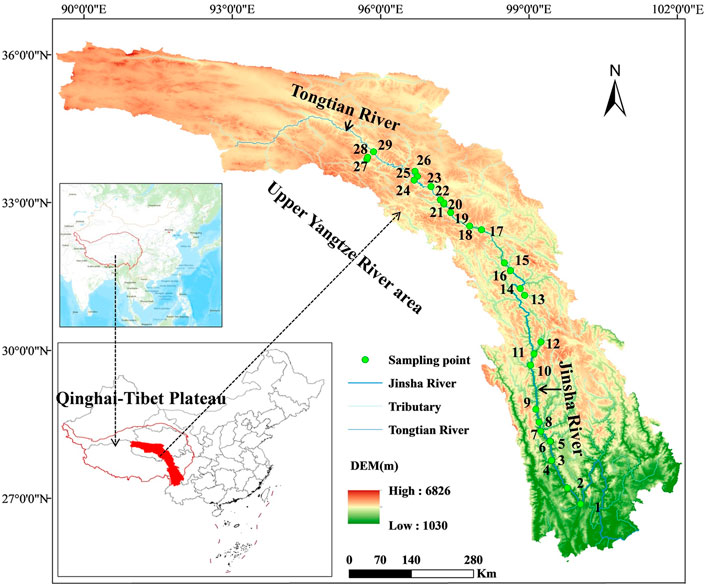
FIGURE 1. Distribution of sampling points in the study area.
2.2 Sample collection and determination
The 25 # planktonic net was used to slide slowly around the water surface several times, and washed the phytoplankton in the net into a 100 mL plastic bottle with deionized water, following fixed in a suitable amount of Lugol’s iodine solution, and 4°C cryopreservation. Quantitative samples were collected with a 1 L organic glass sampler and fixed with Lugol’s iodine solution. After 48 h of precipitating, the supernatant was siphoned to 30 mL, counting under the microscope using a 0.1 mL plankton counting cell. Adopting a 10 × 40 times microscope for species identification (Jiangxi Shangrao Phenix microscope, Phoenix Optical Group Co., Ltd.) To ensure accuracy and to fully comprehend phytoplankton communities, they were accurately classified down to the genus level. The existing genus-level identification data provided the basis for the identification of phytoplankton (Hu and Wei, 2006; Weng and Xu, 2010).
The calculation formula for phytoplankton abundance is as follows (Reynolds, 2006):
Where Abundance (cell/L) is the phytoplankton abundance, Cj is the area of counting cells, and Vs (mL) is the volume of concentrated sample. N, Ps Pn, and Vj (mL) are the number of phytoplankton counted, the area of view, the number of visual fields (100 visual fields) and the volume of the counting cells respectively. Water temperature (WT, °C), dissolved oxygen (DO, mg/L), pH, salinity (Sal, mg/L), oxidation-reduction potential (ORP, mV) and electrical conductivity (EC, μS/cm) were measured in situ with portable multi-parameter water quality analyzer (a WTW Multi 3630 IDS: Xylem Analytics Germany Sales GmbH and Co. KG). Elevation (Ele, m) was determined by a handheld GPS measuring instrument (China Zhuolin Technology Co., LTD.) Velocity (V, m/s) was measured by an MGG/KL DCB electromagnetic flowmeter (Guangzhou Hongcheng Electronic Technology Co., LTD.) In the laboratory, total phosphorus (TP, mg/L) was analyzed by potassium persulfate-molybdenum antimony spectrophotometry, and total nitrogen (TN, mg/L) was determined by potassium sulphate oxidation spectrophotometry. Chlorophylla (Chla, μg/L) was measured by acetone extraction spectrophotometry. The detailed description of hydrochemical analysis follows the analytical method for water and wastewater detection in China (State Environmental Protection Administration, 2002a; State Environmental Protection Administration, 2002b).
2.3 Land use type (LUT) and climatic conditions data
The buffer areas of 29 sampling points were delimited by ArcGIS 10.6 using a digital elevation model (DEM) with a resolution of 1 km. The LUT in the range of 1,000, 2000, 3,000, 4,000, and 5,000 m were extracted respectively, and the LUT buffer area was analyzed for each sampling point. LUT were divided into 6 categories: farmland (Far), forestland (For), grassland (Gra), waters (Wat, including rivers, ponds, reservoirs, beaches), building land (Bui), unused land (Unu, including sandy, Gobi, saline, swamp, bare land, bare rock texture). Data on Land Use Types and climatic conditions (Temperature, Precipitation, Illumination, Evaporation) (Supplementary Table S3) in 2020 from Resource and Environmental Science and Data Center (https://www.resdc.cn/).
2.4 Data analysis
2.4.1 Diversity analysis of the phytoplankton community
Simpson index, Shannon-Wiener index, Margalef index, Ber-Parker index and Evenness index are commonly used to analyze the diversity index of the phytoplankton community. In this study, we used Paste 3 software to analyze and calculate these indices. The dominance index of 29 sampling points was calculated by the formula:
Where Y is the dominance, N is the total number of algae in the same sample, Ni and fi are the numbers of phytoplankton species i and the frequency of a certain algae species in the sample, respectively (Luo et al., 2007). The dominant algae were selected according to the average dominance above1% of the sampling points for the analysis of the phytoplankton community and environmental parameters.
2.4.2 Correlation analysis of environmental parameters
According to the K-S test, the data set didn’t fit the normal distribution, hence Spearman correlation analysis method was selected (Lilliefors, 1967). The Spearman correlation method was used to evaluate the correlation between PPOWQ and LUT by IBM SPSS Statistics 26 software.
2.4.3 Redundancy analysis (RDA) and variance partitioning analysis (VPA)
Detrended correspondence analysis (DCA) was conducted on PPOWQ and LUT at different sampling points. Since the first axis gradient length is 1.3, the effects of PPOWQ and LUT on changes in phytoplankton community structure were analyzed using RDA (Borcard et al., 1992). Before analysis, environmental variables were analyzed by log10 (x + 1) transformation (except pH), and variance extension factors above 10 were removed by the stepwise method. Otherwise, the LUT in the range of 1,000–5,000 m was analyzed. We chose the 4,000 m buffer with the best explanatory variables of PPOWQ by LUT for subsequent analysis (Supplementary Table S2). Environmental factors are explanatory variables and phytoplankton community abundance is the response variable. Canoco 5 software was used for RDA analysis, and the positive screening program was used to screen the environmental factors (499 permutations) (Van Den Wollenberg, 1977). VPA analysis and mapping of PPOWQ (including WT, TN, TP, pH, Ele, Sal, V, and Do), climatic conditions and LUT (including Far, Wat, For, Gra and Unu) were implemented with R 4.0.4 package “vegan”.
2.4.4 Correlation cluster thermal graph analysis of phytoplankton and environmental parameters
The Origin 2021 “Heat Map with Dendrogram” software package was used to analyze the correlation between environmental parameters and dominant phytoplankton. Firstly, the Ward method is used to measure the similarity between algae, and the Pearson correlation is used for distance type.
2.4.5 Structural equation model (SEM)
The effects of environmental factors on phytoplankton abundance were studied by SEM. The environmental factors were divided into four categories: Ele, Nutrient Substances (NutS, including TN, TP), LUT and Physical parameters (PhyP, including WT, pH, DO, Sal, V). SEM can analyze the expected relationship between different explanatory variables (Byrne, 2011). The rectangle represents observable variables while the ellipse represents latent variables. Black arrows indicate low path correlation and not significant, while red and blue arrows denote the paths that are positively and negatively correlated, respectively. SEM analysis using IBM SPSS AMOS 21.0 software with maximum likelihood method. The suitability of SEM was evaluated by X2/df, P, RMSEA, and CFI (Bollen and Stine, 1992; Arhonditsis et al., 2007).
3 Results
3.1 Land use type and physicochemical parameters of water quality
Analysis of the land use type on 29 sampling points showed that the predominant land use types were Gra, For and Far; Wat and Unu made up a relatively small fraction of the total, while Bui was not included (Figure 2). Around the sample points of S1–S3 and S12–S19, For is more abundant than Unu, which is assumed to be the terrain with more valleys and gullies. Around S5–S10, S20–S29, Gra was the predominant kind of land use, and Unu account for around 20% of sampling points S27–S29, which were considered to have less undulation, a thin soil layer and more gravel.
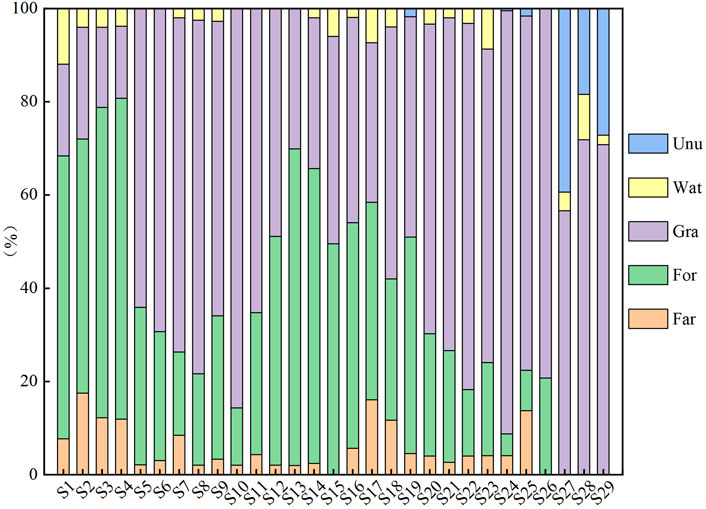
FIGURE 2. The proportion of LUT in 4,000 m buffer zone.
It can be seen that the sampling points’ water showed alkalescent (Table 1). The sampling locations’ pH ranged from 7.10 (S7) to 7.96 (S28), while the DO ranged from 6.9 (S28) to 8.43 mg/L (S7). V was 0.05 (S27) −1.2 m/s (S29) according to the sampling geographical location. In general, pH increased with the increase of Ele, ORP decreased with the increase of Ele, and EC showed no obvious rule. WT showed a downward trend with the increase of Ele. S4, S5, S12, S13, S24, S26, S27, and S29 sampling points belong to tributaries. The values of Sal, EC and ORP in tributaries were generally lower than those in nearby mainstream sampling points. The environment in the mainstream was less vegetated and had more gravel and boulders than the area near the tributaries. According to the Environmental Quality Standard for Surface Water in China (State Environmental Protection Administration, 2002a), TN in S1, S2 and S9 sampling points exceeded the Class III water quality standard, which was within the Class III water quality standard, while DO and TP was within the Class II water quality standard.
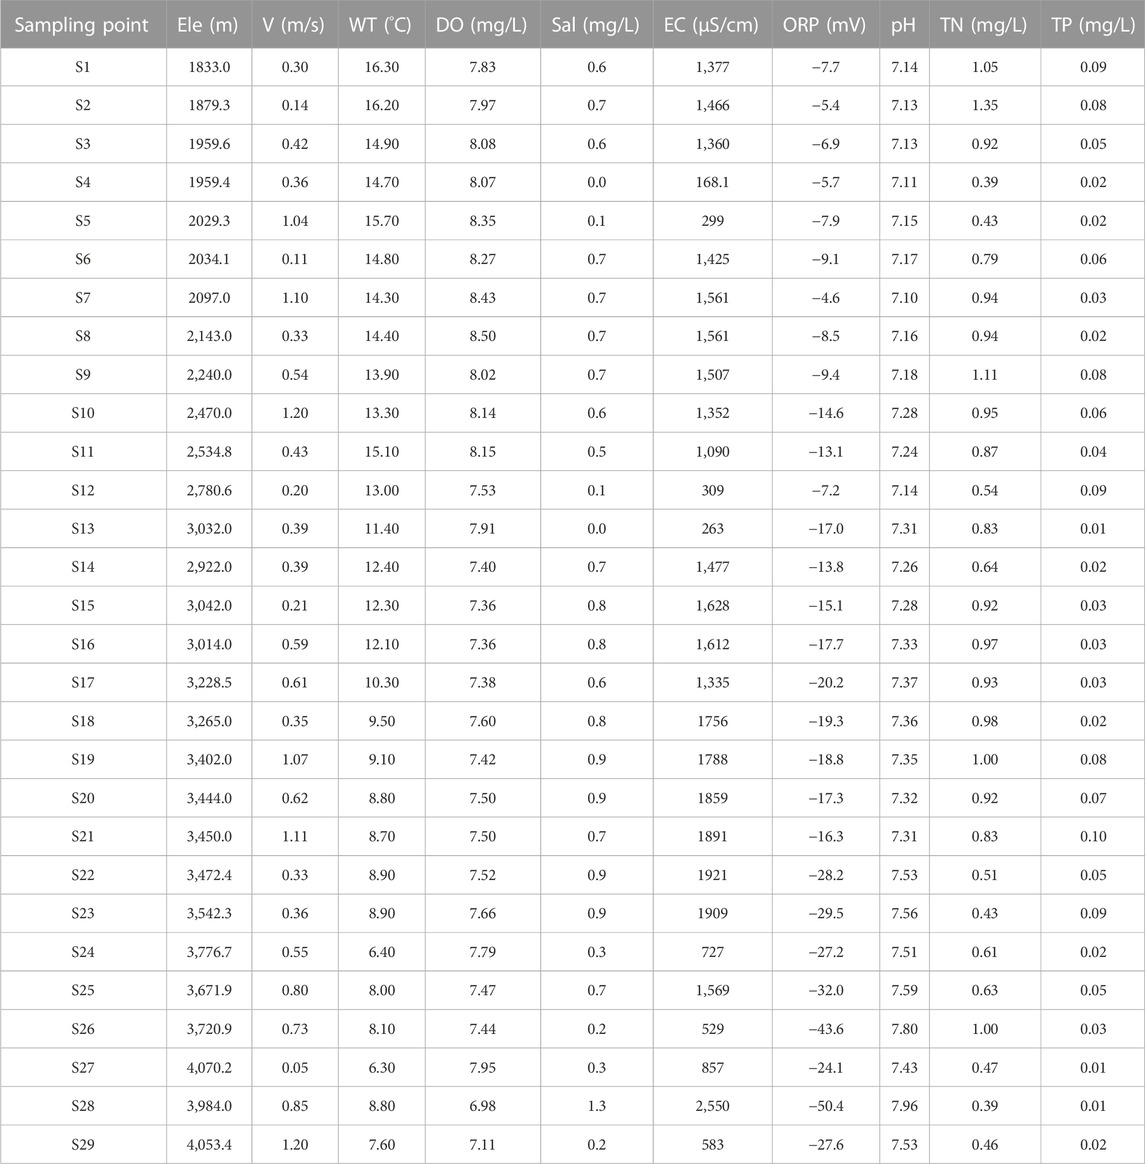
TABLE 1. Physicochemical parameters of water quality at 29 sampling points.
3.2 Diversity and abundance of phytoplankton community structure
Through qualitative and quantitative analysis, 8 phyla and 60 genera of phytoplankton were identified in 29 sampling points (Figure 3). Including Bacillariophyta 23 genera, accounting for 43.40% of the total species; Chlorophyta 13 genera, accounting for 24.53%; Cyanophyt 9 genera, accounting for 16.98%. Xanthophyta 2 genera, Chrysophyta 3 genera, Phaeophyta 1 genera, Pyrroptata 1 genera and Euglenophyta 1 genera, accounting for 15.09% of the total species. The majority of the samples came from diatom species, which represented more than 50% in all sampling points except the S5 sampling point. The second was Chlorophytum, with an average proportion of 15.52%. The average proportion of Cyanophyta species was 11.04%. The phytoplankton only appeared at S2–S5, S7, S9, S17–S19, S22, and S24 sampling points, and the proportion was less than 5.00%. The 13 species of dominant algae were obtained by Y. They were Oscillatoria, Diatoma, Synedra, Tabellaria, Gomphonema, Cymbella, Navicula, Eunotia Ehrenberg, Nitzschia, Achnanthes, Licmophora, Pinnuiaria, and Limnothrix, respectively.
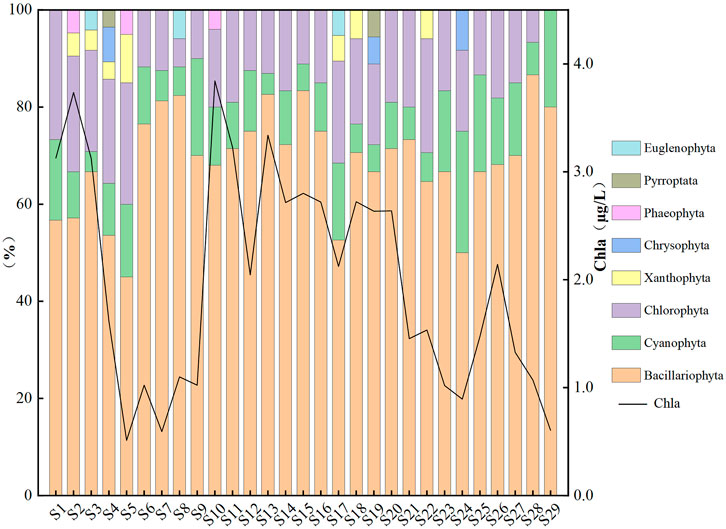
FIGURE 3. Proportion of phytoplankton phylum levels and Chla at sampling points.
The phytoplankton abundance of each sampling point was obtained by quantitative analysis, which was mainly composed of Bacillariophyta, Chlorophyta and Cyanophyta (Figure 3). They accounted for 63.64%–90.38%, 0.00%–22.73%, 3.23%–16.67% and the average proportion was 82.03%, 9.56% and 8.40%, respectively. Notably, no Chlorophyta was observed at the S29 sampling point. The variation range of phytoplankton abundance was 1.47 × 10⁵–7.58 × 10⁵ cells/L in the study area. At various sampling locations, the phytoplankton abundance varied significantly, which was essentially consistent with the variable pattern of Chla. Meanwhile, The minimum Chla concentration (S5) was 0.51 μg/L, the maximum Chla concentration (S10) was 3.84 μg/L, and the maximum concentration was more than seven times the minimum. As can be observed, the environment has a significant impact on the phytoplankton at all sampling locations.
The phytoplankton diversity index Margalef (0.6503–1.773) focused on the richness of phytoplankton, while Simpson (0.7593–0.9313) and Shannon-Wiener (1.812–2.942) focused on the diversity of phytoplankton (Figure 4). The changing pattern for the three indices in the 29 sampling points were basically at the same, and inflection points occurred at the same sampling point. The sampling points of tributaries are S5, S12, S13, S24, S26, and S27. The peak value appeared at S26, indicating that the phytoplankton community diversity was higher than that at other sampling sites. The valley value appeared at the sampling site S12, indicating that the phytoplankton community diversity here was low. In the mainstream, the peak values appeared at S1, S3, S6, S10, S16, and S20, indicating a large diversity of phytoplankton. Valley values were found at S2, S4, S9, S18, S25, and S29, indicating a lower phytoplankton community diversity. Berger Parker (0.1176–0.4444) index can be used to represent the dominant species of phytoplankton. In the mainstream, the larger indices of sampling sites S4, S18, and S25 indicate a higher proportion of dominant phytoplankton species at these sites. The evenness (0.6804–0.9473) index represents the relative abundance of different species, and also refers to the evenness. The lowest evenness index was found at sampling point S25, indicating that the point had an uneven distribution of phytoplankton and poor community stability compared to other sampling points.
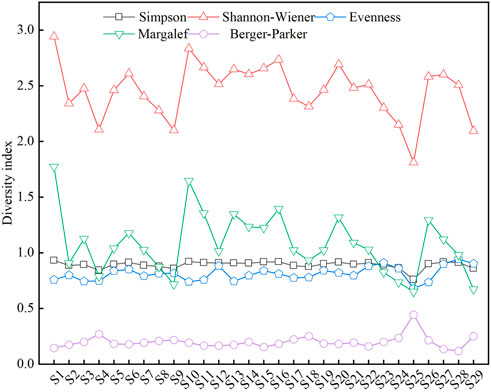
FIGURE 4. Variation of diversity index at different sampling points.
3.3 Correlation analysis of environmental factors
Spearman correlation between PPOWQ and LUT (Figure 5). Ele was positively correlated with pH, Gra, and Unu and negatively correlated with WT, DO, ORP, TN, and For. V had a significant positive correlation with Chla. WT was significantly positively correlated with DO, ORP, TN and For, and negatively correlated with pH, Gra and Unu. DO was positively correlated with ORP and, negatively correlated with pH. Sal was positively correlated with EC. ORP was positively correlated with For and negatively correlated with pH and Gra. pH was positively correlated with Gra, and negatively correlated with For. TN was positively correlated with Chla and Far, and negatively correlated with Unu. Chla was positively correlated with Far and For, and negatively correlated with Gra. Here we want to specifically illustrate the strength of the correlation between LUT and PPOWQ. The correlation coefficients of Far to TN and Chla were 0.418 and 0.532, respectively. The correlation coefficient between For and Chla was 0.692; The correlation coefficient between Unu and TN was −0.445 (Supplementary Table S4).
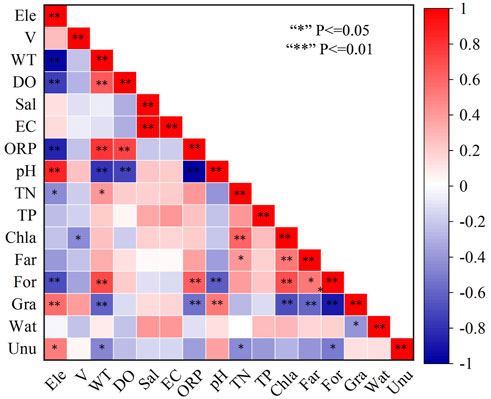
FIGURE 5. Heat map of the spearman correlation among LUT and PPOWQ.
3.4 Redundancy analysis and variance partitioning analysis of environmental variables and phytoplankton
RDA showed that phytoplankton community structure and abundance were significantly correlated with local environmental variables (p < 0.05) (Figure 6A). The explanatory variables of PPOWQ and LUT for phytoplankton community were 69.6% (p = 0.002). The first two axes could explain 66.28% (Axis1) and 11.79% (Axis2) of the total variables of phytoplankton community structure, respectively. It indicated that the selected PPOWQ and LUT had a significant impact on how the structure of phytoplankton community changed. TN had a positive effect on most dominant species (explanatory variable: 15.3%, p = 0.002), DO (p = 0.064) and WT (explanatory variable: 7.9%, p = 0.008) had a negative effect on Licmophora and Limnothrix, residual algae had a positive effect. Sal (explanatory variable: 5.5%, p = 0.04), Ele and PH had a positive effect on Licmophora and Limnothrix, and V (p>0.05) had a negative effect on all dominant species. Overall, TN, WT and Sal had the most significant effects on phytoplankton community structure, which were considered the main driving factors. Gra (p = 0.208) had negatively effect on dominant algae except for Licmophora, especially Diatoma, Navicula and Achnanthes. For (explanatory variable: 5.3%, p = 0.03) had a positive effect, especially on Diatoma, Navicula and Nitzschia; Unu (explanatory variable: 4.4%, p = 0.082) had a negative effect on all dominant algae, and was extremely indigenous to Diatoma, Navicula and Synedra; Far (p = 0.154) had a significant effect on Cymbella and Gomphonema, while Wat (p = 0.054) had significantly effect on Licmophora and Limnothrix. In summary, For, Gra and Unu were the main LUT for the change in the phytoplankton community. The explanatory variables of climatic conditions for phytoplankton community were 31.0% (p = 0.006). The first two axes could explain 73.01% (Axis1) and 15.38% (Axis2) of the total variables of phytoplankton community structure, respectively (Figure 6B). It indicated that the selected climatic conditions had a significant impact on how the structure of phytoplankton community changed. Temperature (explanatory variable: 7.1%, p = 0.018), Illumination (explanatory variable: 15.2%, p = 0.002), Evaporation (explanatory variable: 6.2%, p = 0.026) had positive effects on all algae except Licmophora and Limnothrix. Precipitation (p = 0.604) was not significant.
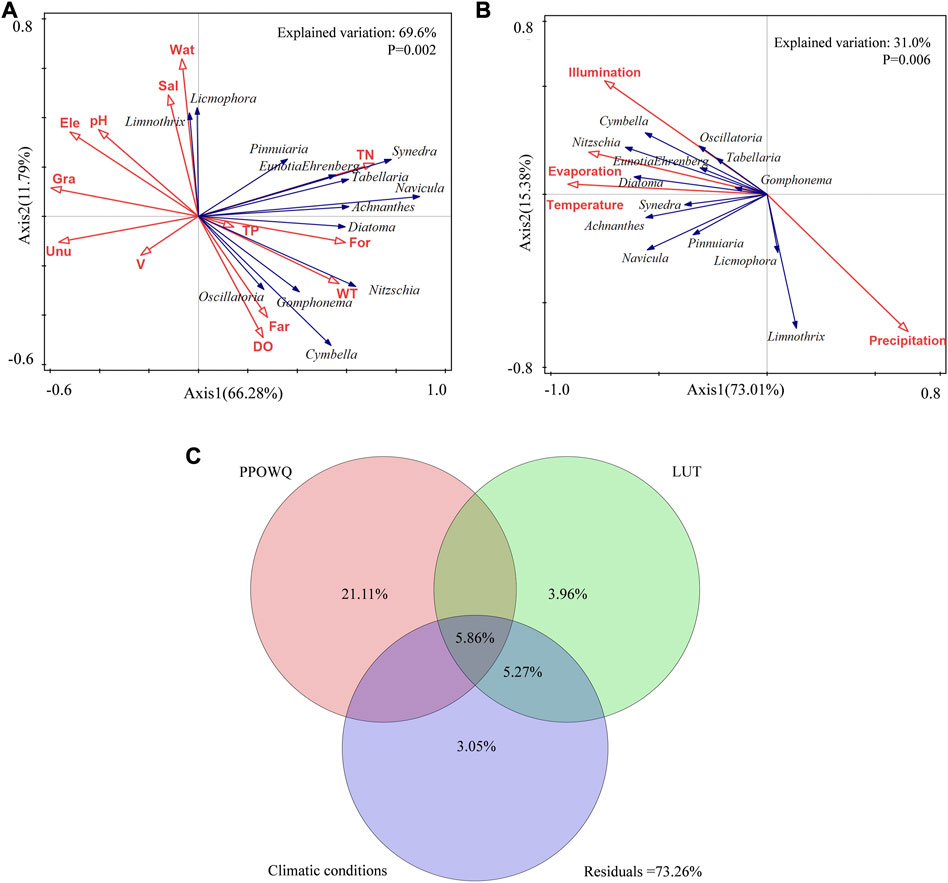
FIGURE 6. (A,B) Redundancy analysis of the effects of PPOWQ, LUT and climatic conditions on phytoplankton communities and (C) venn analysis showing the common effects of PPOWQ, LUT and climatic conditions on phytoplankton community.
Venn analysis was used to evaluate the relative importance of PPOWQ, LUT and climatic conditions on changes in phytoplankton community structure (Figure 6C). The variation of the phytoplankton community was mainly related to PPOWQ with an explanation rate of 21.11%, followed by climatic conditions and LUT with an explanation rate of 3.96% and 3.05%. The combined interpretation rate for LUT and climatic conditions was 5.27%. The common interpretation rate for PPOWQ, LUT and climatic conditions is 5.86%. The unexplained variance by PPOWQ, LUT and climatic conditionsvariables were 73.26%. The influence of climatic conditions on the phytoplankton community structure was relatively weak.
3.5 Correlation cluster thermal graph analysis of environmental variables and phytoplankton
Different types of algae react differently to environmental factors. In order to determine the relative importance of phytoplankton and environmental variables, the dominant algae and environmental factors were selected for correlation heat map analysis (Figure 7). Licmophora was significantly negatively correlated with DO. Cymbella and Diatoma were positively correlated with DO, which negatively correlated with pH. Oscillatoria had a significant negative correlation with Sal. TN and Diatoma, Synedra, Tabellaria, Navicula and Eunotia Ehrenberg. Diatoma, Cymbella, Navicula and Nitzschia were significantly negatively correlated with Ele and positively correlated with WT. Achnanthes was significantly positively correlated with WT, and significantly negatively correlated with V. Diatoma, Synedra, Navicula and Achnanthes were significantly positively correlated with For and negatively correlated with Unu. Cymbella was significantly positively correlated with Far and For, and significantly positively correlated with Wat. Navicula and Nitzschia were significantly negatively correlated with Gra. There was no significant correlation between dominant algae and TP. These results are basically consistent with RDA.
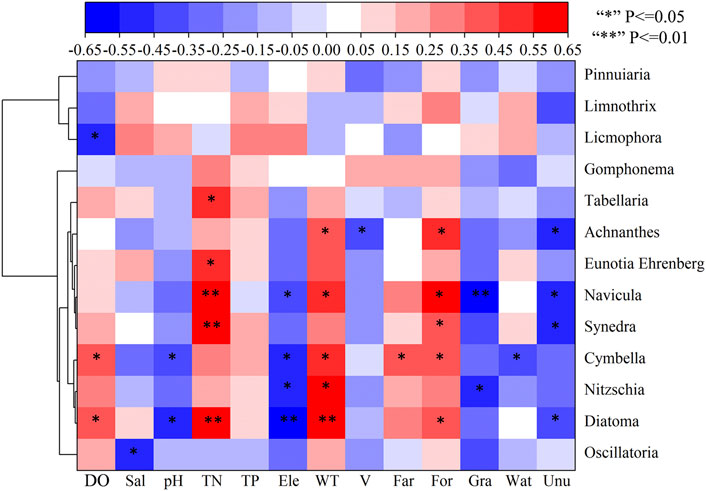
FIGURE 7. Cluster heat map analysis of correlation between environmental variables and dominant algae.
3.6 Structural equation model analysis of environmental variables and phytoplankton abundance
After model optimization (SEM parameters: X2/df = 1.131, p = 0.245>0.05, CFI = 0.970, RMSEA = 0.068), the SEM model had be used to determine the direct and indirect effects of LUT (R2 = 0.30), NutS (R2 = 0.52) and PhyP (R2 = 0.87) on phytoplankton abundance (R2 = 0.81) (Figure 8). The results of the model showed that the path of direct influence of LUT on phytoplankton abundance was not significant and was removed from the model. WT (R2 = 0.73, p = 0.011) had a direct impact on phytoplankton, and the pathway was significantly positively correlated with native phytoplankton. The standardized factor loads of potential variable LUT and observed variables (Far, Unu and For) were 0.69, −0.88, and 1.00, respectively. Observed variables were significantly correlated with latent variables (p < 0.001), and the correlation between For and Unu was greater than Far. The standardized pathway coefficients of LUT to NutS and PhyP were 0.72 and −0.13, respectively, and LUT had significantly positively correlated with NutS (p < 0.001). The standardized factor load of TN and potential variable NutS was 0.77, showing a significantly positively correlated (p < 0.001). The standardized factor load of TP was 0.36, showing no significantly positively correlated (p = 0.079). The correlation was greater for TN than for TP. The standardized pathway coefficient of NutS for phytoplankton abundance was 0.79, showing a significantly positively correlated (p = 0.001). Ele had a significant negative correlation with LUT and WT and positively correlated with the potential variable PhyP (p < 0.001). The standardized path coefficients were −0.55, −0.94, and 0.86, respectively. The standardized factor loadings of the potential variable PhyP and the observed variables (pH, DO) were 0.89 and −0.78, which were significantly correlated (p < 0.001). The standardized pathway coefficient between PhyP and phytoplankton abundance was 0.55, p = 0.076, and there was no significant correlation. The influence of NUT and WT on phytoplankton abundance was greater than those of PhyP.
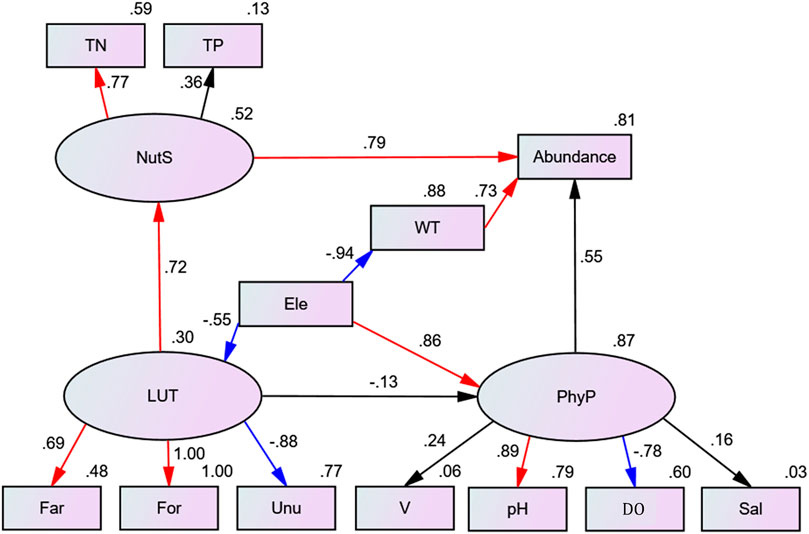
FIGURE 8. Structural equation model of interaction between environmental variables and phytoplankton abundance.
4 Discussion
4.1 Driving factors of dominant phytoplankton community composition and abundance
In this study, from the Shigu section of the upper Yangtze River to Zhiduo County, eight phyla and 60 genera were identified at 29 sampling points. Bacillariophyta dominated the phytoplankton community (63.64%–90.38%), followed by Chlorophyta and Cyanophyta. Phytoplankton was common in rivers in the Tibetan Plateau (Han et al., 2020; Weng et al., 2020). The phytoplankton abundance ranged from 1.47 × 10⁵ cells/L to 7.58 × 10⁵ cells/L. Compared with previous studies, the abundance of planktonic algae has increased, and it is not obvious (Gao et al., 2019; Lu et al., 2020). In previous studies on the middle and lower reaches of the Yangtze River, the proportion of Chlorophyta and Cyanophyta was relatively high, while the proportion of Bacillariophyta abundance decreased (Liu et al., 2019). The mean values of the Margalef, Shannon-Wiener and Evenness indexes were 1.080, 2.458, and 0.812, respectively. This indicated that the phytoplankton community had small repeatability, high stability, and uniform species distribution in Shigu-Zhiduo County of the upper Yangtze River. However, the species was relatively single, with Bacillariophyta occupying the dominant phyla, and the frequency of other phyla was extremely low (Hu et al., 2022). According to the analysis results of the average diversity index, the water quality of the river is moderately light pollution. To sum up, the river is nutritionally poor. This result may be related to the river topography, climate characteristics and habitat conditions (Long et al., 2011; Xue et al., 2011).
This study proved that the phytoplankton community was affected by many factors, and PPOWQ had the highest explanatory variable for phytoplankton community structure. The results were consistent with those of Özkan and Liao who confirmed that PPOWQ was the dominant factor of the phytoplankton community (Özkan et al., 2013; Liao et al., 2016). In this study, a total of 13 dominant algae species were found, 11 species of which were Bacillariophyta. This may be due to the particular geographical environment of the sampling area, with low temperature and high altitude, where surface runoff brings a large amount of sediment into the river, providing sufficient silicon, and leading to a more suitable survival of Bacillariophyta. This is consistent with the theory that phytoplankton in plateau rivers are dominated by diatoms (Devercelli and Farrell, 2013; Marra et al., 2018; Sun et al., 2021). In previous studies, the dominant algal species included Diatoma, Synedra, Gomphonema, Cymbella, Navicula, Nitzschia, Melosira granulate, Fragilaria intermedia, Asterionella Formosa and Cyclotella meneghiniana. The results of this study showed that the phytoplankton community underwent a succession change of dominant algal species, with the addition of Lacustrum and Oscillata. The LUT promoted the succession of phytoplankton communities in different directions due to the different responses of phytoplankton communities to increasing TN concentration along Ele (Gao et al., 2019; Lu et al., 2020).
WT is the dominant factor in the reproduction of some algae (Malviya et al., 2016). In the present study, WT gradually decreased with increasing Ele, which largely limited the community structure of phytoplankton, while Bacillariophyta were good competitors at low temperatures and non-nutritional environments. When nutrients are scarce, an increase in WT can encourage phytoplankton metabolism, enhancing its ability to reproduce (Cha et al., 2017). In this study, Diatoma, Cymbella, Navicula, Nitzschia, and Achnanthes were significantly positively correlated with WT, while the dominant algae remained less significant. This suggested that a suitable WT range was an important condition for the growth of phytoplankton and that different phytoplankton would respond to WT by different mechanisms. (Kim et al., 2019). When the WT range was between 6.30°C and 16.30°C, Bacillariophyta was better suited to survival than other species (Jean et al., 2017). In the sampling points with Traces of tourists and herders, the riverbank contains domestic garbage, and TN was relatively high. Phytoplankton abundance increased, for example, at sampling sites S1, S2, and S9. The effect of TN on phytoplankton abundance was stronger than that of TP, which may be related to the high TN content and the high N:P ratio in the study area, leading to the weak correlation of TP (Christopher and John, 2017). TP content was low in the study area, which largely limited the growth of Chlorophyta and Cyanophyta, and Bacillariophyta dominated (Peñuelas et al., 2013; Maberly et al., 2020; Osburn et al., 2021).
Due to the decrease of Temperature and Illumination, WT also decreases, which affects the community structure of planktic algae, and Bacillariophyta which are suitable for low temperature environment dominate (Komatsu et al., 2007). At the same time, Illumination is a necessary condition for algae photosynthesis. Short time and weak Illumination are unfavorable to the growth of Cyanobacteria and Chlorophyta, which will be gradually replaced by Bacillariophyta (Jiang et al., 2010). Studies have shown that Bacillariophyta have a wider tolerance to Illumination and can reproduce and grow better (Zhang et al., 2021). Low Precipitation has no significant effect on planktonic algal community in the upper Yangtze River basin. Perhaps extreme rainfall can alter planktic algal patterns, such as the cyanobacteria bloom event at Maggiore Lake in northern Italy (Morabito et al., 2018). Evaporation affects planktonic algal communities mainly by changing the salinity of rivers or lakes. For example, researchers using solar evaporation ponds have found that changes in salinity affect plankton-algal communities and zooplankton grazing in near Harper Dry Lake, Barstow, California (Herbst, 2006).
Increasing salinity can change the diversity of plankton, causing damage to the structure and function of river ecosystems (Jeppesen et al., 2020; Moffett et al., 2020). Li et al. (2021) analyzed the variation characteristics of the phytoplankton community along the salinity gradient and found that the abundance of phytoplankton was negatively correlated with Sal, and the threshold of Bacillariophyta and Chlorophyta was higher. Algae cells have a high metabolic rate within the appropriate salinity range, which can promote growth. However, when the salinity exceeds the appropriate salinity range, algae growth is inhibited (Chen et al., 2019). In this study, Sal was significantly negatively correlated with Oscillatoria but had no significant effect on other dominant algae. This indicated that different phytoplankton had different tolerance responses to Sal, and Oscillatoria was not easy to grow and reproduce in the water environment with high Sal concentration (Wang et al., 2023). That’s because the increase of Sal will affect the osmotic pressure within phytoplankton cells, leading to dysfunctional metabolism in phytoplankton (Redden and Rukminasari, 2008). Nche-Fambo et al. (2015) showed that Bacillariophyta showed high tolerance to high Sal levels, and the physiological adaptation threshold of this kind of phytoplankton was wide. It was consistent with the results that the dominant algae had no significant correlation with Sal in this study, except for Oscillatoria. This may also be caused by the low content of Sal in the study area. Low concentration of Sal will not affect the growth of Bacillariophyta, so the correlation between Bacillariophyta and Sal is not significant (Afonina and Tashlykova, 2018). Bacillariophyta relies on Si to form the cell membrane, proper Sal is beneficial for phytoplankton to absorb Si (Diego et al., 2015). Li et al. (2015) used the simulation experiment of V on the growth and community change of phytoplankton, indicating that V inhibited the growth of phytoplankton and caused the community succession of phytoplankton. Chlorophyta and Cyanophyta are suitable for living in relatively stable habitats, and their competitiveness is weak in flowing rivers (Hondzo and Warnaars, 2008; Mitrovic et al., 2008). Diatoms will gradually become dominant in phytoplankton communities, replacing Chlorophyta and Cyanophyta.
Under the combined pressure of nutrients and salinity, the size of zooplankton community can change the grazing effect on planktonic algae, and may adversely affect the community structure and abundance of planktonic algae (Yang et al., 2023). There is a significant correlation between zooplankton density and phytoplankton density in the Tibet section of Lantsang, and phytoplankton can affect zooplankton density through upward regulation (Du et al., 2022). The biomass of zooplankton in the upper reaches of the Yangtze River ranged from 1.12 to 60.36 zooplankton/L, with the highest proportions of copepods, rotifers and cladocera (Wu et al., 2023; Zhong et al., 2023). The food size spectrum of copepods and rotifers is narrower than that of cladocera and may be less efficient for planktic algae grazing overall (Ger et al., 2019). Zooplankton have selective grazing, with high zooplankton grazing of Chlorophyta and Cyanophyta in high salinity rivers, which may be one of the reasons for the dominance of Bacillariophyta (Muylaert and Sabbe, 1999; Jeppesen et al., 2007). If the growth of planktic algae cannot keep up with grazing losses, it will decrease the abundance of planktic algae (Leitão et al., 2018).
As demonstrated by Katsiapi, Far and Bui imported nutrients into rivers or lakes (Katsiapi et al., 2012). Due to the absence of Bui in the study area, For, Far and Gra were the primary factors affecting the change in the phytoplankton community and have varying degrees of influence on Chla. Diatoma, Synedra, Navicula and Achnanthes were significantly positively correlated with For and negatively correlated with Unu, while Cymbella was significantly positively correlated with Far and For. Due to the gently sloping nature of the For and Gra, the water bodies are susceptible to human disturbances such as higher anthropogenic input of nutrients into the water environment and longer nutrient retention times, thus enhancing the potential for algal growth. (Chang, 2008; Cha et al., 2017). Obviously, LUT can change phytoplankton abundance by increasing or decreasing nutrients (Peng et al., 2021).
4.2 The relative importance of environmental variables on dominant phytoplankton
Climatic conditions, LUT and PPOWQ can affect phytoplankton communities, such as TN, Ele, WT, Temperature, Illumination, Evaporation, For and Unu (Figure 6). Our results showed that TN and WT, but not LUT, are the main factors affecting the phytoplankton community. Since TN is essential for the growth of phytoplankton and can be converted into its own energy, while WT provides the appropriate environmental conditions required by phytoplankton, Bacillariophyta are the most restricted community (Domingues et al., 2011). This result also confirmed that PPOWQ was the main factor driving the change of phytoplankton community, and the interaction between PPOWQ and LUT (Rui et al., 2015). This is probably due to LUT indirectly affecting the phytoplankton community through the coupling of PPOWQ (Peng et al., 2021). This was confirmed in this study (Figure 7). The results showed that LUT had no significant direct effect on the abundance of phytoplankton, but indirectly affected the growth of phytoplankton through increasing nutrients.
Our results showed that nutrients and WT were the main factors affecting abundance of phytoplankton, producing significant path coefficients (Figure 7). This indicates that the increase of TN and WT will lead to eutrophication of water and the increase of phytoplankton. It is not difficult to see that the path coefficient of LUT was not significant on abundance of phytoplankton, and the path was not shown. It should be noted that the path coefficient of LUT for nutrients is significant. This indicates that LUT had no directly effect on the abundance of phytoplankton, but indirectly through the input of nutrients (TN, TP) (Peng et al., 2021). In the upper Delaware River basin of New York State, the influence of LUT on algae was explored through the input of TN, TP and other substances, which were closely related to the abundance of diatoms (Gabel et al., 2012). SEM confirmed this view that LUT indirectly affected the growth of phytoplankton by increasing nutrients in rivers (Figure 7). Machmuller et al. (2015) showed that changes in LUT could accumulate soil organic matter. Nutrient input from surface runoff provides a suitable living environment for phytoplankton.
Far and Bui are generally considered by relevant scholars as the main sources of nutrients in rivers or lakes (Katsiapi et al., 2012). Many experts have reported a positive correlation between phytoplankton community abundance and Far and Bui (Munn et al., 2010; Ding et al., 2015). Other studies have shown a negative correlation between For and phytoplankton community abundance. It may be due to the nature of the soil, which is not easy to transfer, For it will hinder or weaken the transport of nutrients to the river (Mori et al., 2015). Meanwhile, previous studies of Chlorophyta and Cyanophyta dominated, with Bacillariophyta almost absent. However, in this study, For was positively correlated with the phytoplankton communities (Figure 6). In this study, the study area belongs to the upper reaches of the Yangtze River, thus Far, For, and Gra were the dominant land use types (Figure 2). Far and For continuously provided TN and TP for the river, while the path of the Gra was not shown. The use of fertilizers had a significant effect on the increase of N and P elements in the Far (Tian et al., 2019). The dead leaves provided sufficient organic matter to the river (Katsiapi et al., 2012). This may be related to the special geology and geomorphology of the study area. Soft soil covered the surface layer, and the slope was a key factor affecting soil erosion and soil erosion (Alexander et al., 2002). Organic waste on the surface of the soil was degraded by microorganisms for a long time, resulting in large runoff in summer and can be carried to rivers to supplement nutrients. Rainwater in summer brings lots of nutrients to rivers, which lay an important foundation for the distribution pattern and abundance of phytoplankton communities (Liu et al., 2019; Liu et al., 2021). It is worth mentioning that our findings are dominated by Bacillariophyta, which can utilize microorganisms and photodegrade organic matter (Deininger et al., 2017). Therefore, organic molecules provided by For play an important role in the growth of diatoms, which in a certain sense supports the good growth of diatoms in this area (Liu et al., 2019). As the third most important land use type, Unu had a negative effect on the growth of phytoplankton communities (Figure 6). The SEM results also confirmed that Unu had a negative and indirect effect on the abundance of phytoplankton. This might be the case since the Unu in this study area primarily consists of huge pebbles, cobblestones, etc., which are insufficient to supply the river with the necessary nutrients (Liu et al., 2012).
4.3 Implications and limitations
The aim of this study was primarily to investigate how land use types and environmental factors in different buffer zones affect the structure and abundance of planktonic algal communities. The results revealed that the dominant factors affecting phytoplankton abundance were TN and WT. Meanwhile, Far and For provide nitrogen and phosphorus pollutants for rivers, and Unu was negatively correlated with river nutrients. The sensitivity of phytoplankton to multiple factors is the first important information for management, as well as the risk of water quality problems at individual sampling sites, in plateau rivers that are not the same. We need to enhance the management intervention of some sampling point areas (S1, S2, and S9), which may cause problems in the future. TP is generally considered to be the limiting factor in rivers, but TN also plays an indispensable role (Phillips et al., 2008; Beaulieu et al., 2013). Our model for assessing phytoplankton abundance is designed with respect to a given factor and may differ significantly if applied to other types of rivers. Therefore, it can only inform us about the potential risks affecting the abundance of the plankton community and serve as a reference for monitoring. Different land use types near the sampling sites have different driving forces For phytoplankton community and abundance. Therefore, it is suggested to rationally plan the ratios of For, Far, Gra and Unu around the riparian zone, appropriately increase forest coverage, reduce Unu, and provide ecological buffer zone to improve river water quality.
At the same time, this study had some limitations that need to be addressed in future studies. Seasonal scale and tributary watershed data analyses were not supplemented in this study. Seasonal variations can affect water temperature, velocity and nutrient transport (Danilov and Ekelund, 1999). It also had a significant impact on the planktonic algal community (Wu et al., 2012). Meanwhile, the inflow of tributaries and point sources gradually changes the environment around sampling points (Cha et al., 2016). Therefore, to better validate the interaction between environmental variables, future studies should increase the analysis of seasonal scales and surrounding major tributaries. It is necessary to further define the living standards of residents, socio-economic and hydrological data, and quantify the functional groups of the plankton communities.
5 Conclusion
The composition of the phytoplankton community in space and its reaction to environmental factors were determined. The results showed that according to the taxonomic group and abundance, Bacillariophyta had an absolute advantage, and the river section belonged to poor nutrition. The results of VPA showed that the Chla richness of phytoplankton explained by PPOWQ was the highest, followed by LUT. LUT indirectly affects phytoplankton abundance by coupling PPOWQ. Far and For are the main factors leading to the increase of TN in rivers, while Unu is effective in reducing pollutants entering rivers. Overall, TN, WT, Sal, Far, For and Unu had significant effects on phytoplankton communities. This information can support government personnel to develop appropriate riparian zone management measures, and promote researchers to further study the interaction of environmental factors and their mechanisms.
Data availability statement
The raw data supporting the conclusion of this article will be made available by the authors, without undue reservation.
Author contributions
Conceptualization, QL; Formal analysis, QL and ZW; Funding acquisition, QL; Investigation, ZW and YlT; Methodology, ZW; Supervision, QL; Writing an original draft, ZW and QL; Visualization, XL, XC, YuT, and JX. Writing-review and editing, all authors. All authors have read and agreed to the published version of the manuscript.
Funding
This research was funded by the National Natural Science Foundation of China (NSFC42277414), Shaanxi water conservancy technology planning project [Grant Number 2020slkj-13], and Second Tibetan Plateau Scientific Expedition and Research Program (STEP), [Grant Number 2019QZKK1003].
Acknowledgments
We are very grateful to Sansan Feng, and Yuxuan Xue for their field sampling assistance. We would like to thank the editors and reviewers in advance for their comments and suggestions that have helped improve this manuscript.
Conflict of interest
The authors declare that the research was conducted in the absence of any commercial or financial relationships that could be construed as a potential conflict of interest.
Publisher’s note
All claims expressed in this article are solely those of the authors and do not necessarily represent those of their affiliated organizations, or those of the publisher, the editors and the reviewers. Any product that may be evaluated in this article, or claim that may be made by its manufacturer, is not guaranteed or endorsed by the publisher.
Supplementary material
The Supplementary Material for this article can be found online at: https://www.frontiersin.org/articles/10.3389/fenvs.2023.1084461/full#supplementary-material
References
Afonina, E. Yu., and Tashlykova, N. A. (2018). Plankton community and the relationship with the environment in saline lakes of Onon-Torey plain, Northeastern Mongolia. Saudi J. Biol. Sci. 25, 399–408. doi:10.1016/j.sjbs.2017.01.003
Alexander, R. B., Elliott, A. H., Ude, S., and McBride, G. B. (2002). Estimating the sources and transport of nutrients in the waikato River Basin, New Zealand. Water Resour. Res. 38, 4-1–4-23. doi:10.1029/2001WR000878
Arhonditsis, G. B., Paerl, H. W., Valdes-Weaver, L. M., Stow, C. A., Steinberg, L. J., and Reckhow, K. H. (2007). Application of Bayesian structural equation modeling for examining phytoplankton dynamics in the Neuse River Estuary (North Carolina, USA). Coast. Shelf Sci. 72, 63–80. doi:10.1016/j.ecss.2006.09.022
Bao, Q., Liu, Z. H., Zhao, M., Hu, Y. D., Li, D., Han, C. H., et al. (2020). Primary productivity and seasonal dynamics of planktonic algae species composition in karst surface waters under different land uses. J. Hydrology 591, 125295. doi:10.1016/j.jhydrol.2020.125295
Beaulieu, M., Pick, F., and Gregory, E. I. (2013). Nutrients and water temperature are significant predictors of cyanobacterial biomass in a 1147 lakes data set. Limnol. Oceanogr. 58, 1736–1746. doi:10.4319/lo.2013.58.5.1736
Benda, L., Poff, N. L., Miller, D., Dunne, T., Reeves, G., Pess, G., et al. (2004). The network dynamics hypothesis: How channel networks structure riverine habitats. BioScience 54, 413–427. doi:10.1641/0006-3568(2004)054[0413:TNDHHC]2.0.CO;2
Bollen, K. A., and Stine, R. A. (1992). Bootstrapping goodness-of-fit measures in structural equation models. Sociol. Methods and Res. 21, 205–229. doi:10.1177/0049124192021002004
Borcard, D., Legendre, P., and Drapeau, P. (1992). Partialling out the spatial component of ecological variation. Ecology 73, 1045–1055. doi:10.2307/1940179
Byrne, B. M. (2011). Structural equation modeling with mplus: Basic concepts, applications, and programming. 1st ed. England, UK: Routledge. doi:10.4324/9780203807644
Cha, Y., Cho, K. H., Lee, H., Kang, T., and Kim, J. H. (2017). The relative importance of water temperature and residence time in predicting cyanobacteria abundance in regulated rivers. Water Res. 124, 11–19. doi:10.1016/j.watres.2017.07.040
Cha, Y., Soon, P., Won, L., and Stow, C. (2016). A Bayesian hierarchical approach to model seasonal algal variability along an upstream to downstream river gradient. Water Resour. Res. 52, 348–357. doi:10.1002/2015WR017327
Chang, H. (2008). Spatial analysis of water quality trends in the Han River basin, South Korea. Water Res. 42, 3285–3304. doi:10.1016/j.watres.2008.04.006
Chen, Q., Chen, H., Zhang, J., Hou, Y. K., Shen, M. X., Chen, J., et al. (2020). Impacts of climate change and LULC change on runoff in the Jinsha River Basin. J. Geogr. Sci. 30, 85–102. doi:10.1007/s11442-020-1716-9
Chen, X. K., Liu, X. B., Peng, W. Q., Dong, F., Chen, Q. C., Sun, Y. L., et al. (2019). Hydroclimatic influence on the salinity and water volume of a plateau Lake in southwest China. Sci. Total Environ. 659, 746–755. doi:10.1016/j.scitotenv.2018.12.013
Christopher, T. F., and John, A. D. (2017). Relationship of chlorophyll to phosphorus and nitrogen in nutrient-rich lakes. Inland Waters 7, 385–400. doi:10.1080/20442041.2017.1375176
Danilov, R., and Ekelund, N. (1999). The efficiency of seven diversity and one similarity indices based on phytoplankton data for assessing the level of eutrophication in lakes in central Sweden. Sci. Total Environ. 234, 15–23. doi:10.1016/S0048-9697(99)00163-1
Deininger, A., Faithfull, C., and Bergstrom, A. (2017). Phytoplankton response to whole lake inorganic N fertilization along a gradient in dissolved organic carbon. Ecology 98, 982–994. doi:10.1002/ecy.1758
Devercelli, M., and Farrell, I. (2013). Factors affecting the structure and maintenance of phytoplankton functional groups in a nutrient rich lowland river. Limnologica 43, 67–78. doi:10.1016/j.limno.2012.05.001
Diego, F., Yamila, B., Gisela, M., and Patricia, M. (2015). Controlling factors in planktonic communities over a salinity gradient in high-altitude lakes. Int. J. Limnol. 51, 261–272. doi:10.1051/limn/2015020
Ding, J., Jiang, Y., Fu, L., Liu, Q., Peng, Q., and Kang, M. (2015). Impacts of land use on surface water quality in a subtropical River Basin: A case study of the dongjiang River Basin, southeastern China. Southeast. China. Water 7, 4427–4445. doi:10.3390/w7084427
Ding, Y. T., Li, M., Pan, B. Z., Zhao, G. N., and Gao, L. (2022). Disentangling the drivers of phytoplankton community composition in a heavily sediment-laden transcontinental river. J. Environ. Manag. 302, 113939. doi:10.1016/j.jenvman.2021.113939
Domingues, R. B., Anselmo, T. P., Barbosa, A. B., Sommer, U., and Galvãoa, H. M. (2011). Light as a driver of phytoplankton growth and production in the freshwater tidal zone of a turbid estuary. Estuar. Coast. Shelf Sci. 91, 526–535. doi:10.1016/j.ecss.2010.12.008
Du, H. C., Zhu, T. B., Gong, J. L., Hu, F. F., Chen, K., and Yang, D. G. (2022). Zooplankton community structure and relationship to environmental factors in the Tibet reach of the Lancang River. Freshw. Fish. 52 (4), 56–64. doi:10.3969/j.issn.1000-6907.2022.04.008
Feio, J., Almeida, P., Craveiro, C., and Calado, A. J. (2009). A comparison between biotic indices and predictive models in stream water quality assessment based on benthic diatom communities. Ecol. Indic. 9, 497–507. doi:10.1016/j.ecolind.2008.07.001
Fierro, P., Valdovinos, C., Arismendi, I., Díaz, G., Jara-Flores, A., Habit, E., et al. (2019). Examining the influence of human stressors on benthic algae, macroinvertebrate, and fish assemblages in Mediterranean streams of Chile. Sci. Total Environ. 686, 26–37. doi:10.1016/j.scitotenv.2019.05.277
Fu, H., Chen, L. D., Ge, Y. l., Wu, A. P., Liu, H. Y., Li, W., et al. (2022). Linking human activities and global climatic oscillation to phytoplankton dynamics in a subtropical lake. Water Res. 208, 117866. doi:10.1016/j.watres.2021.117866
Gabel, K. W., Wehr, J. D., and Truhn, K. M. (2012). Assessment of the effectiveness of best management practices for streams draining agricultural landscapes using diatoms and macroinvertebrates. Hydrobiologia 680, 247–264. doi:10.1007/s10750-011-0933-8
Gao, Q., Ni, J. R., Zhao, X. F., and Chen, W. C. (2019). Study on phytoplankton community structure and influencing factors in typical reaches of Jinsha River. Acta Sci. Nat. Univ. Pekin. 55, 571–579. doi:10.13209/j.0479-8023.2019.022
Ger, K. A., Naus-Wiezer, S., De Meester, L., and Lürling, M. (2019). Zooplankton grazing selectivity regulates herbivory and dominance of toxic phytoplankton over multiple prey generations. Limnol. Oceanogr. 64, 1214–1227. doi:10.1002/lno.11108
Hallegraeff, G. (2010). Ocean climate change, phytoplankton community responses, and harmful algal blooms: A formidable predictive challenge. J. Phycol. 46, 220–235. doi:10.1111/j.1529-8817.2010.00815.x
Han, X., Pan, B. Z., Zhao, G. N., Li, D. B., Sun, H., Zhu, P. H., et al. (2020). Local and geographical factors jointly drive elevational patterns of phytoplankton in the source region of the Yangtze River, China. River Res. Appl. 37, 1145–1155. doi:10.1002/rra.3711
Harke, M. J., Steffen, M. M., Gobler, C. J., Otten, T. G., Wilhelm, S. W., Wood, S. A., et al. (2016). A review of the global ecology, genomics, and biogeography of the toxic cyanobacterium, Microcystis spp. Microcystis Spp. Harmful Algae 54, 4–20. doi:10.1016/j.hal.2015.12.007
Herbst, D. B. (2006). Salinity controls on trophic interactions among invertebrates and algae of solar evaporation ponds in the Mojave Desert and relation to shorebird foraging and selenium risk. Wetlands 26, 475–485. doi:10.1672/0277-5212(2006)26[475:SCOTIA]2.0.CO;2
Hondzo, M., and Warnaars, T. A. (2008). Coupled effects of small-scale turbulence and phytoplankton biomass in a small stratified lake. J. Environ. Eng. 134, 954–960. doi:10.1061/ASCE0733-93722008134:12954
Hu, H., and Wei, Y. (2006). The freshwater algae of China: Systematics, taxonomy and ecology (in Chinese). Beijing: Science Press.
Hu, J., Song, Z., Zhou, J., Soininen, J., Tan, L., Cai, Q. H., et al. (2022). Differences in diversity and community assembly processes between planktonic and benthic diatoms in the upper reach of the Jinsha River, China. Hydrobiologia 849, 1577–1591. doi:10.1007/s10750-022-04801-3
Jean, P. D., Francois, D., Thibault, L., Stoyneva-Gaertner, M. P., Bouillon, S., and Borges, A. V. (2017). Phytoplankton dynamics in the Congo river. Freshw. Biol. 62, 87–101. doi:10.1111/fwb.12851
Jeppesen, E., Beklioğlu, M., Özkan, K., and Akyürek, Z. (2020). Salinization increase due to climate change will have substantial negative effects on inland waters: A call for multifaceted research at the local and global scale. Innovation 1, 100030. doi:10.1016/j.xinn.2020.100030
Jeppesen, E., Søndergaard, M., Pedersen, A. R., Jürgens, K., Strzelczak, A. T., Lauridsen, L., et al. (2007). Salinity induced regime shift in shallow brackish lagoons. Ecosystems 10, 48–58. doi:10.1007/s10021-006-9007-6
Jia, J. J., Gao, Y., Zhou, F., Shi, K., Johnes, P. J., Dungait, J. A. J., et al. (2020). Identifying the main drivers of change of phytoplankton community structure and gross primary productivity in a river-lake system. J. Hydrology 583, 124633. doi:10.1016/j.jhydrol.2020.124633
Jiang, H. B., Kong, R. Q., and Xu, X. D. (2010). The N -acetylmuramic acid 6-phosphate etherase gene promotes growth and cell differentiation of cyanobacteria under light-limiting conditions. J. Bacteriol. 192 (8), 2239–2245. doi:10.1128/JB.01661-09
Jiang, Z. B., Liu, J. J., Chen, J. F., Chen, Q. Z., Yan, X. J., Xuan, J. L., et al. (2014). Responses of summer phytoplankton community to drastic environmental changes in the Changjiang (Yangtze River) estuary during the past 50 years. Water Res. 54, 1–11. doi:10.1016/j.watres.2014.01.032
Jones, A. C., Vivian Liao, T. S., Najar, F. Z., Roe, B. A., Hambright, K. D., and Caron, D. A. (2013). Seasonality and disturbance: Annual pattern and response of the bacterial and microbial eukaryotic assemblages in a freshwater ecosystem. Environ. Microbiol. 15, 2557–2572. doi:10.1111/1462-2920.12151
Katsiapi, M., Mazaris, A. D., Charalampous, E., and Moustaka-Gouni, M. (2012). Watershed land use types as drivers of freshwater phytoplankton structure. Hydrobiologia 698, 121–131. doi:10.1007/978-94-007-5790-5_10
Kaushal, S. S., Likens, G. E., Pace, M. L., Haq, S., Wood, K. L., Galella, J. G., et al. (2019). Novel ‘chemical cocktails’ in inland waters are a consequence of the freshwater salinization syndrome. Philos. Trans. R. Soc. B-Biol. Sci. 374, 20180017. doi:10.1098/rstb.2018.0017
Kim, J. H., Lee, D. H., and Kang, J. H. (2019). Associating the spatial properties of a watershed with downstream Chl-a concentration using spatial analysis and generalized additive models. Water Res. 154, 387–401. doi:10.1016/j.watres.2019.02.010
Komatsu, E., Fukushime, T., and Harasawa, H. (2007). A modeling approach to forecast the effect of long-term climate change on lake water quality. Ecol. Model. 209 (2/3/4), 351–366. doi:10.1016/j.ecolmodel.2007.07.021
Kuzmanović, M., Ginebreda, A., Petrović, M., and Barceló, D. (2015). Risk assessment based prioritization of 200 organic micropollutants in 4 Iberian rivers. Sci. Total Environ. 503-504, 289–299. doi:10.1016/j.scitotenv.2014.06.056
Lai, J. X., Yu, Z. M., Song, X. X., Han, X. T., Cao, X. H., and Yuan, Y. Q. (2013). Phytoplankton pigment distribution and community structure characteristics in the Yangtze Estuary and adjacent waters. Environ. Sci. 34, 3405–3415. doi:10.13227/j.hjkx.2013.09.021
Le, M., Gascuel-Odoux, C., Menesguen, A., Souchon, Y., Étrillard, C., Levain, A., et al. (2019). Eutrophication: A new wine in an old bottle? Sci. Total Environ. 651, 1–11. doi:10.1016/j.scitotenv.2018.09.139
Leitão, E., Ger, K. A., and Panosso, R. (2018). Selective grazing by a tropical copepod (Notodiaptomus iheringi) facilitates Microcystis dominance. Front. Microbiol. 9, 301–312. doi:10.3389/fmicb.2018.00301
Li, F. P., Gao, Y., Zhang, H. P., Xiao, Y. H., and Chen, L. (2015). Simulation experiment on the effect of flow velocity on phytoplankton growth and composition. J. Lake Sci. 27, 44–49. doi:10.18307/2015.0106
Li, Z. X., Gao, Y., Wang, S. Y., Lu, Y., Sun, K., Jia, J. J., et al. (2021). Phytoplankton community response to nutrients along lake salinity and altitude gradients on the Qinghai-Tibet Plateau. Ecol. Indic. 128, 107848. doi:10.1016/j.ecolind.2021.107848
Liao, J. Q., Zhao, L., Cao, X. F., Sun, J. H., Gao, Z., Wang, J., et al. (2016). Cyanobacteria in lakes on Y ungui Plateau, China are assembled via niche processes driven by water physicochemical property, lake morphology and watershed land-use. Sci. Rep. 6, 36357. doi:10.1038/srep36357
Liberoff, A. L., Flaherty, S., Hualde, P., García Asorey, M. I., Fogel, M. L., and Pascual, M. A. (2019). Assessing land use and land cover influence on surface water quality using a parametric weighteddistance function. Limnologica 74, 28–37. doi:10.1016/j.limno.2018.10.003
Lilliefors, H. (1967). On the Kolmogorov-Smirnov test for normality with mean and variance unknown. J. Am. Stat. Assoc. 62, 399–402. doi:10.1080/01621459.1967.10482916
Lin, Q. Q., Xu, L., Hou, J. Z., Liu, Z. W., Jeppesen, E., and Han, B. P. (2017). Responses of trophic structure and zooplankton community to salinity and temperature in Tibetan lakes: Implication for the effect of climate warming. Water Res. 124, 618–629. doi:10.1016/j.watres.2017.07.078
Liu, D. Y., Keesing, J. K., Dong, Z. J., Zhen, Y., Di, B. P., Shi, Y. J., et al. (2010). Recurrence of the world's largest green-tide in 2009 in yellow sea, China: Porphyra yezoensis aquaculture rafts confirmed as nursery for macroalgal blooms. Mar. Pollut. Bull. 9, 1423–1432. doi:10.1016/j.marpolbul.2010.05.015
Liu, J. C., Lu, G. H., Yang, H. H., Dang, T. J., and Yan, Z. H. (2020). Ecological impact assessment of 110 micropollutants in the yarlung tsangpo river on the Tibetan plateau. J. Environ. Manag. 262, 110291. doi:10.1016/j.jenvman.2020.110291
Liu, Q., Jiang, Y., Tian, Y. L., Hou, Z. J., He, K. J., Fu, L., et al. (2019a). Impact of land use on the DOM composition in different seasons in a subtropical river flowing through a region undergoing rapid urbanization. J. Clean. Prod. 212, 1224–1231. doi:10.1016/j.jclepro.2018.12.030
Liu, Q., Tian, Y. L., Liu, Y., Yu, M., Hou, Z. J., He, K. J., et al. (2021). Relationship between dissolved organic matter and phytoplankton community dynamics in a human-impacted subtropical river. J. Clean. Prod. 289, 125144. doi:10.1016/j.jclepro.2020.125144
Liu, W. Z., Zhang, Q. F., and Liu, G. H. (2012). Influences of watershed landscape composition and configuration on lake-water quality in the Yangtze River basin of China. Hydrol. Process. 26, 570–578. doi:10.1002/hyp.8157
Liu, Y., Xu, X., Wang, T., and Ni, J. R. (2019b). Microscopic view of phytoplankton along the Yangtze River. Sci. China Technol. Sci. 62, 1873–1884. doi:10.1007/s11431-019-9545-y
Long, T. Y., Wu, L., Meng, G. H., and Guo, W. H. (2011). Numerical simulation for impacts of hydrodynamic conditions on algae growth in Chongqing Section of Jialing River, China. Ecol. Model. 222, 112–119. doi:10.1016/j.ecolmodel.2010.09.028
Lu, L. H., Zou, X., Yang, J. X., Xiao, Y., Wang, Y. C., Guo, J. S., et al. (2020). Biogeography of eukaryotic plankton communities along the upper Yangtze River: The potential impact of cascade dams and reservoirs. J. Hydrology 590, 125495. doi:10.1016/j.jhydrol.2020.125495
Luo, M. B., Lu, J. J., Wang, Y. L., Shen, X. Q., and Chao, M. (2007). Number distribution and dominant species of phytoplankton in the East Sea China. Acta Ecol. Sin. 27, 5076–5085. doi:10.3321/j.issn:1000-0933.2007.12.016
Maberly, S. C., and Elliott, J. A. (2012). Insights from long-term studies in the windermere catchment: External stressors, internal interactions and the structure and function of lake ecosystems. Freshw. Biol. 57, 233–243. doi:10.1111/j.1365-2427.2011.02718.x
Maberly, S. C., Pitt, J. A., Davies, P. S., and Carvalho, L. (2020). Nitrogen and phosphorus limitation and the management of small productive lakes. Inland Waters 10, 159–172. doi:10.1080/20442041.2020.1714384
Machmuller, M., Kramer, M., Cyle, T., Hil, l. N., Hancock, D., and Thompson, A. (2015). Emerging land use practices rapidly increase soil organic matter. Nat. Commun. 6, 6995. doi:10.1038/ncomms7995
Malviya, S., Scalco, E., Audic, S., Vincent, F., Veluchamy, A., Poulain, J., et al. (2016). Insights into global diatom distribution and diversity in the world’s ocean. Proc. Natl. Acad. Sci. U. S. A. 113, 1516–1525. doi:10.1073/pnas.1509523113
Marra, R. C., Algarte, V. M., Ludwig, T. A. V., and Padial, A. A. (2018). Diatom diversity at multiple scales in urban reservoirs in Southern Brazil reveals the likely role of trophic state. Limnologica 70, 49–57. doi:10.1016/j.limno.2018.04.001
Michalak, A. (2008). Study role of climate change in extreme threats to water quality. Nature 535, 349–350. doi:10.1038/535349a
Mitrovic, S. M., Chessman, B. C., Davie, A., Avery, E. L., and Ryan, N. (2008). Development of blooms of Cyclotella meneghiniana and Nitzschia spp. (Bacillariophyceae) in a shallow river and estimation of effective suppression flows. Hydrobiologia 596, 173–185. doi:10.1007/s10750-007-9094-1
Morabito, G., Rogora, M., Austoni, M., and Ciampittiello, M. (2018). Could the extreme meteorological events in Lake Maggiore watershed determine a climate-driven eutrophication process? Hydrobiologia 824 (1), 163–175. doi:10.1007/s10750-018-3549-4
Mori, G. B., de Paula, F. R., de Barros Ferraz, S. F., Camargo, A. F. M., and Martinellli, L. A. (2015). Influence of landscape properties on stream water quality in agricultural catchments in Southeastern Brazil. Ann. Int. J. Limnol. 51, 11–21. doi:10.1051/limn/2014029
Munn, M., Frey, J., and Tesoriero, A. (2010). The influence of nutrients and physical habitat in regulating algal biomass in agricultural streams. Environ. Manag. 45, 603–615. doi:10.1007/s00267-010-9435-0
Muylaert, K., and Sabbe, K. (1999). Spring phytoplankton assemblages in and around the maximum turbidity zone of the estuaries of the Elbe (Germany), the Schelde (Belgium/The Netherlands) and the Gironde (France). J. Mar. Syst. 22, 133–149. doi:10.1016/S0924-7963(99)00037-8
Navas-Parejoa, J. C. C., Corzoa, A., and Papaspyroua, S. (2020). Seasonal cycles of phytoplankton biomass and primary production in a tropical temporarily open-closed estuarine lagoon-The effect of an extreme climatic event. Sci. Total Environ. 723, 138014. doi:10.1016/j.scitotenv.2020.138014
Nche-Fambo, F. A., Scharler, U. M., and Tirok, K. (2015). Resilience of estuarine phytoplankton and their temporal variability along salinity gradients during drought and hypersalinity. Estuar. Coast. Shelf Sci. 158, 40–52. doi:10.1016/j.ecss.2015.03.011
Osburn, F. S., Wagne, r. N. D., and Scott, J. T. (2021). Biological stoichiometry and growth dynamics of a diazotrophic cyanobacteria in nitrogen sufficient and deficient conditions. Harmful Algae 103, 102011. doi:10.1016/j.hal.2021.102011
Özkan, K., Jeppesen, E., Søndergaard, M., Lauridsen, T. L., Liboriussen, L., and Svenning, J. C. (2013). Contrasting roles of water chemistry, lake morphology, land-use, climate and spatial processes in driving phytoplankton richness in the Danish landscape. Hydrobiologia 710, 173–187. doi:10.1007/s10750-011-0996-6
Paerl, H. W., and Paul, V. J. (2015). Climate change: Links to global expansion of harmful cyanobacteria. Water Res. 46, 1349–1363. doi:10.1016/j.watres.2011.08.002
Peng, X., Zhang, L., Li, Y., Lin, Q. W., He, C., Huang, S. Z., et al. (2021). The changing characteristics of phytoplankton community and biomass in subtropical shallow lakes: Coupling effects of land use patterns and lake morphology. Water Res. 200, 117235. doi:10.1016/j.watres.2021.117235
Peñuelas, J., Poulter, B., Sardans, J., Ciais, P., Velde, M., Bopp, L., et al. (2013). Human-induced nitrogen-phosphorus imbalances alter natural and managed ecosystems across the globe. Nat. Commun. 4, 2934–2944. doi:10.1038/ncomms3934
Phillips, G., Pietiläinen, O. P., Carvalho, L., Solimini, A., Lyche Solheim, A., and Cardoso, A. C. (2008). Chlorophyll-nutrient relationships of differ-ent lake types using a large European dataset. Aquat. Ecol. 42, 213–226. doi:10.1007/s10452-008-9180-0
Redden, A. M., and Rukminasari, N. (2008). Effects of increases in salinity on phytoplankton in the broadwater of the myall lakes, NSW, Australia. Hydrobiologia 608, 87–97. doi:10.1007/s10750-008-9376-2
Reichwaldt, E. S., and Ghadouani, A. (2012). Effects of rainfall patterns on toxic cyanobacterial blooms in a changing climate: Between simplistic scenarios and complex dynamics. Water Res. 46, 1372–1393. doi:10.1016/j.watres.2011.11.052
Reynolds, C. S. (2006). The ecology of phytoplankton (ecology, biodiversity and conservation). Cambridge: Cambridge University Press. doi:10.1017/CBO9780511542145
Richardson, J., Miller, C., Maberly, S. C., Taylor, P., Globevnik, L., Hunter, P., et al. (2018). Effects of multiple stressors on cyanobacteria abundance vary with lake type. Glob. Change Biol. 24, 5044–5055. doi:10.1111/gcb.14396
Rui, J. P., Li, J. B., Wang, S. P., An, J. X., Liu, W., Lin, Q. Y., et al. (2015). Responses of bacterial communities to simulated climate changes in alpine meadow soil of the Qinghai-Tibet Plateau. Appl. Environ. Microbiol. 81, 6070–6077. doi:10.1128/AEM.00557-15
Schermelleh-Engel, K., Moosbrugger, H., and Müller, H. (2003). Evaluating the fit of structural equation models: Tests of significance and descriptive goodness-of-fit measures. Methods Psychol. Res. Online 8, 23–74.
Shan, K., Song, L. R., Chen, W., Li, L., Liu, L. M., Wu, Y. L., et al. (2019). Analysis of environmental drivers influencing interspecific variations and associations among bloom-forming cyanobacteria in large, shallow eutrophic lakes. Harmful Algae 84, 84–94. doi:10.1016/j.hal.2019.02.002
Siegel, D., Behrenfeld, M., Maritorena, S., McClain, C. R., Antoine, D., Bailey, S. W., et al. (2013). Regional to global assessments of phytoplankton dynamics from the Sea WiFS mission. Remote Sens. Environ. 135, 77–91. doi:10.1016/j.rse.2013.03.025
State Environmental Protection Administration (2002b). Standard methods for the examination of water and wastewater(version 4). Beijing: China Environmental Science Press.
State Environmental Protection Administration (2002a). The national standards of the people's Republic of China: Environmental quality standards for surface water (GB3838-2002). Beijing: China Environmental Sciences Press.
Suikkanen, S., Laamanen, M., and Huttunen, M. (2007). Long-term changesin summer phytoplankton communities of the open northern Baltic Sea. Estuar. Coast. Shelf Sci. 71, 580–592. doi:10.1016/j.ecss.2006.09.004
Sun, S. P., Kong, C., and Lu, X. X. (2021). The community structure change of benthic diatoms in Kulipa before and after rainstorm period and its correlation with environmental factors. Oceanol. Limnologia Sinica 52, 162–174. doi:10.11693/hyhz20200500134
Tian, Y., Jiang, Y., Liu, Q., Dong, M., Xu, D., Liu, Y., et al. (2019). Using a water quality index to assess the water quality of the upper and middle streams of the Luanhe River, northern China. Sci. Total Environ. 667, 142–151. doi:10.1016/j.scitotenv.2019.02.356
Torremorell, A., Llames, M. E., Pérezm, G. L., Escaray, R., Bustingorry, J., and Zagarese, H. (2009). Annual patterns of phytoplankton density and primary production in a large, shallow lake: The central role of light. Freshw. Biol. 54, 437–449. doi:10.1111/j.1365-2427.2008.02119.x
Townsend, S. A., and Douglas, M. M. (2017). Discharge-driven flood and seasonal patterns of phytoplankton biomass and composition of an Australian tropical savannah river. Hydrobiologia 794, 203–221. doi:10.1007/s10750-017-3094-6
Van Den Wollenberg, A. (1977). Redundancy analysis an alternative for canonical correlation analysis. Psychometrika 42, 207–219. doi:10.1007/BF02294050
Wang, J. W., Liu, Q. X., Zhao, X., Borthwick, A. G. L., Liu, Y. X., Chen, Q., et al. (2019). Molecular biogeography of planktonic and benthic diatoms in the Yangtze River. Microbiome 153, 153–2618. doi:10.1186/s40168-019-0771-x
Wang, Y., Jiang, X., Li, Y. L., Yang, L. J., Li, Y. H., Liu, Y., et al. (2023). Interactive effects of nutrients and salinity on phytoplankton in subtropical plateau lakes of contrasting water depths. Water 15 (1), 69. doi:10.3390/w15010069
Weng, B. S., Yang, Y. H., Yan, D. H., Wang, J. W., Dong, G. Q., Wang, K., et al. (2020). Shift in plankton diversity and structure: Influence of runoff composition in the nagqu river on the Qinghai-Tibet Plateau. Ecol. Indic. 109, 105818. doi:10.1016/j.ecolind.2019.105818
Weng, J., and Xu, H. (2010). Atlas of common freshwater algae in China (in Chinese). Shanghai: Shanghai Scientific and Technical Publishers.
Wu, N., Schmalz, B., and Fohrer, N. (2012). Development and testing of a phytoplankton index of biotic integrity (P-IBI) for a German lowland river. Ecol. Indic. 13, 158–167. doi:10.1016/j.ecolind.2011.05.022
Wu, X. Y., Wang, Y. P., Zhang, Y., Wu, F., Wei, N., Yang, H. L., et al. (2023). Zooplankton community structure and spatial distribution in the main stream of Yangtze River. J. Fish. China 47 (2), 183–192. doi:10.11964/jfc.20220913695
Xue, J. Z., Fang, W., Cai, Z., Wang, Q., and Chen, W. Y. (2011). Phytoplankton community composition of kezisai reservoir in wulungu River Basin. J. Biol. 28, 62–65. doi:10.3969/j.issn.1008-9632.2011.01.062
Yang, L. J., Tao, Y., Jiang, X., Wang, Y., Li, Y. H., Zhou, L., et al. (2023). Interactive effects of nutrients and salinity on zooplankton in subtropical plateau lakes with contrasting water depth. Front. Environ. Sci. 11, 1110746. doi:10.3389/fenvs.2023.1110746
Yuan, Q. L., and Yang, J. (2021). Phenological changes of grassland vegetation in Qinghai-Tibet Plateau and its response to climate change. Chin. J. Grassl. 43, 32–43. doi:10.16742/j.zgcdxb.20210029
Zhang, J., Guo, Q. J., Wang, Z. T., Uwiringiyimana, E., Wei, R. F., Du, C. J., et al. (2022). Phytoplankton dominates the suspended particulate nitrogen source in the Yangtze River. J. Hydrology 615, 128607. doi:10.1016/j.jhydrol.2022.128607
Zhang, P., and Liu, J. (2011). Preliminary analysis on investigation of soil and water loss in source regions of Yangtze River. Yangtze River 42, 95–99. doi:10.16232/j.cnki.1001-4179.2011.19.019
Zhang, Y., Zhou, L., Zhou, Y., Zhang, L., Yao, X., Shi, K., et al. (2021). Chromophoric dissolved organic matter in inland waters: Present knowledge and future challenges. Sci. Total Environ. 759, 143550. doi:10.1016/j.scitotenv.2020.143550
Keywords: Yangtze river, land use type, environmental variables, phytoplankton community, structural equation model
Citation: Wang Z, Li Q, Tian Y, Li X, Chen X, Tian Y and Xue J (2023) Effect of land use and environmental variables on phytoplankton community structure in high-elevation river, upper Yangtze river, China. Front. Environ. Sci. 11:1084461. doi: 10.3389/fenvs.2023.1084461
Received: 30 October 2022; Accepted: 16 March 2023;
Published: 31 March 2023.
Edited by:
Shaoda Liu, Beijing Normal University, ChinaCopyright © 2023 Wang, Li, Tian, Li, Chen, Tian and Xue. This is an open-access article distributed under the terms of the Creative Commons Attribution License (CC BY). The use, distribution or reproduction in other forums is permitted, provided the original author(s) and the copyright owner(s) are credited and that the original publication in this journal is cited, in accordance with accepted academic practice. No use, distribution or reproduction is permitted which does not comply with these terms.
*Correspondence: Qi Li, cWlsaTcyNkBud3UuZWR1LmNu