 Molly Mitchell
 Jessica Hendricks
 Daniel Schatt
95% of researchers rate our articles as excellent or good
Learn more about the work of our research integrity team to safeguard the quality of each article we publish.
Find out more
ORIGINAL RESEARCH article
Front. Environ. Sci. , 01 March 2023
Sec. Interdisciplinary Climate Studies
Volume 11 - 2023 | https://doi.org/10.3389/fenvs.2023.1083282
This article is part of the Research Topic Anticipating and Adapting to the Impacts of Climate Change on Low Elevation Coastal Zone (LECZ) Communities View all 8 articles
Introduction: As sea level rises and coastal communities simultaneously grow, road flooding has the potential to significantly disrupt travel along road networks and make houses, businesses, and critical facilities difficult to reach. The impacts of tidal and storm surge flooding on roadways present challenging social and economic considerations for all coastal jurisdictions. Maintenance, public and private accessibility, evacuation routes, emergency services are just a few of the common themes local governments are beginning to address for low-lying roadways currently known to flood. Continuation of these services allows a community to thrive, to maintain or increase its tax base, and to ensure the safety and well-being of its citizenry.
Methods: A traditional approach to analyzing road flood overlays flooding areas on roadways and focuses only on impacts within the actual zone of inundation. However, road flooding can also cut-off access to non-flooded roads and properties, closing the transportation corridor into or out of their downstream dwelling/service areas and other areas that may be impacted. In this study, we examined changing road inaccessibility under accelerating sea level rise for urban and rural localities.
Results: Inaccessibility of roads and properties increased nearly twice as much as would be suggested by the length of flooded roads. Overall vulnerability of a locality was primarily dependent on its elevation; however, the redundancy of the road network appears to affect the rate at which properties became inaccessible. Areas with complex and redundant road networks-maintained access to coastal properties longer, suggesting increased resilience in the near term.
Discussion: Road inaccessibility will impact property values and emergency response times but understanding the connection between flooding areas and inaccessible properties allows prioritization of road upgrades, improving overall coastal resilience.
Sea level rise is an increasing concern for low elevation coastal communities (Allen et al., 2021), and acceleration in the frequency and impacts of flooding is requiring that communities have a sophisticated understanding of their vulnerability. Currently, the impacts of storm-induced flooding on local populations, communities, and their built infrastructure are readily observable during nor’easters, hurricanes and even king tides (Miller et al., 2013; Mitchell et al., 2013). Sea level rise will significantly increase the flooding threat to low-lying roads, residences, and critical infrastructure. The impacts of tidal and storm surge flooding on roadways, in particular, present challenging social and economic considerations for all coastal jurisdictions. Road networks are critical to a society’s economic fabric and its ability to move freely (Pregnolato et al., 2017). Maintenance, public and private accessibility, evacuation routes, and emergency services are just a few of the common themes local governments are beginning to address for low-lying roadways currently known to flood. Continuation of these services allows a community to thrive, to maintain or increase its tax base, and to ensure the safety and wellbeing of its citizenry.
High rates of sea level rise in Chesapeake Bay, Virginia, makes it a natural laboratory for examining the impacts of accelerating flooding on road networks. On average, Chesapeake Bay, Virginia is experiencing the highest rates of relative sea level rise along the Atlantic coast (Ezer and Corlett, 2012; Ezer, 2013; Sallenger et al., 2012; Kopp, 2013; Boon and Mitchell, 2015). Recent rates from around the Bay are in the range of 4–6 mm/yr and accelerating (Ezer and Atkinson, 2014; Boon et al., 2018) exceeding the rate of recent global sea level rise (∼3.2 mm/yr Church and White, 2011; Ezer, 2013). This rate of rise has led to a noticeable increase in the frequency and extent of flooding (Ezer and Atkinson, 2014; Sweet and Park, 2014) and a related increase in travel delays. On the East Coast, current levels of nuisance flooding have been estimated to cause more than 100 million vehicle-hours of delay annually; and are expected to cause up to 1.2 billion vehicle-hours of delay by 2060 (Jacobs et al., 2018).
Flooding affects transportation systems through both direct impacts and indirect impacts. Direct impacts (e.g., physical coverage of the road) can be evaluated as road susceptibility to flooding (or the frequency at which a road segment floods, Versini, Gaume, and Andrieu, 2010a). Indirect impacts (including disruption to traffic flow, business interruption, and emergency service provision, (e.g., Suarez et al., 2005; Hammond et al., 2015) can be evaluated as accessibility (the ease with which people can participate in activities in or from a specific location, Susilawati and Taylor, 2008). Indirect impacts can have high economic costs, which are predicted to increase dramatically with sea level rise (Fant et al., 2021). An additional indirect impact is the implication for health and human safety, since vehicle travel through standing water on roads is one of the primary causes of deaths in urban areas during flooding events (Jonkman and Kelman, 2005). Evaluating the potential for a vehicle to safely travel through flooded areas requires consideration of depth of inundation in the accessibility analysis.
In this study, we examine the impact that flooding has on road and building accessibility, the rate at which inaccessibility may increase under accelerating sea level rise, and the relationship of those rates to the design of the road network. An analysis that focuses only on impacts within the actual zone of inundation may underestimate both the extent of impacted properties and the rate at which those impacts will occur. The protocol developed for use in this analysis also considers impacted inhabitants that may not be within the inundation zone but will lose their transportation corridor into or out of their “downstream” dwelling/service areas.
For this study, we analyzed flood impacts to road accessibility for 24 localities located in the low elevation coastal plain of Virginia, United States (Figure 1). The localities represented a spectrum of development from highly urbanized to rural and displayed various road network configurations. In this analysis, we chose to use standardized increments of flooding to look at impacts rather than selecting a particular sea level rise scenario. This allows the results to be evaluated based on any sea level rise scenario. In addition, it allows the consideration of a sea level rise scenario combined with an assumed storm surge (e.g., a 0.5 m storm surge on top of a 1.0 m sea level rise); allowing flexible use for different management needs. Based on historic trends, coastal Virginia is expected to see approximately 0.5 m of sea level rise by 2050 (above MSL 1983-2001 tidal datum; Boon et al., 2018) while by 2100, Sweet et al. (2017) projects about 2.0 m of sea level rise under their Intermediate-high scenario.
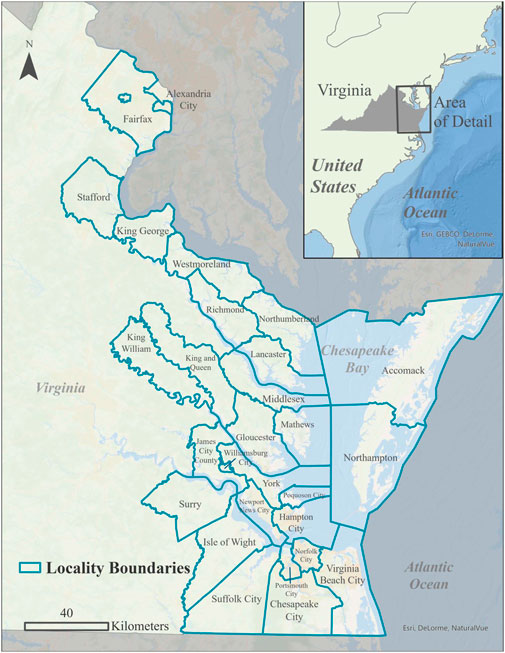
FIGURE 1. Map of Chesapeake Bay, Virginia with low elevation coastal localities. Blue boundaries represent the localities used in this study.
Road center line data were acquired from the Open Street Map database (OpenStreetMap, 2015). Open Street Map data was selected for use because it was already formatted in a way that makes network building efficient. High resolution land use (1 m horizontal resolution and 0.15 m vertical resolution) and light detecting and radar (LiDAR) data was acquired from the Virginia Geographic Information Network (data collection 2010–2018, VGIN, 2022). Raw lidar elevation point clouds were downloaded for the localities of interest and elevation rasters were created from them. The use of the raw lidar data point clouds reconciled problems associated with overpasses and bridges yielding incorrect elevation profiles from data generated using bare earth raster data. All analyses were done within the NAVD88 vertical datum.
Flooding impacts were considered for each 0.1 m elevation flood intervals from 0 m NAVD88 up to an elevation of 2.0 m NAVD88. 2.0 m of flooding is analogous to the approximate high tide expected by 2100 in Coastal Virginia due to sea level rise or a 1 m storm surge occurring during high tide in 2050 (NOAA 2017; Intermediate High Scenario). The use of incremental 0.1 m flood scenarios allows for consideration of the impacts of any combination of sea level rise and storm surge up to a total of 2.0 m elevation. Elevation rasters were used to create flood impedance layers for each elevation interval.
The flooding impedance layers and road network were created, and analyses run using the raster processing and network analysis tools in ArcGIS Desktop 10.8.1 We overlaid the flood impendence layer for the given flood elevation level, derived from the LiDAR data, on to the road network. Then we delineated a “service area” which indicated the roads which were accessible (i.e., access not blocked by any flooding within which movement through the network can be assessed). The service area indicated the roads that were not flooded at each flood level (the “accessible” roads). This created a network analysis layer for the locality transportation analysis.
To evaluate impacts to primary buildings, primary building footprints were extracted from the statewide database of building footprints (VGIN, 2022). Primary buildings were defined as those with footprints larger than 80 m2, the threshold for which outbuildings or secondary buildings are generally not included. Where available, critical community infrastructure was identified using the USGS National Structures Dataset (USGS, 2022), and includes the categories of education, emergency response and law enforcement, mail and shipping, health and medical, and government and military.
Roadways and transportation pathways assess how traffic can move to and from a node to any point within the road network until a barrier (i.e., a flooded road) is encountered. Nodes can represent critical infrastructure in a community such as fire and rescue stations, hospitals, military bases, and entrances to major arteries or evacuation routes. For this analysis, the node (point of origin) was always the locality seat. First, the node locations (county seats) were imported into the network analysis layer. Then, for each flood level (0.1 m elevation increments from 0 m to 2.0 NAVD88) the flood area polygons were imported as a polygon barrier layer (flood impedance layer). Finally, the network analysis was solved to determine accessible and inaccessible roads for that flood level. The network analysis was run regionally, to allow for the possibility that roads may transverse multiple localities and that flooding in one locality could affect access in another locality. Results of the network analysis were then clipped to the locality. Inaccessibility of an area was defined as the point at which water covered a road surface necessary for accessing that area. The determination of inaccessibility was based on the spatial coverage of the flooded area and did not consider water depth.
In two localities, Hampton and Portsmouth, roads immediately adjacent to, or on which the county seat is located, flooded at a flooding level of less than 2.0 m. In these cases, based on our definition of accessibility, the entire locality becomes inaccessible. These localities were excluded from the statistical analyses because using one point of origin to evaluate locality-wide accessibility resulted in overestimating real-world flooding impacts for those localities.
We calculated redundancy indices for the localities using the Redundancy Index tool in the Urban Analysis Toolkit (Sevtsuk, and Mekonnen, 2012), in ArcGIS Desktop 10.8.1. We generated random points on each locality’s street network (25 origin points, 25 destination points) and used a “redundancy coefficient” of 3. The redundancy coefficient defines how much longer a redundant path may be compared to the shortest path. A value of 3 allows for the consideration of many other paths, so allows access to a location along even circuitous routes but may mean that the accessible path has a much longer drive time. We did not consider drive time in our analyses. The tool calculates an average redundancy index for each of the origin points. We used the mean value of the average redundancy indices from all 25 origin points for each locality.
To examine the impact of road network characteristics on the rate and extent of flooding, we selected three localities with variable characteristics from within the coastal zone for a more detailed analysis. Norfolk is an urban center with a highly redundant transportation network, characterized in many parts by a gridded system of streets. Gloucester is a predominantly rural locality with a backbone-type road network. Mathews is a very rural locality with a networked system of roads, that are more redundant than the backbone-type layout, but less redundant than the urban layout. Both Norfolk and Mathews are relatively flat localities (mean elevation = 4 m and 3 m NAVD88, respectively), while Gloucester has a central high area where the backbone of the road network runs (mean elevation = 14 m NAVD88).
For each selected locality, LiDAR data was used to select road segments which would be flooded at a given flood level. These road lengths represent the direct impacts of flooding and indicated areas where road improvements could be targeted to reduce flooding. In addition, the direct (flooded roads) and indirect (inaccessible and flooded roads) impacts of road flooding on the accessibility of primary buildings were calculated. Critical facilities both directly and indirectly impacted at each flood level were also enumerated.
The flooded road length was compared to the total length of inaccessible roads (comprised of flooded and inaccessible segments) using a linear fit for each locality separately. Counts of buildings on flooded and inaccessible roads across all localities and all flood levels were compared using a one-way ANOVA [Building count by road status (flooded/inaccessible)]. All statistics were done in JMP 10.
In total, more than 2,844 km of roads become inaccessible at 2 m of flooding for the 22 studied localities. Inaccessible road length increased exponentially, with a slow increase up to 0.5 m of flooding and a steeper increase at higher flood levels (Figure 2). When this relationship was examined for each locality, the slope of the line beyond 0.5 m of flooding (and consequently the length of inaccessible road miles) was generally correlated with the amount of low elevation land (see table 1). The most rapid increase in road inaccessibility was found in Accomack, Mathews, and Virginia Beach. The exception to this rule was Northampton, which has the second highest percent of low elevation land, but relatively low length of inaccessible roads.
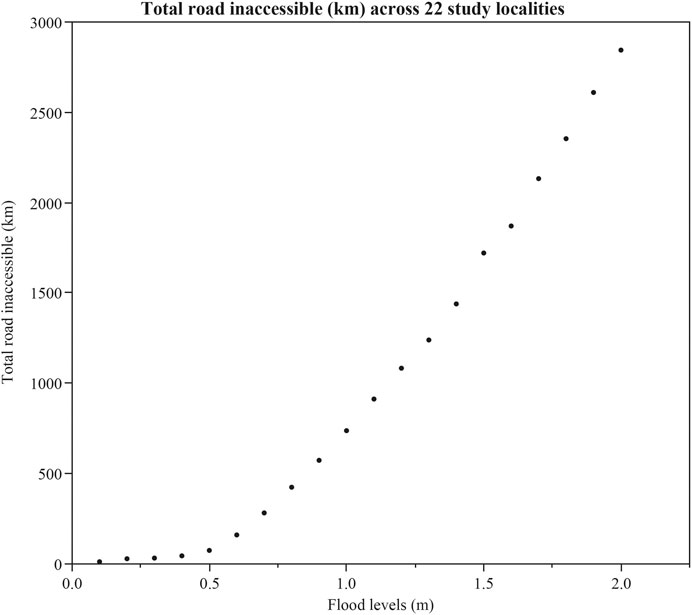
FIGURE 2. Total road inaccessible length across the 22 studied localities at each flood level.
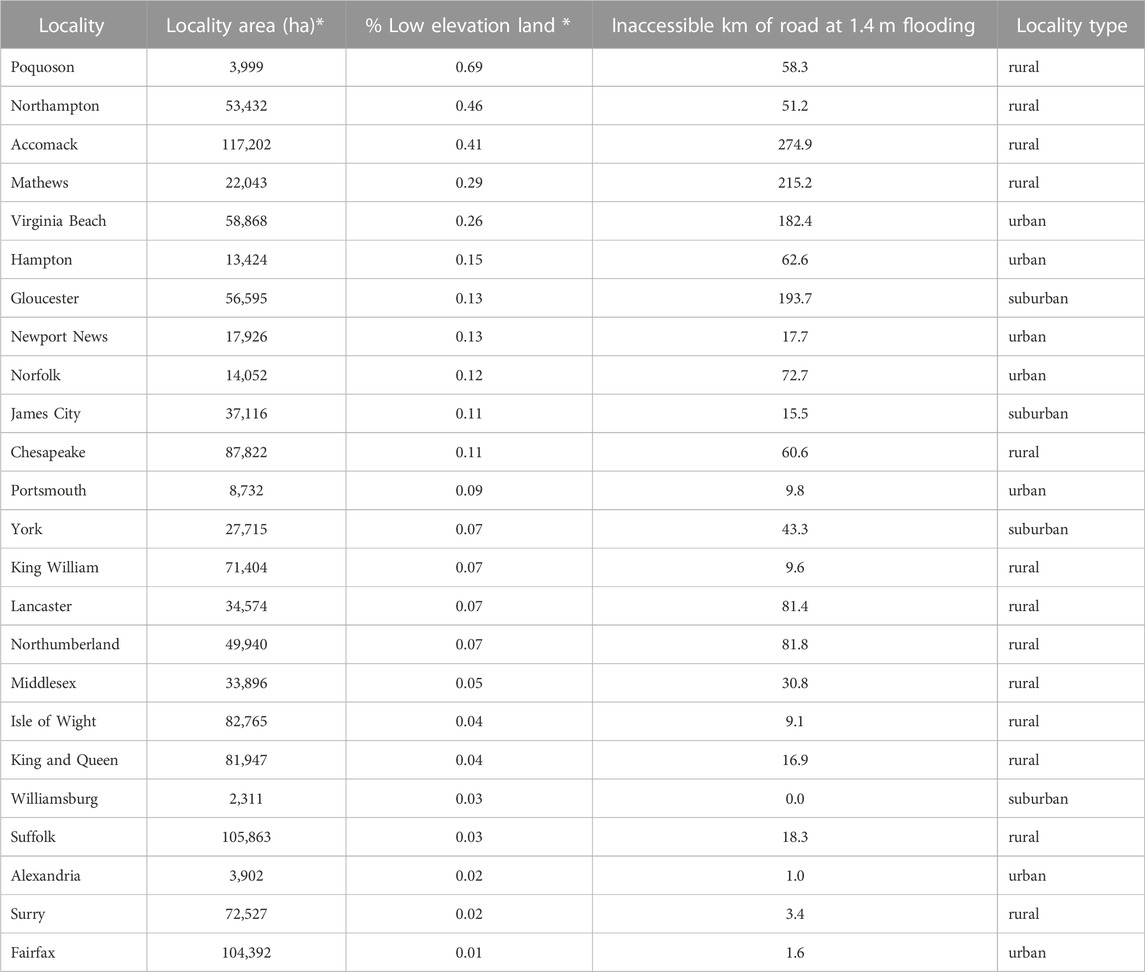
TABLE 1. Locality characteristics. Localities are arranged by the % of low elevation land (flooded at 1.4 m water elevation) in the locality. * indicates data from Mitchell et al. (2013).
Road impacts, building impacts, and critical facility impacts were all higher when road inaccessibility versus direct flooding was considered (Figure 3). Road length flooded was strongly linearly related to the inaccessible length in the three localities (R2 > 0.95), however the inaccessible length was higher than the flooded length for all flood levels (Figure 4). The slope of the regression line was 1.70, 2.08, and 2.36 for Norfolk, Gloucester, and Mathews, respectively. The redundancy index for the three localities were 37.07, 1.51, and 0.54 for Norfolk, Gloucester, and Mathews, respectively. This suggests a negative, non-linear relationship between the slope of the regression line and the redundancy index. With only three points (localities), the strength of the relationship cannot be reasonably quantified. However, it suggests that more redundant networks may be moderately more resilient to flooding than less redundant networks.
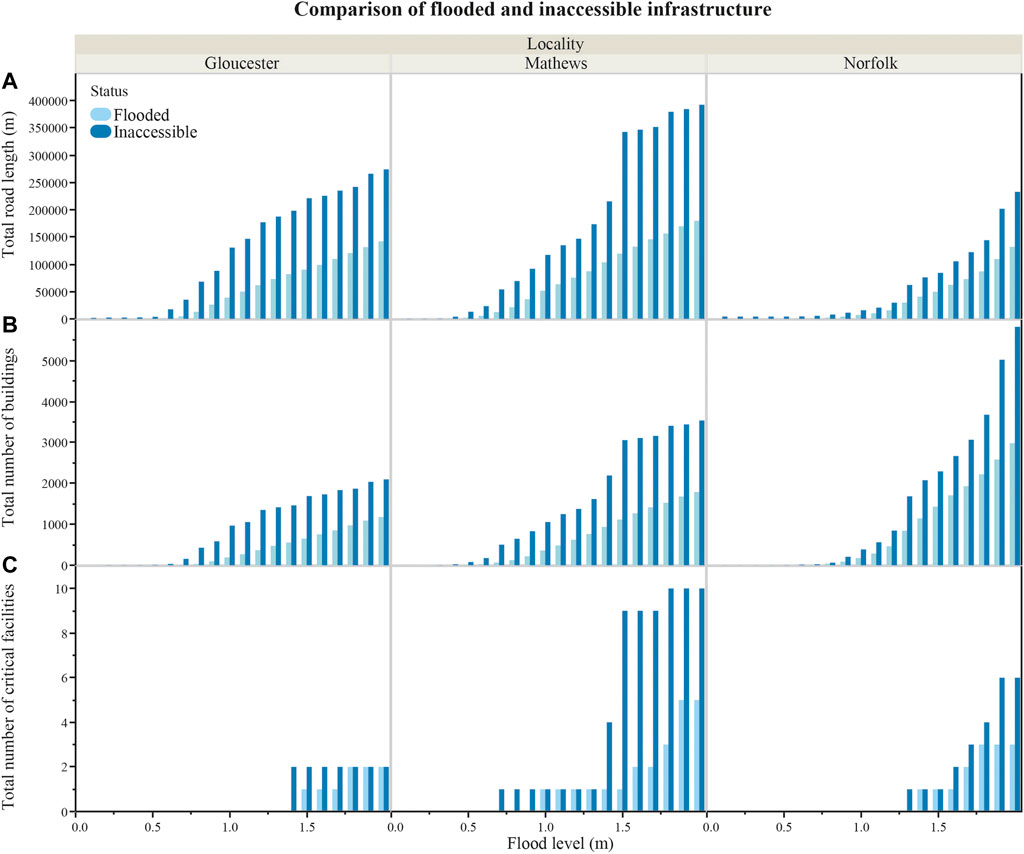
FIGURE 3. Comparisons of the impacts estimated when considering flooded areas with inaccessible areas. (A) The comparison of road length impacted under each scenario. Each of three test localities are shown in a separate frame, bars represent flooding impacts in light blue and inaccessibility impacts in dark blue. (B) The comparison of primary buildings impacted under each scenario. Each of three test localities are shown in a separate frame, bars represent flooding impacts in light blue and inaccessibility impacts in dark blue. (C) The comparison of numbers of critical facilities impacted under each scenario. Each of three test localities are shown in a separate frame, bars represent flooding impacts in light blue and inaccessibility impacts in dark blue.
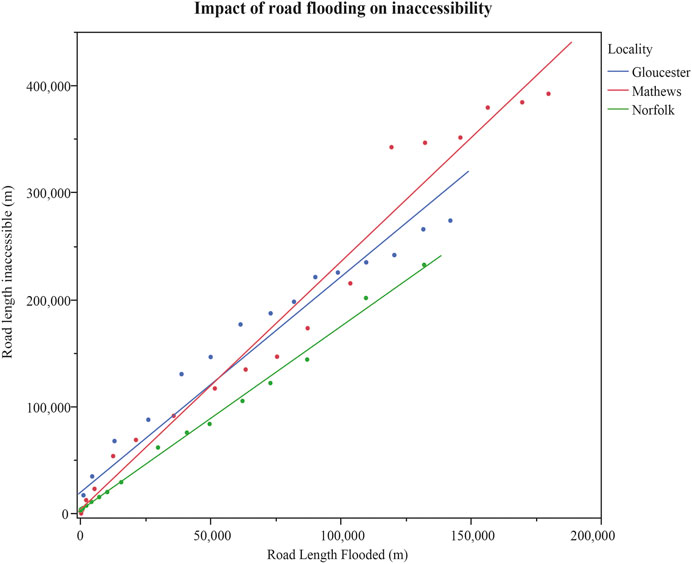
FIGURE 4. Comparison of road flooding length to the inaccessible length for flood elevations from 0.1 to 2.0 m NAVD88. Data for Gloucester is shown in blue, for Mathews is shown in red, and for Norfolk is shown in green. The relationship for each locality is shown separately. The slope of the regression line was 1.70, 2.08, and 2.36 for Norfolk, Gloucester, and Mathews, respectively. R2 values for each locality: Gloucester = 0.96; Mathews = 0.98; Norfolk = 0.99.
The number of buildings impacted were higher for all flood levels when considering the buildings on inaccessible roads compared to flooded roads (Figure 5), and buildings on inaccessible roads were significantly higher when flood levels were pooled (mean flooded = 596.25, mean inaccessible = 1,276.58, DF = 1, F Ratio = 11.297, p-value = 0.001). The increase in impact to building accessibility was relatively consistent across localities, with a 198, 178, and 195% increase in the number of buildings affected when road accessibility was considered in Mathews, Gloucester, and Norfolk, respectively.
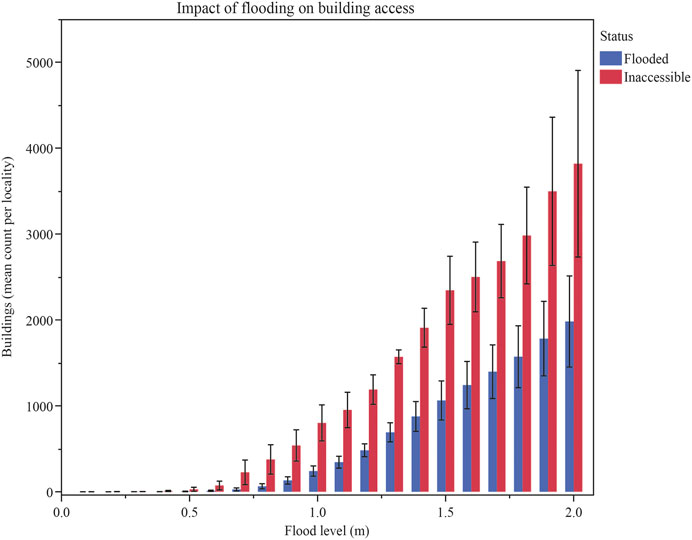
FIGURE 5. The impact of road flooding on building access, pooled across the three test localities. Bars show the average number of buildings on flooded roads (in blue) and the average number of buildings in inaccessible areas (in red) for each flood level. Buildings on inaccessible roads were significantly higher when flood levels were pooled (mean flooded = 596.25, mean inaccessible = 1,276.58, DF = 1, F Ratio = 11.297, p-value = 0.001) Error bars are one S.E. of the mean.
The number of critical facilities impacted were higher for all flood levels when considering inaccessible versus flooded roads. The increase in impact to critical facilities averaged 167, 45, and 54% higher for Mathews, Gloucester, and Norfolk, respectively, than when considering flooded roads only. As the number of critical facilities impacted is low overall (e.g., fewer than 10 impacted in each community), no statistical analysis was done to assess the significance of the relationship.
Our study shows that total road inaccessibility in the low elevation coastal communities of Chesapeake Bay, Virginia, will increase rapidly with rising water levels. High tide flooding has increased around 125% in the Southeast Atlantic since 2000 (Sweet et al., 2018) and related flood impacts to infrastructure are predicted to increase at an accelerated rate with sea level rise (Mitchell et al., 2021). The comparison of road length flooded versus road length inaccessible suggested that inaccessible road length averaged twice the length of the flooded road. The number of impacted buildings also nearly doubled when considering inaccessibility. Studies looking only at the length of flooded roads may be substantially underestimating the impact of flooding on traffic movement through the locality. Moreover, the rate at which impacts of accelerating sea level rise will be felt may be much faster than accounted for in current locality planning. Our study suggests that the rate at which road inaccessibility increased with flooding may be moderated by the degree of redundancy in the road network. Since we only looked at this relationship in three localities, confidence in the relationship is low. However, this is an area which needs more research. Fant et al. (2021) found that alternative routes could reduce delays by as much as 46% in New York city. Building redundancy into a road network could improve the resiliency of a low elevation coastal area until some threshold level of flooding is reached, where even redundant access to an area is cut off.
In this study, we used the county seat as the point of origin for the analysis and the end of each road in the locality as the end points. This approach is designed to give an overarching metric of the ability of local residents to move around the area during flood events. For two localities (Hampton and Portsmouth), the location of the county seat flooded at 1.9 m, making the metric uncalculatable for the highest water level. These results indicate the importance of locating the nodes for road network analysis of general traffic movement outside of low elevation coastal areas. Although the results from the network analysis for Hampton and Portsmouth were accurate (at less than 2.0 m flooding, travel from the county seat is limited), the implication is that flooding at that elevation is significantly hampering travel through the region, which is inaccurate. Travel is limited in only a certain portion of the county, which happened to include the point of origin.
Limitations of this study include the lack of consideration for compound flooding and water depth. Although this study is focused on low elevation coastal zones, tidal and storm surge flooding is not the only impactful flooding in the region. Precipitation flooding and compound (tidal + precipitation) flooding are both common during storm events and disrupt travel. Due to the sole focus on tidal and storm surge flooding in the study, impacts shown in the study are likely accurate for high tide flood impacts (e.g., king tide and wind-driven flood events) but underestimate the impacts from large storm events which are frequently accompanied by heavy precipitation. The use of the hydrostatic model (rather than a hydrodynamic model) may result in overestimation of road flooding in some areas, since the hydrostatic model does not account for barriers to flood that could affect flood propagation. Additionally, this study takes a binary approach to flooding, with any water level on the roadway resulting in inaccessibility. However, previous studies have shown that there is a relationship between road flood depth, vehicle speed, and the extent of disruption caused by the flooding (Brown and Dawson, 2016; Pregnolato et al., 2017). The type of vehicle may also be important when considering inaccessibility metrics, with larger tires allowing vehicles to access areas with deeper flooding on the road network.
The primary value in road network analyses is to identify opportunities for adaptation and improve resilience to flood events and sea level rise impacts. These analyses can point to areas where small road alterations (elevating roads or improving drainage and widening culverts) can restore or preserve access to many properties and reduce travel disruptions. The design of the road system can affect the type of adaptation that is most effective. For example, shore-parallel roads may have more floodable areas than shore-perpendicular roads, but they can be built up to create dikes to protect adjacent lands (Azevedo de Almeida and Mostafavi, 2016. Webb et al. (2019) suggest that nature-based features, such as constructed dunes and marshes, can reduce road flooding. Road network analyses can be geospatially combined with geographic coverages of natural feature distributions to highlight areas where different nature-based features are likely to be effective.
Another key use for road network analyses is to identify changes that could drive tipping points in coastal communities. There is growing interest in the identification of tipping points (a threshold where minor changes in a system alter the state of a system; Lenton et al., 2008) related to accelerating flood extent and duration. Physical flood impacts, such as road inaccessibility, can be linked to social and economic impacts, triggering a tipping point in the societal structure (Allen et al., 2021). These tipping points can take various formats—it might be the point at which military personnel can no longer reliably access the base within a given time period, threatening operational readiness, or it could be homeowners choosing to move away from an area where access to and from their property is impacted by high tides. The second example has the potential to affect the tax-base in property tax reliant rural localities. In addition, the inaccessibility of critical community infrastructure like schools, hospitals, and first responders (e.g., fire stations) raise important planning challenges for communities, particularly because these structures often serve as community shelters during storms. Though the overall number of critical facilities impacted by road inaccessibility is low, the impact on the community can be significant. Road network analysis is ideally structured to address concerns such as this, since it elucidates impacts to areas not directly flooded, but still impacted by flooding. In particular, Pregnolato et al. (2017) suggested that when financial resources for flood risk management are limited, road network analyses can be used to help to prioritize investment in adaptation solutions.
This study is a binary and conservative look at impacts of current and future flooding on the movement along road networks, which nevertheless raises significant concerns about the resilience of the coastal Virginia road network to projected increasing flooding. This type of study elucidates the impact of small areas of road flooding to the surrounding communities and is important for hazard mitigation and land use planning with the goal of ensuring the resilience of the community under both large storm events (short term) and sea level rise (long term). The methodology used in this study is easily exportable to most coastal regions. Open Street Map and lidar data are widely available globally, although the quality and resolution of the data may vary by location. Building data and the location of critical facilities may be more limited in geographic scope. The applicability of results from this study to other areas depends partially on the similarity of the geography of the land and the geometry of the road networks to the localities included in this study. Even among coastal localities in the coastal plain of Virginia, United States, there was variability in the percentage of the road network affected at each flood level. However, the length of inaccessible road always exceeded the area directly affected by flooding. Future work to extend the analysis’s utility could include considering depth disruption curves and the impact of flooding on travel time, with consideration for the impact of redundancy within the road network. In areas with high road redundancy, travel time may still be greatly lengthened by flooding occurring on an optimal route, necessitating cars taking a less optimal route. In addition, the duration and timing of road flooding can affect the overall disruption resulting from a flood event. Tidal road flooding tends to occur for only a few hours during each tidal cycle. If high tide coincides with heavy volume traffic, disruptions could be significant. However, if the same high tide occurs during periods of low road usage (e.g., early morning, late night), disruptions may be minimal.
In the United States, the fast-growing localities are predominately located in the coastal region (CCSP, 2009). Tidal road flooding is already disrupting communities; slowing travel and impacting the economy. As sea level rise accelerates, impacts will also accelerate. Road network analyses, such as the ones in this study, can be a valuable tool for improving the resilience of coastal zones by highlighting indirect or hidden impacts. Analyses can serve current infrastructure by prioritizing locations for adaptation and be extended to look at the longevity of planned or proposed roadways, to flood-proof new development. They can be combined with other vulnerability analyses to consider the effects of multiple stressors on the low coastal zone communities. Flooding in low elevation coastal zones does not happen within a vacuum; sea level rise-driven impacts to wastewater and drinking water infrastructure are co-occurring in rural areas (Mitchell et al., 2021). Together these stressors may change the trajectory of the economy or recommend different adaptation pathways. Understanding the societal and economic impacts to an area, particularly progress towards a tipping point, would be strengthened through modeling of combined impacts on communities.
The datasets presented in this study can be found in online repositories. The names of the repository/repositories and accession number(s) can be found below: The datasets generated and analyzed for this study can be found in the W&M ScholarWorks. https://doi.org/10.25773/MR0C-5B45, https://doi.org/10.25773/pq99-2592.
The study was conceived and designed by MM, JH, and DS. Geospatial analyses were performed by JH and DS. Statistical analyses were conducted by MM. The original draft was written by MM and JH and DS contributed to the final manuscript.
This work was funded by the Virginia Coastal Zone Management Program at the Department of Environmental Quality through Grant #NA19NOS4190163 and #NA20NOS4190207 of the U.S. Department of Commerce, National Oceanic and Atmospheric Administration, under the Coastal Zone Management Act of 1972, as amended.
We would like to acknowledge Carl Hershner and Pam Braff who piloted a network analysis that inspired this study and Marcia Berman who helped obtain funding for the project.
The authors declare that the research was conducted in the absence of any commercial or financial relationships that could be construed as a potential conflict of interest.
All claims expressed in this article are solely those of the authors and do not necessarily represent those of their affiliated organizations, or those of the publisher, the editors and the reviewers. Any product that may be evaluated in this article, or claim that may be made by its manufacturer, is not guaranteed or endorsed by the publisher.
Allen, T., Behr, J., Bukvic, A., Calder, R. S. D., Caruson, K., Connor, C., et al. (2021). Anticipating and adapting to the future impacts of climate change on the health, security and welfare of low elevation coastal zone (LECZ) communities in southeastern USA. J. Mar. Sci. Eng. 9, 1196. doi:10.3390/jmse9111196
Azevedo de Almeida, B., and Mostafavi, A. (2016). Resilience of infrastructure systems to sea-level rise in coastal areas: Impacts, adaptation measures, and implementation challenges. Sustainability 8 (11), 1115. doi:10.3390/su8111115
Boon, J. D., Mitchell, M., Loftis, J. D., and Malmquist, D. M. (2018). “Anthropocene Sea level change: A history of recent trends observed in the U.S. East, gulf, and west coast regions,” in Special report in applied marine science and ocean engineering (SRAMSOE) No. 467. Gloucester Point, VA, Virginia Institute of Marine Science, College of William and Mary. doi:10.21220/V5T17T
Boon, J. D., and Mitchell, M. (2015). Nonlinear change in sea level observed at north American tide stations. J. Coast. Res. 316, 1295–1305. doi:10.2112/jcoastres-d-15-00041.1
Brown, S., and Dawson, R. (2016). Building network-level resilience to resource disruption from flooding: Case studies from the Shetland Islands and Hurricane Sandy, FloodRisk, Lyon, October 17–21, 2016.
Church, J. A., and White, N. J. (2011). Sea-level rise from the late 19th to the early 21st Century. Surv. Geophys. 32, 585–602. doi:10.1007/s10712-011-9119-1
Ezer, T. (2013). Sea level rise, spatially uneven and temporally unsteady: Why the U.S. East Coast, the global tide gauge record, and the global altimeter data show different trends. Geophys. Res. Lett. 40, 5439–5444. doi:10.1002/2013gl057952
Ezer, T., and Atkinson, L. P. (2014). Accelerated flooding along the U.S. East coast: On the impact of sea-level rise, tides, storms, the gulf stream, and the north atlantic oscillations. Earth’s Future 2, 362–382. doi:10.1002/2014ef000252
Ezer, T., and Corlett, W. B. (2012). Is sea level rise accelerating in the Chesapeake Bay? A demonstration of a novel new approach for analyzing sea level data. Geophysical Research Letters 39 (19).
Fant, C., Jacobs, J. M., Chinowsky, P., Sweet, W., Weiss, N., Sias, J. E., et al. (2021). Mere nuisance or growing threat? The physical and economic impact of high tide flooding on US road networks. J. Infrastructure Syst. 27 (4), 04021044. doi:10.1061/(asce)is.1943-555x.0000652
Hammond, M. J., Chen, A. S., Djordjević, S., Butler, D., and Mark, O. (2015). Urban flood impact assessment: A state-of-the-art review. Urban Water J. 12 (1), 14–29. doi:10.1080/1573062x.2013.857421
Jacobs, J. M., Cattaneo, L. R., Sweet, W., and Mansfield, T. (2018). Recent and future outlooks for nuisance flooding impacts on roadways on the U.S. East coast. Transp. Res. Rec. 2672, 1–10. doi:10.1177/0361198118756366
Jonkman, S. N., and Kelman, I. (2005). An analysis of the causes and circumstances of flood disaster deaths. Disasters 29 (1), 75–97. doi:10.1111/j.0361-3666.2005.00275.x
Kopp, R. E. (2013). Does the mid-Atlantic United States sea level acceleration hot spot reflect ocean dynamic variability?. Geophysical Research Letters 40 (15), 3981–3985.
Lenton, T. M., Held, H., Kriegler, E., Hall, J. W., Lucht, W., Rahmstorf, S., et al. (2008). Tipping elements in the Earth's climate system. Proc. Natl. Acad. Sci. 105 (6), 1786–1793. doi:10.1073/pnas.0705414105
Miller, K. G., Kopp, R. E., Horton, B. P., Browning, J. V., and Kemp, A. C. (2013). A geological perspective on sea-level rise and its impacts along the U.S. mid-Atlantic coast. Earth’s Future 1, 3–18. doi:10.1002/2013ef000135
Mitchell, M., Hershner, C., Herman, J., Schatt, D., Eggington, E., and Stiles, S. (2013). Recurrent flooding study for Tidewater Virginia. Virginia senate document no. 3. Richmond, Virginia. Report. Available at: http://ccrm.vims.edu/recurrent_flooding/recurrent_flooding_study_web.pdf.
Mitchell, M., Isdell, R. E., Herman, J., and Tombleson, C. (2021). Impact assessment and management challenges of key rural human health infrastructure under sea level rise. Front. Mar. Sci. 8, 631757. doi:10.3389/fmars.2021.631757
OpenStreetMap contributors (2015). Planet dump. 2021 Available at: https://planet.openstreetmap.org.
Pregnolato, M., Ford, A., Wilkinson, S. M., and Dawson, R. J. (2017). The impact of flooding on road transport: A depth-disruption function. Transp. Res. part D Transp. Environ. 55, 67–81. doi:10.1016/j.trd.2017.06.020
Sallenger, A. H., Doran, K. S., and Howd, P. A. (2012). Hotspot of accelerated sea-level rise on the Atlantic coast of North America. Nat. Clim. Change 2, 884–888. doi:10.1038/nclimate1597
Sevtsuk, A., and Mekonnen, M. (2012). Urban network analysis. A new toolbox for ArcGIS. Int. J. Geomatics Spatial Analysis 22 (2), 287–305. doi:10.3166/rig.22.287-305
Suarez, P., Anderson, W., Mahal, V., and Lakshmanan, T. R. (2005). Impacts of flooding and climate change on urban transportation: A systemwide performance assessment of the boston metro area. Transp. Res. Part D. Transp. Environ. 10 (3), 231–244. doi:10.1016/j.trd.2005.04.007
Susilawati, , and Taylor, M. A. P. (2008). “An accessibility approach in assessing regional road network vulnerability,” in 31st australasian transportation research forum, 475–493.
Sweet, W., Dusek, G., Obeysekera, J., and Marra, J. J. (2018). “Patterns and projections of high tide flooding along the U.S. coastline using a common impact threshold,” in NOAA technical rep. NOS CO-OPS 086 (Washington, DC: NOAA).
Sweet, W. V., Kopp, R. E., Weaver, C. P., Obeysekera, J., Horton, R. M., and Thieler, E. R. (2017). Global and regional sea level rise scenarios for the United States (No. CO-OPS 083).
Sweet, W. V., and Park, J. (2014). From the extreme to the mean: Acceleration and tipping points of coastal inundation from sea level rise. Earth’s Future 2 (12), 579–600.
CCSP (U.S. Climate Change Science Program) (2009). “Coastal sensitivity to sea-level rise: A focus on the mid-atlantic region; A report by the U.S,” in Climate change science Program and the subcommittee on global change research. Editors J. G. Titus, E. K. Anderson, D. R. Cahoon, S. Gill, R. E. Thieler, and J. S. Williams (Washington, DC, USA: U.S. Environmental Protection Agency).
USGS (U.S. Geological Survey) (2022). USGS national structures dataset (NSD) Virginia. Available at: https://data.usgs.gov/datacatalog/data/USGS:db4fb1b6-1282-4e5b-9866-87a68912c5d1.
Versini, P. A., Gaume, E., and Andrieu, H. (2010a). Assessment of the susceptibility of roads to flooding based on geographical information: Test in a flash flood prone area (the gard region, France). Nat. Hazards Earth Syst. Sci. 10, 793–803. doi:10.5194/nhess-10-793-2010
VGIN(Virginia Geographic Information Network) (2022). Virginia building footprints (2022 Q3 download). Available at: https://vgin.vdem.virginia.gov/datasets/994d0afa44c046498f9774613671ce9a/about.
Keywords: road flooding, sea level rise, network analysis, community impacts, climate change
Citation: Mitchell M, Hendricks J and Schatt D (2023) Road network analyses elucidate hidden road flooding impacts under accelerating sea level rise. Front. Environ. Sci. 11:1083282. doi: 10.3389/fenvs.2023.1083282
Received: 28 October 2022; Accepted: 13 February 2023;
Published: 01 March 2023.
Edited by:
Hénaff Alain, Université de Bretagne Occidentale, FranceReviewed by:
Jennifer Freya Helgeson, Jennifer Helgeson, United StatesCopyright © 2023 Mitchell, Hendricks and Schatt. This is an open-access article distributed under the terms of the Creative Commons Attribution License (CC BY). The use, distribution or reproduction in other forums is permitted, provided the original author(s) and the copyright owner(s) are credited and that the original publication in this journal is cited, in accordance with accepted academic practice. No use, distribution or reproduction is permitted which does not comply with these terms.
*Correspondence: Molly Mitchell, bW9sbHlAdmltcy5lZHU=
Disclaimer: All claims expressed in this article are solely those of the authors and do not necessarily represent those of their affiliated organizations, or those of the publisher, the editors and the reviewers. Any product that may be evaluated in this article or claim that may be made by its manufacturer is not guaranteed or endorsed by the publisher.
Research integrity at Frontiers
Learn more about the work of our research integrity team to safeguard the quality of each article we publish.