 J. Herrera-Pérez
 L. F. Jiménez-Segura
 E. J. Márquez3
- 1Grupo de Ictiología, Instituto de Biología, Universidad de Antioquia, Medellín, Colombia
- 2Laboratorio de Genética Animal. Grupo Agrociencias, Biodiversidad y Territorio, Instituto de Biología, Facultad de Ciencias Exactas y Naturales, Universidad de Antioquia, Medellín, Colombia
- 3Laboratorio de Biología Molecular y Celular, Facultad de Ciencias, Escuela de Biociencias, Universidad Nacional de Colombia—Sede Medellín, Medellín, Colombia
- 4Grupo Genética Molecular (GENMOL), Universidad de Antioquia, Medellín, Colombia
The sabaleta, Brycon henni, is a medium-size fish species found in the Andean range of the Magdalena-Cauca river basin in Colombia, where it is a fishery resource. Recruitment of sabaleta has affected construction of dams with unknown consequences on its genetic diversity and structure. Understanding the current genetic architecture in the dam-influenced areas compared to non-regulated water flow systems is crucial to diagnose the impact of human interventions and formulate proper management strategies. In this study, we evaluated the genetic structure and diversity of B. henni by using a set of microsatellites in individuals from 14 localities to identify the number of distinct genetic pools. We used various approaches to compare populations between regulated and non-regulated areas in the Magdalena-Cauca basin, and identified eleven well-differentiated and highly diverse population groups with marked genetic structures at local and regional levels. Genetic diversity of B. henni was very similar among non-regulated and dam-regulated water flow areas; however, one of the populations in non-regulated areas showed evidence of a founder effect associated with recent introductions. The effect of dams on the genetic structure of B. henni in the Magdalena-Cauca basin was negligible, probably due to their recent construction. Future reduction of genetic diversity and the loss of unique populations is expected due to the combined effect of geographic isolation and population declines. Thus, monitoring programs are necessary to detect changes in the genetic structure of fish populations to develop useful conservation actions.
1 Introduction
The genetic structure of a population is shaped by historical processes in which evolutionary forces, the species’ life history, and landscape features converge (Balloux and Lugon-Moulin, 2002). In freshwater systems, water network architecture and longitudinal fragmentation caused by waterfalls and rapids could imply ecological barriers that limit dispersal processes (Dias et al., 2013) which could lead to isolation as well as genetic and demographic differentiation (Phillipsen and Lytle, 2013). This limit of dispersal processes is particularly true in northern South America, in Colombia, where the Andes Mountains splits into three ranges separated by the valleys of the Magdalena and Cauca Rivers. Andean topography and climate are highly diverse evidenced by the small spatial scales which lead to marked physical (Boschman, 2021) and ecological gradients (Benham and Witt, 2016). This ecological divergence promotes differentiation amongst populations, lineage diversification, and reproductive isolation (Frankham et al., 2012; Fjeldsa et al., 2012; Esquerré et al., 2019). In the Magdalena-Cauca river basin, this implies elevated levels of endemism (67.2%), where 158 (García-Alzate et al., 2021) of the 235 species reported in the basin are native (DoNascimiento et al., 2022).
The Magdalena-Cauca basin is an important center for economic development, where nearly 80% of the total population in Colombia is established. At least 50% of the nation’s continental fishing programs are concentrated there (The Nature Conservancy, 2016), and it produces 90% of the Gross Domestic Product (GDP). These socio-economic conditions generate multiple pressures on the conservation of the fluvial network and on the aquatic fauna that have been described in multiple publications (Barletta et al., 2010; Patino and Estupinan-Suarez, 2016; Valencia-Rodríguez et al., 2022b). These anthropic pressures include overfishing, habitat fragmentation, and disturbance due to dams, residual water discharge, mining, and the introduction of exotic species (Patino and Estupinan-Suarez, 2016). Dams and dikes modify river flow and affect the interchange of material and energy with impacts on the composition and structure of populations (Ward et al., 2002). These physical barriers truncate migratory cycles and restrict dispersal among population groups (Earnest et al., 2014), leading to a decrease in the effective population size and the evolutionary potential (Brinker et al., 2018). Thus, the limited ability to respond to environmental changes could increase the risk of local extinctions (Liu et al., 2020). In some fishes, mainly migratory species, the interruption in the longitudinal connection of the water bodies generated by the construction of dams may cause strong fragmentation and structuring of populations over the course of several generations (Esguícero and Arcifa, 2010). In other cases, some hypothetical scenarios suggest a short-term homogenization followed by a long-term structuring in species that return to spawn in the stream where they were born (homing behavior) (Baggio et al., 2018).
The construction of dams to generate electricity in the Colombian Andes began in 1970. There are currently 25 dam producing over 100 MW of power and an undocumented number of smaller-scale dams (Angarita et al., 2018). Fragmentation due to the inclusion of the wall within the river channel, as well as other effects of dams on the composition of the ichthyofauna in the Magdalena-Cauca basin, have been described, but the impact on local fish populations remains to be systematically explored (Valencia-Rodríguez et al., 2022a; Martínez-Toro et al., 2022). In the Central mountain range, the landscape along the Porce River receives residual water discharge from the six-million-people city of Medellín, and its landscape has been highly transformed by agriculture, cattle farming, and urban, suburban, and rural expansion. In addition, two hydroelectric power plants in this river, built and operated by Empresas Públicas de Medellín, generate 1105 MW, which accounts for nearly 1% of the total installed hydroelectric capacity of Colombia.
Brycon henni Eigenmann, 1913, the focal species for this study, is an important fishery resource for local communities in Colombia Commercial fishing for B. henni is illegal throughout the country, as well as for recreational fishing in certain regions, (Santis et al., 2007). It occurs in lotic ecosystems with temperatures ranging from 18°C to 29°C (Builes and Uran, 1974) at altitudes between 300 m and 2400 m (GBIF, 2020) in clear, cold, and highly oxygenated waters (Builes and Uran, 1974; Hurtado-Alarcón et al., 2011; Restrepo-Escobar et al., 2016; Landínez-García and Márquez, 2020; Valencia-Rodríguez et al., 2021). In addition, this species has been reported as migratory for short distances (Builes and Urán, 1974; Lasso et al., 2010; Restrepo-Escobar et al., 2016), but its reproduction cycle is not entirely known. On the other hand, homing behavior has been suggested for this species (Landínez-García and Márquez, 2020). This recognition of birthplace usually results in selection of certain phenotypes and genotypes that are characteristic of a particular basin (de Campos Telles et al., 2011).
Despite the construction of several hydropower projects across the distribution range of B. henni, population genetic studies before such interventions have only been carried out in the Ituango area (Landínez-García and Marquez, 2020); thus, little evidence is available to contrast the historical and current population structure of B. henni in the dam-regulated water flow areas. In addition, a decrease in the number of captures of B. henni has been reported in the Porce II and III dams from 2011 through 2019 (Álvarez-Bustamante et al., 1969; Valencia-Rodríguez et al., 2022a), and implementation of stocking has been suggested as a measure to reduce environmental damage and guarantee food safety. However, these activities are expensive, complex, inefficient, and their impacts have not been sufficiently documented or monitored by environmental authorities (Mancera-Rodríguez, 2017). Furthermore, the impact of hybridization between historically isolated genetic stocks remains unknown.
Therefore, it is first necessary to understand the genetic structure and diversity of natural populations, recognize evolutionary and management units, and predict their adaptive potential to anthropogenic changes (Pfenninger et al., 2011). In this study, we evaluated the genetic structure and variability of B. henni along the Magdalena-Cauca basin in both dam-regulated and non-regulated water flow areas to provide evidence that will allow us to implement better conservation practices and prioritize specific areas for the conservation of this species.
2 Materials and methods
2.1 Ethical statement
This study was conducted with the recommendations and approval of the Animal Experimentation and Ethics Committee of the Universidad de Antioquia (CEEA). The protocol was reviewed and approved by CEEA on 14 November 2017, and the study was approved on 7 December 2017. Specimen collection was granted by License 0524 of the Ministry of Environment, 27 May 2014.
2.2 Study area
The Porce River is part of the Magdalena-Cauca river basin. It begins at 2660 masl and, after running 247 km northward, it joins the Nechí River at 170 masl, finally joining the Cauca River and then the Magdalena River before flowing into the Caribbean Sea. The Magdalena-Cauca basin has a bimodal rainfall pattern with elevation gradients that generate a wide diversity of landscapes and climatic conditions. This basin has produced most of the hydroelectric power generated over the past 40 years in Colombia (Jiménez-Segura et al., 2014).
Samples were taken in 14 localities along the Magdalena-Cauca basin in 2019 (Figure 1). In the influence area of the Porce III Dam, the following six sampling sites were selected: GUA–Guadalupe River, PRZ–Plan de Pérez Stream, BRA–Bramadora Stream, CCLI–Caracolí Stream, RBL–El Roble Stream, BQR–Boquerón Stream. The three following sampling sites were selected along the Nechí River basin: TJD–La Tajada Stream, SNA–San Antonio Stream, PLN–La Plancha Stream. These two sampling sites were selected in the Anorí River subbasin: MOR–La Moreno Stream and ANO–Anorí River. One sampling site was selected in the upper Cauca River (JDN–Jordán River; one in the middle Cauca River (QMBY–Quimbaya River), and one in the middle section of the Magdalena River basin (SRF–Bizcocho River) (Figure 1; Table 1).
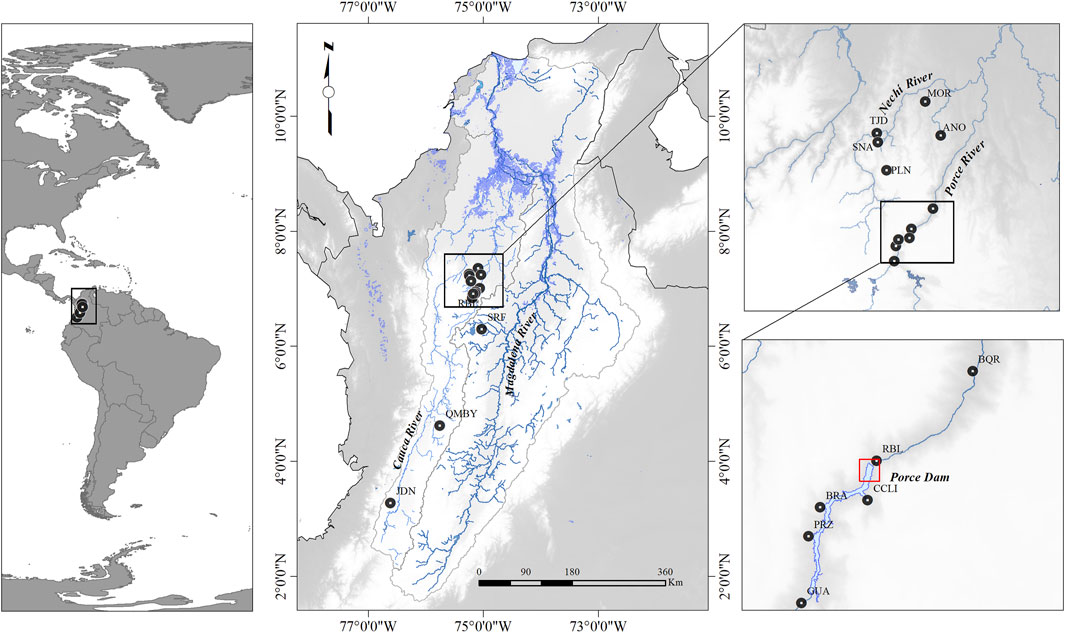
FIGURE 1. Sampling sites of B. henni populations. GUA – Guadalupe River, PRZ – Plan de Pérez Stream, BRA – Bramadora Stream, CCLI – Caracolí Stream, RBL – El Roble Stream, BQR – Boquerón Stream, TJD – La Tajada Stream, SNA – San Antonio Stream, PLN – La Plancha Stream, MOR – La Moreno Stream, ANO – Anorí River, JDN – Jordán River, QMBY – Quimbaya River, and SRF – Bizcocho River. The red lines in the figure represent the location of the wall in the Porce III Dam. The digital elevation model (SRTM, 1 arc-second) was obtained from the USGS Earth Explorer (HYPERLINK “https://earthexplorer.usgs.gov/”); the shape file of the dams and rivers was obtained from IGAC (https://geoportal.igac.gov.co/). All other products were produced by the authors and are not under copyright.
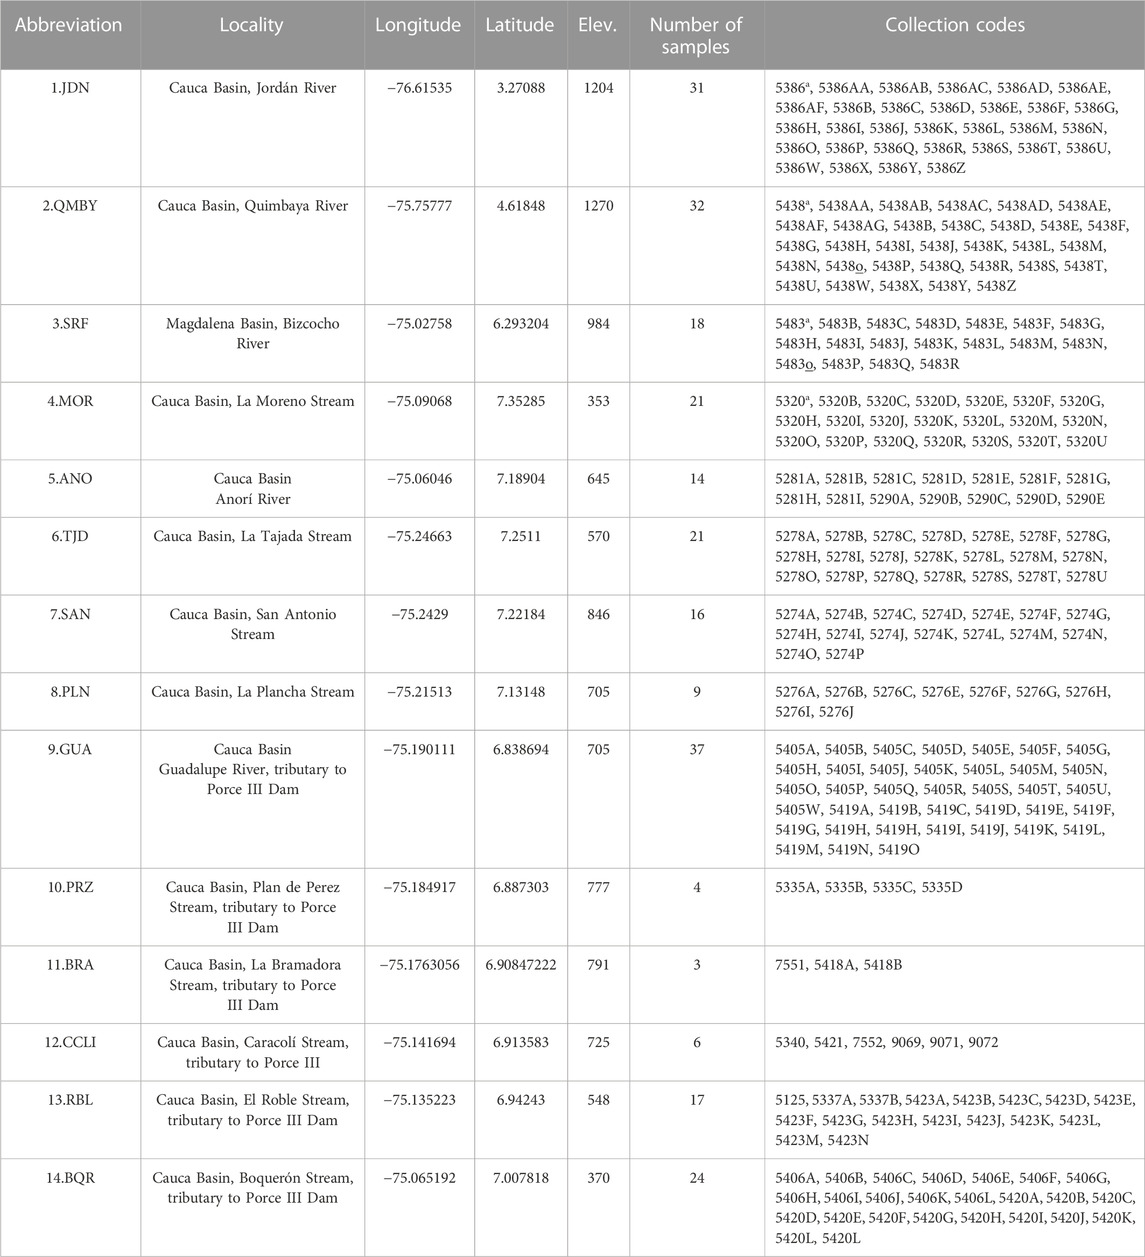
TABLE 1. Sampling localities and voucher codes of individuals collected.
2.3 Sampling and DNA extraction
Due to the selectivity of the fish capture methods (e.g., body size), we used different fishing equipment and sampling efforts at each locality. In fast-flowing rivers and streams, we used cast nets with variable mesh sizes (0.5, 1.5, and 2 cm) And we also conducted captures using a portable electrofishing unit with 1 amp pulsed current (340 V, 1–2 A, CC) along the canal. The specimens captured were anesthetized with eugenol solution to reduce stress during manipulation (Javahery et al., 2012), and a portion of muscle (∼0.5 cm3) or a piece of the distal part of the caudal fin was taken. This tissue was stored in 96% ethanol. Three to four sacrificed individuals per locality were fixed in 4% formaldehyde and were stored in the Ichthyology Collection of the Universidad de Antioquia (CIUA–158); the list of localities and number of tissues collected can be found in Table 1. In some individuals tissue samples were taken from the caudal fins and were returned to the water body where they had been captured using a holding vessel to allow for their recovery and subsequent release. The species identification was based on a taxonomic key proposed by Maldonado-Ocampo et al. (2005) and the original description provided by Eigenmann (1913). Genomic DNA was extracted using a GeneJet Genomic DNA Purification kit (Thermo Scientific, Waltham, United States).
2.4 Mitochondrial DNA sequencing and microsatellite genotyping
A 550 pb fragment of the cytochrome oxidase 1 (cox1) mitochondrial gene was amplified and sequenced using the primers FishF1 (5′-TCAACCAACCACAAAGACATTGGCAC-3′) and FishR1 (5′-TAGACTTCTGGGTGGCCAAAGAATCA-3′) proposed by Ward et al. (2005). Each PCR mix contained 1.0 μL of DNA, 1X Taq Buffer, 4 mM MgCl2, 32 μM dNTPs, 100 μM of each primer, 1.2U of Taq Polymerase (Thermo Scientific EP0406) in a final volume of 30 μL. The amplification started at 95°C for 2 min, followed by 35 cycles of 94°C for 30 s, 54°C for 30 s, 72°C for 1 min, and a final step at 72°C for 10 min. The amplicons were checked in 1% agarose electrophoresis, and both chains were then sequenced by Sanger technology in a commercial laboratory. Furthermore, two sequences of B. henni from the type locality (Dagua River), three sequences of Brycon moorei Steindachner 1878, and six sequences of Brycon rubricauda Steindachner 1879 were generated.
Ten specific microsatellite loci designed for B. henni (Landínez-García and Marquez, 2018) were amplified following a three-primer approach as defined by Blacket et al. (2012). These primers consist of a fluorescently labeled universal primer along with a pair of locus-specific primers, where the forward primer is modified with a 5’ universal tail. Each reaction contained 2 μL of DNA, 1X Taq Buffer, 10 μM dNTPs, 10 μM forward primer, 10 μM reverse primer, 10 μM 10 μM 10 μM 10 μM labeled universal primer, 10 μL Taq Polymerase (Thermo Scientific EP0406) and variable concentrations of MgCl2 (Supplementary Datasheet S1) in a final reaction volume of 15 μL. The amplification began at 95°C for 5 min, followed by 34 cycles of 94°C for 30 s, locus-specific alignment temperature (Supplementary Datasheet S1) for 45 s, and 72°C for 1 min with a final extension step at 72°C for 10 min. The amplicons were checked using 2% agarose electrophoresis and combined in three multiplexes to be run in an ABI 3130xl genetic analyzer using LIZ600 as size marker (Applied Biosystems, Foster City, CA, U.S.A.) The groups are as follows: G1: Bhe30, Bhe32, Bhe16; G2: Bhe47, Bhe34, Bhe27; and G3: Bhe26, Bhe05, Bhe20, Bhe39 (Supplementary Datasheet S1). Allele binning and assignment were done using Gene Mapper v.3.7 (Applied Biosystems, Waltham, Massachusetts, United States).
2.5 Cox1 analysis for taxonomic identification
Taxonomic validation was made from a reference database containing all the sequences for the Magdalena-Cauca species generated in this study (B. henni, B. moorei, and B. rubricauda) available in (CIUAB BOLD Systems). Additionally, we downloaded from BOLD System and Genbank other sequences from B. henni, Salminus affinis Steindachner 1880 (species that belong to the same family and co-occur in the same river basin), sequences of other Brycon Müller and Troschel, 1844 species from South America, and sequences of Triportheus Cope, 1872 and Lignobrycon Eigenmann and Myers, 1929, that belong to the Triportheidae family, recognized by Abe et al. (2014) as the sister group of Bryconidae (Supplementary Datasheet S2).
All sequences were aligned using the Muscle algorithm in Bioconductor (Edgar, 2004) and the haplotypes were generated in DnaSP v6 (Rozas, 2009). A Bayesian phylogenetic tree was constructed selecting the best-fit evolutionary model with ModelFinder (Kalyaanamoorthy et al., 2017) as implemented in the software IQ-tree2 (Minh et al., 2020), assuming a relaxed molecular clock model, a birth-death process as a tree prior, and random starting tree. A fossil calibration was applied in Triportheidae (Lignobrycon + Triportheus) using the age suggested by Abe et al. (2014). A Bayesian phylogenetic tree was run in CIPRES Science Gateway (BEAST on XSEDE) (Drummond and Rambaut, 2007) for 50 million generations sampling every 10,000 generations. TreeAnnotator v1.10.4 was used to summarize the maximum clade credibility tree, which was visualized in FigTree v1.4.3 (Rambaut, 2014).
2.6 Microsatellite analysis
2.6.1 Genetic diversity
The number of alleles per locus, the allele range, the polymorphism information content (PIC) and the frequency of null or F(Null) alleles were calculated using Cervus 3.0.7 (Kalinowaki et al., 2007). Linkage disequilibrium n (LD) between pairs of loci was calculated using with 10,000 permutations in Genpop (Rousset et al., 2017) in R (R Core Team, 2020). The effect of null alleles was tested in Micro-checker v2.2.1 (Van Oosterhout et al., 2004), and the Hardy-Weinberg Equilibrium (HWE) was evaluated per locus in each population using pegas (Pardis, 2010). In addition, to assess whether the sample size was sufficient to explore the total genetic variation of the species, a rarefaction analysis was conducted using PopGenKit (Rioux, 2015) with ten sample intervals and 1000 replicas for all samples.
For each locality, we evaluated: the Hardy-Weinberg Equilibrium (HWE), the total number of alleles per population (Na), percentage of polymorphic loci (%), allelic richness (Ar), observed heterozygosity (Ho), expected heterozygosity (He), inbreeding coefficient (Fis), and Fis 95% confidence interval in diveRsity package (Keenan, 2017). In addition, the values of Ho and He were compared amongst all population groups using a Kruskal-Wallis ANOVA and a Wilcoxon test for samples paired in R software (R Core Team, 2020). All p-values were adjusted using the BH procedure (Benjamini and Hochberg, 1995).
To evaluate genetic distances between localities, the pairwise Jost’s D coefficient of genetic differentiation was calculated in DEMEtics with 1000 permutations (Jost, 2008; Gerlach et al., 2010). p-values were adjusted for the false discovery rate (FDR) using BH (Benjamini and Hochberg, 1995). These distances were plotted using heat maps and used to build a neighbor-joining tree in R (R Core Team, 2020).
2.6.2 Population structure
To know how many stocks are present in the dam influence area and because there are close sampling sites within distances of 30 km or less, where Landínez-García and Márquez (2020) identified two differentiated stocks, we conducted two types of analyses. First, we used STRUCTURE v. 2.3.4 (Pritchard et al., 2000) with 50 million Markov Chain Monte-Carlo (MCMC), 10% burn-in, K from 1 through 14 (number of localities), and 20 iterations for each K value. Those runs in STRUCTURE were analyzed in STRUCTURESELECTOR (Li and Liu, 2018) to calculate the optimum K using the Puechmaille methods (MedMeaK, MaxMeaK, MedMedK, and MaxMedK) (Puechmaille, 2016), the ΔK Evanno method (Evanno et al., 2005), and Ln Pr (X|K) (Pritchard et al., 2000). The second method was Discriminant Analysis of Principal Components (DAPC) (Jombart et al., 2010) implemented using the Adegenet package (Solymos et al., 2020). In contrast to STRUCTURE, HWE or independent segregation of the markers are not required (Jombart et al., 2010).
3 Results
3.1 Taxonomic identification
A total of 250 out of 253 samples were successfully genotyped for the cox1 gene. The samples 5386C of JDN, 5281F of ANO, and 5483R of SRF failed due to limited DNA integrity. The 250 sequenced samples represented five haplotypes (H1-H5). H1 was present in nine of the 14 studied sites (JDN, QMBY, SRF, ANO, TJD, PLN, GUA, CCLI and RBL); H2 in SRF and in the dam surrounding area (GUA, PRZ, BRA, CCLI, RBL, BQR), H3 in MOR, TJD, SNA; H4 (GUA) and H5 (SRF) were found exclusively on a single site. Additionally, the studied sites showed the following haplotype distribution: JDN and QMBY (H1); SRF (H1, H2 and H5); ANO and PLN (H1); MOR and SNA (H3); TJD (H1 and H3); PRZ, BRA, BQR (H2), CCLI and RBL (H1 and H2), and GUA (H1, H2 and H4). As expected in the Bayesian tree, the cox1 haplotypes of the studied sites conformed a well-supported monophyletic cluster (Posterior probability: 1) with the reference mitogenome of Brycon henni (GenBank NC026873) and the individual from the type locality Dagua (6093B DGA), which confirms the taxonomic identity of the specimens analyzed in this study (Figure 2).
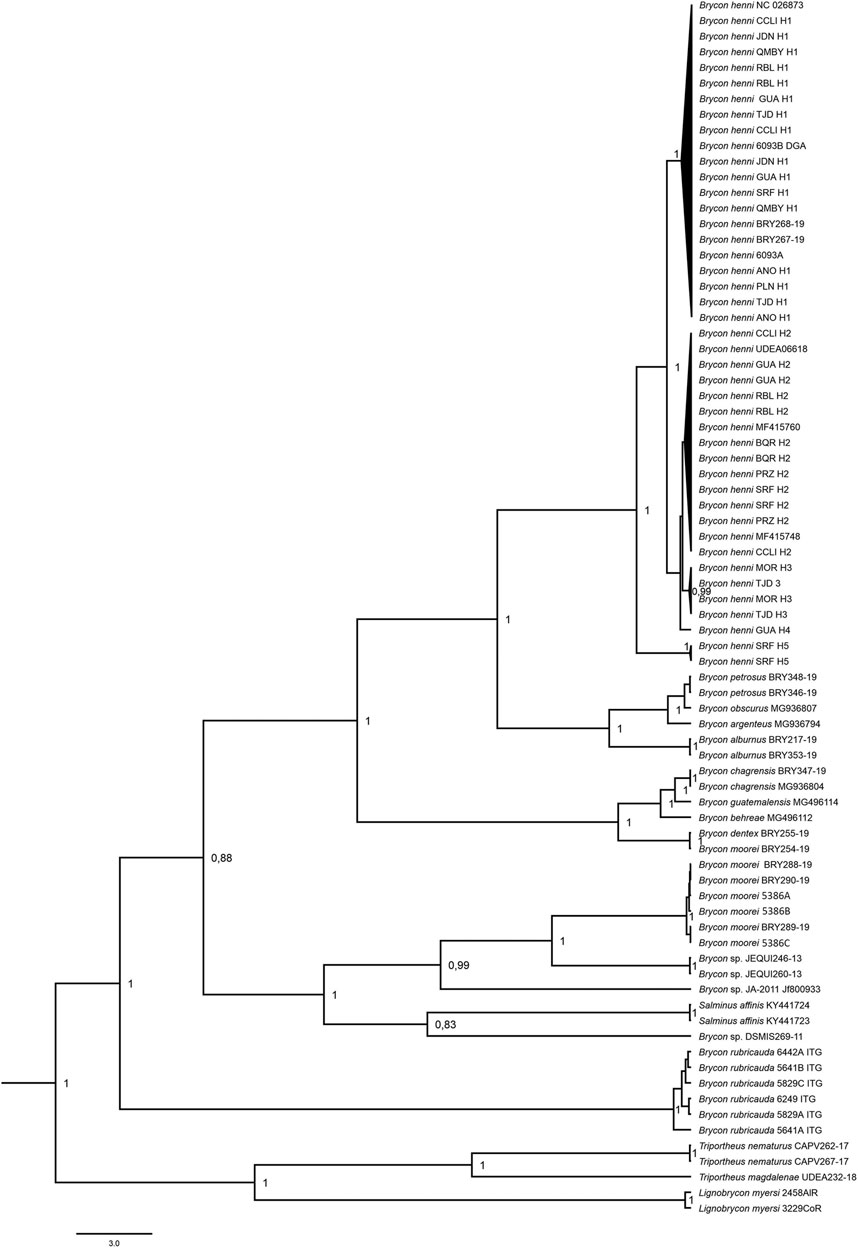
FIGURE 2. Bayesian phylogenetic tree of the cytochrome oxidase 1 (cox1) gene in Brycon henni.
3.2 Quality of microsatellite data
A total of 88 alleles were identified combining all loci with an average of 8.8 alleles per locus, where locus Bhe16 presented the highest number of alleles (14 alleles) and Bhe35 the lowest number (5 alleles). The polymorphism information content (PIC) ranged from 0.45 (Bhe34) to 0.84 (Bhe16) with a mean of 0.73 (Table 2). The probability of null alleles and dropout ranged from 0.15 (Bhe27) to 0.31, where the Bhe34 (0.31) marker presented the highest probability of null alleles (Table 2). No pair of loci presented linkage disequilibrium (Supplementary Datasheet S3). Only Bhe30 in BOQ is deviated from HWE (Supplementary Datasheet S4), and the rarefaction curves per locality showed that the number of alleles per locus in the localities PLN, PRZ, BRA, CCL, and SNA hardly reached the asymptote (Supplementary Datasheet S5B), which contrasts with an asymptotic behavior in the general rarefaction curve (Supplementary Datasheet S5A).
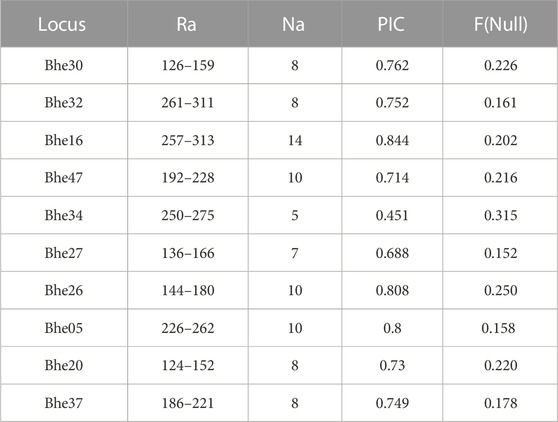
TABLE 2. Allelic range (Ra), Number of alleles per locus (Na), Polymorphism information content (PIC), (Frequency of Null Alleles (F(Null)) in B. henni.
Table 2 Allelic range (Ra), Number of alleles per locus (Na), Polymorphism information content (PIC), (Frequency of Null Alleles (F (Null)) in B. henni.
3.3 Genetic diversity and structure
A greater number of alleles (A) was observed in QMBY, MOR, and GUA with 57, 49, and 48 alleles, respectively (Table 3), whereas the localities with the lowest values were PLN and SNA. A similar trend was observed in the proportion of polymorphic loci, where QMBY was the most diverse, followed by GUA. The greatest observed (Ho) and expected (He) heterozygosity were evidenced in QMBY, MOR, TJD, SRF, and GUA, whereas SNA, BQR, and PLN presented the lowest values (Table 3). The BQR population did not meet HWE. The inbreeding coefficients (Fis) were significantly lower than zero in SNA (−0.38) and PRZ (−0.38).
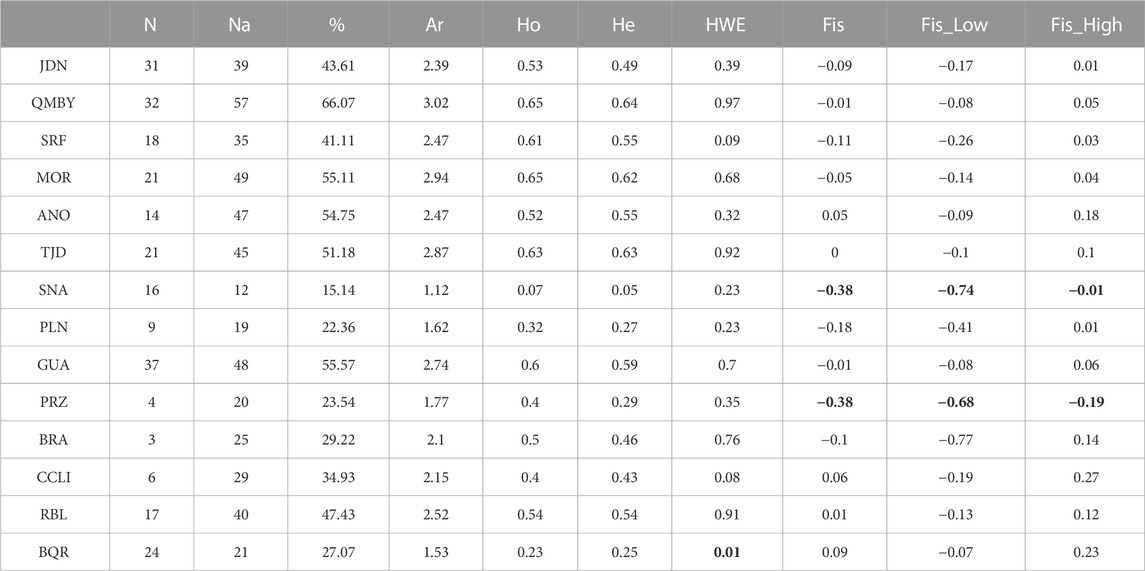
TABLE 3. Genetic diversity parameters of B. henni according to sample units. Individuals number (N), number of total alleles in each population (Na), percentage of polymorphic loci (%), Allelic richness (Ar), Observed heterozygosity (Ho), Expected heterozygosity (He), Hardy Weinberg Equilibrium, inbreeding coefficient (Fis), and 95% confidence interval. Values in bold denote statistical significance.
Individuals number (N), number of total alleles in each population (Na), percentage of polymorphic loci (%), Allelic richness (Ar), Observed heterozygosity (Ho), Expected heterozygosity (He), Hardy Weinberg Equilibrium, inbreeding coefficient (Fis), and 95% confidence interval.
The Kruskal-Wallis ANOVA among groups was significant for both Ho and He (p-value < 0.05). Regarding paired samples, the Wilcoxon test evidenced significant differences (p-value < 0.05) in Ho between BQR (Ho = 0.23, He = 0.25) and ANO, GUA, MOR, QMBY, RBL, SRF, and TJD; between SNA (Ho = 0.07, He = 0.05) and ANO, CCLI, GUA, JDN, MOR, QMBY, RBL, SRF, and TJD; and between PLN (Ho = 0.32, He = 0.27) and GUA, QMBY, SRF, and TJD (Table 4). The Jost’s D pairwise genetic distances were not significant between GUA-BRA, GUA-CCLI, CCLI-BRA, RBL-BRA, RBL-CCLI and RBL-GUA (Figures 3A,B). Significant differences (p < 0.05) were found between all the other pairs. The greatest difference was found between JDN and PRZ (0.91). Bootstrap values in pairwise comparisons involving ANO, PRZ, and BRA were not calculated due to null alleles in ANO and low amounts of samples in PRZ and BRA.
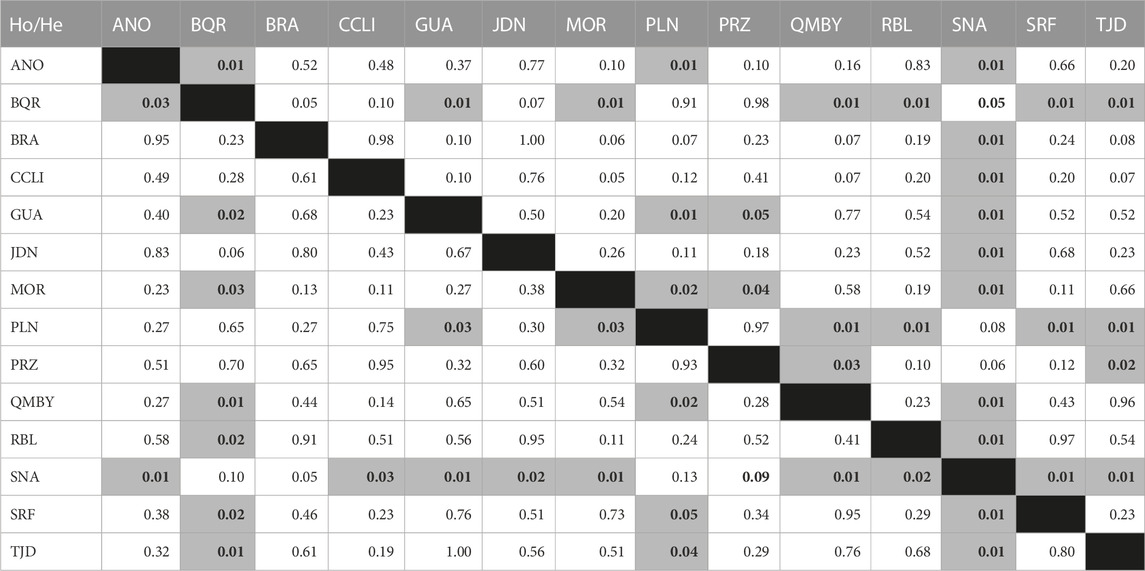
TABLE 4. Paired Wilcoxon test for observed (Ho) (lower diagonal) and expected (He) heterozygosities (upper diagonal). Values in bold denote statistical significance.
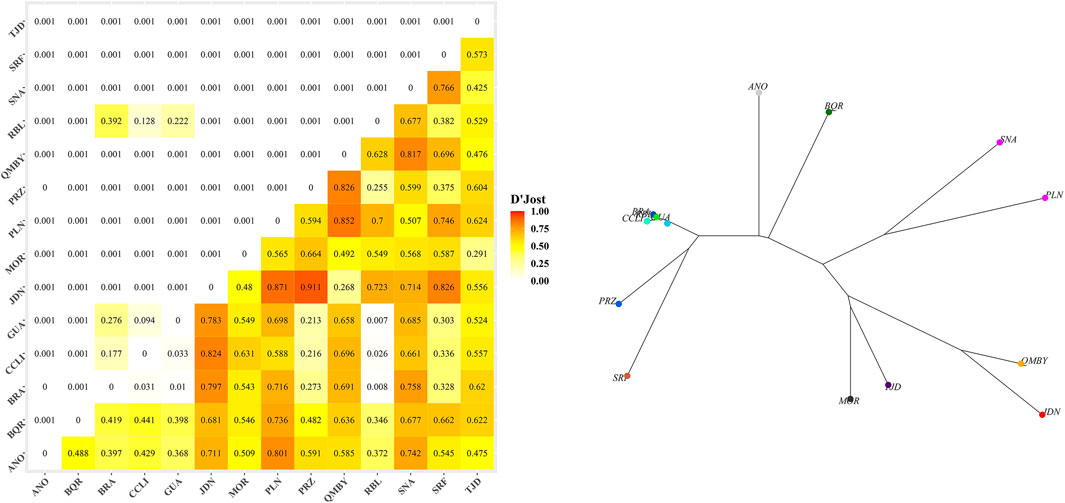
FIGURE 3. (A) Pairwise Jost’s D genetic distances (below diagonal) and p-values (above diagonal). (A) Genetic distances. (B) Neighbor-joining tree based on genetic distances.
ΔK, LnP(K) and Puechmaille in STRUCTURE yielded 3 and 11 as the most likely number of gene pools, respectively (Figure 4; Supplementary Datasheets S6, S7). In the first case (K3), a regional gradient is observed with a single stock in the south, another one in the dam-influenced area, and a third one in the northern localities mixed with the two previous stocks. In (K11), however, the same number of stocks as localities are recovered, except GUA, BRA, CCLI, and RBL, which correspond to a unique genetic stock differentiated from PRZ found in the same complex of the dam intervention area (Figure 1). The DAPC analysis defining localities as a priori groups assigned most individuals to their original cluster, with a few exceptions in GUA, CCLI, and RBL (Figure 5A). The Elbow graph showed that the most likely number of clusters is 11 (Supplementary Datasheet S8). The assignment probability shows that in the dam area (GUA, PRZ, BRA, CCLI, and RBL) two stocks seem to converge (Group 6 and Group 2) (Supplementary Datasheet S9), thus generating 11 populations (Figure 5B). A likely number of 11 gene pools was obtained with both approaches, where the six localities in the dam-influenced area were assigned to three distinct stocks; however, the assignment of few individuals to a given stock differs between these two approaches (Figure 4; Figure 5). Lastly, RBL is nested within the stock upstream of the dam, despite being located immediately downstream from the dam and geographically isolated from the rest (Figure 1).
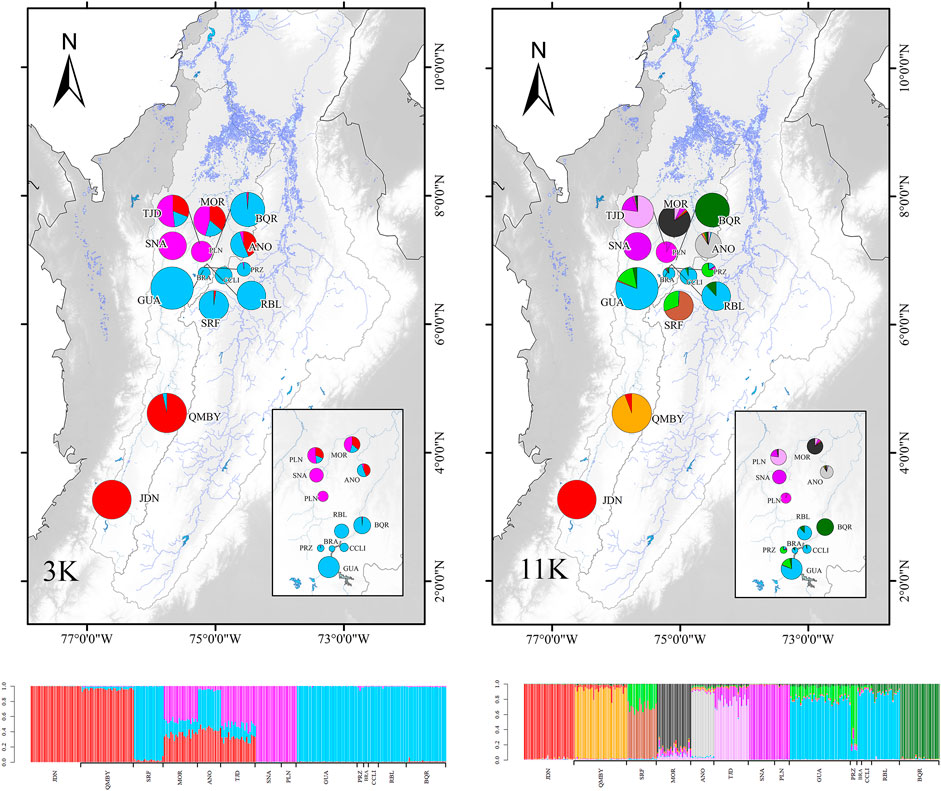
FIGURE 4. Genetic structure suggested by STRUCTURE with K = 3 and K = 11.
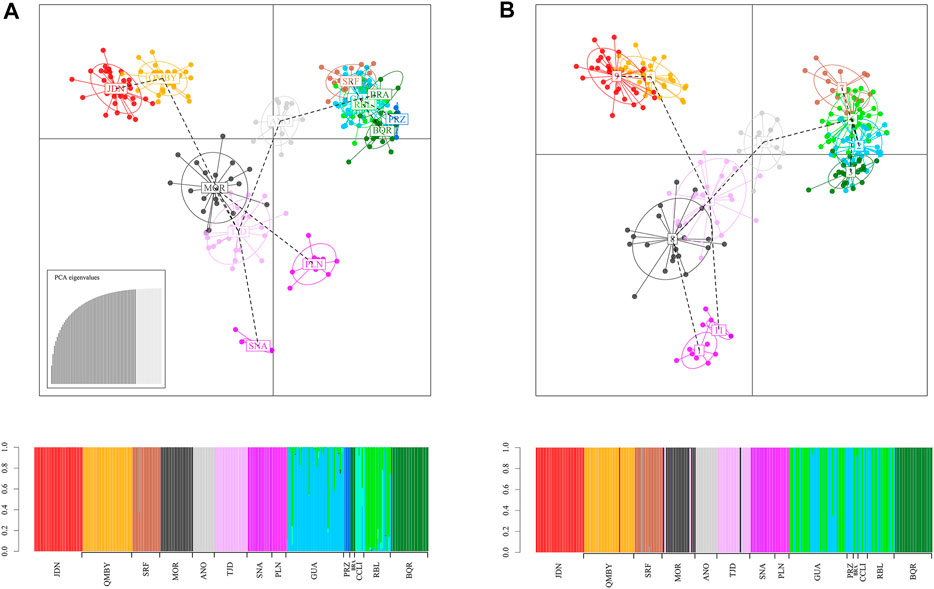
FIGURE 5. Genetic structure calculated using DAPC method. (A) Establishing a priori groups, (B) Without establishing a priori groups.
4 Discussion
This study provides evidence of the genetic patterns of B. henni at fine and broad geographic scales. The taxonomic identity was efficiently validated with the cox1 gene in both free-flowing rivers, and in systems fragmented by the Porce III Dam. Most localities evaluated in the system fragmented by this anthropic barrier exhibit high diversity without signs of inbreeding and without significant differences in relation to other diverse populations in free-flowing rivers. However, diversity varied along the Porce basin, where some free-flow areas have low genetic diversity. At the same time, discrete local populations were found along the entire basin except for some sites of the area of influence of the Porce III Dam, where three stocks were found in five localities, two of which were shared by localities upstream of the Porce III dam. In addition, at the regional level, three population stocks were evidenced in a latitudinal gradient.
The greatest diversity was registered in QMY, a free-flow area unaffected by hydroelectric projects. The number of alleles of most populations varies from 3.8 to 5.5, which is within the range described by Landínez-García and Márquez (2020). Likewise, the observed and expected heterozygosities of populations in our study were similar to those reported by Landínez-García and Márquez (2020) and Muñoz-A. et al. (2019), where He values ranged between 0.46–0.66 and 0.51–0.68, and Ho values between 0.43–0.64 and 0.24–0.43 respectively. However, the number of alleles per locus and both heterozygosity indexes were low in PLN, SNA, PRZ and BQR. Following Dlugosch and Parker (2008), PLN and SNA streams could be presenting a recent anthropogenic founder effect because of the translocation or introduction of the species in systems where they did not originally occur (Cardoso et al., 2009). Translocation is very common in South America (Povh et al., 2008), and may promote a founder effect due to a small population of origin. Translocation as an explanation for observed data is plausible because B. henni from SNA and PLN (H1) exhibit one of the most frequent haplotypes in the studied area. However, due to the lack of information of historical data, the heterozygote excess found could also be the result of a small number of breeders due to severe genetic bottlenecks; in this case the allele frequencies in males and females may be different due to binomial sampling error, generating an excess of heterozygotes in the progeny relative to the proportion expected under Hardy-Weinberg Equilibrium (Robertson, 1965; Rasmussen, 1979). Consequently, further analyses with a greater sample are required to test these explanations, as well other biological causes such as overdominance selection or associative overdominance (Nei, 1987). This reasoning might also explain the heterozygosity excess observed in PRZ, but alternatively, this may be an artifact caused by the limited sampling size. Lastly, we do not know the reason for the low heterozygosity in BQR, but it could be explained by the low number of migrants, since it is downstream from the dam and disconnected from others potential tributaries.
The STRUCTURE analysis evidenced a regional structure with three stocks that runs south to north, where SRF, which is on the western side of the Central Mountain and is separated from the rest of localities by the mountain system, presents a high probability of belonging to the center stock. This hierarchical structure is also present in haplotype composition of the samples; for instance, the south stock (JDN, QMBY) is composed by H1, the center stock composed by H2 (GUA, PRZ, BRA, CCLI, RBL, BQR), although in some sites this haplotype co-occurs with H1 (GUA, CCLI, RBL); and the north stock exhibit alternatively H1 (ANO, PLN), H3 (MOR, SNA) or both haplotypes H1, H3 (TJD). SRF shares haplotypes with the second stock (H1, H2), although it also exhibits a low frequent haplotype (H5). Additionally, the microsatellite analysis revealed a spatial genetic substructure that explains the presence of 11 stocks in the 14 studied sites since two stocks were in more than one site (SNA-PLN; GUA-BRA-CCLI-RBL). The spatial structure found in this study supports the hypothesis previously proposed by Landínez-García and Márquez (2020) where B. henni populations make up genetic patches throughout their range of distribution. Moreover, in this study, nine out of ten microsatellite markers were highly informative with PIC values above 0.5 (Botstein, White, Skolnick, and Davis, 1980). Bhe34 turned out to be moderately informative, and none of the alleles presented linkage disequilibrium. Our results have a similar number of alleles to those reported by Landínez-García and Márquez (2020), which reinforces the evidence of the efficiency in the use of these markers and their replicability, mainly in monitoring the long-term diversity of the species.
In the area of influence of the Porce III dam, the RBL stream has been isolated for approximately 10 years from the localities upstream of the dam, i.e., GUA, PRZ, BRA and CCLI, but they all conform a single cluster, which makes sense in light of the proximity between these localities and the recent construction of the river dam. In fact, in the area of influence of the dam, the DAPC and STRUCTURE analyzes showed a recent mixture of two stocks which could have resulted from homogenization of population groups close to the dam, an effect suggested by Baggio et al. (2018). This homogenization result is feasible since the generation time of the species is eight to 9 months, estimated in its coefficient for the von Bertalanff model k∼0.27 (GIUA, 2019), and approximately ten generations have passed since dam construction to the time of this study. However, it is also important to keep in mind that some factors, including the population dynamics and effective population size, among others, could overshadow the genetic fingerprint of the dam in local populations (Epps and Keyhobardi, 2015).
Considering that in this study GUA, BRA, CCL, PRZ, and RBL represent a group differentiated from the rest, it is important that it be treated as a unique stock independent from genetically differentiated populations in other regions of the Cauca River basin. Breeding of genetically different individuals could result in a decrease in local adaptability, which could lead to the non-survival of offspring in the natural environment (Melo et al., 2006). When considering maintaining the stock through captive breeding, it is important to avoid breeding between closely related individuals to prevent the inbreeding effect, which could affect the adaptive capacity and evolutionary potential of the species (Povh et al., 2008). We also acknowledge that very few captures were obtained in the PRZ stream, thus the result showing it representing a single stock should be regarded with caution. We recommend increasing the sampling effort in future studies.
This study reveals a possible effect of the construction of Porce III Dam on the local structure of the species since a process of homogenization in the dam’s area of influence may be under way. Furthermore, we believe that events, such as translocations, have affected the genetic structure and diversity of the species in the basin. Overall, regarding the populations studied near the dam, there is still no significant sign of genetic erosion, demonstrated by positive and significant Fis. Lastly, since the genetic results obtained reflect events that occurred in past generations, we suggest studies on population genetics should be accompanied by ecological studies in order to measure the possible impact anthropic interference may have on the species (Fraser and Bernatchez, 2001; Povh et al., 2008). Since a future reduction of genetic diversity is expected due to the combined effect of geographic isolation and habitat degradation, we consider it pertinent to conduct future studies that evaluate: the quality of habitat available for species, the viability of reproduction in dam-affected areas, and what kind of biotics and abiotic factors determine the reproduction and stability of the populations in the basin Fjeldså et al., 2012.
Data availability statement
The datasets presented in this study can be found in Supplementary Material.
Ethics statement
The animal study was reviewed and approved by Ethics Committee on Animal Experimentation of the Universidad de Antioquia (CEEA).
Author contributions
JH-P, LJ-S, EM, and IS-C: Conceptualization, Design Analysis, Development methodology, Writing and Editing manuscript. JH-P and OC: Laboratory an Data Analysis JH-P: Fieldwork, Data Curation. LJ-S and IS-C: Attaining resources, Project Administration. IS-C, EM, and LJ-S: Project consultancy and design.
Acknowledgments
This study was conducted through the agreement CT-2017-001714 between Empresas Públicas de Medellín and Universidad de Antioquia. In addition, the authors wish to thank all members of the GIUA, Genética animal (GAMMA) and Biología Molecuar (UNAL) research groups for their contribution, without which this study would not have been possible. We want to give special thanks to Daniel Valencia, Wendy Valencia, and Axel Arango for providing comments and revisions; Thomas P. Vida and Andrea Hinek for the English language review; Anny Yepes, who supported us with the laboratory methods; and Ricardo Landinez who designed the primers. We would like to thank Bioexpedición Anorí and ex combatants of FARC-EP, who served as field guides. Finally, thanks to the editor and reviewers for their suggestions that have improved the quality of this manuscript.
Conflict of interest
The authors declare that the research was conducted in the absence of any commercial or financial relationships that could be construed as a potential conflict of interest.
Publisher’s note
All claims expressed in this article are solely those of the authors and do not necessarily represent those of their affiliated organizations, or those of the publisher, the editors and the reviewers. Any product that may be evaluated in this article, or claim that may be made by its manufacturer, is not guaranteed or endorsed by the publisher.
Supplementary material
The Supplementary Material for this article can be found online at: https://www.frontiersin.org/articles/10.3389/fenvs.2023.1080028/full#supplementary-material
References
Abe, K. T., Mariguela, T. C., Avelino, G. S., Foresti, F., and Oliveira, C. (2014). Systematic and historical biogeography of the Bryconidae (Ostariophysi: Characiformes) suggesting a new rearrangement of its genera and an old origin of Mesoamerican ichthyofauna. BMC Evol. Biol. 14, 152. doi:10.1186/1471-2148-14-152
Álvarez-Bustamante, J., Jiménez-Segura, L. F., and Jaramillo-Villa, Ú. (1969). Ictiofauna de embalses en cascada en el cauce de un río tropical andino. Actual. Biológicas 40, 46–58. doi:10.17533/udea.acbi.v40n108a05
Angarita, H., Wickel, A. J., Sieber, J., Chavarro, J., Maldonado-Ocampo, J. A., Delgado, J., Purkey, D., et al. (2018). Basin-scale impacts of hydropower development on the Mompós Depression wetlands, Colombia. Hydrology and Earth System Sciences 22(5), 2839–2865.
Baggio, R. A., Araujo, S. B. L., Ayllón, D., and Boeger, W. A. (2018). Dams cause genetic homogenization in populations of fish that present homing behavior: Evidence from a demogenetic individual-based model. Ecol. Modell. 384, 209–220. doi:10.1016/j.ecolmodel.2018.06.019
Balloux, F. F., and Lugon-Moulin, N. (2002). The estimation of population differentiation with microsatellite markers. Mol. Ecol. 11, 155–165. doi:10.1046/j.0962-1083.2001.01436.x
Barletta, M., Jaureguizar, A. J., Baigun, C., Fontoura, N. F., Agostinho, A. A., Almeida-Val, V. M. F., et al. (2010). Fish and aquatic habitat conservation in South America: A continental overview with emphasis on neotropical systems. J. Fish. Biol. 76, 2118–2176. doi:10.1111/j.1095-8649.2010.02684.x
Benham, P. M., and Witt, C. C. (2016). The dual role of Andean topography in primary divergence: Functional and neutral variation among populations of the hummingbird, Metallura tyrianthina. BMC Evol. Biol. 16, 22–16. doi:10.1186/s12862-016-0595-2
Benjamini, Y., and Hochberg, Y. (1995). Controlling the false discovery rate: A practical and powerful approach to multiple testing. J. R. Stat. Soc. Ser. B 57, 289–300. doi:10.1111/j.2517-6161.1995.tb02031.x
Blacket, M. J., Robin, C., Good, R. T., Lee, S. F., and Miller, A. D. (2012). Universal primers for fluorescent labelling of PCR fragments-an efficient and cost-effective approach to genotyping by fluorescence. Mol. Ecol. Resour. 12, 456–463. doi:10.1111/j.1755-0998.2011.03104.x
Boschman, L. M. (2021). Andean mountain building since the late cretaceous: A paleoelevation reconstruction. Earth-Science Rev. 220, 103640. doi:10.1016/j.earscirev.2021.103640
Botstein, D., White, R. L., Skolnick, M., and Davis, R. W. (1980). Construction of a genetic linkage map in man using restriction fragment length polymorphisms. Am. J. Hum. Genet. 32(3), 314–331.
Brinker, A., Chucholl, C., Behrmann-Godel, J., Matzinger, M., Basen, T., and Baer, J. (2018). River damming drives population fragmentation and habitat loss of the threatened Danube streber (Zingel streber): Implications for conservation. Aquatic Conservation Mar. Freshw. Ecosyst. 28, 587–599. doi:10.1002/aqc.2878
Builes, J., and Uran, A. (1974). Estudio del ciclo sexual de la Sabaleta Brycon henni Eigenmann. su comportamiento y fecundacion artificial. Actual. Biológicas 7, 2–12.
Cardoso, M. J., Eldridge, M. D. B., Oakwood, M., Rankmore, B., Sherwin, W. B., and Firestone, K. B. (2009). Effects of founder events on the genetic variation of translocated island populations: Implications for conservation management of the northern quoll. Conserv. Genet. 10, 1719–1733. doi:10.1007/s10592-008-9774-z
de Campos Telles, M. P., Collevatti, R. G., da Costa, M. C., Barthem, R. B., da Silva, N. J., Neto, A. C. S., et al. (2011). A geographical genetics framework for inferring homing reproductive behavior in fishes. Genetica 139, 243–253. doi:10.1007/s10709-010-9541-1
Dias, M. S., Cornu, J. F., Oberdorff, T., Lasso, C. A., and Tedesco, P. A. (2013). Natural fragmentation in river networks as a driver of speciation for freshwater fishes. Ecogr. Cop 36, 683–689. doi:10.1111/j.1600-0587.2012.07724.x
Dlugosch, K. M., and Parker, I. M. (2008). Founding events in species invasions: Genetic variation, adaptive evolution, and the role of multiple introductions. Mol. Ecol. 17, 431–449. doi:10.1111/j.1365-294X.2007.03538.x
DoNascimiento, C., Bogotá Gregory, J. D., Albornoz Garzón, J. G., Méndez López, A., Villa Navarro, F. A., Herrera Collazos, E. E., et al. (2022). Lista de especies de peces de agua dulce de Colombia/Checklist of the freshwater fishes of Colombia. doi:10.15472/numrsoSiB Colombia, Santa Fe, Bogotá, Bogota, Colombia,
Drummond, A. J., and Rambaut, A. (2007) Beast Bayesian evolutionary analysis by sampling trees BMC Evol Biol 7:214, doi:10.1186/1471-2148-7-214
Earnest, K., Scott, J., Schaefer, J., and Duvernell, D. (2014). The landscape genetics of syntopic topminnows (Fundulus notatus and F. olivaceus) in a riverine contact zone. Ecol. Freshw. Fish 23, 572–580. doi:10.1111/eff.12109
Edgar, R. C. (2004). Muscle: Multiple sequence alignment with high accuracy and high throughput. Nucleic Acids Res. 32, 1792–1797. doi:10.1093/nar/gkh340
Eigenmann., C. H. 1913. Some results from an ichthyological reconnaissance of Colombia South America. Part II Includes 5 separate subtitles (Contrib Zool Lab Ind Univ No 131). Indiana Univ Stud. No. 18: 1–32.
Epps, C. W., and Keyghobadi, N. (2015). Landscape genetics in a changing world: Disentangling historical and contemporary influences and inferring change. Mol. Ecol. 24(24), 6021–6040. doi:10.1111/mec.13454
Esguícero, A. L. H., and Arcifa, M. S. (2010). Fragmentation of a Neotropical migratory fish population by a century-old dam. Hydrobiologia 638, 41–53. doi:10.1007/s10750-009-0008-2
Esquerré, D., Brennan, I. G., Catullo, R. A., Torres-Pérez, F., and Keogh, J. S. (2019). How mountains shape biodiversity: The role of the Andes in biogeography, diversification, and reproductive biology in South America’s most species-rich lizard radiation (Squamata: Liolaemidae). Evol. (N. Y). 73, 214–230. doi:10.1111/evo.13657
Evanno, G., Regnaut, S., and Goudet, J. (2005). Detecting the number of clusters of individuals using the software structure: A simulation study. Mol. Ecol. 14, 2611–2620. doi:10.1111/j.1365-294X.2005.02553.x
Fjeldså, J., Bowie, R. C. K., and Rahbek, C. (2012). The role of mountain ranges in the diversification of birds. Annu. Rev. Ecol. Evol. Syst. 43, 249–265. doi:10.1146/annurev-ecolsys-102710-145113
Frankham, R. (2005). Genetics and extinction. Biol. Conserv. 126, 131–140. doi:10.1016/j.biocon.2005.05.002
Fraser, D. J., and Bernatchez, L. (2001). Adaptive evolutionary conservation: Towards a unified concept for defining conservation units. Mol. Ecol. 10, 2741–2752. doi:10.1046/j.1365-294X.2001.t01-1-01411.x
García-Alzate, C., DoNascimiento, C., Villa-Navarro, F. A., García-Melo, J. E., and Herrera, -R., G. (2021). “Diversidad de peces de la cuenca del río Magdalena,” in Peces de la cuenca del río Magdalena, Colombia: Diversidad, conservación y uso sostenible, eds. L. Jimenez-Segura, and C. Lasso Bogota DC, USA.: Instituto de Investigación de Recursos Biológicos Alexander von Humboldt, 85–114. doi:10.21068/B2020RRHHXIX02
Gerlach, G., Jueterbock, A., Kraemer, P., Deppermann, J., and Harmand, P. (2010). Calculations of population differentiation based on GST and D: Forget GST but not all of statistics! Mol. Ecol. 19, 3845–3852. doi:10.1111/j.1365-294X.2010.04784.x
GIUA (2019). Tendencias en algunos parámetros de la población de Brycon henni en los últimos diez (10) años en el sector del río Porce donde se encuentra el embalse dePorce III. Medellín-Colombia: EPM- Universidad de Antioquia.
Hurtado-Alarcón, J. C., Mancera-Rodríguez, N. J., and Saldamando-Benjumea, C. I. (2011). Genetic variability of Brycon henni (characiformes: Characidae) in the middle basin of nare and guatapé rivers, Magdalena River system, Colombia. Rev. Biol. Trop. 59, 269–282.
Javahery, S., Nekoubin, H., and Moradlu, A. H. (2012). Effect of anaesthesia with clove oil in fish (review). Fish. Physiol. Biochem. 38, 1545–1552. doi:10.1007/s10695-012-9682-5
Jiménez-Segura, L. F., Restrepo-Santamaría, D., López-Casas, S., Delgado, J., Valderrama, M., Álvarez, J., et al. (2014). Ictiofauna y desarrollo del sector hidroeléctrico en la cuenca del río Magdalena-Cauca Colombia Luz. Biota Colomb. 15, 3–25.
Jombart, T., Devillard, S., and Balloux, F. (2010). Discriminant analysis of principal components: A new method for the analysis of genetically structured populations. BMC Genet. 11, 94. doi:10.1186/1471-2156-11-94
Jost, L. (2008). GST and its relatives do not measure differentiation. Mol. Ecol. 17, 4015–4026. doi:10.1111/j.1365-294X.2008.03887.x
Kalinowaki, S. T., Taper, M. L., and Marsshall, T. C. (2007). Revising how the computer program cervus accommodates genotyping error increases success in paternity assignment. Mol. Ecol. 16, 1099–1106. doi:10.1111/j.1365-294X.2007.03089.x
Kalyaanamoorthy, S., Minh, B. Q., Wong, T. K., Von Haeseler, A., and Jermiin, L. S. (2017). ModelFinder: Fast model selection for accurate phylogenetic estimates. Nat. Methods. 14(6), 587–589. doi:10.1038/nmeth.4285
Keenan, K. (2017). DiveRsity: A comprehensive, general purpose population genetics analysis package (v.1.7.5).
Landínez-García, R. M., and Marquez, E. J. (2018). Microsatellite loci development and population genetics in neotropical fish Curimata mivartii (Characiformes: Curimatidae). PeerJ 6, e5959. doi:10.7717/peerj.5959
Landínez-García, R. M., and Márquez, E. J. (2020). Population genetics of the fish Brycon henni (characiformes: Bryconidae) using species-specific polymorphic microsatellite loci. Rev. Biol. Trop. 68, 847–861. doi:10.15517/RBT.V68I3.38405
Li, Y. L., and Liu, J. X. (2018). StructureSelector: A web-based software to select and visualize the optimal number of clusters using multiple methods. Mol. Ecol. Resour. 18, 176–177. doi:10.1111/1755-0998.12719
Liu, C., Wolter, C., Xian, W., and Jeschke, J. M. (2020). Most invasive species largely conserve their climatic niche. Proc. Natl. Acad. Sci. U. S. A. 117, 23643–23651. doi:10.1073/pnas.2004289117
Maldonado-Ocampo, J. A., Ortega-Lara, A., Usma Oviedo, J. S., Villa-Navarro, F. A., Vásquez Gamboa, L., Prada-Pedreros, S., et al. (2005). Peces de los Andes de Colombia. Guía de campo. Instituto de Investigación de Recursos Biológicos Alexander von Humboldt. Available at: http://hdl.handle.net/20.500.11761/32534.Dublin, Ohio
Mancera-Rodríguez, N. J. (2017). Biología reproductiva de Brycon henni (teleostei: Bryconidae) y estrategias de conservación para los ríos Nare y Guatapé, cuenca del río Magdalena, Colombia. Rev. Biol. Trop. 65, 1105–1119. doi:10.15517/rbt.v65i3.29453
Martínez-Toro, L. M., Restrepo-Santamaría, D., Jimenez-Segura, L. F., Valencia-Rodríguez, D., and Jiménez-Segura, L. F. (2022). Ensamblajes de peces en embalses altoandinos: El caso de los embalses Quebradona y Riogrande II en la cuenca Magdalena. Caldasia 43, 442–452. doi:10.15446/caldasia.v44n2.93495
Melo, D. C., Oliveira, D. A. A., Ribeiro, L. P., Teixeira, C. S., Sousa, A. B., Coelho, E. G. A., et al. (2006). Caracterização genética de seis plantéis comerciais de tilápia (Oreochromis) utilizando marcadores microssatélites. Arq. Bras. Veterinária Zootec. 58, 87–93. doi:10.1590/s0102-09352006000100013
Minh, B. Q., Schmidt, H. A., Chernomor, O., Schrempf, D., Woodhams, M. D., Von Haeseler, A., et al. (2020). IQ-TREE 2: New models and efficient methods for phylogenetic inference in the genomic era. Mol. Biol. Evol. 37(5), 1530–1534. doi:10.1093/molbev/msaa015
Muñoz, -A., L. E., Arredondo, -B., J. V., and Carranza-Quiceno, J. A. (2019). Estructura genética poblacional del pez Brycon henni (Characiformes: Characidae) en la región andina de Colombia utilizando marcadores microsatélites. Rev. Biol. Trop. 67, 733–744. doi:10.15517/rbt.v67i4.32006
Paradis, E. (2010). pegas: an R package for population genetics with an integrated–modular approach. J. Bioinform. 26(3), 419–420. doi:10.1093/bioinformatics/btp696
Patino, J. E., and Estupinan-Suarez, L. M. (2016). Hotspots of wetland area loss in Colombia. Wetlands 36, 935–943. doi:10.1007/s13157-016-0806-z
Pfenninger, M., Salinger, M., Haun, T., and Feldmeyer, B. (2011). Factors and processes shaping the population structure and distribution of genetic variation across the species range of the freshwater snail Radix balthica (Pulmonata, Basommatophora). BMC Evol. Biol. 11, 135. doi:10.1186/1471-2148-11-135
Phillipsen, I. C., and Lytle, D. A. (2013). Aquatic insects in a sea of desert: Population genetic structure is shaped by limited dispersal in a naturally fragmented landscape. Ecogr. (Cop.). 36, 731–743. doi:10.1111/j.1600-0587.2012.00002.x
Povh, J. A., Lopera Barrero, N. M., Ribeiro, R. P., Lupchinski, E., Gomes, P. C., and Lopes, T. S. (2008). Monitoreo genético en programas de repoblamiento de peces mediante marcadores moleculares. Cienc. Investig. Agrar. 35, 5–15. doi:10.4067/s0718-16202008000100001
Pritchard, K. J., Stephens, M., and Donnelly, P. (2000). Inference of population structure using multilocus genotype data. Genet. Soc. Am. Inference, 155, 945–959. doi:10.1093/genetics/155.2.945
Puechmaille, S. J. (2016). The program structure does not reliably recover the correct population structure when sampling is uneven: Subsampling and new estimators alleviate the problem. Mol. Ecol. Resour. 16, 608–627. doi:10.1111/1755-0998.12512
R Core Team., (2020). R: A language and environmental for statistical computing. Available at: http://www.r-project.org. R Core Team, Vienna, Austria
Rambaut, A. (2010) FigTree v1.3.1. Institute of Evolutionary Biology, University of Edinburgh, Edinburgh, UK.http://tree.bio.ed.ac.uk/software/figtree/
Rasmussen, D. I. (1979). Sibling clusters and genotypic frequencies. Am. Nat. 113(6), 948–951. doi:10.1086/283449
Restrepo-Escobar, N., Hurtado-Alarcón, J. C., Mancera-Rodríguez, N. J., and Márquez, E. J. (2016). Variations of body geometry in Brycon henni (Teleostei: Characiformes, Bryconidae) in different rivers and streams. J. Fish. Biol. 89, 522–528. doi:10.1111/jfb.12971
Rioux, S. (2015). Package “PopGenKit” Title Useful functions for (batch) file conversion and data resampling in microsatellite datasets v1 Avaiable at: https://mran.revolutionanalytics.com/snapshot/2017-12-21/web/packages/PopGenKit/PopGenKit.pdf.
Robertson, A. (1965). The interpretation of genotypic ratios in domestic animal populations. Anim. Sci. J. 7(3), 319–324. doi:10.1017/s0003356100025770
Rousset, F., Lopez, L., and Belkhir, K. (2017). Package “genepop.” Cran, 16. Available at: http://kimura.univ-montp2.fr/∼rousset/Genepop.htm.
Rozas, J. (2009). DNA sequence polymorphism analysis using DnaSP. Pp. 337-350. In D. Posada (ed.) Bioinformatics for DNA sequence analysis; methods. In:Molecular Biology Series Vol. 537. Humana Press, NJ, USA
Santis, H. P., Chacón, L. A., Echavarria, A. E., Inchima, S. U., Molina, D. P., Ángel, M. O., et al. (2007). Characterization of the genetic diversity of the fish Brycon henni (Characiformes: Characidae) in central Colombia with RAPD markers. Rev. Biol. Trop. 55, 1025–1035. doi:10.15517/rbt.v55i3-4.5975
Solymos, P., Cori, A., and Calboli, F. (2020). Package ‘ adegenet’ R topics documented: The Nature Conservancy. Estado de las planicies inundables y el recurso pesquero en la Macrocuenca Magdalena-Cauca y propuesta para su manejo integrado. Bogota, Colombia.
Valencia-Rodríguez, D., Herrera-Pérez, J., Restrepo-Santamaría, D., Galeano, A., Winton, R. S., and Jiménez-Segura, L. (2022a). Fish community turnover in a dammed Andean River over time. Neotrop. Ichthyol. 20. doi:10.1590/1982-0224-2021-0091
Valencia-Rodríguez, D., Jiménez-Segura, L., Rogéliz, C. A., and Parra, J. L. (2022b). A simple and extensible framework to identify key areas for the conservation of single vulnerable freshwater species. Biol. Conserv. 273. 109672, doi:10.1016/j.biocon.2022.109672
Valencia-Rodríguez, D., Jiménez-Segura, L., Rogéliz, C. A., and Parra, J. L. (2021). Ecological niche modeling as an effective tool to predict the distribution of freshwater organisms: The case of the Sabaleta Brycon henni (Eigenmann, 1913). PLoS One. 16 (3), e0247876. doi:10.1371/journal.pone.0247876
Van Oosterhout, C., Hutchinson, W. F., Wills, D. P. M., and Shipley, P. (2004). MICRO-CHECKER: Software for identifying and correcting genotyping errors in microsatellite data. Mol. Ecol. Notes 4, 535–538. doi:10.1111/j.1471-8286.2004.00684.x
Ward, J. V., Tockner, K., Arscott, D. B., and Claret, C. (2002). Riverine landscape diversity. Freshw. Biol. 47, 517–539. doi:10.1046/j.1365-2427.2002.00893.x
Keywords: Conservation, Dams, Magdalena-Cauca, Population genetics, Restocking
Citation: Herrera-Pérez J, Jiménez-Segura LF, Márquez EJ, Campo O and Soto-Calderón ID (2023) Genetic diversity and structure of Brycon henni in regulated and non-regulated water flow rivers of the Colombian Andes. Front. Environ. Sci. 11:1080028. doi: 10.3389/fenvs.2023.1080028
Received: 25 October 2022; Accepted: 09 January 2023;
Published: 30 January 2023.
Edited by:
Felipe Polivanov Ottoni, Federal University of Maranhão, BrazilReviewed by:
Claudio Oliveira, São Paulo State University, BrazilSimanku Borah, Central Inland Fisheries Research Institute (ICAR), India
Pedro Amorim, Federal University of Rio de Janeiro, Brazil
Copyright © 2023 Herrera-Pérez, Jiménez-Segura, Márquez, Campo and Soto-Calderón. This is an open-access article distributed under the terms of the Creative Commons Attribution License (CC BY). The use, distribution or reproduction in other forums is permitted, provided the original author(s) and the copyright owner(s) are credited and that the original publication in this journal is cited, in accordance with accepted academic practice. No use, distribution or reproduction is permitted which does not comply with these terms.
*Correspondence: J. Herrera-Pérez, anVsaWFuYS5oZXJyZXJhLnBAZ21haWwuY29t
†Present Address: J. Herrera-Pérez, Laboratorio de Macroecología Evolutiva, Red de Biología Evolutiva, Instituto de Ecología, A.C, Xalapa, México