
94% of researchers rate our articles as excellent or good
Learn more about the work of our research integrity team to safeguard the quality of each article we publish.
Find out more
ORIGINAL RESEARCH article
Front. Environ. Sci., 11 May 2023
Sec. Freshwater Science
Volume 11 - 2023 | https://doi.org/10.3389/fenvs.2023.1070625
This article is part of the Research TopicFood-Energy-Water Systems: Achieving Climate Resilience and Sustainable Development in the 21st CenturyView all 21 articles
 Nicolas E. Maxfield1*
 Richard A. Smith2*
 Joseph Chang3*
 Amy W. Ando3*
 Tzu-Shun Lin4*†
 Charles J. Vörösmarty5*
 Jhih-Shyang Shih6*
The rate and extent of anthropogenic alteration of the global nitrogen cycle over the past four decades has been extensive, resulting in cascading negative impacts on riverine and coastal water quality. In this paper, we investigate the individual effects of a set of management, technology, and policy mechanisms that alter total reactive nitrogen (TN) flux through rivers, using a modified, spatially detailed SPARROW TN model, between 1980 and 2019 in the Northeast (NE) and Midwest (MW) of the United States. Using the recalibrated model, we simulate and validate a historical baseline, to which we compare a set of climate and non-climate single factor experiments (SFEs) in which individual factors are held at 1980s levels while all other factors change dynamically. We evaluate SFE performance in terms of differences in TN flux and willingness to pay. The largest effect on TN flux are related to reduction in cropland area and atmospheric nitrogen deposition. Multi-factor experiments (MFEs) suggest that increasingly efficient corn cultivars had a larger influence than increasing fertilizer application rate, while population growth has a larger influence than wastewater treatment. Extreme climate SFEs suggest that persistent wet conditions increase TN flux throughout the study region. Meanwhile, persistent hot years result in reduced TN flux. The persistent dry climate SFE leads to increased TN flux in the NE and reduced TN flux in the MW. We find that the potential for TN removal through aquatic decay is greatest in MW, due to the role of long travel time of rivers draining into the Lower Mississippi River. This paper sheds light on how a geographically and climatologically diverse region would respond to a representative selection of management options.
Nitrogen is a fundamental nutrient for ecosystem function and deeply intertwined with the food-energy-water nexus. Shifts in its distribution and increases in its rate of application have resulted from population growth, increasing reliance on industrial fertilizers for agricultural production, and energy demands being primarily met by fossil fuels (Krempa & Fickinger, 2017). These trends in nitrogen (TN) loading into human-impacted systems are connected to cascading ecological stress including inland eutrophication, hypoxia, and harmful algal blooms in upland and coastal waters (Rockstrom, et al., 2009; Mrdjen, et al., 2018). A portion of the TN applied to the land inevitably enters rivers and streams, and eventually reaches shores, however, how much is determined by climate, topography, management (including green and grey infrastructure), and hydrology (Valigura, et al., 2000; Green, et al., 2004; Alexander, et al., 2008).
Previous studies on the recent trends in TN pollution in waterways in the United States suggest that rates of fertilizer use, nitrogen fixation, and atmospheric deposition have plateaued since the 1980s compared with previous decades (Howarth, et al., 2002; Byrnes, et al., 2020). Meanwhile, cropland area has either remained the same or decreased (Zhen & Chaoqun, 2017) and crop nitrogen use efficiency has increased (Mueller, et al., 2019). In this paper we present the recent historical trends in N flux as a reflection of trends in sources, land-to-water delivery factors, and aquatic transport taken together in order to more clearly assess which have had the greatest impact on TN flux and how they are impacted by extreme climate conditions. This provides insight into the ability of mitigation strategies to address nitrogen pollution challenges.
Successful mitigation of TN water pollution, and its accompanying ecological and economical burdens, requires a systemic view. Water quality models have been developed to estimate the impacts of various sources and natural/human-made factors determining the movement of various nutrients (Smith, et al., 1997; Arnold, et al., 1998; Green, et al., 2004; Alexander, et al., 2008; Sinha & Michalak, 2016; Shih, 2022). Models can be used to isolate the effects of individual factors including traditionally engineered infrastructure, land management, and water quality policy, and simulate their effectiveness within the context of a changing climate (Vorosmarty et al., 1997).
Here, using the Climate-induced Extremes on the Food, Energy, Water Nexus (C-FEWS) framework, we apply the Spatially Referenced Regression of contaminant transport on Watershed attributes (SPARROW) model to assess the impact of key strategies for reducing N water pollution in the Midwest (MW) and Northeast (NE) of the contiguous United States (Vorosmarty et al., 2023, this issue). To do so, we develop a set of technology, management, and policy-related “dials” which we use to gauge their individual impact on TN flux between 1980 and 2019 (see Table 1 for a description of the experimental conditions). The SPARROW model approach allows us to expand upon previous studies in trends in N, by estimating how these trends have been reflected in water quality within two economically diverse regions of the United States. We find that reductions in cropland area and atmospheric nitrogen deposition have the largest impact, decreasing TN flux in the NE and MW combined. To a lesser degree, corn cultivars and wastewater treatment have led to reduced TN flux throughout, while slightly increased rates of fertilizer application and population growth have increased TN flux. We then test the response of the system to persistent extreme climate within the study region and find that the wettest scenario resulted in higher TN flux, while the hottest scenario resulted in lower TN flux across the study region. Scenarios with persistent drought and persistent cold temperatures had varied responses.
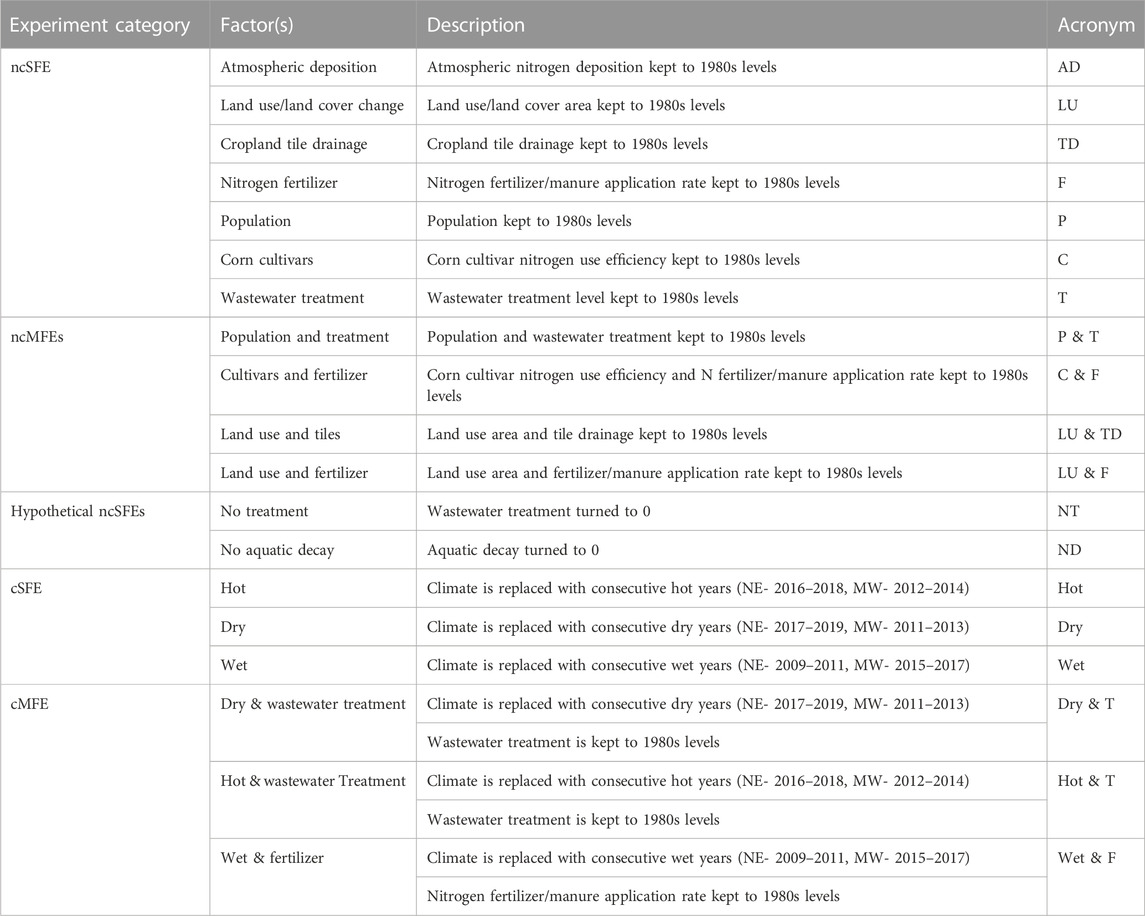
TABLE 1. Describes the experimental conditions for this study.
We conduct this analysis on the Northeast and Midwest of the United States, because they represent a large and structurally/economically diverse portion of the country. They house nearly 40% of the United States population and GDP (BEA, 2022; USCensus, 2022). They are examples extensive human impact, comprising of the most densely populated and most intensively cultivated lands in the country (Mecray, et al., 2018; Swanston, et al., 2018). The region of study has a combined estimated flux of 820 million kg of nitrogen per year (Mkg N yr−1), dominated by human sources in the NE and by agriculture in the MW (see Supplementary Figure S1). Additionally, the NE and MW offer unique hydrological and meteorological environments. In the NE, modelled TN flux is transported to 250 points along the Atlantic coast, with nearly 50% being delivered at the mouths of the Susquehanna, Delaware, Hudson, Potomac, and Connecticut Rivers (see Supplementary Figure S2). All of the rivers in the NE have an average length and drainage area of 56 km and 1,601 km2 respectively. In the MW, on the other hand, the region can be divided into three major rivers, the Missouri, Ohio, and Upper Mississippi Rivers, all of which drain into the same terminal point of the lower Mississippi River at the intersection of the Missouri, Arkansas, and Tennessee state boundaries. These have a mean length of 2,706 km and the entire drainage area (2.3 million km2) drains into the same point. Thus, this region serves as an ideal living laboratory for assessing strategies for dealing with TN flux in a complex environment and within the context of climate change.
We recalibrate the SPARROW model using a non-linear regression of contaminant flux observations from 425 monitoring stations on watershed characteristics, including TN loading, land-to-water transport factors, and stream network articulation and transport factors (Alexander, et al., 2008; Maxfield, et al., 2021; Shih, 2022). It is calibrated to represent steady-state conditions for the continental United States over the period of 1985–1994. The model uses nitrogen source inputs (population, atmospheric deposition, crop nitrogen/manure application/biological fixation, and extent of crop and natural lands. Land-to-water delivery factors are soil permeability, temperature, precipitation, stream density, cropland drainage, and the frequency of extreme conditions (hot, cold, wet, and dry) (Alexander, et al., 2008; Maxfield, et al., 2021; Shih, 2022). In-stream processing is determined by water time-of-travel and reservoir hydraulic load. Spatial resolution of the model is based on E2RF1 catchments as defined by the United States EPA (at the CONUS-level there are over 60,000 ERF1-2 reach catchments) (Nolan, et al., 2002).
The statistical significance of the calibrated model is determined based on parametric bootstrapping (see Supplementary Tables S1, S2). Error comes from uncertainty in model coefficients and uncertainty from flux variation not explained by model variables (Schwarz, et al., 2006). Confidence intervals are determined by 200 bootstrap iterations, for which random weights are applied to model observations to generate a coefficient. The uncertainty is assumed to be constant throughout the period of model simulation. To assess model uncertainty, we calculate the magnitude of the 90% confidence interval (see Eq. 1).
where M is the magnitude of the confidence interval at reach i, CU is the upper bound 90% confidence interval and CL is the lower bound. Flux is the estimated N flux at each reach i. The mean values of Mi are 1.86 (first quartile = 1.67, median = 1.82, third quartile = 2).
For the period 1980–2019, we generate a historical baseline of TN flux dynamically with a decadal timestep (1980–89, 1990–99, 2000–09, and 2010–19) using historical inputs (for greater detail on simulation data preparation and model validation see Supplementary Material, Supplementary Figure S3, Table S3). The TN flux of the baseline is compared to that of ahistorical simulations in which experimental factors are held constant, while all other factors are simulated dynamically (for a list of experiments, see Table 1). Experiments are conducted on either single factors or multiple factors, termed single-factor experiments (SFEs) and multi-factor experiments (MFEs). The experiments are classified as those relating to non-climate (nc) factors (e.g., land use, wastewater treatment) and those relating to climate conditions (c) (e.g., persistent drought or heatwave conditions). Thus, non-climate single-factor experiments, climate single-factor experiments, non-climate multi-factor experiments and climate multi-factor experiments are referred to as ncSFEs, cSFEs, ncMFEs, and cMFEs respectively. For two hypothetical ncSFEs, wastewater treatment and aquatic processing are turned off. This experiment addresses the magnitude of an important grey infrastructure (wastewater treatment) and green infrastructure (naturally occurring filtration).
For non-climate experiments, we measure the sensitivity of the system to experimental conditions by computing a delta (Δ) for each experiment using the equation below.
where ΔncSFE for a non-climate experiment i, showing the strength that this variable has on the assessment model outputs and evaluated during the 1980s and 2010s (T1 and T2) of the historical time series (Vorosmarty et al.2023, this issue). Total nitrogen flux of each nsSFE (TNncSFE) is compared with the baseline TN (TNbaseline). The same formula is used to compute the Δ of ncMFEs (ΔncMFE).
For climate-related experiments we use the following, slightly different equation.
where ΔcSFE is calculated for the last decade (2010–2019). The same equation is used to compute the ΔcMFE values.
The Δ values provide a standardized value between −1 and 1. Negative values indicate an experiment that results in lower TN flux, and positive values indicate experiments resulting in higher TN flux. The advantage of the Δ value is that the magnitude of negative or positive values are comparable to one another (unlike percentage change). A Δ value less than 0, such as those for fertilizer application, indicates that the 1980s rate of fertilizer application was lower than contemporary fertilizer application rates. Positive values, as in the experiment of corn cultivars, indicate that 1980s levels of nitrogen use efficiency resulted in higher TN flux than 2010s levels. The cSFEs and cMFEs indicate the same concept, but the climate used is based on the most extreme period of a given meteorological condition.
We compute Δ values at the ERF1-2 reach catchment level to provide a spatial interpretation of shifts in TN flux resulting from experiments. A regional Δ is computed for NE and the MW based on the TN flux out of each region. TN flux from the NE was calculated as the total flux from 250 river/stream outflows to the Atlantic coast. TN flux from the MW is calculated as the riverine flux from the Upper to the Lower Mississippi River (defined as the intersection of the Missouri, Arkansas, and Tennessee state boundaries) (see Supplementary Figure S2).
In the cases of the ncSFEs for grey infrastructure [municipal treatment turned off (NT)] and green infrastructure [in-stream natural biological decay turned off (ND)], the resulting Δ will only be positive. Using these Δ, we characterized the relative effects of green and grey infrastructure in a single metric for each region. The difference between the Δ values (ΔNT–ΔND) gives a number between 1 and −1, with positive numbers indicating stream reaches dominated by grey infrastructure and negative numbers indicating catchments dominated by green infrastructure.
The cost of ncSFEs is determined based on the household willingness to pay (WTP) to use a water body due to changes in its water quality. Values are to maintain water quality at baseline levels based on total nitrogen and total phosphorus concentrations (Chang et al., 2023). For this, TN and TP flow-weighted concentrations are computed using SPARROW model (Maxfield, et al., 2021). These are summarized using areal means at the county level. The valuation tool first takes in water pollutant concentration inputs to produce a “Water Quality Index” (WQI) estimate, and then employs a benefit transfer methodology to calculate monetary values associated with people’s willingness to pay (WTP) for a water body’s WQI (Johnston, et al., 2005; Alvarez & Vorotnikova, 2016; Johnston, et al., 2017; Johnston & Bauer, 2020). The WTP metric reflects how much a water body user would be willing to spend to either keep water quality from worsening from the baseline or improve water quality. For further elaboration, (see Chang et al., 2023).
The factors with the largest Δ throughout the entire region are land use/land cover change and atmospheric deposition (see Figure 1). Total flux reduced by 99 Mkg N yr−1 (Δ = 0.019) and 64 Mkg N yr−1 (Δ = 0.012) for land use/land cover change and atmospheric deposition respectively. In the NE, ΔLU is 0.014, while in the MW it is 0.021 (see Table 2). The regional difference is explained by the relatively small agricultural industry in the NE compared to that of the MW. There is a more marked geographic disparity in ΔAD with 0.029 in the NE and 0.008 in the MW which is explained by the staged implementation of the Clean Air Act and other policies aimed at reducing nitrogen dioxide emissions from power plants (EPA, 2022). The maps in Figure 2 show the clear geographic difference between the MW and NE for atmospheric deposition, which is less marked for land use/land cover change. In addition to showing the largest overall impact, they also both have positive deltas, indicating that both cropland area and atmospheric nitrogen deposition declined between the 1980 and 2019.
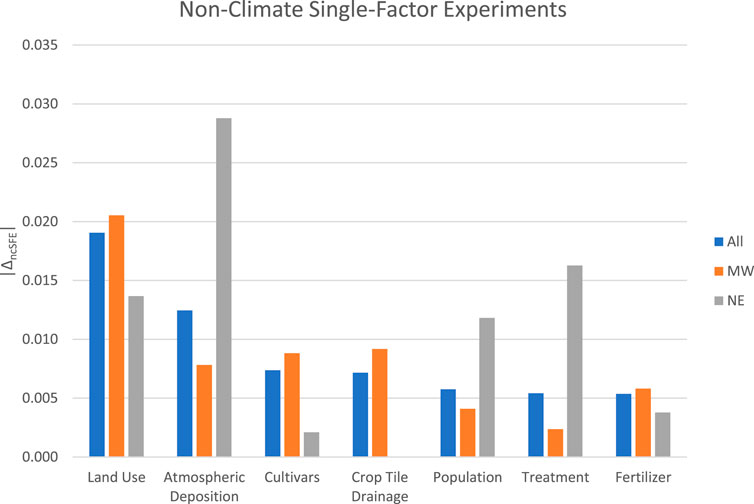
FIGURE 1. Shows the absolute values (|ΔncSFEs|) for the entire region (blue), MW (orange), and NE (grey). The values are based on the furthest downstream catchment flux for each region.
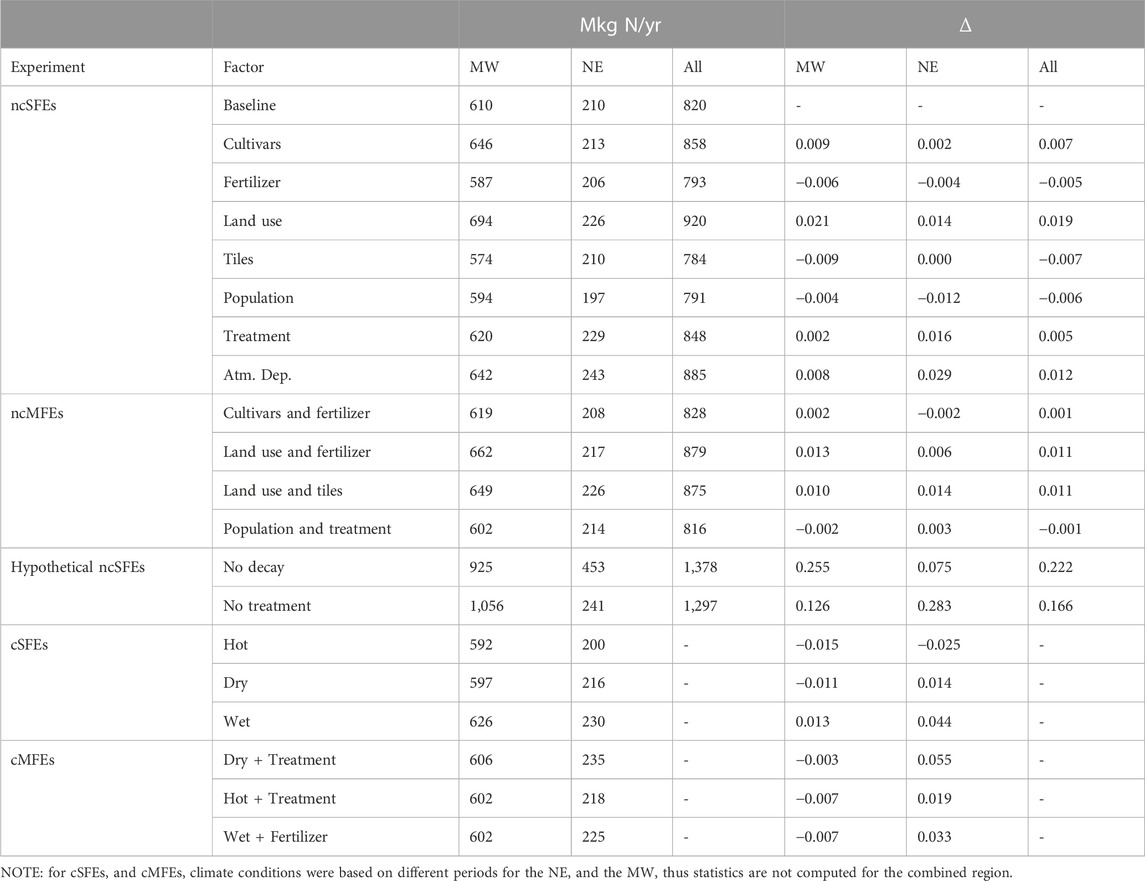
TABLE 2. Shows a summary of the results of each experiment.
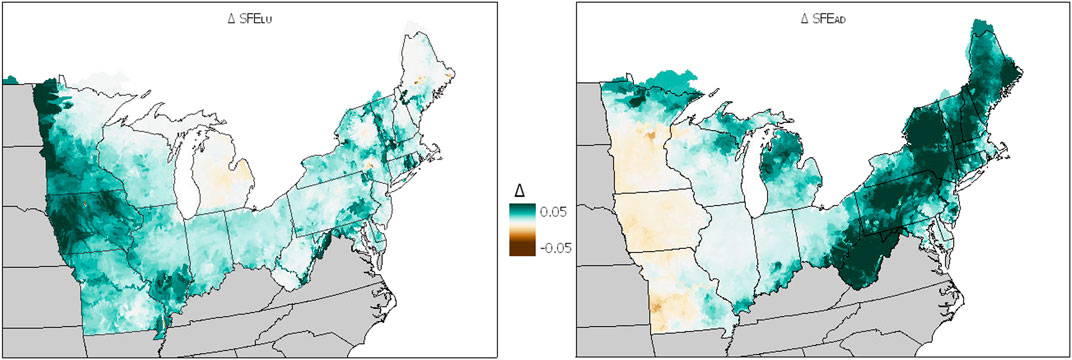
FIGURE 2. Shows the ΔLU (left) and ΔAD (right). Shades of blue indicate positive values, meaning that historical conditions of a given Δ resulted in higher TN flux than those of the present. Shades of brown indicate negative values indicating that historical conditions resulted in lower flux.
Fertilizer application, crop tile drainage, and population growth all have negative deltas indicating that, for each factor, TN flux worsened between 1980 and 2019. For the entire region, deltas of fertilizer, tile drainage, and population (ΔF, ΔTD, and ΔP) are −0.005, −0.007, and −0.006 respectively. Corn cultivars and wastewater treatment showed improvements over the same period (ΔC = 0.007 and ΔT = 0.005 respectively).
The WTP evaluation shows treatment as the largest ncSFE for the entire study area ($305 million) and for the MW ($158 million) and NE ($147 million) individually (see Table 3). This is indicative of the increase in relative value of contaminant concentration in waterbodies near densely populated areas, such as those with greater density of wastewater treatment facilities. In the NE, atmospheric deposition ($140 million), population ($136 million), and land use/land cover change ($128 million) show similarly high WTP, meanwhile fertilizer ($83 million) and corn cultivars ($67 million) are far lower. In the MW the range is far narrower, with corn cultivars ($142 million) ranking last.
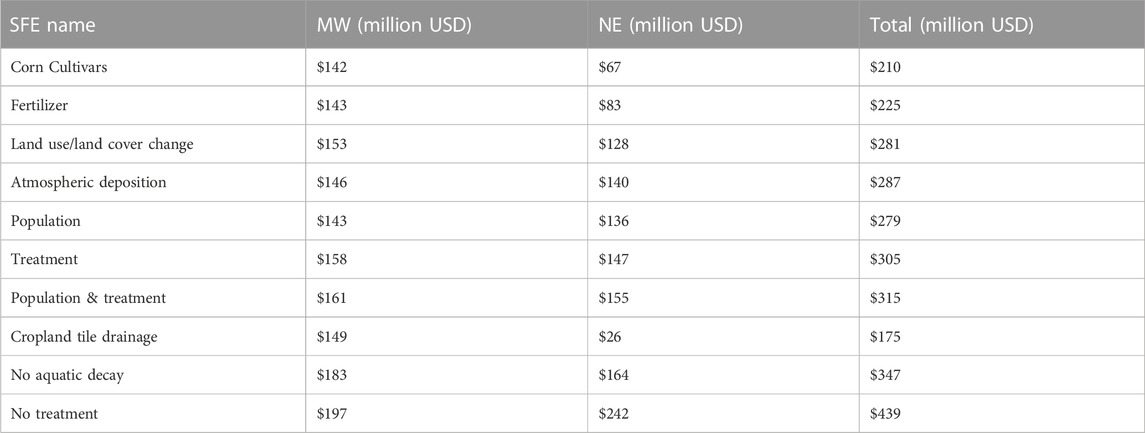
TABLE 3. Shows household willingness to pay to return to baseline conditions in each non-climate experiment.
Over the 40-year study period, both nitrogen application and corn cultivar nitrogen use increased. For the entire study area, the combined effects of cultivars and fertilizer (ΔC&F = 0.001) suggest that corn cultivar technologies more than kept up with changes in fertilizer application (see Figure 3). This is most prevalent in the MW where the majority of corn production takes place. Population growth (i.e., raw sewage inputs), on the other hand, slightly outpaced wastewater treatment, particularly in the MW (ΔP&T = −0.002). Meanwhile, in the NE, where population is the largest source of TN, the effects of improved treatment outpaced the negative effects of population growth (ΔP&T = 0.003), although this pattern is far from geographically uniform (see Figure 4). The most impactful ncSFE throughout the total study region has been the reduction of cropland area, which has outpaced increased fertilizer application (ΔLU&F = 0.011) and use of cropland tile drainage (ΔLU&TD = 0.011).
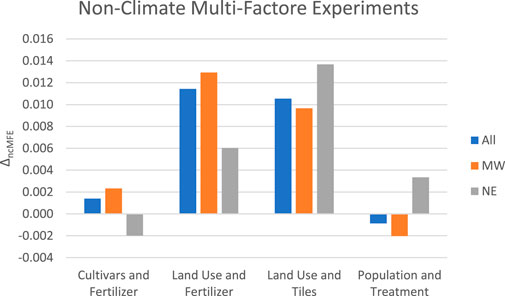
FIGURE 3. Shows the effects of combining opposing non-climate single-factor experiments. Positive values indicate that combined factors resulted in net increase in TN flux, while negative values indicate that combined factors resulted in net decrease in flux.
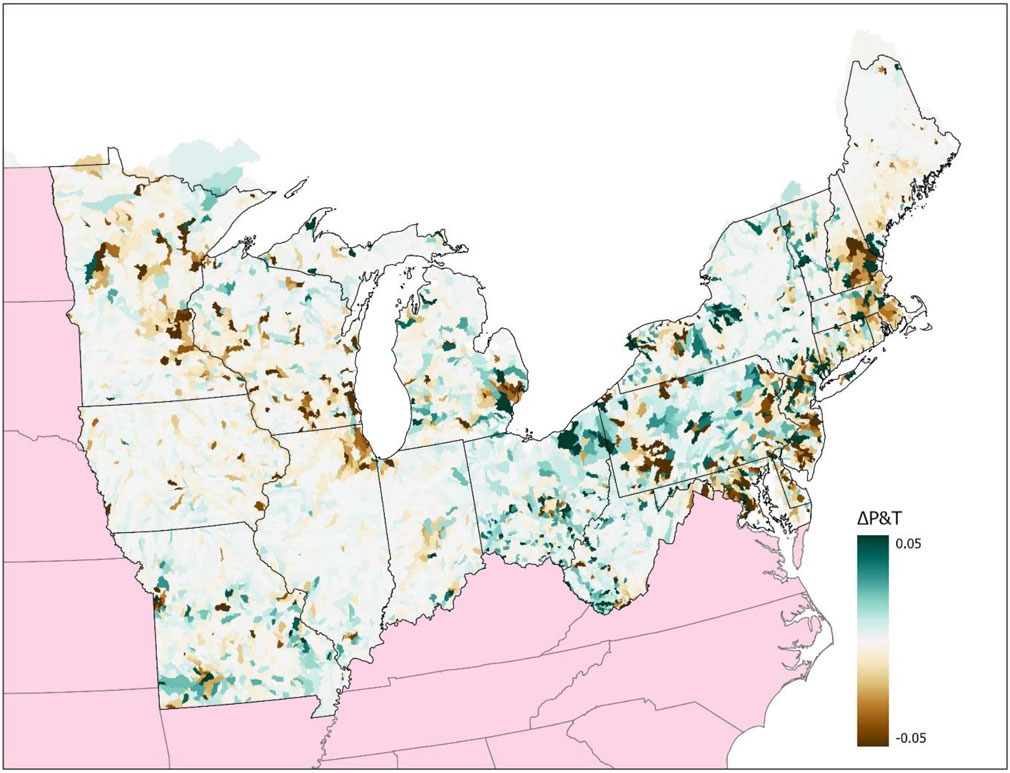
FIGURE 4. Shows the combined effects of wastewater treatment and population kept to 1980s levels. Blue values represent positive Δ values, having higher TN flux, brown values are negative, indicating a reduction in TN flux.
Scenarios of consecutive hot and wet climates have the most notable impact on TN flux. Persistent wet years increase TN flux, with ΔWet of 0.044 and 0.013 for the NE and MW respectively (see Table 2). Meanwhile, persistent hot years have the opposite effect, reducing TN flux with ΔHot of −0.025 and −0.015 for the NE and MW respectively. Persistent dry years had differing effects on TN flux in the NE (ΔDry = 0.014) and MW (ΔDry = −0.011).
The management strategy of reducing nitrogen fertilizer to 1980s levels does not overcome the impacts of consecutive years of heavy precipitation in the NE (ΔWet&F = 0.033) (see Table 2). In the MW, on the other hand, the management strategy outpaces the period of extreme precipitation. Meanwhile, the increased TN flux that results from keeping wastewater treatment to 1980s levels is offset by persistent hot and dry weather in the MW. This is not so in the NE. This speaks to 1) the increased importance, and thus effectiveness, of fertilizer management in determining TN flux in the MW; and 2) the increasingly dominant meteorological risk associated with heavy precipitation in the NE.
Turning off the effects of wastewater treatment and aquatic decay have much larger effects on TN flux than any other experiment (see Table 2). The significance of each is highly dependent upon its location (see Figure 5). Given that the NE has generally smaller rivers, limiting the travel time of TN to the mouth of any river it has a far lower ΔND (0.075) than the MW (0.255). Treatment, on the other hand, is the dominant factor in the NE (ΔNT = 0.283) and less so in the MW (0.166). Figure 5 shows the catchments dominated by grey infrastructure are those downstream from major urban centers, while green infrastructure-dominated catchments are along the longest stretches of rivers such as the Upper Mississippi and Missouri rivers.
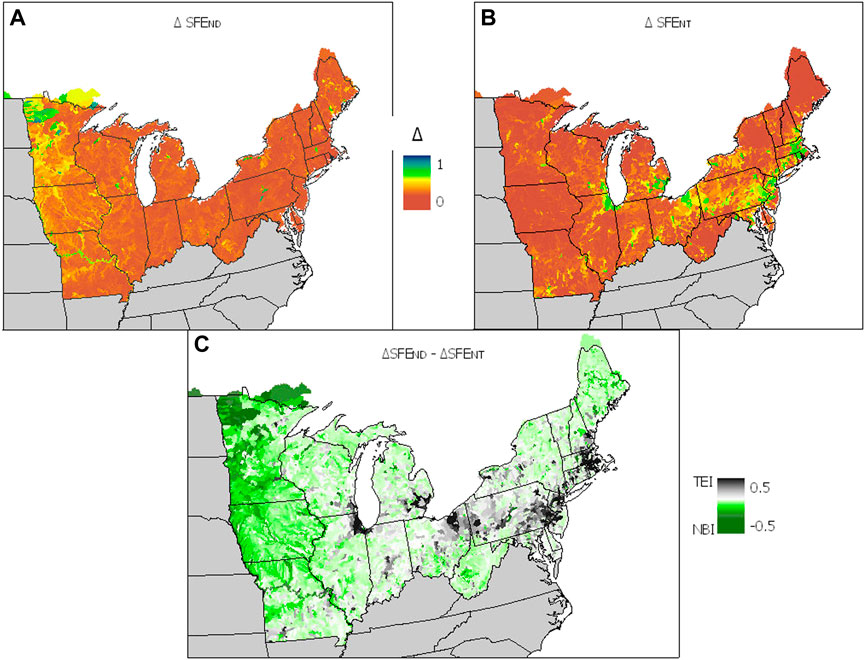
FIGURE 5. Shows ΔND (A) and ΔNT (B). To identify catchments dominated by natural-based (NBI) or traditionally-engineered (TEI) infrastructure, we subtract the two (C). Positive numbers are are dominated by TEI and negative numbers are dominated by NBI.
Common concerns with using a model to assess systemic sensitivity to the anthropogenic and climate-driven changes include model uncertainty, the occasional need for modeled inputs, and the potential non-inclusion of potentially important factors. The uncertainty, as described in Materials and Methods is determined by coefficient and model error. Improvements of such error would require more monitoring locations against which to calibrate the model (Schwarz, et al., 2006).
This study represents an application of the C-FEWS framework, in which models of carbon sequestration [Terrestrial Ecosystem Model (TEM)], agriculture yield [Integrated Science Assessment Model (ISAM)], and hydrological conditions [Water Balance Model (WBM)/Thermoelectric Power and Thermal Pollution Model (TP2M)] were fed the same conditions in order to assess sensitivity across systems (Vorosmarty et al.2023, this issue). Land use, a major factor of non-point source nitrogen, is an output of the TEM model (Kicklighter et al., 2023). Similarly, river residence time, key for determining aquatic decay, was an output from the WBM (Vorosmarty et al. 2023, this issue). For this reason, simulated conditions using historical data are presented as counterfactual representations in order to illustrate systemic sensitivity.
Finally, it is important to note the limitations of model construction and experimental design. To avoid subjectivity, for SPARROW, the inclusion of a given factor is driven by both process and empirically-based considerations (Schwarz, et al., 2006). However, there factors and strategies such as cover crops, no-till agriculture, and engineered/natural wetlands that have been touted as effective at reducing the transport of non-point source nitrogen (Meisinger and Ricigliano, 2017; Cheng, et al., 2020; Zhang, et al., 2020). Future iterations of the model, capable of estimating nutrient flux at a finer resolution, should be sensitive to nuanced elements of N processing in order to highlight these management practices.
Numerous assessments have been conducted to determine the amount of N flowing through United States waterways and its sources. In watersheds within the MW, the downward trend in N flux was also found in a recent assessment of the Mississippi River Basin (Dale, et al., 2010). However, their findings suggest that the largest factor was increased removal of N during crop harvest, while we found the largest factor to be reduced cropland extent (though increased uptake of N by crop cultivars was significant in the region). The large impact of changes in cropland extent reflects the downward trend based on the HYDE model (Zhen & Chaoqun, 2017). A land use change scenario showing constant or increasing cropland extent (such as NLCD) for experimental analysis could potentially lead to a higher impact by all other agriculture-related factors (Homer et al., 2020).
In a 2003 article it is argued that water quality (particularly as it related to N) in the NE would be most improved by improvements in point sources (Driscoll et al., 2003). Recent studies in the NE have identified reductions in N pollution in major watersheds including the Delaware River and the Chesapeake Bay watersheds (Shoda and Murphy, 2022; Ator et al., 2019). Reductions in the Chesapeake Bay watershed were dominated by improvements in point sources (80% of reductions) and atmospheric deposition (Ator et al., 2019). These findings show agreement with our results, while the overall role of point sources is somewhat diminished due to the model being limited to freshwater (thus we do not include improvements in point-sources that flow directly into tidal waters).
Our findings suggest that higher N-use efficiency of cultivars are removing N from soils at a faster pace than the increase in fertilizer application rate is largely a function of a plateauing of the fertilizer application rates since the 1980s relative to the decades prior (Cao et al., 2018). Meanwhile, during the same period, corn crops (where the highest amounts of nitrogen fertilizer is used in United States agriculture) are increasing are showing increasing nitrogen use efficiency from less than 20 kg N kg yield−1 in 1976 to over 30 kg N kg Yield−1 in 2015 (Mueller, et al., 2019). The effects of this are most notable in the MW given the predominance of corn relative to the NE.
Our findings of simulated wet and hot extreme conditions are consistent with recent assessments. Sinha et al., determined that precipitation extremes dominated TN flux in the United States, suggesting the importance of leaching of non-point N to rivers and streams in a wetting climate (Sinha & Michalak, 2016). Warming temperatures have been known to have the opposite effect, leading to a let loss of N attributed to denitrification (Liao et al., 2018). Our mixed results related to extreme dry conditions may be a factor of a few things. Importantly, despite the expected increase in drought in a changing climate, many places (including the NE) are expected to experience increased precipitation which may dominate TN flux. This is further complicated by competing processes taking place during extreme dry conditions. Persistent dry conditions reduce leaching of TN from soils to rivers and streams and may lead to low-flow conditions which would increase aquatic processing (Wollheim et al., 2008; Green et al., 2004). However, extreme drought has also been connected to unusually large pulses of nitrogen during subsequent precipitation events (Lee et al., 2021). Further study is required to better disentangle the role of extreme climate conditions on TN flux.
We used the SPARROW model to provide insight into how policy, infrastructure, and management-related strategies could be applied to reduce TN flux. Each scenario is based on recent historical conditions, thus reflect an attainable level of control over TN loading onto land and their movement into and through rivers and streams. The notable gains in water quality attained via reductions in atmospheric deposition are a testament to technological shifts away from high-emission, coal burning power plants. Air-quality policy can have TN flux impacts at a national scale. Meanwhile, wastewater treatment facilities are able to address conditions of the highest value waterways, though their effectiveness depends on populations residing within sewer service areas, which is counter to trends of suburbanization occurring in many portions of the MW (Heider & Siedentop, 2020).
Mitigation of TN flux requires a regionally specific approach that considers the most effective strategies and a changing climate. TN flux in the NE is dominated by point-sources located on portions of rivers that are too small to offer significant processing-related attenuation. Non-point sources are increasingly vulnerable to wet extremes that lead to leaching at a rate that may overpower gains made by curtailing fertilizer application. Historically, the most effective levers for dealing with TN have been reducing atmospheric deposition (related to air quality and energy policy (EPA, 2022; Shih, 2022) and increasing wastewater treatment. In the MW TN flux is dominated by agriculture. Historically, change in cropland extent, use of crop tile drainage, and planting more N-efficient corn cultivars have been the most impactful determinants of TN flux. Population growth, while not as significant as agriculture, has outpaced wastewater treatment. Both dry and hot extremes resulted in reductions in TN flux, alluding to the predominance of green infrastructure in the large rivers in the region (Chang et al., 2023; Vorosmarty et al., 1997).
The data analyzed in this study is subject to the following licenses/restrictions: None. I can provide data to any interested. Requests to access these datasets should be directed to bmljb21heGZpZWxkQGdtYWlsLmNvbQ==.
NM led the nitrogen model runs and analysis as a PhD RS acted as advisor to NM and assisted in model runs/interpretation. JC and AA used results from nitrogen model runs to conduct economic evaluation. T-SL provided essential input datasets for nitrogen modeling. CV acted as NM’s academic advisor and provided guidance on experimental design and execution. J-SS contributed to the recalibration of the SPARROW model used in this study.
The authors declare that the research was conducted in the absence of any commercial or financial relationships that could be construed as a potential conflict of interest.
All claims expressed in this article are solely those of the authors and do not necessarily represent those of their affiliated organizations, or those of the publisher, the editors and the reviewers. Any product that may be evaluated in this article, or claim that may be made by its manufacturer, is not guaranteed or endorsed by the publisher.
The Supplementary Material for this article can be found online at: https://www.frontiersin.org/articles/10.3389/fenvs.2023.1070625/full#supplementary-material
Alexander, R. B., Smith, R. A., Schwarz, G. E., Boyer, E. W., Nolan, J. V., and Brakebill, J. W. (2008). Differences in phosphorus and nitrogen delivery to the Gulf of Mexico from the Mississippi River Basin. Environ. Sci. Technol. 42, 822–830. doi:10.1021/es0716103
Alvarez, S., and Vorotnikova, E. (2016). Valuing the potential benefits of water quality improvements in watersheds affected by non-point source pollution. Water 8 (112), 112. doi:10.3390/w8040112
Arnold, J. G., Srinivasan, R., Muttiah, R. S., and Williams, J. R. (1998). Large area hydrologic modeling and assessment Part I: Model development. J. Am. Water Resour. Assoc. 34 (1), 73–89. doi:10.1111/j.1752-1688.1998.tb05961.x
Ator, S. W., Garcia, A. M., Schwarz, G. E., Blomquist, J. D., and Sekellick, A. J. (2019). Toward explaining nitrogen and phosphorus trends in chesapeake bay tributaries. 1992-2012. JAWRA. 55 (5), 1149–1168.
BEA, (2022). GDP by state. Available at: https://www.bea.gov/data/gdp/gdp-state.
Byrnes, D. K., Van Meter, K. J., and Basu, N. B. (2020). Long-term shifts in U.S. Nitrogen sources and sinks revealed by the new TREND-nitrogen data set (1930-2017). Glob. Biogeochem. Cycles 34, e2020GB006626. doi:10.1029/2020gb006626
Cao, P., Lu, C., and Yu, Z. (2018). Historical nitrogen fertilizer use in agricultural ecosystems of the contiguous United States during 1850-2015: application rate, timing, and fertilizer types. Earth Syst. Sci. Data 10, 969–984.
Chang, J. W., Ando, A. W., and Chen, M. (2023). Valuing changes in the portfolio of service flows from climate-induced extremes on a linked food, energy, water system (C-FEWS). Front. Environ. Sci. 11. doi:10.3389/fenvs.2023.1069483
Cheng, F. Y., Van Meter, K. J., Byrnes, D. K., and Basu, N. B. (2020). Maximizing US nitrate removal through wetland protection and restoration. Nature 588 (7839), 625–630.
Dale, V. H., Kling, C., Meyer, J. L., Sanders, J., Stallworth, H., Armitage, T., et al. (2010). Hypoxia in the northern Gulf of Mexico (Vol. 185), 625–630. New York, NY: Springer.
Driscoll, C. T., Whitall, D., Aber, J., Boyer, E., Castro, M., Cronan, C., et al. (2003). Nitrogen pollution in the Northeastern United States: sources, effects, and management options. BioScience 53 (4), 357–374.
EPA, (2022). Progress cleaning the air and improving people's health. Available at: https://www.epa.gov/clean-air-act-overview/progress-cleaning-air-and-improving-peoples-health.
Green, P. A., Vörösmarty, C. J., Meybeck, M., Galloway, J. N., Peterson, B. J., and Boyer, E. W. (2004). Pre-industrial and contemporary fluxes of nitrogen through rivers: A global assessment based on typology. Biogeochemistry 68, 71–105. doi:10.1023/b:biog.0000025742.82155.92
Heider, B., and Siedentop, S. (2020). Employment suburbanization in the 21st century: A comparison of German and US city regions. Cities 104, 102802.
Homer, C., Dewitz, J., Jin, S., Xian, G., Costello, C., Danielson, P., et al. (2020). Conterminous United States land cover change patterns 2001–2016 from the 2016 national land cover database. ISPRS J. Photogramm. Remote Sens. 162, 184–199.
Howarth, R. W., Elizabeth, B. W., Pabich, W. J., and Galloway, J. N. (2002). Nitrogen use in the United States from 1961-2000 and potential future trends. Ambio 31 (2), 88–96. doi:10.1579/0044-7447-31.2.88
Johnston, R. J., and Bauer, D. (2020). Using meta-analysis for large-scale ecosystem service valuation: Progress, prospects, and challenges. Agric. Resour. Econ. Rev. 49, 23–63. doi:10.1017/age.2019.22
Johnston, R. J., Besedin, E. Y., Iovanna, R., Miller, C. J., Wardwell, R. F., and Ranson, M. H. (2005). Systematic variation in willingness to pay for aquatic resource improvements and implications for benefit transfer: A meta-analysis. Can. J. Agric. Econ. 53, 221–248. doi:10.1111/j.1744-7976.2005.04018.x
Johnston, R. J., Besedin, E. Y., and Stapler, R. (2017). Enhanced geospatial validity for meta-analysis and environmental benefit transfer: An application to water quality improvements. Environ. Resour. Econ. 68, 343–375. doi:10.1007/s10640-016-0021-7
Kicklighter, D. W., Lin, T.-S., Zhang, J., Chen, M., Vörösmarty, C. J., Jain, A., et al. (2023). Influence of forest infrastructure on the responses of ecosystem services toclimate extremes in the Midwest and Northeast United States from 1980 to 2019. Front. Environ. Sci. 11 (Special Issue on FEWS), 1069451. doi:10.3389/fenvs.2023.1069451
Krempa, H. M., and Fickinger, A. K. (2017). Temporal changes in nitrogen and phosphorus concentrations with comparisons to conservation practices and agricultural activities in the lower grand river, Missouri and Iowa, and selected watersheds 1969-2015. Reston, VA, USA: US Department of the Interior and US Geological Survey.
Lee, M., Stock, C. A., Shevliakova, E., Malyshev, S., and Milly, P. D. (2021). Globally prevalent land nitrogen memory amplifies water pollution following drought years. Environ. Res. Lett. 16.
Liao, R., Miao, Y., Li, J., Li, Y., Wang, Z., Du, J., et al. (2018). Temperature dependence of denitrification microbial communities and functional genes in an expanded granular sludge bed reactor treating nitrate-rich wastewater. RSC Advances 8 (73), 42087–42094.
Maxfield, N. E., Smith, R., Sanyal, S., Vorosmarty, C. J., and Shih, J.-S. (2021). Investigating the impact of climate extremes on nitrogen flux in CONUS watersheds. New Orleans, LA, USA: AGU Fall Meeting.
Mecray, E. L., Lemcke-Stampone, M. D., Hodgkins, G. A., Lentz, E. E., Mills, K. E., Lane, E. D., et al. (2018). “Chapter 18: Northeast,” in Impacts, risks, and adaptation in the United States: Fourth national climate assessment. Editor J. F. Knott (Washington, DC, USA: U.S. Global Change Research Program), 669–742.
Meisinger, J. J., and Ricigliano, K. A. (2017). Nitrate leaching from winter cereal cover crops using undisturbed soil-column lysimeters. J. Environ. Qual. 46 (3), 576–584.
Mrdjen, I., Fennessy, S., Schaal, A., Dennis, R., Slonczewski, J. L., Lee, S., et al. (2018). Tile drainage and anthropogenic land use contribute to harmful algal blooms and microbiota shifts in inland water bodies. Environ. Sci. Technol. 52, 8215–8223. doi:10.1021/acs.est.8b03269
Mueller, S. M., Messina, C. D., and Vyn, T. J. (2019). Simultaneous gains in grain yield and nitrogen efficiency over 70 years of maize genetic improvement. Sci. Rep. 9, 9095. doi:10.1038/s41598-019-45485-5(9095)
Nolan, J. V., Brakebill, J. W., Alexander, R. B., and Schwarz, G. E. (2002). ERF1_2 -- enhanced river reach file 2.0. Available at: https://water.usgs.gov/GIS/metadata/usgswrd/XML/erf1_2.xml.
Rockstrom, J., Steffen, W., Noone, K., Persson, Å., Chapin, F. S. I., Lambin, E., et al. (2009). Planetary boundaries: Exploring the safe operating space for humanity. Ecol. Soc. Dec. 14 (2), art32. doi:10.5751/es-03180-140232
Schwarz, G. E., Hoos, A. B., Alexander, R. B., and Smith, R. A. (2006). The SPARROW surface water-quality model: Theory, application and user documentation. Reston, VA, USA: U.S. Geological Survey.
Shih, J.-S., Driscoll, C. T., Burtraw, D., Shen, H., Smith, R. A., Keyes, A., et al. (2022). Energy policy and coastal water quality: An integrated energy, air and water quality modeling approach. Sci. Total Environ. 816, 151593. doi:10.1016/j.scitotenv.2021.151593
Shoda, M. E., and Murphy, J. C. (2022). Water-quality trends in the Delaware River Basin calculated using multisource data and two methods for trend periods ending in 2018. Reston, VA: U.S. Geological Survey.
Sinha, E., and Michalak, A. M. (2016). Precipitation dominates interannual variability of riverine nitrogen loading across the continental United States. Environ. Sci. Technol. 50, 12874–12884. doi:10.1021/acs.est.6b04455
Smith, R. A., Schwarz, G. E., and Alexander, R. B. (1997). Regional interpretation of water-quality monitoring data. Water Resour. Res. 33 (12), 2781–2798. doi:10.1029/97wr02171
Swanston, C., Boustead, B. M., Conlon, K. C., Hall, K. R., Jorns, J. L., Kunkel, K. E., et al. (2018). “Chapter 21: Midwest,” in Impacts, risks, and Adaptation in the United States: Fourth national climate assessment. Editor T. Bonnot (Washington, DC, USA: U.S. GLobal Change Research Program), 872–940.
Uscensus, (2022). Census gov. Available at: https://www.census.gov/popclock/data_tables.php?component=growth.
Valigura, R. A. (2000). Nitrogen loading in coastal water bodies: An atmospheric perspective. (Washington, DC, USA: American Geophysical Union).
Vorosmarty, C. J. This issue. A Framework to Study Climate-Induced Extremes on the Food, Energy, Water Nexus and The Role of Engineered and Natural Infrastructure. Lausanne, Switzerland:2023 Frontiers.
Vorosmarty, C. J., Wasson, R., and Richey, J. (1997). IGBP report 39: Modelling the transport and transformation of terrestrial materials to freshwater and coastal ecosystems. Stockholm, Sweden: The International Geosphere-Biosphere Programme.
Wollheim, W. M., Vorosmarty, C. J., Bouwman, A. F., Green, P., Harrison, J., Linder, E., et al. (2008). Global N removal by freshwater aquatic systems using a spatially distributed, within-basin approach. Global Biogeochem. Cycles 22.
Zhang, Y., Xie, D., Ni, J., and Zeng, X. (2020). Conservation tillage practices reduce nitrogen losses in the sloping upland of the Three Gorges Reservoir area: No-till is better than mulch-till. Agric. Ecosyst. Environ. 300, 107003.
Keywords: nitrogen pollution, water quality model, climate chage, mitigation strategies, green/grey infrastructure
Citation: Maxfield NE, Smith RA, Chang J, Ando AW, Lin T-S, Vörösmarty CJ and Shih J-S (2023) Riverine nitrogen flux and its response to management, climate, and other environmental factors in Northeast and Midwest United States. Front. Environ. Sci. 11:1070625. doi: 10.3389/fenvs.2023.1070625
Received: 15 October 2022; Accepted: 25 April 2023;
Published: 11 May 2023.
Edited by:
Tor Haakon Bakken, Norwegian University of Science and Technology, NorwayReviewed by:
Qian Zhang, University of Maryland, United StatesCopyright © 2023 Maxfield, Smith, Chang, Ando, Lin, Vörösmarty and Shih. This is an open-access article distributed under the terms of the Creative Commons Attribution License (CC BY). The use, distribution or reproduction in other forums is permitted, provided the original author(s) and the copyright owner(s) are credited and that the original publication in this journal is cited, in accordance with accepted academic practice. No use, distribution or reproduction is permitted which does not comply with these terms.
*Correspondence: Nicolas E. Maxfield, bmljb21heGZpZWxkQGdtYWlsLmNvbQ==; Richard A. Smith, cnNtaXRoMUB1c2dzLmdvdg==; Joseph Chang, am9zZXBod2VpY2hhbmdAZ21haWwuY29t; Amy W. Ando, YW15YW5kb0BpbGxpbm9pcy5lZHU=; Tzu-Shun Lin, dHNsaW4yQHVjYXIuZWR1; Charles J. Vörösmarty, Y3Zvcm9zbWFydHlAZ21haWwuY29t; Jhih-Shyang Shih, U2hpaEByZmYub3Jn
†Present address: Tzu-Shun Lin, National Center for Atmospheric Research, Boulder, CO, United States
Disclaimer: All claims expressed in this article are solely those of the authors and do not necessarily represent those of their affiliated organizations, or those of the publisher, the editors and the reviewers. Any product that may be evaluated in this article or claim that may be made by its manufacturer is not guaranteed or endorsed by the publisher.
Research integrity at Frontiers
Learn more about the work of our research integrity team to safeguard the quality of each article we publish.