
94% of researchers rate our articles as excellent or good
Learn more about the work of our research integrity team to safeguard the quality of each article we publish.
Find out more
ORIGINAL RESEARCH article
Front. Environ. Sci., 07 March 2023
Sec. Interdisciplinary Climate Studies
Volume 11 - 2023 | https://doi.org/10.3389/fenvs.2023.1069451
This article is part of the Research TopicFood-Energy-Water Systems: Achieving Climate Resilience and Sustainable Development in the 21st CenturyView all 21 articles
 David W. Kicklighter1*
 Tzu-Shun Lin2
 Jiaqi Zhang3
 Mengye Chen3Charles J. Vörösmarty4,5,6
 Atul K. Jain2
 Jerry M. Melillo1
Forests provide several critical ecosystem services that help to support human society. Alteration of forest infrastructure by changes in land use, atmospheric chemistry, and climate change influence the ability of forests to provide these ecosystem services and their sensitivity to existing and future extreme climate events. Here, we explore how the evolving forest infrastructure of the Midwest and Northeast United States influences carbon sequestration, biomass increment (i.e., change in vegetation carbon), biomass burning associated with fuelwood and slash removal, the creation of wood products, and runoff between 1980 and 2019 within the context of changing environmental conditions and extreme climate events using a coupled modeling and assessment framework. For the 40-year study period, the region’s forests functioned as a net atmospheric carbon sink of 687 Tg C with similar amounts of carbon sequestered in the Midwest and the Northeast. Most of the carbon has been sequestered in vegetation (+771 Tg C) with more carbon stored in Midwestern trees than in Northeastern trees to provide a larger resource for potential wood products in the future. Runoff from forests has also provided 4,651 billion m3 of water for potential use by humans during the study period with the Northeastern forests providing about 2.4 times more water than the Midwestern forests. Our analyses indicate that climate variability, as particularly influenced by heat waves, has the dominant effect on the ability of forest ecosystems to sequester atmospheric CO2 to mitigate climate change, create new wood biomass for future fuel and wood products, and provide runoff for potential human use. Forest carbon sequestration and biomass increment appear to be more sensitive to heat waves in the Midwest than the Northeast while forest runoff appears to be more sensitive in the Northeast than the Midwest. Land-use change, driven by expanding suburban areas and cropland abandonment, has enhanced the detrimental heat-wave effects in Midwestern forests over time, but moderated these effects in Northeastern forests. When developing climate stabilization, energy production and water security policies, it will be important to consider how evolving forest infrastructure modifies ecosystem services and their responses to extreme climate events over time.
Forest ecosystems are a dominant component of the nature-based infrastructure (NBI) in both the Northeastern and Midwestern regions of the United States. The wooded ecosystems provide society with a range of services that affect the energy and water balances of the two regions. These ecosystem services include sequestration of atmospheric carbon dioxide (CO2) into vegetation biomass and soil organic matter to help mitigate climate change (Anderson-Teixeira et al., 2021; Canadell et al., 2021; Defries et al., 2022); the provision of vegetation biomass for fuel, paper products and construction materials (Birdsey and Lewis, 2003; FAO, 2019); and regulation of water supplies (Ellison et al., 2012; Khand and Senay, 2021; McNulty et al., 2021; Singh and Basu, 2022; Yu et al., 2022) for human use.
Forest ecosystem services are interlinked such that management designed to promote one service may have unintended consequences on others. The availability of biomass depends on the ability of vegetation to create new biomass (i.e., sequester carbon in vegetation) when the creation of new tissue by photosynthesis is greater than the loss of biomass from tissue death, consumption, and mortality or removal associated with human and natural disturbances (e.g., fire, wind). The loss of vegetation biomass as litterfall or mortality can lead to carbon sequestration in soils when these carbon inputs are greater than the loss of soil organic carbon to the atmosphere from decomposition. While the decomposition of soil organic matter returns carbon back to the atmosphere to possibly enhance global warming, this decomposition also releases nutrients, like nitrogen, that ultimately can support tree growth. Because the carbon:nitrogen ratios of woody tissues are significantly higher than those for soil organic matter (Melillo, 1996), the vegetation uptake of nitrogen released by decomposition can lead to larger amounts of carbon sequestered by vegetation than is lost from soil organic matter through decomposition (Melillo et al., 2011). The structure of soil organic matter also enhances the ability of vegetation to obtain water and nutrients for growth (Hoffland et al., 2020). As the characteristics of forest vegetation and soils vary across a region, the ability of forests to provide ecosystem services will also vary. In addition, these ecosystem services can change over time as forests mature after disturbances (Margalef, 1963) or evolve in response to changes in land management, atmospheric chemistry, and climate (Swanston et al., 2018; Canadell et al., 2021). These changes in forest NBI may also affect the sensitivity of ecosystem services to extreme climate events (Frank et al., 2015).
Ecosystem services associated with forest NBI supplement services provided by traditionally-engineered infrastructure (TEI, e.g., buildings, bridges, electrical grids, dams, water treatment plants, sewage treatment plants). However, competition for land between forest NBI and TEI can affect the ability of these infrastructures to provide services to society. Improved understanding of the ecosystem services provided by forests and their sensitivity to extreme climate events can inform policymakers on how to more effectively integrate maintenance of forest NBI with TEI as “policy levers” to help meet societal needs, including climate stabilization and energy and water security, as well as avoid conflicts between the use of these infrastructures to meet these needs.
In this study, we focus on how the NBI and ecosystem services associated with forests in the Midwest and Northeast United States have evolved from 1980 to 2019. The forest NBI of both regions has been heavily impacted by humans for centuries, but the regions have different land-use histories (Lu et al., 2015). Beginning in the last half of the 1800s, farmers abandoned large areas of cropland to forests in the Northeast (Compton and Boone, 2000) and moved to take advantage of better soils in other regions, particularly the Midwest. As a result, most of the Northeast is currently covered with secondary forests, whereas most of the Midwest is covered by agriculture (Figure 1E). Interestingly, the two regions have similar areas of forests in 1980 (Table 1) even though the total area of the Midwest is about 2.5 times larger than the Northeast (Supplementary Table S1). Thus, forests cover about 59% of the land area in the Northeast and only 22% of the land area in the Midwest. In our analyses, we examine: 1) how forest NBI varies among states in the Midwest and Northeast at the beginning of the study period; 2) how forest NBIs and ecosystem services in the Midwest and Northeast United States have change from 1980 to 2019; 3) the relative roles of various environmental factors (Figure 1) in causing these changes; 4) how the changes in forest NBI influence the responses of ecosystem services to extreme climate events; and 5) how the representation of forest NBI affects estimates of ecosystem services provided to human society by forests.
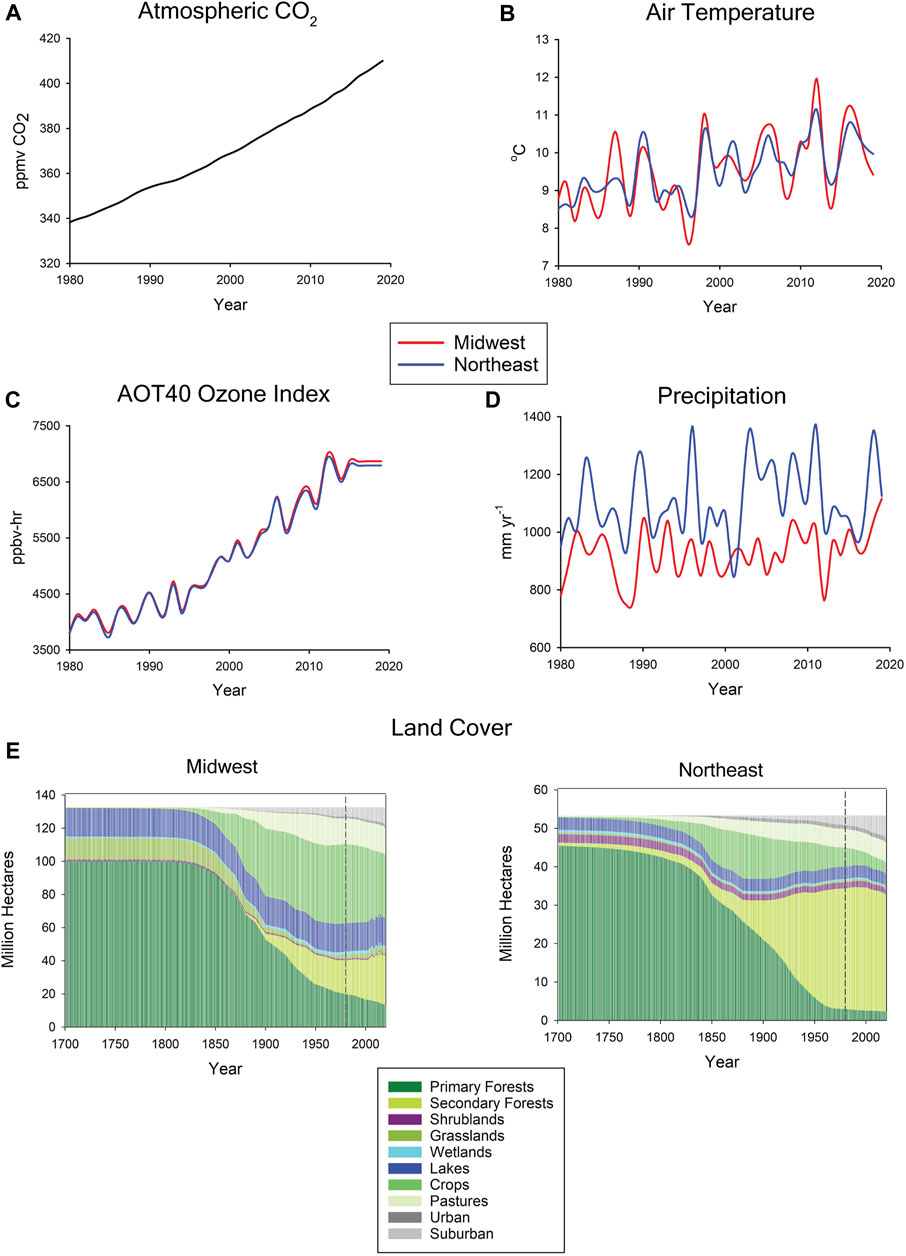
FIGURE 1. Temporal variations in (A) atmospheric CO2 concentrations, (B) air temperature, (C) AOT40 ozone index, (D) precipitation, and (E) land cover for the Midwest and Northeast United States used as inputs to TEM. The entire C-FEWS region experience the same temporal variations in atmospheric CO2 concentrations (black line in A). Note the difference in scale of land cover area between the Midwest and Northeast regions. Vertical dashed line in (E) represents the 1980 beginning of the 40-year study period.
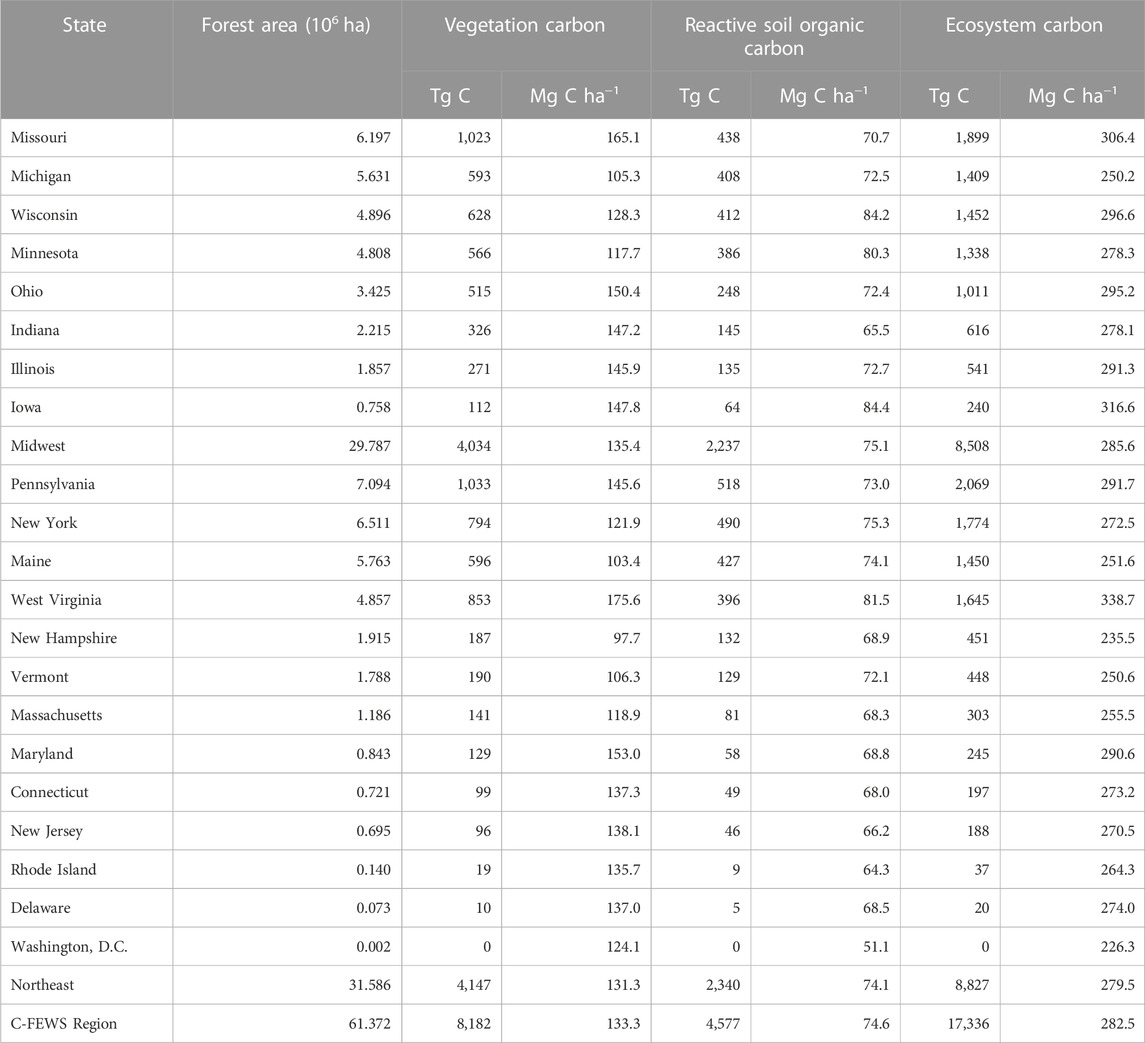
TABLE 1. Distribution of forested area and carbon stocks in the C-FEWS region during January1980 based on Baseline stand ages.
To create a more comprehensive approach for evaluating the costs and benefits of NBI and TEI to provide services to sustain food, energy, and water for human society and to identify potential conflicts between these infrastructures, we have developed the C-FEWS modeling framework [Vörösmarty et al., this issue (a)]. In this study, we use a modified version of the Terrestrial Ecosystem Model (TEM 4.4) within the C-FEWS modeling framework to quantify the ecosystem services provided by forest NBI in the Midwest and Northeast United States. Ecosystem services estimated by TEM 4.4 include net carbon sequestration as represented by net carbon exchange, biomass increment, the production of paper and lumber products, and water yield. In addition, we quantify the carbon emissions from land conversion or rotational timber harvest that might be managed with carbon capture and storage to further mitigate climate change. All monthly carbon and water fluxes and pools are estimated at a spatial resolution of 0.1° latitude by 0.1° longitude for the 14,648 grid cells that comprise the Midwest and the 6,120 grid cells that comprise the Northeast. The gridded estimates are then aggregated to state and regional levels for analyses to provide inputs to the economic valuation model of the C-FEWS framework, which requires input data at this scale. Aggregation can also reveal macro-level FEWS responses to climate and other forcings, which can be obscured by a focus on the individual grid cell basis. In fact, our analysis can provide both perspectives. The Midwest United States covers Illinois, Indiana, Iowa, Michigan, Minnesota, Missouri, Ohio, and Wisconsin. The Northeast United States covers Connecticut, Delaware, Maine, Maryland, Massachusetts, New Hampshire, New Jersey, New York, Pennsylvania, Rhode Island, Vermont, Washington D. C., and West Virginia. The combined regions of the Midwest and Northeast United States are referred as the C-FEWS region as currently defined in the C-FEWS framework.
Below, we briefly describe modifications to TEM 4.4 and how the modified TEM 4.4 estimates the output variables used in this study; the gridded input data sets used to drive TEM 4.4 including the development of the land cohort time-series data set used to represent land-use history; the simulation protocol used by the model to determine the simulated initial conditions for January of 1980 and the monthly estimates for the study period from 1980 to 2019; and four sets of simulation experiments. The first set of simulation experiments is used to assess the relative importance of land-use change, CO2 fertilization, ozone pollution, and climate on net carbon exchange, biomass increment, and water yield. The second set is used to assess the effects of extreme climate events on annual net carbon exchange, biomass increment, and water yield over the study period. The third set is used to assess how an increased frequency of heat waves may have affected net carbon exchange, biomass increment and water yield during the decade of the 2010s. The fourth set is used to assess how the representation of forest NBI affects carbon sequestration, biomass increment and ecosystem carbon storage.
The TEM 4.4 is a process-based biogeochemistry model that uses spatially referenced information on atmospheric chemistry, climate, elevation, soil texture, and land cover to estimate monthly fluxes and pool sizes of carbon, nitrogen, and water among vegetation, soils, and the atmosphere. The model is well documented and has been used to examine patterns of land carbon dynamics across the globe including how they are influenced by multiple environmental factors such as CO2 fertilization, ozone pollution, climate change and variability, and land-use change (Felzer et al., 2004; Felzer et al., 2005; Reilly et al., 2007; Sokolov et al., 2008; Melillo et al., 2009; Galford et al., 2010; Galford et al., 2011; Reilly et al., 2012; Kicklighter et al., 2014; Melillo et al., 2016; Sokolov et al., 2018).
This version of TEM has been modified to account for how urban and suburban areas affect regional carbon, nitrogen, and water dynamics. Urban and suburban areas are represented as time-varying mosaics of impervious surfaces, lawns, and trees (Supplementary Material S1). Similar to Lu et al. (2013), lawns and urban/suburban trees are allowed to gain and lose carbon, but no such fluxes are assumed to occur in areas covered by impervious surfaces. Urban areas contain more impervious surfaces per unit area than suburban areas because of their higher population density. In contrast, suburban areas contain more open spaces covered by grasses and trees than urban areas. The relative proportion of these subcomponents of the urban and suburban mosaics vary spatially as prescribed by land cover data sets as described in Supplementary Material S1.
Below, brief descriptions are provided on how the modified TEM 4.4 estimates land carbon sequestration; biomass increment; carbon emissions from land conversion or rotational forestry; the production and fate of paper products, and construction materials; and water yield.
In this study, TEM 4.4 estimates forest carbon sequestration (∆ForC) as follows:
The amount of carbon sequestered or lost from the vegetation over a specified time period (∆VegC) is defined as biomass increment. Similarly, the amount of carbon sequestered or lost from soil organic matter over a specified time period (∆SOC) is soil organic matter increment or SOM increment. The amount of carbon sequestered in the forest vegetation and soil organic matter can be estimated from the net balance of the TEM-simulated carbon fluxes into and out of each of these pools for a specified time period:
where NPP is net primary production (g C m−2 mo−1), EC is the carbon emissions associated with rotational timber harvests or the conversion of natural land to agricultural or urban/suburban land and includes emissions from burning slash and fuelwood (i.e., burned biomass, g C m−2 mo−1), LtrfalC is litterfall carbon (g C m−2 mo−1); SlashC is the amount of carbon in slash transferred to soil organic matter during rotational timber harvests or the conversion of natural land to agricultural land or urban/suburban land (g C m−2 mo−1); WoodProdC is the amount of carbon in wood transferred during rotational timber harvests or the conversion of natural land to agricultural land or suburban/urban areas to paper products and construction materials (g C m−2 mo−1); and RH is heterotrophic respiration (g C m−2 mo−1) associated with decomposition.
Vegetation biomass availability depends on standing stocks of vegetation. Biomass increment (∆VegC) indicates year-to-year changes in vegetation biomass. New biomass is determined as the accumulated amount of annual biomass increments that occur since January of 1980 (e.g., January 1980 through December 2019).
In addition to carbon sequestration in forest ecosystems, TEM 4.4 keeps track of the fate of the wood products derived from the timber harvested from forest ecosystems. Wood products are stratified into annual cohorts of paper products and construction materials. All wood products are assumed to remain in the grid cell where the timber was harvested for these products. Carbon in these wood-product cohorts is assumed to be released back to the atmosphere at a linear rate based on the amount of carbon created for that cohort (McGuire et al., 2001). Thus, carbon stocks of these cohorts are diminished implicitly from both decomposition and burning of wood products. The monthly change in carbon stored in wood products (∆WoodProdC, g C m−2 mo−1) is estimated as follows:
where PaperProdC is the TEM-simulated transfer of carbon in wood to paper products from timber harvest (g C m−2 mo−1); LumberProdC is the TEM-simulated transfer of carbon in wood to construction materials from timber harvest (g C m−2 mo−1); PaperDecayC is the TEM-simulated carbon emission to the atmosphere associated with the decomposition and burning of paper products (g C m−2 mo−1); and LumberDecayC is the TEM-simulated carbon emission to the atmosphere associated with the decomposition and burning of construction materials (g C m−2 mo−1).
When timber harvests occur either from rotational forestry or the conversion of forested land to agricultural or urban/suburban lands, prescribed proportions of the harvested tree biomass are allocated (McGuire et al., 2001) as follows: 1) 33% of tree biomass is left as slash (SlashC) that enters the soil organic carbon pool; 2) 40% of tree biomass is emitted to the atmosphere as carbon from burned slash or fuelwood (EC); 3) 20% of tree biomass is removed to create paper products (PaperProdC); and 4) 7% of tree biomass is removed to create construction materials (LumberProdC). The amount of forest carbon lost to EC and the various carbon pools depends on the amount of carbon in tree biomass at the time of the timber harvest.
SlashC is assumed to enter the soil organic carbon pool and decomposes over time at the rate of soil organic matter decomposition (RH), which is influenced by the local climate conditions. As some slash and fuelwood require time to dry out before burning properly, SlashC and EC are assumed to be linearly transferred each month for a year. Although EC is an aggregated flux of carbon from both burned slash and fuelwood, it represents a quantity of carbon that could be redirected toward the production of biofuels (Lippke et al., 2011). SlashC might also be considered as a resource for biofuel production, but most of this slash is underground as roots, which would be more difficult to exploit than the aboveground portions of slash, which are mostly assumed to be part of EC.
Paper products are assumed to have a lifetime of 10 years. In TEM, carbon in paper products is assumed to be linearly released to the atmosphere monthly from decomposition and burning over the 10-year period as PaperDecayC. Similarly, construction materials are assumed to have a lifetime of 100 years with carbon linearly released to the atmosphere monthly from decomposition and burning over the 100-year period as LumberDecayC. The relatively long decomposition times of paper products and construction materials contribute to the legacy effects of land-use change on carbon source/sink dynamics in addition to the effects of regrowing forests.
Net carbon exchange of forest ecosystems and their wood products with the atmosphere (NCE) is determined as follows:
All of the carbon fluxes (g C m−2 mo−1) in Sections 2.1.1, 2.1.2 have been described in detail in previous publications (Raich et al., 1991; McGuire et al., 1992; McGuire et al., 1997; Tian et al., 1999; McGuire et al., 2001; Tian et al., 2003; Felzer et al., 2004; Sokolov et al., 2008).
Humans depend on both surface water and groundwater to support their water resource systems. In this study, we examine how historical changes in forests influence the availability of surface waters as affected by runoff. Runoff is the result of precipitation inputs, losses of water back to the atmosphere from evapotranspiration, and any changes in water stored on land.
Evapotranspiration depends on the atmospheric demand for water and the supply of soil water available to satisfy that demand. In TEM 4.4, the monthly atmospheric demand for water is represented as monthly potential evapotranspiration (PET), which is estimated as a function of mean monthly air temperature and mean monthly solar radiation (Jensen and Haise, 1963). The supply of soil water available to satisfy the atmospheric demand depends on rainfall, snowmelt recharge, and changes in soil moisture. Monthly evapotranspiration is assumed to be equal to PET during wet months and is estimated as a function of available soil water during dry months (Vörösmarty et al., 1989).
Monthly runoff is estimated as water yield (mm mo−1) based on algorithms of the Water Balance Model (WBM) by Vörösmarty et al. (1989). To determine the potential available water supply for humans, we aggregate TEM water yield estimates across area and time to estimate runoff in units of billion cubic meters.
To develop gridded estimates across the C-FEWS region, TEM 4.4 uses gridded data sets of elevation and soil texture, and gridded time-series data sets of monthly solar radiation, air temperature, precipitation, an index of accumulated hourly ozone over a threshold of 40 ppbv (AOT40), and annual land cover from 1699 to 2019. The input data before 1980 is used by TEM 4.4 to determine the initial forest NBI conditions at the beginning of the study period (1980–2019). All gridded TEM estimates and input data are organized at a spatial resolution of 0.1° latitude × 0.1° longitude. This spatial resolution has been chosen based on the spatial detail available in the source data used to develop the input data sets and the computational resources required by the various models of the C-FEWS framework to conduct simulations. In addition, TEM uses a time series of annual mean global atmospheric carbon dioxide concentrations. Below, we describe the development of the gridded time-series input data.
Gridded elevation data (meters) for the globe are based on Lehner et al. (2008), which has a spatial resolution of 30 arc-seconds (0.0083°). Nearest neighbor remapping is used to aggregate the data to the 0.1° resolution based on the Earth System Modeling Framework (Hill et al., 2004).
Gridded soil texture data (fraction sand, fraction silt, fraction clay) for the globe are based on Shangguan et al. (2014). The original data is at a spatial resolution of 30-arc-seconds (0.0083°). Nearest neighbor remapping is used to aggregate the data to the 0.1° resolution based on the Earth System Modeling Framework (Hill et al., 2004).
Gridded time series data for monthly air temperature (°C), precipitation (mm mo−1) and net solar radiation (W m−2) are based on North American Land Data Assimilation System (NLDAS-2) climate data (Xia et al., 2012). The NLDAS-2 data are originally available at the 0.125° spatial resolution and covers North America from 1 January 1979 to present. The NLDAS-2 data is re-gridded to the 0.1° resolution using the Earth System Modeling Framework (Hill et al., 2004). The air temperature (K) and downward solar radiation (W m−2) are bilinear interpolated to the 0.1° spatial resolution and then aggregated to the monthly resolution by determining monthly means. The units for air temperature are converted from Kelvin to degrees Celsius by subtracting 273.15 from the NLDAS-2 air temperature data. The first-order conservative method is used for regridding precipitation (mm hr−1) to the 0.1° spatial resolution, and then summed to obtain units of mm mo−1 for input into TEM.
Climate data from the Climate Research Unit of the University of East Anglia (CRU 4.04, Harris et al., 2020) is used to backcast the NLDAS-2 data back from year 1980 to year 1699. First, the CRU data for air temperature, precipitation, and cloudiness between 1901 and 2019 is extended back to year 1700 based on repeating a detrended climate from 1901 to 1930. This data has a spatial resolution of 0.5°. Second, the CRU climate data for 1699 is determined as the mean monthly climate data of the 30-year detrended data. Third, the twenty five 0.1° resolution within each 0.5° grid cell is assigned the same monthly value as the 0.5° grid cell for the extended CRU climate data from 1699 to 2019. Fourth, a net incoming solar radiation data set is estimated from the 0.1° CRU cloudiness data (Pan et al., 1996). Fifth, the mean monthly values for both the CRU-derived 0.1° data and the NLDAS-2 0.1° data are determined for the years 1980–2019. Sixth, monthly anomalies from the mean monthly CRU data are determined for years 1699–1979 as differences for air temperature and as ratios for net incoming solar radiation and precipitation. The resulting monthly air temperature anomalies are added to the mean monthly NLDAS-2 data to extend the NLDAS-2 data back to 1699. The resulting monthly precipitation anomalies are multiplied by the respective mean monthly NLDAS-2 data to extend the NLDAS-2 data back to 1699.
Gridded time series data for monthly AOT40 (ppbv-hr) to 1699 to 2019 across the globe are based on ozone estimates from simulations by the Massachusetts Institute of Technology (MIT) Integrated Global System Model linked to the National Center for Atmospheric Research (NCAR) Community Atmospheric Model (IGSM-CAM, Monier et al., 2013). The original data is at a spatial resolution of 0.5°. For this study, the twenty-five 0.1° resolution grid cells within each 0.5° grid cell is assigned the same monthly value as the 0.5° grid cell.
In addition, TEM uses a time series of annual mean global atmospheric carbon dioxide concentrations (ppmv) based on Meinshausen et al. (2011) from 1860 to 2005 and Dlugokencky and Tans (2021) for years 2006–2019. Carbon dioxide concentrations before 1860 are assumed to be the same as during 1860.
Land cover is represented as a gridded time-series data set of land-cover cohorts at the 0.1° spatial resolution from 1699 to 2019. A disturbance cohort approach (Reilly et al., 2012; Lu et al., 2013) is used to track the effects of land-use change on terrestrial carbon, nitrogen, and water stocks and fluxes from 1700 to 2019. Before 1700, the C-FEWS region is assumed to have been covered by minimally disturbed natural vegetation or potential vegetation. Starting from the potential vegetation map, which represents the land cover distribution assumed for the year 1699, land-cover cohorts within each 0.1° grid cell are created or modified (divided) from 1700 to 2019 according to the timing of land conversions or timber harvests. These land-use changes are determined from net changes in annual land cover distributions, which in turn, are developed by using a rule-based priority approach (Meiyappan and Jain, 2012) to combine information from Ramankutty and Foley (1999), Lu et al. (2013), Hurtt et al. (2020), the National Land Cover Database (NLCD, Homer et al., 2020), MODIS (Friedl et al., 2002), and the Cropland Data Layer (NASS, 2022) as described in Supplementary Material S2. The resulting cohort data describes land-use changes among primary vegetation (i.e., undisturbed natural vegetation), secondary vegetation (i.e., human-disturbed natural vegetation), and intensively managed lands (i.e., croplands, pastures, urban and suburban areas). These changes include the conversion of natural lands to intensively managed lands, the abandonment of intensively managed lands to natural lands, and changes in management (e.g., croplands to suburban areas). With disturbance, the age of a new cohort (e.g., a forest stand) is initially set to zero but then increases annually until the next disturbance, when its age is reset to zero. For secondary forests, a rotational timber harvest is assumed to occur every 160 years if no other disturbance is estimated to occur to that cohort within that time frame. This rotation age is consistent with the average life-span of 130–200 years for forests in this region (Pan et al., 2011). In the cohort data set, the original potential vegetation of each cohort is also tracked through time.
To develop regional estimates during a TEM simulation, carbon, nitrogen, and water dynamics are first initialized to equilibrium conditions based on the initial potential natural vegetation cohorts in a grid cell using the input data for year 1699. Then, after a disturbance associated with creating the land use distribution in 1700 is introduced, a spin-up period of 150 years occurs to allow the carbon, nitrogen, and water dynamics of the newly created cohorts to come back into a dynamic equilibrium with a simulated environment that includes variable climate conditions, but constant atmospheric chemistry and no additional disturbances. After the spin-up period, transient carbon, nitrogen, and water dynamics are simulated for a growing number of cohorts from year 1701–2019, as prescribed by the cohort data sets, under a simulated environment that includes variable climate and atmospheric chemistry conditions. Details of this simulation protocol are given in the Supplementary Material S3.
A series of TEM simulations is conducted to evaluate the relative importance of various environmental and management factors on forest NBI and ecosystem services. These simulations include: 1) a baseline simulation where all environmental conditions, except elevation and soil texture, are allowed to change over time (Baseline); 2) a simulation similar to the Baseline simulation, but no land cover changes occur after 1980 (Const LULC); 3) a simulation similar to the Baseline simulation, but atmospheric carbon dioxide concentrations remain at the 1980 level after 1980 (Const CO2); and 4) a simulation similar to the Baseline simulation, but the monthly AOT40 index values remain at the 1980 levels after 1980 (Const AOT40).
The effects of various environmental factors on ecosystem services are determined from the results of the above TEM simulations as follows. The land-use change effects are determined by subtracting the results of the Const LULC simulation from the corresponding results of the Baseline simulation. The CO2 fertilization effects are determined by subtracting the results of the Const CO2 simulation from the corresponding results of the Baseline simulation. The ozone pollution effects are determined by subtracting the results of the Const AOT40 simulation from the corresponding results of the Baseline simulation. Finally, climate effects are determined by summing the corresponding land-use change effects, the CO2 fertilization effects, and the ozone pollution effects and then subtracting this sum from the corresponding results of the Baseline simulation.
To examine how the impacts of extreme climate events on forest NBI and ecosystem services may have changed over the 40-year study period, 3 years containing an extreme climate event have been chosen: 1 year towards the beginning of the study period, 1 year in the middle of the study period, and 1 year towards the end of the study period. Each calendar “year” is analyzed as a 5-year event consisting of the target year plus the prior 2 years and the following 2 years, as detailed below. Four types of extreme climate events are considered: heat waves, cold waves, drought, and extreme precipitation events, which may differ in timing between the Midwest and Northeast United States. For heat waves, 1988, 2003, and 2012 have been chosen for the extreme years in the Midwest and 1988, 2002, and 2016 for the extreme years in the Northeast based on the area-weighted number of 3-day events between April and September where the maximum air temperature is greater than the 95th percentile and the heat index is greater than 35°C [Vörösmarty et al., this issue (a)]. For cold waves, 1983, 1995, and 2015 have been chosen for the extreme years in the Midwest and 1990, 1997, and 2016 for extreme years in the Northeast based on the area-weighted number of 3-day events where the air temperature is less than or equal to −6.7°C [Vörösmarty et al., this issue (a)]. For extreme precipitation events, 1982, 2002, and 2015 have been chosen for the extreme years in the Midwest and 1983, 1996, and 2009 for the extreme years in the Northeast based on the area-weighted number of days when precipitation exceeds 5 cm day−1 [Vörösmarty et al., this issue (a)]. For droughts, 1988, 2000, and 2011 have been chosen for the extreme years in the Midwest and 1989, 1999, and 2017 for the extreme years in the Northeast based on a newly developed Drought Intensity Score [Vörösmarty et al., this issue (a)], which is defined by the area-weighted 3-month Standard Precipitation Index (SPI-3). The SPI-3 is the number of standard deviations by which the observed anomaly deviates from the long-term mean over a 3-month duration (Guttman, 1999; World Meteorological Organization, 2012). A DIS score greater than 4 indicates a severe drought whereas a DIS score less than 2 indicates a very mild drought or no drought at all [Vörösmarty et al., this issue (a)].
To evaluate the impact of each extreme climate event on an ecosystem service (XClmeff), the value of an ecosystem service during a year containing an extreme event (Ycd) is compared to the mean of the ecosystem service value for the “non-extreme” year that is 2 years before the extreme climate event ([Yb2]) plus the ecosystem service value for the “non-extreme” year that is 2 years after the extreme climate event ([Ya2]):
XClmeff estimates are then compared among the three time periods to look for temporal trends in extreme climate effects. Trends in extreme climate effects are considered for the following ecosystem services estimated by TEM 4.4: net carbon exchange, biomass increment, and water yield.
Heat wave frequency appears to be increasing and may continue to increase in the future (USGCRP, 2017). To explore how an increasing frequency of extreme heat waves might affect forest NBI and associated ecosystem services of the Midwest and Northeast United States in the future, we have developed the following simulation experiment. First, new air temperature, precipitation, and solar radiation data sets have been developed to represent a climate with increased heat wave frequency during the decade of the 2010s by replacing the Baseline climate conditions for this decade with the climate conditions of 2012–2014 for the Midwest and the climate conditions of 2016–2018 repeated three times [Vörösmarty et al., this issue (a)]. Then, the new climate data containing the three heat wave events in each region (Figure 2) are used to drive TEM 4.4.
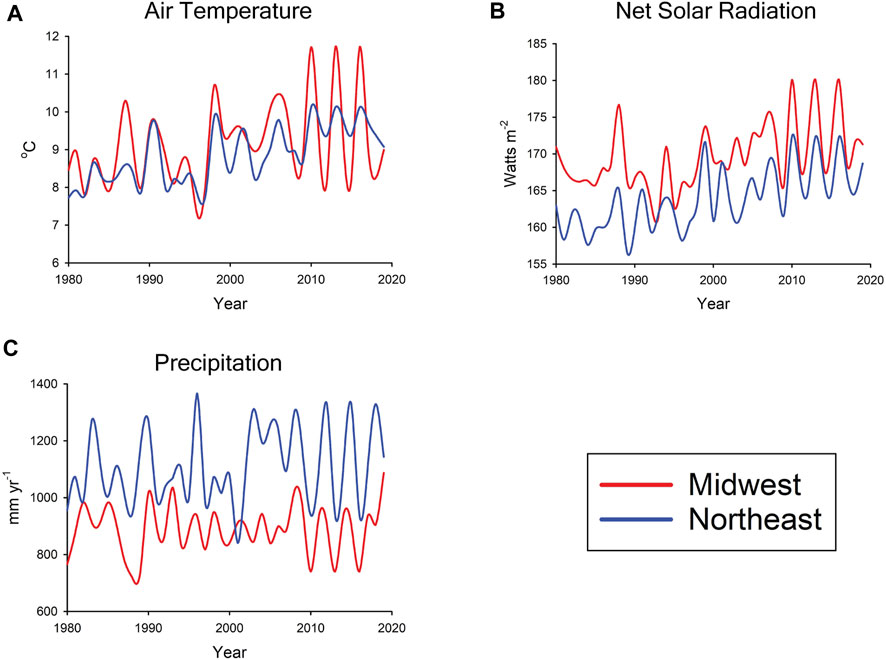
FIGURE 2. Temporal variations in annual (A) air temperature, (B) net solar radiation, and (C) precipitation for the Midwest and Northeast United States used as inputs to TEM to explore the effects of increased frequency of heat waves on forest infrastructure and associated ecosystem services.
To evaluate the potential impact of an increased heat wave frequency on an ecosystem service (Heateff) in the future, the mean value of an ecosystem service during the decade of the 2010s estimated from the Baseline simulation (Baseline2010s) is subtracted from the mean value of the ecosystem service during the decade of the 2010s estimated from the simulation using the climate with the three extreme heat wave events (Heat2010s):
The effects of increased heat wave frequency on the following ecosystem services estimated by TEM 4.4 are considered in this analysis: net carbon exchange, biomass increment, and water yield.
The representation of forest NBI has been shown to influence forest carbon sequestration and represents a mechanism by which past disturbances to forests may influence contemporary carbon dynamics (Lu et al., 2013; Lu et al., 2015). Forest NBI changes based on the time since the last disturbance to a forest ecosystem occurred (i.e., stand age) as trees regrow. When the stand age distributions of forests in our land cover data set for the year 2005 are compared state by state to the corresponding data developed by Lu et al. (2015) to match the high-resolution (1 km2) forest stand age distribution of Forest Inventory and Analysis (FIA) data (Pan et al., 2011), a large proportion of our forest cohorts in most states are found to be older than that indicated by the FIA data. Illinois and Iowa are the exceptions where our land cover data sets indicate younger forests in these states than the FIA data. The older forests stands may be a result of our approach of implementing a timber harvest whenever a secondary forest stand becomes 160-years old, which probably did not account for all the human and natural disturbances (e.g., fires) that occurred to that forest stand. To account for these potential additional disturbances, a new land cover data set has been developed by implementing additional timber harvests on secondary forest cohorts of different stand ages on a trial-and-error basis until the stand age distribution of state forests in the new data set approximately matches the corresponding distribution described by the Lu et al. (2015) FIA-corrected data.
The new FIA-corrected land cover data set is then used with other Baseline input data sets to drive TEM 4.4 to estimate vegetation carbon, reactive soil organic carbon, net carbon exchange, biomass increment, soil organic matter increment, wood products, and burned biomass. To assess how the representation of forest NBI influences ecosystem services, the FIA-corrected estimates are compared to the corresponding Baseline estimates.
At the beginning of the study period (January, 1980), TEM estimates that forests in the C-FEWS region contained 17.3 Pg C with about equal amounts of carbon stored in forests of the Northeast (8.8 Pg C) and the Midwest (8.5 Pg C). The carbon associated with the forests of the C-FEWS region is distributed mainly between vegetation and soils, with much smaller amounts contained in wood products derived from previous timber harvests. About one-half of the initial carbon stocks in these forests is in vegetation biomass (8.2 Pg C or 133.3 Mg C ha−1), with similar amounts stored in vegetation of the Northeast (4.15 Pg C or 131.3 Mg C ha−1) and the Midwest (4.03 Pg C or 135.4 Mg C ha−1). About a quarter of the initial carbon stocks is in reactive soil organic matter (4.6 Pg C or 74.6 Mg C ha−1), with similar amounts stored in the Northeast (2.34 Pg C or 74.1 Mg C ha−1) and the Midwest (2.24 Pg C or 75.1 Mg C ha−1). In addition to reactive soil organic matter, we assume there is about an equal amount of carbon stored as non-reactive soil organic matter that is distributed between the Midwest and Northeast similarly to the reactive soil organic carbon. This non-reactive soil organic carbon is assumed to be stable and does not contribute either to land carbon source/sink dynamics or to nutrient availability to affect vegetation growth. To determine total carbon stocks in the forest ecosystems, we sum the carbon stocks in vegetation, reactive soil organic matter, and non-reactive soil organic matter. Within each region, the larger states tend to contain more carbon in forests than the smaller states even though forests in smaller states may have a higher carbon density (Table 1). In addition to the total amount of carbon stored in the forest ecosystems, we keep track of the amount of carbon stored in paper products and construction materials offsite in the grid cell. The amount of carbon stored in paper products is 0.02 Pg C in 1980 and the amount stored in construction materials is 0.35 Pg C. The Midwest stored about three times the paper products and twice the lumber products as the Northeast.
Forests influence the carbon balance between land and the atmosphere (Figure 3) by changes in carbon stocks of vegetation and soil organic matter and the eventual fate of wood as fuel or wood products (i.e., paper, construction materials). During the 40-year study period (1980–2019), changes in environmental and management conditions (Figure 1) modified the distribution of carbon among forest components in the C-FEWS region. Overall, the forest ecosystems of the C-FEWS region gained 798 Tg C of “new” carbon by sequestering carbon dioxide from the atmosphere during the study period. The Northeastern forests gained a little bit more carbon (414 Tg C) than the Midwestern forests (384 Tg C). Although the vegetation in Midwestern forests gained more carbon (459 Tg C) than the Northeastern forests (312 Tg C), the Midwestern forests lost soil organic carbon (−75 Tg C) whereas the Northeastern forests gained soil organic carbon (102 Tg C) during this time.
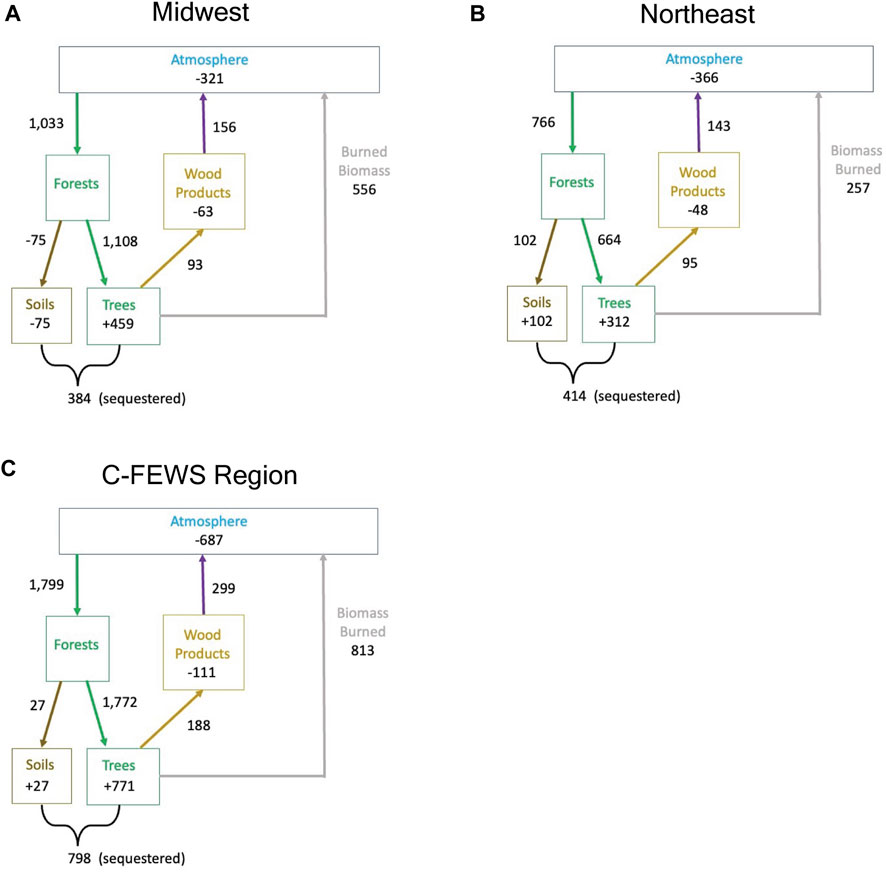
FIGURE 3. Cumulative net carbon fluxes and net changes in carbon storage (Tg C) among the atmosphere, forest vegetation, forest soils, and wood products for the 40-year study period (1980–2019) for (A) the Midwest United States, (B) the Northeast United States, and (C) the C-FEWS region.
In contrast to the carbon sequestered by forest ecosystems in the C-FEWS region, the amount of carbon stored in wood products from these forests declined by 111 Tg C over the 40-year study period with 63 Tg C lost from the Midwest and 48 Tg C lost from the Northeast (Figure 3). The decomposition of wood products represents legacy effects on contemporary land-atmosphere carbon balance from timber harvests that occurred up to 100 years ago. The decrease in the carbon stocks of these wood products suggests that the frequency and/or area of timber harvests have diminished over the last 100 years. As a result, TEM estimates of net carbon exchange indicate that forests of the C-FEWS region are responsible for sequestering 687 Tg C from the atmosphere over the 40-year study period with similar amounts of carbon sequestered in the Midwest (321 Tg C) and Northeastern forests (366 Tg C).
Based on data from the U. S. Energy Information Administration (USEIA, 2022), a total amount of 23,426 Tg C of energy-related fossil fuel emissions is estimated to be released from the C-FEWS region during the 40-year study period with 13,304 Tg C released from Mideastern states and 10,122 Tg C released from Northeastern states. When compared to energy-related fossil fuel emissions (Eff, USEIA, 2022), cumulative forest net carbon exchange of the C-FEWS region over the 40-year study period offsets only 3% of the corresponding cumulative fossil fuel emissions from the region. The corresponding fossil fuel offsets (NCE/Eff) provided by Northeastern forests (4%) are about twice as beneficial to climate mitigation as the offsets provided by Midwestern forests (2%).
Conversion fluxes associated with biomass burning (EC) also influence the carbon balance between land and the atmosphere. Unlike the decomposition of wood products, conversion fluxes from timber harvests immediately release carbon to the atmosphere. Overall, conversion fluxes have caused the loss of 813 Tg C from the C-FEWS region with fluxes from forests of the Midwest twice as large as the corresponding fluxes in the Northeast (Figure 3).
In addition to ecosystem services associated with carbon dynamics, runoff from forests of the C-FEWS region have also provided 4,651 billion m3 of water for potential use by humans during the 40-year study period. The wetter condition of the Northeast (Figure 1) allows these forests to provide more water for potential human use (3,279 billion m3) than Midwestern forests (1,372 billion m3) over this time period.
By affecting forest NBI, environmental and management factors can influence its associated ecosystem services. Below, we focus on the effects of changes in environmental and management factors on three ecosystem services: net carbon exchange which affects efforts to mitigate climate; biomass increment which affects the availability of biomass for fuel and wood products; and runoff which affects available water supplies for potential human use. Environmental and management factors have had both positive and negative effects on forest NBI and ecosystem services (Table 2). Overall, climate and CO2 fertilization enhanced forest NBI by increasing net carbon exchange and biomass increment in both Midwestern and the Northeastern forests, while land-use change and ozone pollution diminished forest NBI by reducing net carbon exchange and biomass increment in both regions.
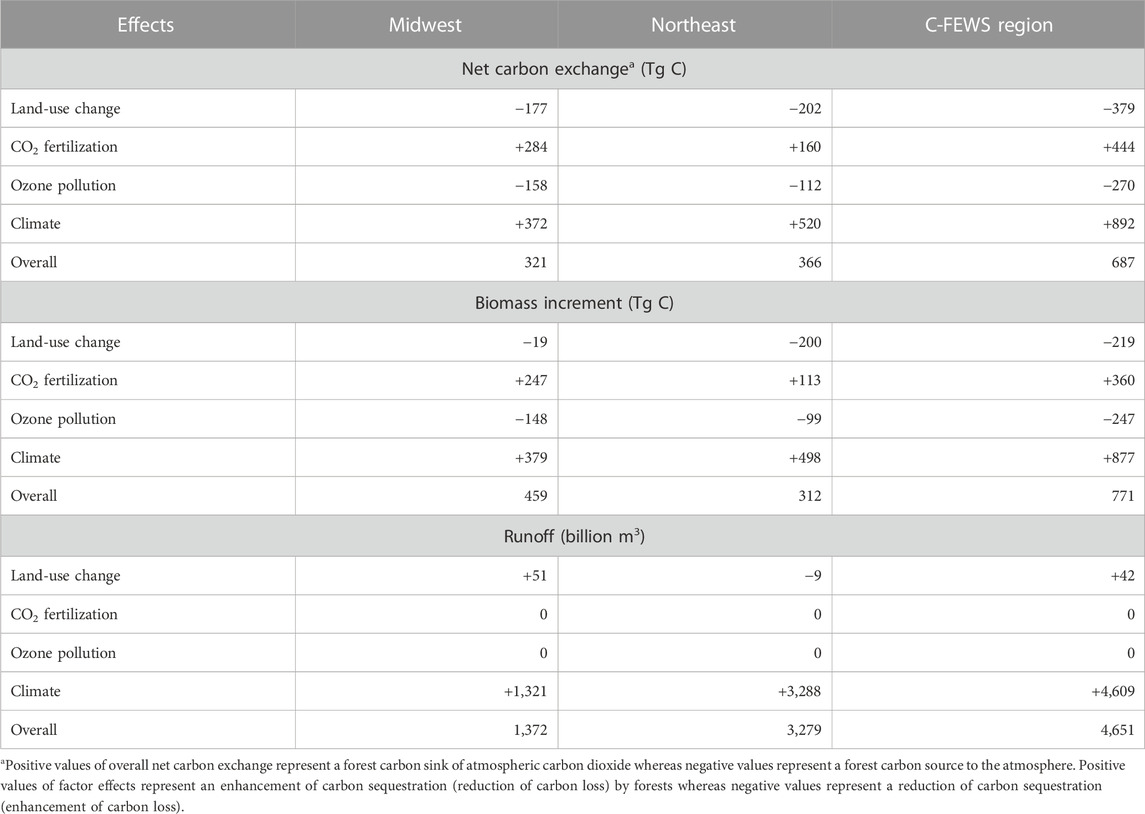
TABLE 2. Cumulative effects of environmental and management factors on forest ecosystem services over the study period (1980–2019).
The relative role of these environmental and management factors on ecosystem services varies between the Midwest and Northeast and among states within these regions. For net carbon exchange and biomass increment, climate and land-use change effects are relatively more important in Northeastern forests than Midwestern forests, while CO2 fertilization and ozone pollution effects are relatively more important in Midwestern forests than Northeastern forests (Table 2). Larger impacts on net carbon exchange and biomass increment generally occur in states with larger forest areas (Figure 4). However, there are some notable exceptions. While land-use change generally decreased forest biomass increment in most states, this factor enhanced biomass increments in Illinois and Iowa. The enhanced biomass increments are the result of regrowing forests accumulating biomass on an increasing area of abandoned cropland in these states. Except for land-use change, the magnitude of the effects of various factors on soil organic matter increment (i.e., SOM increment) was less than biomass increment.
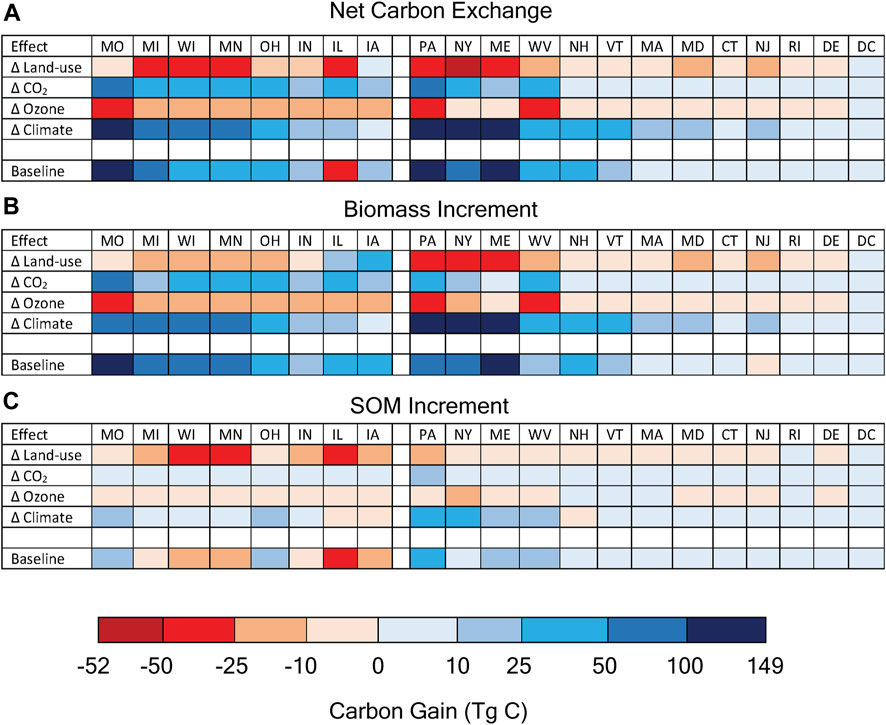
FIGURE 4. Relative effects of environmental and management factors on (A) net carbon exchange, (B) biomass increment, and (C) soil organic matter increment (SOM increment) of forests among states in the Midwest and Northeast United States during the 40-year study period. Factors include: 1) land-use change (∆ Land-use), 2) carbon dioxide fertilization (∆ CO2), 3) ozone pollution (∆ Ozone), and 4) climate variability and change (∆ Climate). Baseline represents overall effects of all environmental and management factors on forest carbon gains and losses. Positive values of Baseline net carbon exchange represent a forest carbon sink of atmospheric carbon dioxide whereas negative values represent a forest carbon source to the atmosphere. Positive values of factor effects represent an enhancement of carbon sequestration (reduction of carbon loss) by forests whereas negative values represent a reduction of carbon sequestration (enhancement of carbon loss). Midwestern states are Illinois (IL), Indiana (IN), Iowa (IA), Michigan (MI), Minnesota (MN), Missouri (MO), Ohio (OH), and Wisconsin (WI). Northeastern states are Connecticut (CT), Delaware (DE), Maine (ME), Maryland (MD), Massachusetts (MA), New Hampshire (NH), New Jersey (NJ), New York (NY), Pennsylvania (PA), Rhode Island (RI), Vermont (VT), Washington DC (DC), and West Virginia (WV). States with more forested areas in each subregion are positioned toward the left.
Runoff from forests is mostly determined by climate (Table 2) with land-use change causing minor, but compensating effects between the cumulative runoff from Midwestern forests (+51 billion m3) and Northeastern forests (−9 billion m3) over the 40-year study period. The land-use change effects are related to changes in forest area that occurred during the study period. Forest area increased in the Midwest by 8% and decreased in the Northeast by 4%. Similar to the ecosystem services related to carbon dynamics, states with larger areas of forests provide more runoff than states with less forest areas.
In addition to spatial variations, the relative importance of environmental and management factors on annual net carbon exchange, biomass increment and SOM increment varies over time with some similarities and some differences in temporal trends between forests of the Midwest and the Northeast United States (Figure 5). For annual biomass increment, the detrimental effects of ozone pollution and the beneficial effects of CO2 fertilization grow stronger in both Midwestern and Northeastern forests over the 40-year study period. Land-use change also initially diminishes biomass increment in both Midwestern and Northeastern forests, but after the year 2000, land-use change enhances biomass increment in the Midwest while continuing to diminish biomass increment in the Northeast. Land-use change effects on SOM increment also grow stronger over time in Midwestern forests but have almost no effects on SOM increment in Northeastern forests.
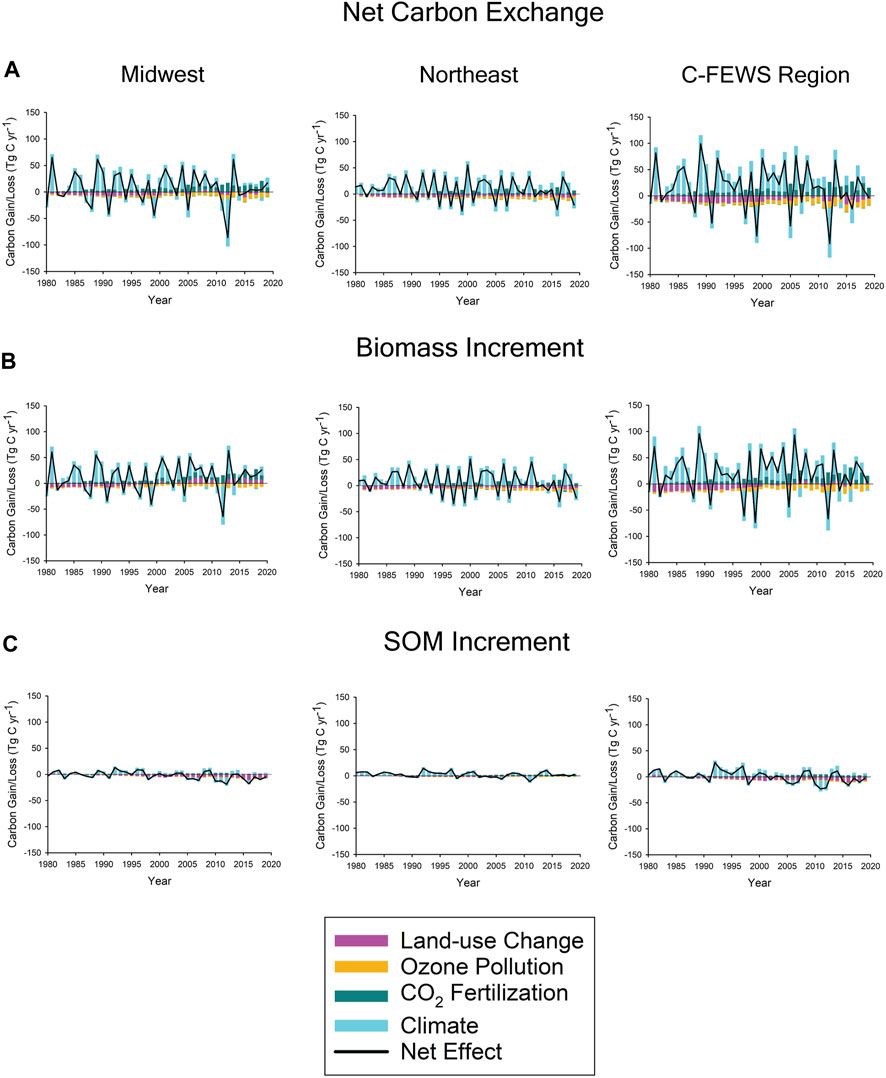
FIGURE 5. Comparison of the effects of environmental and management factors (land-use change, CO2 fertilization, ozone pollution, and climate) on (A) net carbon exchange, (B) biomass increment, and (C) soil organic matter increment (SOM increment) of forests over the 40-year study period among the Midwest, Northeast, and C-FEWS region. Solid black line represents the overall net effects of these factors as estimated in the Baseline simulation.
In both the Midwest and the Northeast, climate variability appears to have the dominant effects on both biomass increment and SOM increment. The climate-induced variability in biomass increments masks any subtle trends imposed by the other factors on biomass increment in the Midwestern and both biomass increment and SOM increment in Northeastern forests. A decreasing trend caused by land-use change is only discernable for SOM increment of Midwestern forests. The relative importance of environmental and management factor effects on net carbon exchange basically mimics those for biomass increment except for land-use change effects in the Midwest where enhanced annual biomass increments after year 2000 are compensated or overwhelmed by diminished annual SOM increments. Thus, there is no discernable trend in net carbon exchange over the 40-year study period and net carbon exchange appears instead to be much more sensitive to climate variability. Relatively large increases in net carbon exchange, biomass increment, and SOM increment occur during favorable climate conditions and large decreases of these variables occur with unfavorable conditions. Thus, carbon sequestration or loss from these forest ecosystems appear to be more sensitive to the frequency of “good” weather conditions versus “bad” weather conditions rather than any general trends.
The changes in biomass increment over the 40-year study period have allowed the gradual accumulation of 459 Tg C of new biomass in Midwestern forests and 312 Tg C of new biomass in Northeastern forests since 1980 (Figure 6). The biomass of Northeastern forests appears to have stabilized after year 2010 whereas Midwestern forests continue to accumulate biomass over this decade. Thus, the Northeastern forests appear to be at a dynamic equilibrium with the effects of climate variability and other environmental and management factors (including legacy effects from previous land-use change) on carbon dynamics whereas the Midwestern forests appear to be in disequilibrium and may continue to increase carbon sequestration in vegetation in the future. The new biomass represents increases in vegetation biomass availability that quantifies the potential trade-offs for the use of this new resource among fuel, wood products, and climate mitigation in the future. The amount of biomass removed each year for biomass burning and wood products appears to be a small proportion of this new resource (Figure 6). However, when these carbon losses are aggregated over the 40-year study period, as biomass increment has been to determine “new biomass,” these losses are greater than the amount of new biomass (Figure 3).
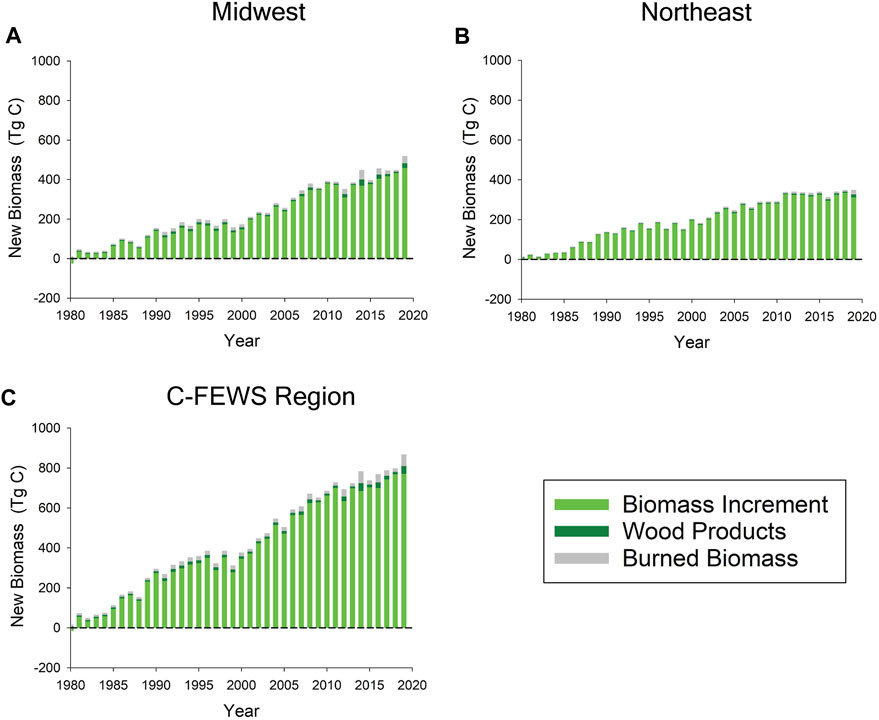
FIGURE 6. Comparison of the availability of new biomass (i.e., above the standing vegetation carbon stocks in 1980) for potential human use over the 40-year study period among (A) the Midwest United States, (B) the Northeast United States, and (C) the C-FEWS region. New biomass is determined by the accumulation of biomass increment after 1980. Burned biomass and wood products represent the additional biomass that has been created by forests in a particular year that would have enhanced vegetation standing stocks if it had not removed that year for these human uses. The burned biomass and wood products are derived from timber harvests associated with both rotational forestry and the conversion of forest land to agriculture or urban/suburban areas.
During the 40-year study period, the amount of biomass removed by timber harvests (Figure 6), either from rotational forestry or land conversions, for biomass burning and wood products has increased over time with larger contributions from Midwestern forests than Northeastern forests. While a relatively steady amount of biomass has been derived from forests by rotational forestry (Figure 7), an increasing amount of biomass is derived from land conversions of forests to croplands, pastures, suburban and urban areas, particularly in the Midwest during the 1990s and 2010s. As the area of croplands has decreased and the area of suburban areas and forest areas increased during the study period (Figure 1E), it appears that at least some of the land conversion to cropland is a result of displacement of croplands by expanding suburban areas.
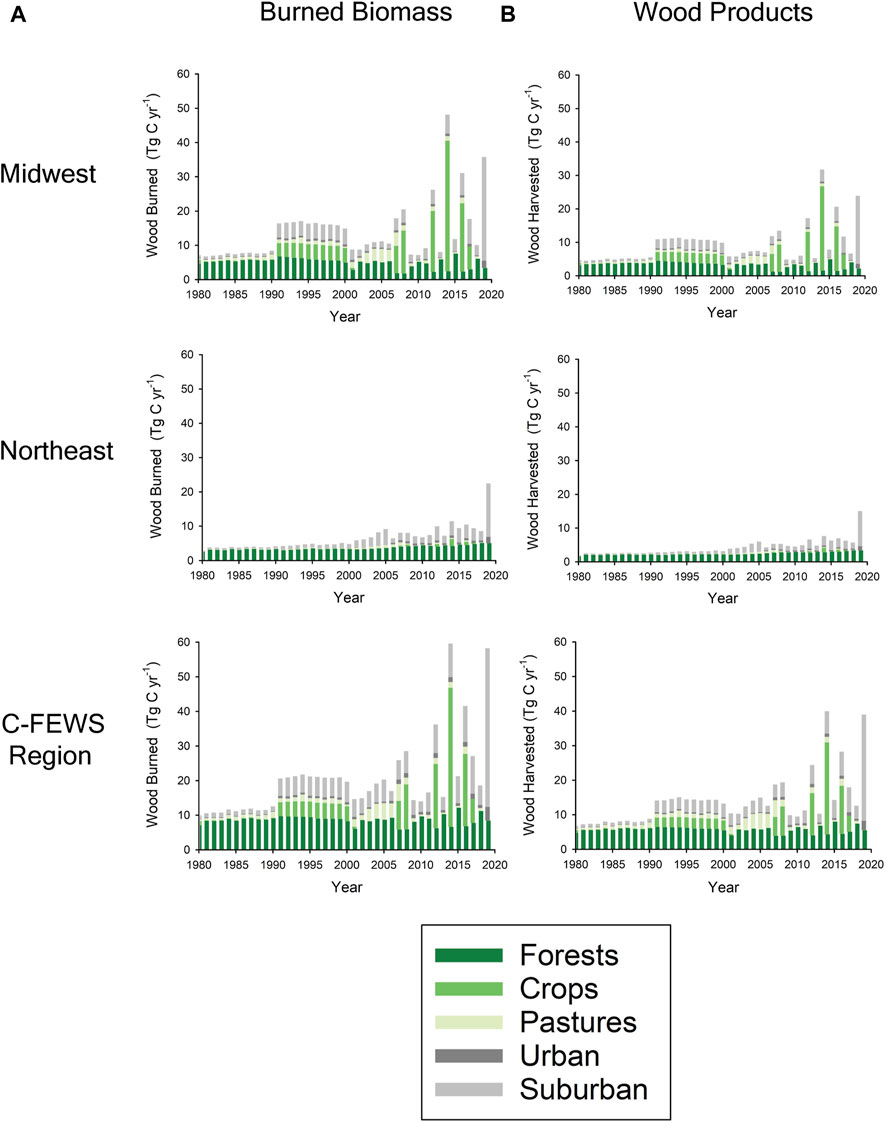
FIGURE 7. Comparison of the trends in annual (A) burned biomass and (B) removal of biomass for wood products among the Midwest, Northeast, and C-FEWS region between 1980 and 2019 as a result of timber harvest from both rotational forestry and the conversion of forests to agriculture and urban/suburban areas.
The spatial and temporal variability in net carbon exchange and fossil fuel emissions (USEIA, 2022) is reflected in the ability of forest carbon sequestration to offset fossil fuel emissions at the state level (Figure 8A). Cumulative net carbon exchange of state forests over the 40-year study period provides the largest carbon offsets of the corresponding cumulative state fossil fuel emissions in Maine (53%), Vermont (35%), New Hampshire (17%), and Missouri (10%). In contrast, the cumulative 40-year net carbon exchange of Illinois forests supplements the state’s fossil fuel emissions by 0.4% rather than offset these emissions. The offsets of decadal state fossil fuel emissions provided by corresponding decadal net carbon exchange also varied over the study period with the notable reduced offsets or enhanced emissions associated with land conversions during the 1990s and 2010s in Missouri, Ohio, Indiana, and Illinois in the Midwest and Pennsylvania and West Virginia in the Northeast.
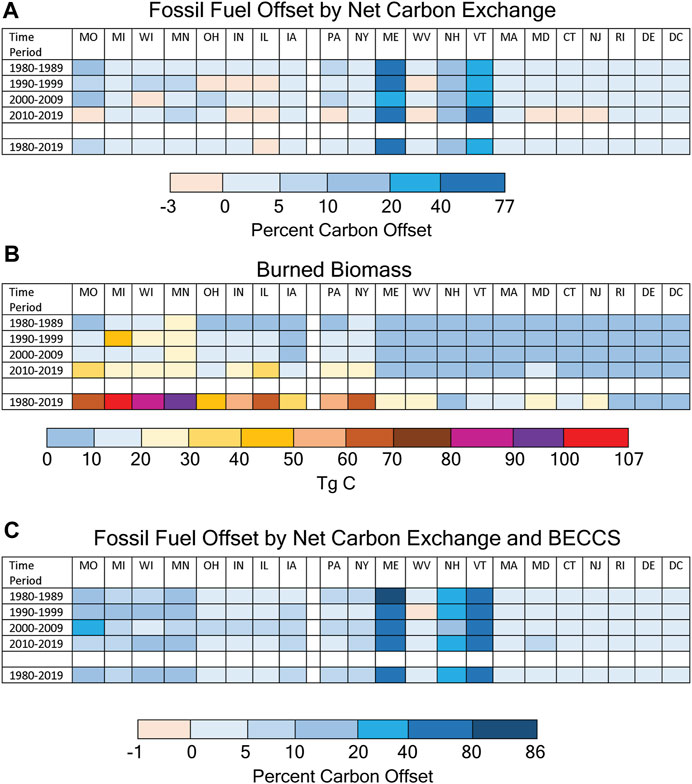
FIGURE 8. Comparison of the potential decadal benefits of bioenergy carbon capture and storage (BECCS) of burned biomass emissions from forests on offsets to fossil fuel emissions among states in the C-FEWS region. Decadal offsets based on net carbon exchange (A) are enhanced by BECCS of (B) burned biomass emissions to obtain (C) potential offsets based on net carbon exchange and BECCS. Midwestern states are Illinois (IL), Indiana (IN), Iowa (IA), Michigan (MI), Minnesota (MN), Missouri (MO), Ohio (OH), and Wisconsin (WI). Northeastern states are Connecticut (CT), Delaware (DE), Maine (ME), Maryland (MD), Massachusetts (MA), New Hampshire (NH), New Jersey (NJ), New York (NY), Pennsylvania (PA), Rhode Island (RI), Vermont (VT), Washington DC (DC), and West Virginia (WV). States with more forested areas in each subregion are positioned toward the left.
Similar to net carbon exchange and biomass increment, no general trends are discernable in annual runoff, represented as water yield, for either Midwestern or Northeastern forests over the 40-year study period (Figure 9A). Instead, annual water yield is dominated by the effects of climate variability. The lack of response of water yield to increasing precipitation (Figure 1D) over the study period is because concurrent increases in evapotranspiration (Figure 9B) return the additional water from higher precipitation back to the atmosphere rather than contributing to additional runoff. Although precipitation increased by about 2.5 mm yr−1 during the study period in both the Midwest (R2 = 0.12, p = 0.03) and the Northeast (R2 = 0.05, p = 0.17, n.s.), concurrent increases of 0.04° yr−1 in air temperature (Figure 1B) in both the Midwest (R2 = 0.26, p = 0.0008) and the Northeast (R2 = 0.42, p < 0.0001) enhance evapotranspiration by 2.0 mm yr−1 in the Midwest (R2 = 0.15, p = 0.01) and 2.2 mm yr−1 in the Northeast (R2 = 0.12, p = 0.03) to compensate for most of the higher precipitation rates during the study period.
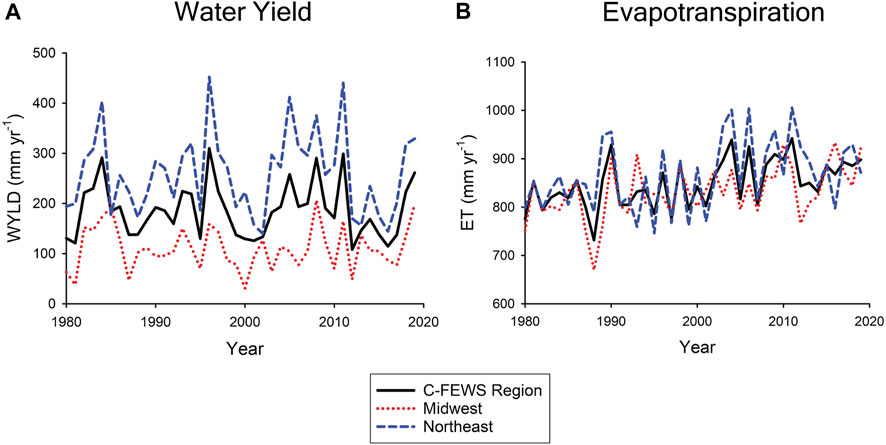
FIGURE 9. Comparison of annual (A) water yield (WYLD) and (B) evapotranspiration (ET) of forests in the Midwest United States, Northeast United States, and the entire C-FEWS region over the study period (1980–2019).
After exploring the potential impacts of several types of extreme climate events (heat waves, cold waves, drought, and extreme precipitation) on ecosystem services, we find that only heat waves have consistent diminishing effects on net carbon exchange, biomass increment, and water yield throughout the 40-year study period (Table 3). The effects of the other extreme climate events on forest ecosystem services appear to be confounded with other changing environmental conditions to provide consistent effects throughout the study period. While there is a tendency for the impacts of heat waves on ecosystem services to become stronger over the study period, the effects of heat waves also appear to be influenced by other environmental conditions. Larger detrimental heat wave effects occur with regard to net carbon exchange and biomass increment in Midwestern forests than Northeastern forests, while larger effects on runoff occur in Northeastern forests than in Midwestern forests. Changes in forest NBI from land-use change also appear to have enhanced these detrimental heat-wave effects in Midwestern forests over time but tend to have moderated these effects in Northeastern forests.
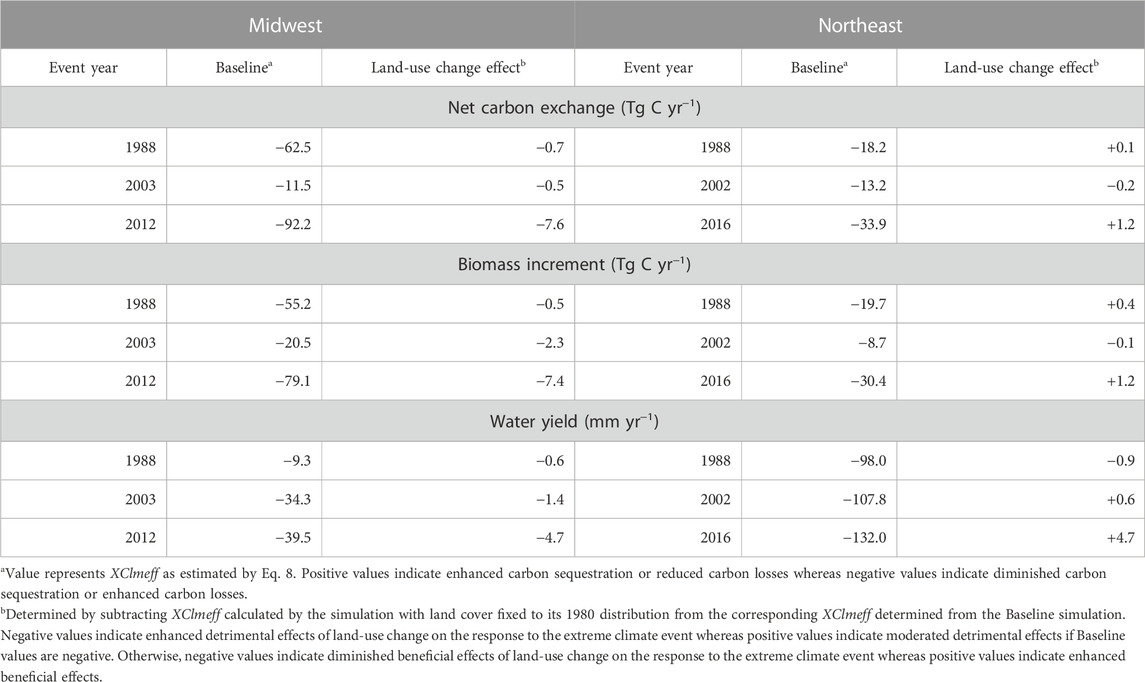
TABLE 3. Effect of land-use change on the annual responses of forest ecosystem services to heat waves in the Midwest and Northeast United States.
For net carbon exchange and biomass increment, differences in regional responses appear to be related to land-use change effects on biomass increment, which enhance the amount of forest biomass in the Midwest but diminish the amount of forest biomass in the Northeast (Figure 5B). Heat waves enhance rates of plant and microbial respiration. Thus, the additional biomass in Midwestern forests enhance plant respiration to enhance the detrimental impact of heat waves on net carbon exchange and biomass increment while the smaller total biomass of Northeastern forests would diminish plant respiration to moderate detrimental impacts of heat waves.
For water yield, the differences in regional responses appear to be related to land-use change effects on forest area. In the Midwest, the forest area increased by 8% to enhance the contribution of forests to water yield while forest area decreased in the Northeast to diminish water yield.
As climate variability has a dominant effect on net carbon exchange (Figure 5A), biomass increment (Figure 5B), and water yield (Figure 9A), one would expect a scenario depicting increased frequency of heat waves (Figure 2A) to diminish these ecosystem services. While an increased frequency of heat waves does diminish net carbon exchange and biomass increment in forests of both the Midwest and Northeast, and diminish water yield in Midwestern forests, the increased frequency enhanced water yield in Northeastern forests (Table 4). This increase occurs because the three sequential heat waves are also associated with high rates of precipitation (Figure 2C), which increases antecedent soil moisture before the subsequent heat waves.
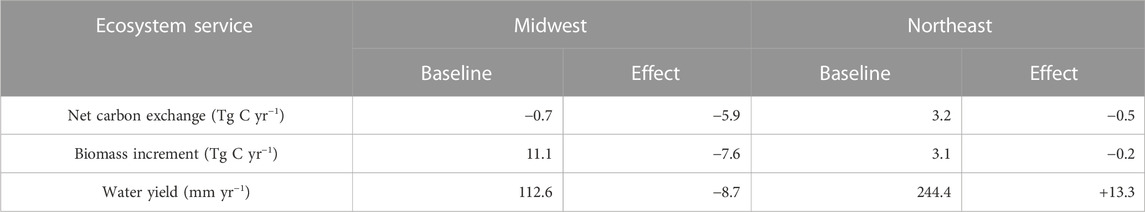
TABLE 4. Effects of increased frequency of heat waves on mean annual rates of forest ecosystem services in the Midwest and Northeast United States during the 2010s.
The representation of forest NBI has a large influence on estimated forest carbon stocks and fluxes. However, this influence varies between the Midwest and the Northeast and among states. The FIA-corrected stand ages cause less carbon to be stored in forest vegetation and soil organic matter (Table 5) than the Baseline stand ages (Table 1). In contrast, the younger forests of the FIA-corrected land cover sequestered almost twice as much carbon in the Midwest (597 Tg C) and Northeast (686 Tg C) than the Baseline land cover over the 40-year study period. The FIA-corrected stand ages stored twice as much carbon in vegetation (629 Tg C) as the Baseline stand ages in the Northeast, but only 1.6 times as much carbon (713 Tg C) in the Midwest. The FIA-corrected stand ages lost less soil organic carbon (−15 Tg C) than the Baseline stand ages in the Midwest over the study period and gained 1.8 times as much soil organic carbon (179 Tg C) in the Northeast. The enhanced forest carbon sequestration rates using the FIA-corrected stand ages suggest that this mechanism would have offset about 5.5% of the fossil fuel emissions from the C-FEWS region rather than the 3% offset using the Baseline stand ages with larger offsets in the Northeast (7%) than the Midwest (4.5%). The largest carbon offsets of the corresponding cumulative state fossil fuel emissions are still in Maine (70%), Vermont (58%), New Hampshire (19%), and Missouri (15%).
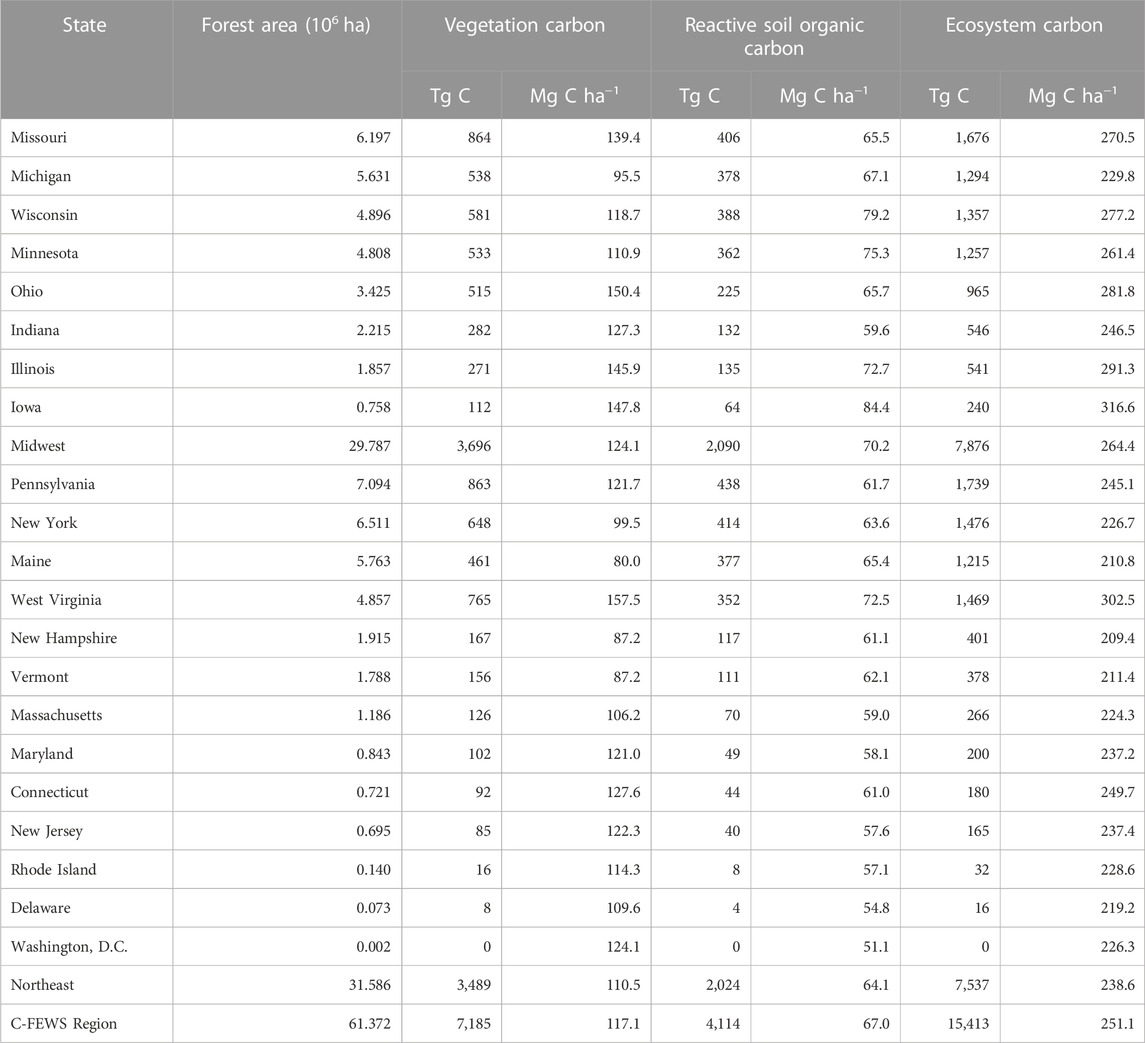
TABLE 5. Distribution of forested area and carbon stocks in the C-FEWS region during January 1980 based on FIA-corrected stand ages.
With the increase in timber harvests, a greater amount of carbon stored in wood products has been lost using the FIA-corrected stand ages in the Northeast (122 Tg C) and the Midwest (101 Tg C) over the study period. These losses are 2.5 times and 1.6 times, respectively, more than those using the Baseline stand ages. The greater losses from wood products indicates that more wood products were created from timber harvest in the past using the FIA-corrected stand ages, but the frequency and/or area of timber harvests have still diminished over the last 100 years as these wood product stocks decline.
In addition, conversion fluxes using the FIA-corrected stand ages in the Midwest (590 Tg C) and Northeast (322 Tg C) over the study period are 1.1 times and 1.3 times, respectively, the corresponding fluxes using the Baseline stand ages.
Management of forests to sustain or enhance their ecosystem services requires understanding how environmental and management factors influence these services and how these effects may vary over a region through time. To date, many studies of forest carbon dynamics have attempted to quantify forest carbon sequestration to assess their potential role in offsetting fossil fuel emissions (e.g., Niu and Duiker, 2006; McKinley et al., 2011; Lu et al., 2015; Domke et al., 2020) or its relationship to wood production (Birdsey and Lewis, 2003). Few studies have examined how these ecosystem services are generally affected by various environmental and management factors (Felzer et al., 2004; Pan et al., 2009; Nunery and Keeton, 2010; Dangal et al., 2014; Lu et al., 2015). For forest water dynamics, previous studies have examined how timber harvests or land conversions have influenced runoff (Khand and Senay, 2021; McEachran et al., 2021). This study is the first to examine how extreme climate events influence these ecosystem services and how changes in forest NBI from these factors influence the response of forest ecosystems to later extreme climate events.
Like Pan et al.’s (2009) analyses for Mid-Atlantic forests, our analyses of Midwestern and Northeastern forests indicate that climate variability has a dominant effect on forest NBI and associated ecosystem services that affect the use of forests for climate mitigation, biomass availability for fuel and other wood products, and water supply. Land-use change, CO2 fertilization, and ozone pollution do influence forest NBI and associated ecosystem services, but these effects are currently more subtle than the corresponding climate variability effects in the C-FEWS region.
While the beneficial effects of CO2 fertilization and the detrimental effects of ozone pollution on net carbon exchange are consistent with the results of previous studies, the detrimental effects of land-use change in our study appear, at first glance, to be at odds with these previous studies (e.g., Lu et al., 2015) where forest regrowth from the abandonment of croplands cause these forests to sequester atmospheric carbon dioxide. The difference results from our analyses focusing on the effects of factors on net carbon exchange since 1980. During the study period, the expansion of suburban areas causes a loss of forest land such that land-use change diminishes forest carbon sequestration during this period. In contrast, most of the forest regrowth during the study period is a result of timber harvests that occur before 1980. As described in a companion paper [Vörösmarty et al., this issue (b)], the rates of carbon sequestration from the legacy effects of past timber harvests overwhelm the loss of carbon from the expansion of suburban areas so that forests in both the Midwest and Northeast sequester carbon overall during the study period, which is consistent with previous studies. Because substantial land-use change occurs before 1980, the legacy effects of forest regrowth and its interactions with other factors that affect net carbon exchange are incorporated in the various effects attributed to climate including CO2 fertilization, and ozone pollution during the study period. The regrowth from legacy timber harvests on forest carbon sequestration is thus partly responsible for the large effects of climate variability on net carbon exchange.
While forests in both the Midwest and Northeast sequester carbon overall during the study period, regional differences in environmental conditions and land use trends cause geographic and temporal differences in how that carbon is stored. Although the two regions have about the same amount of forest area, vegetation in the Midwest sequestered more carbon than in the Northeast. One reason for this is associated with the drier conditions in the Midwest (Figure 1D). Under drier conditions, TEM assumes that relatively more elevated atmospheric CO2 is taken up by vegetation than under wetter conditions (Pan et al., 1998) leading to higher rates of carbon sequestration. Another reason is associated with differences in the character of forest NBI. The Midwest has a larger area of younger forests than the Northeast (Figure 1E). As shown by the forest NBI simulation experiment, younger forests represented by the FIA-corrected stand ages sequester more carbon in vegetation than the corresponding older forests represented by the Baseline stand ages. This occurs because NPP is generally higher in younger forest stands than older stands (Pregitzer and Euskirchen, 2004).
In contrast to vegetation, Midwestern forests lost soil organic carbon during the study period while Northeastern forests gained soil organic carbon. This difference is related to differences in land-use change trends between the two regions during the 40-year study period (Figure 1E). After a disturbance, forests will initially lose carbon for the first few years as the rate of soil organic matter decomposition overwhelms the rates of vegetation productivity, but then regrowth of these forests will begin to sequester carbon as the rates of vegetation productivity overcome decomposition and vegetation respiration rates (Pregitzer and Euskirchen, 2004). Eventually, litterfall rates from the enhanced vegetation biomass also overcome decomposition rates such that forests will begin to gain soil organic carbon during the later stages of regrowth. A similar process occurs during forest regrowth on abandoned agricultural land. In the Midwest, more cropland is continually abandoned to forests than in the Northeast during the study period (Figure 1E). Thus, a larger proportion of the Midwestern forests are experiencing the earlier stages of forest regrowth, where more soil organic carbon is lost to decomposition than is being supplied by litterfall inputs to diminish stocks of soil organic carbon. In contrast, a larger proportion of Northeastern forests is experiencing the later stages of regrowth, where litterfall inputs to soil organic carbon are greater than losses to decomposition, thus elevating stocks of soil organic carbon. In the forest NBI experiment, the younger forests represented by the FIA-corrected stand ages in the Midwest lost less soil organic carbon and the corresponding forests in the Northeast gained more carbon than the older forests represented by the Baseline stand ages. Although timber harvest diminishes litterfall inputs to soils during the early stages of regrowth, a large amount of carbon is assumed to be transferred from vegetation to soils as slash during the harvest itself to enhance stocks of soil organic carbon. Thus, the effect of land-use change on forest NBI and associated ecosystem services will depend on the type of land-use change that occurs.
Forests are known to be large consumers of water for evapotranspiration (e.g., Ellison et al., 2012; Khand and Senay, 2021; McNulty et al., 2021; Yu et al., 2022). Although precipitation has increased in both regions over the 40-year study period, the concurrent 1.6°C increase in air temperature over the study period has enhanced forests evapotranspiration by about 10% in both the Midwest and Northeast. The enhanced evapotranspiration provides additional water to the atmosphere that may enhance precipitation in downwind areas (Ellison et al., 2012). In our analyses the enhanced evapotranspiration has limited the benefits of the enhanced precipitation on runoff suggesting a resiliency of these forest ecosystems to climate change. It also indicates the importance of considering evapotranspiration dynamics in addition to precipitation dynamics when assessing the impacts of global change on potential water supplies for human use. Based on the ratio of water yield to precipitation (WYLD/P), consideration of forest evapotranspiration on potential water supplies appears to be more important in the drier Midwest (WYLD/P = 0.12) than in the wetter Northeast (WYLD/P = 0.23).
As extreme climate events contribute to climate variability, these events could have large effects on forest NBI and associated ecosystem services, but this influence depends on the intensity, timing, duration, frequency, and spatial extent of these events (Frank et al., 2015; He et al., 2018; Arain et al., 2022). In addition, different types of extreme events may occur simultaneously (e.g., drought and heat wave) or successively to enhance the impacts of these events (Mazdiyasni and AghaKouchak, 2015; Arain et al., 2022). In their review of the effects of climate extremes on the terrestrial carbon cycle, Frank et al. (2015) identifies four categories of impacts: direct concurrent impact, direct lagged impact, indirect concurrent impact, and indirect lagged impact. Direct concurrent impacts begin during the event itself and may continue after the event ends. Direct lagged impacts begin in the year or years immediately following the extreme event. For indirect concurrent impacts, the event itself increases the susceptibility to an external trigger, such as fire, that enhances the impact of the event during the event. For indirect lagged impacts, the extreme climate event increases the susceptibility to an external trigger (Schlesinger et al., 2016), but the trigger does not occur until after the event. An example of an indirect lagged impact would be the accumulation of down woody detritus after a blowdown (Meigs and Keeton, 2018) facilitating a later fire. On the other hand, forest NBI may also help buffer these ecosystems against these extreme events, such as the ability of tree roots to access deep soil water or groundwater during a drought so they are more resistant to these events (Fan et al., 2017). The complexity of the impacts of extreme climate events and the potential resistance of forest NBI to these events could make it difficult to discern the effects of extreme climate events on forest ecosystem services.
In our analyses of historical extreme climate events, our approach attempted to quantify direct concurrent impacts of heat waves, cold waves, droughts, and extreme precipitation events that occurred toward the beginning, middle, and end of the study period. Our approach also attempted to examine if the response to these extreme events changed during the study period from changes in forest NBI resulting from the legacy of direct lagged impacts of extreme climate events and trends in the impacts of atmospheric chemistry, climate and land-use change. Potential indirect impacts of extreme climate events on ecosystem services were not considered in our analyses. From our second set of simulation experiments, the effects of cold wave, drought, and extreme precipitation events on net carbon exchange, biomass increment, and water yield of forests in the Midwest and Northeast United States appeared to be confounded with the effects of antecedent conditions, successive extreme events, and lagged forest responses to the events such that consistent direct responses to these extreme climate events were difficult to discern as noted for other regions (Knapp et al., 2008; Frank et al., 2015; Rammig et al., 2015). In contrast, heat waves were found to consistently diminish net carbon exchange, biomass increment, and water yield of forest ecosystems of both the Midwest and Northeast United States during the 40-year study period. Further, the evolution of forest NBI from land-use change effects altered the responses of forest ecosystem services to heat waves over the study period.
When examining the potential impacts of an increasing frequency of heat waves (Mazdiyasni and AghaKouchak, 2015) on forest ecosystem services, we find that the responses depend on whether the heat waves are accompanied by dry or wet conditions—a compound effect. For forests of the Midwest United States, a tripling of extreme heat waves events during the 2010s, which are accompanied by drier conditions (Figure 2), enhances the loss of carbon from these forests by almost 8.5 times, diminishes the accumulation of tree biomass by 68%, and diminishes water yield by 8% during the 2010s. In contrast, the tripled heat waves in the Northeast, which are accompanied by wetter conditions (Figure 2), diminishes forest carbon sequestration by 16%, diminishes the accumulation of tree biomass by 6%, and enhances water yield by 5% during this time period. Thus, ecosystem services of forests in the generally drier Midwest are more at risk from increasing heat waves than the forests of the wetter Northeast.
Based on our estimates of net carbon exchange, we estimate that carbon sequestration by forests in the C-FEWS region offset about 3%–5.5% of the fossil fuels emitted from the region from 1980 to 2019. The forests of the Northeast have been able to offset about twice its fossil fuel emissions (4%–7%) than the Midwestern forests (2–4.5%). Our estimates of fossil fuel offsets by forest carbon sequestration are less than the corresponding offsets estimated by Lu et al. (2015) for all land covers in the C-FEWS region (18% offset in the Midwest; 14% offset in the Northeast) for the years 2001–2005 with forests being the major carbon sink (59 ± 11 Tg C yr−1 for the Midwest; 43 ± 10 Tg C yr−1 for the Northeast). Part of the difference may be a result of the longer time frame considered in our study (1980–2019), which would incorporate the impacts of more adverse environmental conditions on our estimates of forest carbon sequestration than the Lu et al. (2015) estimates. However, our estimates of forest net carbon exchange for the years 2001–2005 range from 14.8 ± 35.1 Tg C yr−1 to 22.3 ± 31.3 Tg C yr−1 for the Midwest and 5.9 ± 23.8 Tg C yr−1 to 10.5 ± 19.1 Tg C yr−1 for the Northeast depending on the forest NBI assumed. In addition, a comparison of our net carbon exchange estimates to corresponding estimates of changes in total carbon stocks of forests (Birdsey and Lewis, 2003) also indicate that our analyses underestimates forest carbon sequestration in the Midwest and Northeast from 1987 to 1997 (Table 6). While the use of the FIA-corrected stand ages generally improved estimates of land carbon sequestration compared to Birdsey and Lewis (2003), there were states where the use of these stand ages worsened the comparison (Pennsylvania, Maine). Thus, there are other factors affecting forest carbon sequestration that need to be considered. One issue may be the representation of ozone pollution. In our analysis, we used a simulated projection of ozone where the concentrations may have been too high and diminished our estimates of net primary production and carbon sequestration in forests.
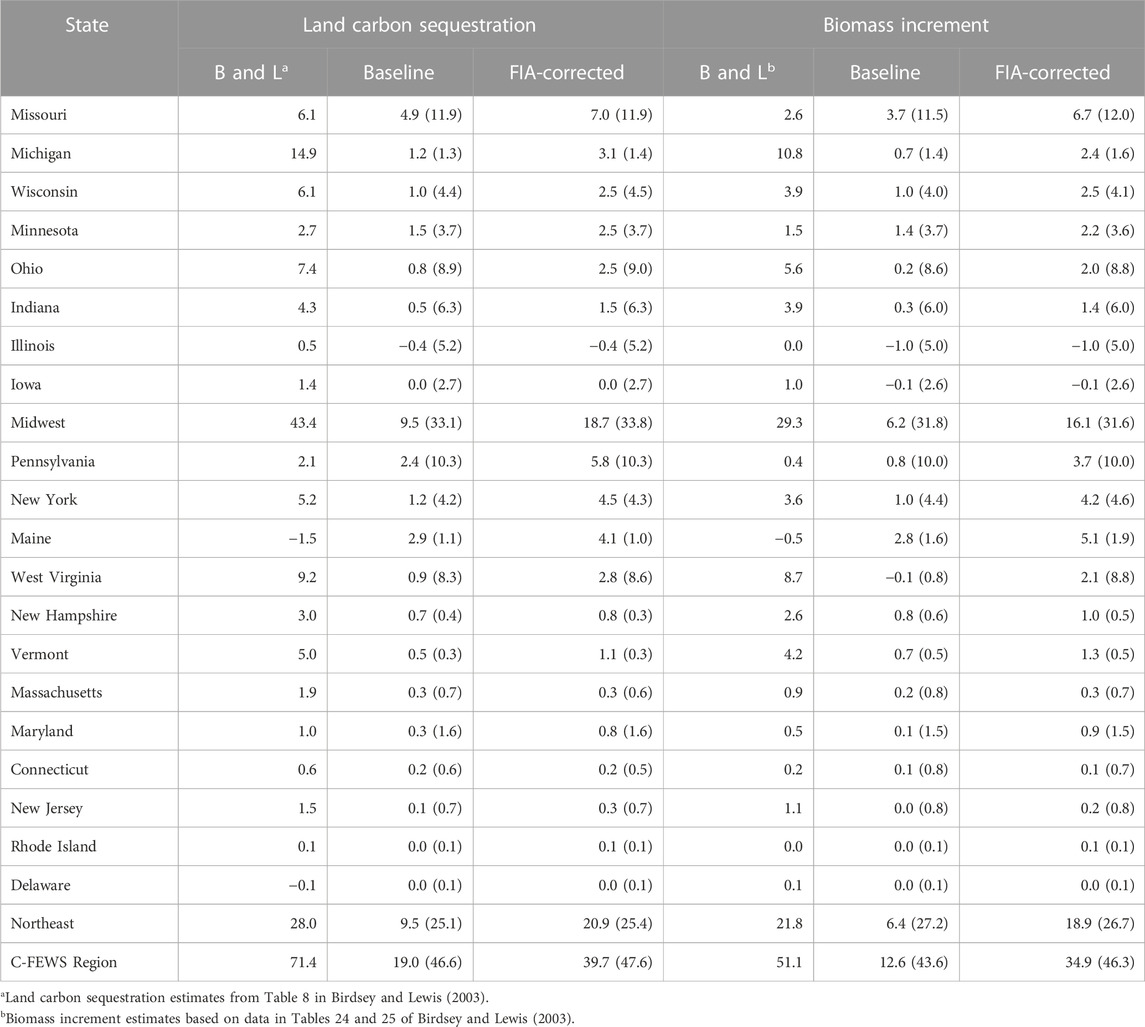
TABLE 6. Comparison of mean land carbon sequestration as represented by net carbon exchange and biomass increment estimates (Tg C yr−1) by TEM 4.4 using Baseline stand ages and FIA-corrected stand ages to Birdsey and Lewis (2003) (B and L) for forests in the Midwest and Northeast during 1987–1997. Standard deviations are in parentheses.
Besides sequestering carbon to mitigate climate change, our analyses indicate that forests of the C-FEWS region also produce about an equal amount of carbon in biomass that is burned either as fuelwood or slash removal with about twice as much biomass burned in the Midwest as in the Northeast United States. This bioenergy could be redirected to facilities for heat and power generation followed up with carbon capture and storage in geological formations (BECCS, Gough and Upham, 2011; Vaughan et al., 2018) to replace some fossil fuel use (Lippke et al., 2011) and increase the carbon sink attributed to forests. If all the burned biomass is captured and stored with 100% efficiency, then net carbon exchange and BECCS of the C-FEWS region would offset 6%–9% of the CO2 emissions associated with fossil fuels depending on the forest NBI assumed. With BECCS, forests of the Midwest would have a maximum fossil fuel offset of 7%–9% while forests of the Northeast would have a maximum fossil fuel offset of 6%–10%. However, our analysis appears to have also underestimated biomass increment when compared to the Birdsey and Lewis (2003) estimates of changes in vegetation carbon stocks (Table 6). As the accumulation of biomass increment indicates the additional amount of vegetation biomass (Figure 6) potentially available for bioenergy, our estimates of the maximum offset from the BECCS component have also been underestimated. Given that our analyses have underestimated both forest carbon sequestration and BECCS, the maximum fossil fuel offset may be higher.
Carbon emissions associated burning biomass during timber harvest from rotational forestry and land conversion vary among states and over the study period (Figure 8B). States with larger areas of forests in each region tended to have higher carbon emissions from burned biomass than states with less forest cover. In addition, higher carbon emissions occur during those decades with higher rates of land conversion during the 1990s and 2010s for Missouri, Michigan, and Wisconsin in the Midwest and Pennsylvania in the Northeast. The states of Missouri, Michigan, Wisconsin, and Minnesota would appear to have the largest offset benefits from the application of BECCS to carbon emissions from burned biomass (Figure 8C).
The use of tree boles and harvest residues for bioenergy, however, may have some unintended consequences (Achat et al., 2015; Birdsey et al., 2018; Ranius et al., 2018). Wood has a low “energy density” (16 MJ kg−1) compared to 55 MJ kg−1 for natural gas (see Table 2 in Hore-Lacy, 2018). Thus, more wood would be needed to generate the same amount of electricity as natural gas and result in more CO2 emissions that would then have to be captured and stored. Reduced nutrient availability for tree growth may occur with: 1) the removal of nutrients in exported biomass; 2) reduced microbial activity and mineralization as affected by soil compaction, and modified soil temperatures and moistures; and 3) increased stream export of nutrients and dissolved organic carbon, which also degrade water quality of receiving rivers and streams. Removal of harvest residues may also lead to soil acidification from the depletion of base cation stocks. Because a large portion of forest biodiversity is dependent upon dead wood, removal of woody debris and harvest residues causes the loss of potential habitat for some species to reduce biodiversity.
If the frequency of heat waves increases in the future, our analyses indicate that forest carbon sequestration will diminish, and less biomass will be available for bioenergy to help mitigate further climate change. These detrimental effects of heat waves will be greater in forests of the generally drier Midwest than the wetter Northeast.
In our analyses, heat waves are shown to diminish the ability of forests to mitigate climate change by sequestering atmospheric CO2, to provide wood resources for fuel and wood products by creating new biomass, and to provide water supplies for human use from runoff. Land-use change has enhanced the effect of heat waves on ecosystem services in the Midwest but moderated these effects in the Northeast. While land-use change includes the effects of human disturbances on forest NBI and ecosystem services, it does not include the effects of natural disturbances such as wildfires, insect infestations, flooding, landslides, ice storms, or blowdowns on this NBI or services. These natural disturbances, which often occur with extreme climate events, may have similar impacts on forest NBI and ecosystem services. Similar to the effects of land-use change, the modifications of forest NBI from natural disturbances may also alter the sensitivity of forests to future extreme climate events and represent the indirect impacts of extreme climate events as described by Frank et al. (2015). While the use of gridded data set of forest stand age (Pan et al., 2011) help to improve the representation of forest NBI by implicitly accounting for the effects of natural disturbances, these stand ages still need to be attributed to various natural disturbances to better understand the indirect impacts of extreme climate events on forest NBI and associated ecosystem services.
In our study, we have been unable to detect consistent direct effects of cold waves, droughts, and extreme precipitation events on forest ecosystem services. This may have been a result of the ability of forest NBI (e.g., deep roots) to resist the impacts of the duration, timing, or intensity of some of these rare extreme climate events. Alternatively, the confounding effects of different types of concurrent or consecutive extreme climate events may have hidden such impacts. It may be that the indirect impacts of these extreme events (e.g., fire with drought, ice storms with cold waves, floods and landslides with extreme precipitation) may be more important than the direct impacts on forest NBI and ecosystem services and should be examined in future studies.
Overall, our analyses indicate that climate variability, as influenced by extreme climate events (particularly heat waves), has a dominant effect on the ability of forest ecosystems to sequester atmospheric CO2 to mitigate climate change, create new wood biomass for future wood products or fuelwood, and provide runoff for potential human use. Heat waves have a larger effect on forest NBI and associated ecosystem services in the Midwest than in the Northeast United States. Human disturbance from land-use change can alter the sensitivity of these forest ecosystem services to extreme climate events. When developing policies, it will be important to consider the fate of wood from forests as burning biomass and the decomposition of wood products can have large effects on assessing the ability of forests to provide carbon offsets to fossil fuel emissions. In addition, for accurate accounting of carbon sequestration potential, the effects of expanding urban/suburban areas on regional carbon balances cannot be ignored.
The raw data supporting the conclusion of this article will be made available by the authors, without undue reservation.
DK: conceptualization, methodology, data curation, formal analysis, investigation, software, visualization, writing-original draft. T-SL: methodology, data curation, writing–review and editing. JZ: methodology, data curation, writing—review and editing. MC: project administration, methodology, data curation, writing—review and editing. CV: funding acquisition, project administration, resources, supervision, conceptualization, formal analysis, writing—review and editing. AJ: funding acquisition, conceptualization, methodology, data curation, writing—review and editing. JM: funding acquisition, conceptualization, writing—review and editing.
Financial support for this work was provided by the U.S. National Science Foundation’s Innovations at the Nexus of Food, Energy and Water Systems Program (INFEWS/T1 Grant #1856012) and the MIT Joint Program on the Science and Policy of Global Change.
The authors declare that the research was conducted in the absence of any commercial or financial relationships that could be construed as a potential conflict of interest.
All claims expressed in this article are solely those of the authors and do not necessarily represent those of their affiliated organizations, or those of the publisher, the editors and the reviewers. Any product that may be evaluated in this article, or claim that may be made by its manufacturer, is not guaranteed or endorsed by the publisher.
The Supplementary Material for this article can be found online at: https://www.frontiersin.org/articles/10.3389/fenvs.2023.1069451/full#supplementary-material
Achat, D. L., Deleuze, C., Landmann, G., Pousse, N., Ranger, J., and Augusto, L. (2015). Quantifying consequences of removing harvesting residues on forest soils and tree growth – A meta-analysis. For. Ecol. Manage. 348, 124–141. doi:10.1016/j.foreco.2015.03.042
Anderson-Teixeira, K. J., Herrmann, V., Morgan, R. B., Bond-Lamberty, B., Cook-Patton, S. C., Ferson, A. E., et al. (2021). Carbon cycling in mature and regrowth forests globally. Environ. Res. Lett. 16, 053009. doi:10.1088/1748-9326/abed01
Arain, M. A., Xu, B., Brodeur, J. J., Khomik, M., Peichl, M., Beamesderfer, E., et al. (2022). Heat and drought impact on carbon exchange in an age-sequence of temperate pine forests. Ecol. Process. 11, 7. doi:10.1186/s13717-021-00349-7
Birdsey, R. A., and Lewis, G. M. (2003). Carbon in U. S. Forests and wood products, 1987-1997: State-by-state estimates. General Technical Report NE-310. Pennsylvania: U. S. Department of Agriculture, Forest Service, Northeastern Research Station, Newtown Square, 432.
Birdsey, R., Duffy, P., Smyth, C., Kurz, W. A., Dugan, A. J., and Houghton, R. (2018). Climate, economic, and environmental impacts of producing wood for bioenergy. Environ. Res. Lett. 13, 050201. doi:10.1088/1748-9326/aab9d5
Canadell, J. G., Monteiro, P. M. S., Costa, M. H., Cotrim da Cunha, L., Cox, P. M., Eliseev, A. V., et al. (2021). “Global carbon and other biogeochemical cycles and feedbacks,” in Climate change 2021: The physical science basis. Contribution of working group I to the sixth assessment report of the intergovernmental panel on climate change. V. Masson-Delmotte, P. Zhai, A. Pirani, S. L. Connors, C. Péan, S. Bergeret al. (Cambridge, UK: Cambridge University Press), 673–816. doi:10.1017/9781009157896.007
Compton, J. E., and Boone, R. D. (2000). Long-term impacts of agriculture on soil carbon and nitrogen in New England forests. Ecology 81, 2314–2330. doi:10.1890/0012-9658(2000)081[2314:LTIOAO]2.0.CO;2
Dangal, S. R. S., Felzer, B. S., and Hurteau, M. D. (2014). Effects of agriculture and timber harvest on carbon sequestration in the eastern US forests. J. Geophys. Res. Biogeosci. 119, 35–54. doi:10.1002/2013JG002409
Defries, R., Ahuja, R., Friedman, J., Gordon, D. R., Hamburg, S. P., Kerr, S., et al. (2022). Land management can contribute to net zero. Science 376 (6598), 1163–1165. doi:10.1126/science.abo0613
Dlugokencky, E., and Tans, P. (2021). Trends in atmospheric carbon dioxide. National Oceanic and Atmospheric Administration. Boulder, CO: Earth System Research Laboratory. Available at: https://www.esrl.noaa.gov/gmd/ccgg/trends/global.html.
Domke, G. M., Oswalt, S. N., Walters, B. F., and Morin, R. S. (2020). Tree planting has the potential to increase carbon sequestration capacity of forests in the United States. Proc. Natl. Acad. Sci. U.S.A. 117 (40), 24649–24651. doi:10.1073/pnas.2010840117
Ellison, D., Futter, M. N., and Bishop, K. (2012). On the forest cover-water yield debate: From demand-to supply-side thinking. Glob. Change Biol. 18 (3), 806–820. doi:10.1111/j.1365-2486.2011.02589.x
Fan, Y., Miguez-Macho, G., Jobbágy, E. G., Jackson, R. B., and Otero-Casal, C. (2017). Hydrologic regulation of plant rooting depth. Proc. Natl. Acad. Sci. U.S.A. 114 (40), 10572–10577. doi:10.1073/pnas.1712381114
FAO (2019). Global forest products facts and Figures 2018. Rome, Italy: Food and Agriculture Organization of the United Nations, 18p. Available at: https://www.fao.org/3/ca7415en.pdf.
Felzer, B., Kicklighter, D., Melillo, J., Wang, C., Zhuang, Q., and Prinn, R. (2004). Effects of ozone on net primary production and carbon sequestration in the conterminous United States using a biogeochemistry model. Tellus B 56 (3), 230–248. doi:10.1111/j.1600-0889,2004.00097.x
Felzer, B., Reilly, J., Melillo, J., Kicklighter, D., Sarofim, M., Wang, C., et al. (2005). Future effects of ozone on carbon sequestration and climate change policy using a global biogeochemical model. Clim. Change 73 (3), 345–373. doi:10.1007/s10584-005-6776-4
Frank, D., Reichstein, M., Bahn, M., Thonicke, K., Frank, D., Mahecha, M. D., et al. (2015). Effects of climate extremes on the terrestrial carbon cycle: Concepts, processes, and potential future impacts. Glob. Change Biol. 21, 2861–2880. doi:10.1111/gcb.12916
Friedl, M. A., McIver, D. K., Hodges, J. C. F., Zhang, X. Y., Muchoney, D., Strahler, A. H., et al. (2002). Global land cover mapping from MODIS: Algorithms and early results. Remote Sens. Environ. 83, 287–302. doi:10.1016/S0034-4257(02)00078-0
Galford, G. L., Melillo, J. M., Kicklighter, D. W., Cronin, T. W., Cerri, C. E. P., Mustard, J. F., et al. (2010). Greenhouse gas emissions from alternative futures of deforestation and agricultural management in the southern Amazon. Proc. Natl. Acad. Sci. U.S.A. 107 (46), 19649–19654. doi:10.1073/pnas.1000780107
Galford, G. L., Melillo, J. M., Kicklighter, D. W., Mustard, J. F., Cronin, T. W., Cerri, C. E. P., et al. (2011). Historical carbon emissions and uptake from the agricultural frontier of the Brazilian Amazon. Ecol. Appl. 21 (3), 750–763. doi:10.1890/09-1957.1
Gough, C., and Upham, P. (2011). Biomass energy with carbon capture and storage (BECCS or Bio-CCS). Greenh. Gases Sci. Technol. 1 (4), 324–334. doi:10.1002/ghg.34
Guttman, N. B. (1999). Accepting the standardized precipitation index: A calculation algorithm. J. Am. Water Resour. Assoc. 35 (2), 311–322. doi:10.1111/j.1752-1688.1999.tb03592.x
Harris, I., Osborn, T. J., Jones, P., and Lister, D. (2020). Version 4 of the CRU TS monthly high-resolution gridded multivariate climate dataset. Sci. Data 7, 109. doi:10.1038/s41597-020-0453-3
He, W., Ju, W., Schwalm, C. R., Sippel, S., Wu, X., He, Q., et al. (2018). Large-scale droughts responsible for dramatic reductions of terrestrial net carbon uptake over North America in 2011 and 2012. J. Geophys. Res. Biogeosci. 123, 2053–2071. doi:10.1029/2018JG004520
Hill, C., DeLuca, C., BalajiSuarez, M., and Da Silva, A. (2004). The architecture of the earth system modeling framework. Comput. Sci. Eng. 6 (1), 18–28. doi:10.1109/mcise.2004.1255817
Hoffland, E., Kuyper, T. W., Comans, R. N. J., and Creamer, R. E. (2020). Eco-functionality of organic matter in soils. Plant Soil 455, 1–22. doi:10.1007/s11104-020-04651-9
Homer, C., Dewitz, J., Jin, S., Xian, G., Costello, C., Danielson, P., et al. (2020). Conterminous United States land cover change patterns 2001-2016 from the 2016 national land cover database. J. Photogrammetry Remote Sens. 162, 184–199. doi:10.1016/j.isprsjprs.2020.02.019
Hurtt, G. C., Chini, L., Sahajpal, R., Frolking, S., Bodirsky, B. L., Calvin, K., et al. (2020). Harmonization of global land use change and management for the period 850–2100 (LUH2) for CMIP6. Model. Dev. 13, 5425–5464. doi:10.5194/gmd-13-5425-2020
Jensen, M. E., and Haise, H. E. (1963). Estimating evapotranspiration from solar radiation. J. Irrigation Drainage Div. 89 (4), 15–41. doi:10.1061/JRCEA4.0000287
Khand, K., and Senay, G. B. (2021). Runoff response to directional land cover change across reference basins in the conterminous United States. Adv. Water Resour. 153, 103940. doi:10.1016/j.advwatres.2021.103940
Kicklighter, D. W., Cai, Y., Zhuang, Q., Parfenova, E. I., Paltsev, S., Sokolov, A. P., et al. (2014). Potential influence of climate-induced vegetation shifts on future land use and associated land carbon fluxes in Northern Eurasia. Environ. Res. Lett. 9, 035004. doi:10.1088/1748-9326/9/3/035004
Knapp, A. K., Beier, C., Briske, D. D., Classen, A. T., Luo, Y., Reichstein, M., et al. (2008). Consequences of more extreme precipitation regimes for terrestrial ecosystems. BioScience 58 (9), 811–821. doi:10.1641/B580908
Lehner, B., Verdin, K., and Jarvis, A. (2008). New global hydrography derived from spaceborne elevation data. Eos, Trans. Am. Geophys. Union 89 (10), 93–94. doi:10.1029/2008eo100001
Lippke, B., Gustafson, R., Venditti, R., Volk, T., Oneil, E., Johnson, L., et al. (2011). Sustainable biofuel contributions to carbon mitigation and energy independence. Forests 2, 861–874. doi:10.3390/f2040861
Lu, X., Kicklighter, D. W., Melillo, J. M., Yang, P., Rosenzweig, B., Vörösmarty, C. J., et al. (2013). A contemporary carbon balance for the Northeast region of the United States. Environ. Sci. Technol. 47, 13230–13238. doi:10.1021/es403097z
Lu, X., Kicklighter, D. W., Melillo, J. M., Reilly, J. M., and Xu, L. (2015). Land carbon sequestration within the conterminous United States: Regional- and state-level analyses. J. Geophys. Res. Biogeosci. 120 (2), 379–398. doi:10.1002/2014JG002818
Margalef, R. (1963). On certain unifying principles in ecology. Am. Nat. 97 (897), 357–374. doi:10.1086/282286
Mazdiyasni, O., and AghaKouchak, A. (2015). Substantial increase in concurrent droughts and heatwaves in the United States. Proc. Natl. Acad. Sci. U.S.A. 112 (37), 11484–11489. doi:10.1073/pnas.1422945112
McEachran, Z. P., Karwan, D. L., and Slesak, R. A. (2021). Direct and indirect effects of forest harvesting on sediment yield in forested watersheds of the United States. J. Am. Water Resour. Assoc. 57 (1), 1–31. doi:10.1111/1752-1688.12895
McGuire, A. D., Melillo, J. M., Joyce, L. A., Kicklighter, D. W., Grace, A. L., Moore, B., et al. (1992). Interactions between carbon and nitrogen dynamics in estimating net primary productivity for potential vegetation in North America. Glob. Biogeochem. Cycles 6, 101–124. doi:10.1029/92GB00219
McGuire, A. D., Melillo, J. M., Kicklighter, D. W., Pan, Y., Xiao, X., Helfrich, J., et al. (1997). Equilibrium responses of global net primary production and carbon storage to doubled atmospheric carbon dioxide: Sensitivity to changes in vegetation nitrogen concentration. Glob. Biogeochem. Cycles 11, 173–189. doi:10.1029/97GB00059
McGuire, A. D., Sitch, S., Clein, J. S., Dargaville, R., Esser, G., Foley, J., et al. (2001). Carbon balance of the terrestrial biosphere in the twentieth century: Analyses of CO2, climate and land-use effects with four process-based ecosystem models. Glob. Biogeochem. Cycles 15, 183–206. doi:10.1029/2000GB001298
McKinley, D. C., Ryan, M. G., Birdsey, R. A., Giardina, C. P., Harmon, M. E., Heath, L. S., et al. (2011). A synthesis of current knowledge on forests and carbon storage in the United States. Ecol. Appl. 21 (6), 1902–1924. doi:10.1890/10-0697.1
McNulty, S., Steel, A., Springgay, E., Caldwell, B., Shono, K., Pess, G., et al. (2021). “Chapter 3-Managing forests for water,” in A guide to forest-water management. FAO forestry paper No. 185 (Rome: Food and Agriculture Organization of the United Nations, International Union of Forest Research Organizations, and United States Department of Agriculture), 31–74. doi:10.4060/cb6473en
Meigs, G. W., and Keeton, W. S. (2018). Intermediate-severity wind disturbance in mature temperate forests: Legacy structure, carbon storage, and stand dynamics. Ecol. Appl. 28 (3), 798–815. doi:10.1002/eap.1691
Meinshausen, M., Smith, S. J., Calvin, K., Daniel, J. S., Kainuma, M. L. T., Lamarque, J., et al. (2011). The RCP greenhouse gas concentrations and their extensions from 1765 to 2300. Clim. Change 109, 213–241. doi:10.1007/s10584-011-0156-z
Meiyappan, P., and Jain, A. K. (2012). Three distinct global estimates of historical land-cover change and land-use conversions for over 200 years. Front. Earth Sci. 6 (2), 122–139. doi:10.1007/s11707-012-0314-2
Melillo, J. M. (1996). “Carbon and nitrogen interactions in the terrestrial biosphere: Anthropogenic effects,” in Global change and terrestrial ecosystems. Editors B. Walker, and W. Steffen (Cambridge, UK: Cambridge University Press), 431–450.
Melillo, J. M., Butler, S. M., Johnson, J. E., Mohan, J., Steudler, P. A., Lux, H., et al. (2011). Soil warming, carbon-nitrogen interactions, and forest carbon budgets. Proc. Natl. Acad. Sci. U.S.A. 108 (23), 9508–9512. doi:10.1073/pnas.1018189108
Melillo, J. M., Reilly, J. M., Kicklighter, D. W., Gurgel, A. C., Cronin, T. W., Paltsev, S., et al. (2009). Indirect emissions from biofuels: How important? Science 326, 1397–1399. doi:10.1126/science.1180251
Melillo, J. M., Lu, X., Kicklighter, D. W., Reilly, J. M., Cai, Y., and Sokolov, A. P. (2016). Protected areas’ role in climate-change mitigation. Ambio 45 (2), 133–145. doi:10.1007/s13280-015-0693-1
Monier, E., Scott, J. R., Sokolov, A. P., Forest, C. E., and Schlosser, C. A. (2013). An integrated assessment modeling framework for uncertainty studies in global and regional climate change: The MIT IGSM-CAM (version 1.0). Geosci. Model. Dev. 6, 2063–2085. doi:10.5194/gmd-6-2063-2013
NASS (National Agricultural Statistics Service) (2022). Cropland data layer. Washington, D. C: U. S. Department of Agriculture. Available at: https://www.nass.usda.gov/Research_and_Science/Cropland/Release/index.php.
Niu, X., and Duiker, S. W. (2006). Carbon sequestration potential by afforestation of marginal agricultural land in the Midwestern U.S. For. Ecol. Manage. 223, 415–427. doi:10.1016/j.foreco.2005.12.044
Nunery, J. S., and Keeton, W. S. (2010). Forest carbon storage in the northeastern United States: Net effects of harvesting frequency, post-harvest retention, and wood products. For. Ecol. Manage. 259, 1363–1375. doi:10.1016/j.foreco.2009.12.029
Pan, Y., McGuire, A. D., Kicklighter, D. W., and Melillo, J. M. (1996). The importance of climate and soils for estimates of net primary production: A sensitivity analysis with the terrestrial ecosystem model. Glob. Change. Biol. 2, 5–23. doi:10.1111/j.1365-2486.1996.tb00045.x
Pan, Y., Melillo, J. M., McGuire, A. D., Kicklighter, D. W., Pitelka, L. F., Hibbard, K., et al. (1998). Modeled responses of terrestrial ecosystems to elevated atmospheric CO2: A comparison of simulations by the biogeochemistry models of the vegetation/ecosystem modeling and analysis project (VEMAP). Oecologia 114, 389–404. doi:10.1007/s004420050462
Pan, Y., Birdsey, R., Hom, J., and McCullough, K. (2009). Separating effects of changes in atmospheric composition, climate, and land-use on carbon sequestration of U. S. Mid-Atlantic temperate forests. For. Ecol. Manage. 259, 151–164. doi:10.1016/j.foreco.2009.09.049
Pan, Y., Chen, J. M., Birdsey, R. A., McCullough, K., He, L., and Deng, F. (2011). Age structure and disturbance legacy of North American forests. Biogeosciences 8, 715–732. doi:10.5194/bg-8-715-2011
Pregitzer, K. S., and Euskirchen, E. S. (2004). Carbon cycling and storage in world forests. Biome patterns related to forest age. Glob. Change Biol. 10, 2052–2077. doi:10.1111/j.1365-2486.2004.00866.x
Raich, J. W., Rastetter, E. B., Melillo, J. M., Kicklighter, D. W., Steudler, P. A., Peterson, B. J., et al. (1991). Potential net primary productivity in south America: Application of a global model. Ecol. Appl. 1, 399–429. doi:10.2307/1941899
Ramankutty, N., and Foley, J. A. (1999). Estimating historical changes in global land cover: Croplands from 1700 to 1992. Glob. Biogeochem. Cycles 13 (4), 997–1027. doi:10.1029/1999GB900046
Rammig, A., Wiedermann, M., Donges, J. F., Babst, F., von Bloh, W., Frank, D., et al. (2015). Coincidences of climate extremes and anomalous vegetation responses: Comparing tree ring patterns to simulated productivity. Biogeosciences 12, 373–385. doi:10.5194/bg-12-373-2015
Ranius, T., Hämäläinen, A., Egnell, G., Olsson, B., Eklöf, K., Stendahl, J., et al. (2018). The effects of logging residue extraction for energy on ecosystem services and biodiversity: A synthesis. J. Environ. Manage. 209, 409–425. doi:10.1016/j.jenvman.2017.12.048
Reilly, J., Paltsev, S., Felzer, B., Wang, X., Kicklighter, D., Melillo, J., et al. (2007). Global economic effects of changes in crops, pasture and forests due to changing climate, carbon dioxide and ozone. Energy Policy 35, 5370–5383. doi:10.1016/j.enpol.2006.01.040
Reilly, J., Melillo, J., Cai, Y., Kicklighter, D., Gurgel, A., Paltsev, S., et al. (2012). Using land to mitigate climate change: Hitting the target, recognizing the tradeoffs. Environ. Sci. Technol. 40 (11), 5672–5679. doi:10.1021/es2034729
Schlesinger, W. H., Dietze, M. C., Jackson, R. B., Phillips, R. P., Rhoades, C. C., Rustad, L. E., et al. (2016). Forest biogeochemistry in response to drought. Glob. Change Biol. 22 (7), 2318–2328. doi:10.1111/gcb.13105
Shangguan, W., Dai, Y., Duan, Q., Liu, B., and Yuan, H. (2014). A global soil data set for Earth system modeling. J. Adv. Model. Earth Syst. 6 (1), 249–263. doi:10.1002/2013MS000293
Singh, N. K., and Basu, N. B. (2022). The human factor in seasonal streamflows across natural and managed watersheds of North America. Nat. Sustain. 5, 397–405. doi:10.1038/s41893-022-00848-1
Sokolov, A. P., Kicklighter, D. W., Melillo, J. M., Felzer, B. S., Schlosser, C. A., and Cronin, T. W. (2008). Consequences of considering carbon-nitrogen interactions on the feedbacks between climate and the terrestrial carbon cycle. J. Clim. 21, 3776–3796. doi:10.1175/2008JCLI2038.1
Sokolov, A., Kicklighter, D., Schlosser, A., Wang, C., Monier, E., Brown-Steiner, B., et al. (2018). Description and evaluation of the MIT earth system model (MESM). J. Adv. Model. Earth Syst. 10, 1759–1789. doi:10.1029/2018MS001277
Swanston, C., Brandt, L. A., Janowiak, M. K., Handler, S. D., Butler-Leopold, P., Iverson, L., et al. (2018). Vulnerability of forests of the Midwest and Northeast United States to climate change. Clim. Change 146, 103–116. doi:10.1007/s10584-017-2065.2
Tian, H., Melillo, J. M., Kicklighter, D. W., McGuire, A. D., and Helfrich, J. (1999). The sensitivity of terrestrial carbon storage to historical climate variability and atmospheric CO2 in the United States. Tellus B 51, 414–452. doi:10.1034/j.1600-0889.1999.00021.x
Tian, H., Melillo, J. M., Kicklighter, D. W., Pan, S., Liu, J., McGuire, A. D., et al. (2003). Regional carbon dynamics in monsoon Asia and its implications for the global carbon cycle. Glob. Planet. Change 37, 201–217. doi:10.1016/S0921-8181(02)00205-9
USEIA (U. S. Energy Information Administration) (2022). Introduction and key concepts: State energy-related carbon dioxide emissions Tables. Washington, D. C: U. S. Department of Energy. Available at: https://www.eia.gov/environment/emissions/state/.
USGCRP (U. S. Global Change Research Program) (2017). in Climate science special report: Fourth national climate assessment, volume I. Editors D. J. Wuebbles, D. W. Fahey, K. A. Hibbard, D. J. Dokken, B. C. Stewart, and T. K. Maycock (Washington, D. C.: U. S. Global Change Research Program). Available at: https://science2017.globalchange.gov.
Vaughan, N. E., Gough, C., Mander, S., Littleton, E. W., Welfle, A., Gernaat, D. E. H. J., et al. (2018). Evaluating the use of biomass energy with carbon capture and storage in low emission scenarios. Environ. Res. Lett. 13, 044014. doi:10.1088/1748-9326/aaaa02
Vörösmarty, C. J., Melillo, J. M., Wuebbles, D. J., Jain, A. K., Ando, A. W., Chen, M., et al. (2023). Applying a framework to study climate-induced extremes on food, energy, and water systems (C-FEWS): The role of engineered and natural infrastructures, technology, and environmental management in the U.S. Midwest and Northeast. Front. Environ. Sci. (this issue [b]). (Special Issue on FEWS).
Vörösmarty, C. J., Melillo, J. M., Wuebbles, D. J., Jain, A. K., Ando, A. W., Chen, M., et al. (2023). The C-FEWS framework: Supporting studies of climate-induced extremes on food, energy, and water systems at the regional scale. Front. Environ. Sci. (this issue [a]). (Special Issue on FEWS) 11, 613 doi:10.3389/fenvs.2023.1069613
Vörösmarty, C. J., Moore, B., Grace, A. L., Gildea, M. P., Melillo, J. M., Peterson, B. J., et al. (1989). Continental scale models of water balance and fluvial transport: An application to south America. Glob. Biogeochem. Cycles 3 (3), 241–265. doi:10.1029/GB003i003p00241
World Meteorological Organization (2012). in Standardized precipitation index user guide, WMO-No. 1090. Editors M. Svoboda, M. Hayes, and D. Wood (Geneva, Switzerland: World Meteorological Organization).
Xia, Y., Mitchell, K., Ek, M., Sheffield, J., Cosgrove, B., Wood, E., et al. (2012). Continental-scale water and energy flux analysis and validation for the North American land data assimilation system project phase 2 (NLDAS-2): 1. Intercomparison and application of model products. J. Geophys. Res. Atmos. 117 (D3). doi:10.1029/2011jd016048
Keywords: forest carbon sequestration, forest biomass increment, forest biomass burning, forest carbon offsets, forest runoff, extreme climate effects, land-cover change, suburban expansion
Citation: Kicklighter DW, Lin T-S, Zhang J, Chen M, Vörösmarty CJ, Jain AK and Melillo JM (2023) Influence of forest infrastructure on the responses of ecosystem services to climate extremes in the Midwest and Northeast United States from 1980 to 2019. Front. Environ. Sci. 11:1069451. doi: 10.3389/fenvs.2023.1069451
Received: 13 October 2022; Accepted: 22 February 2023;
Published: 07 March 2023.
Edited by:
Graham Jewitt, IHE Delft Institute for Water Education, NetherlandsReviewed by:
Deb Raj Aryal, National Council of Science and Technology (CONACYT), MexicoCopyright © 2023 Kicklighter, Lin, Zhang, Chen, Vörösmarty, Jain and Melillo. This is an open-access article distributed under the terms of the Creative Commons Attribution License (CC BY). The use, distribution or reproduction in other forums is permitted, provided the original author(s) and the copyright owner(s) are credited and that the original publication in this journal is cited, in accordance with accepted academic practice. No use, distribution or reproduction is permitted which does not comply with these terms.
*Correspondence: David W. Kicklighter, ZGtpY2tsaWdodGVyQG1ibC5lZHU=
Disclaimer: All claims expressed in this article are solely those of the authors and do not necessarily represent those of their affiliated organizations, or those of the publisher, the editors and the reviewers. Any product that may be evaluated in this article or claim that may be made by its manufacturer is not guaranteed or endorsed by the publisher.
Research integrity at Frontiers
Learn more about the work of our research integrity team to safeguard the quality of each article we publish.