
94% of researchers rate our articles as excellent or good
Learn more about the work of our research integrity team to safeguard the quality of each article we publish.
Find out more
ORIGINAL RESEARCH article
Front. Environ. Sci. , 17 July 2023
Sec. Drylands
Volume 11 - 2023 | https://doi.org/10.3389/fenvs.2023.1067008
This article is part of the Research Topic Dryland Agriculture: Crop Adaptations, Increasing Yield and Soil Fertility View all 5 articles
 Caroline F. Ajilogba1,2*
 Sue Walker1,3*
Introduction: The impact of climate change on food production in South Africa is likely to increase due to low rainfall and frequent droughts, resulting in food insecurity in the future. The use of well-calibrated and validated crop models with climate change data is important for assessing climate change impacts and developing adaptation strategies. In this study, the decision support system for agrotechnology transfer (DSSAT) crop model was used to predict yield using observed and projected climate data.
Materials and Methods: Climate, soil, and crop management data were collected from wheat-growing study sites in Bethlehem, South Africa. The DSSAT wheat model (CROPSIM-CERES) used was already calibrated, and validated by Serage et al. (Evaluating Climate Change Adaptation Strategies for Disaster Risk Management: Case Study for Bethlehem Wheat Farmers, South Africa, 2017) using three wheat cultivar coefficients obtained from the cultivar adaptation experiment by the ARC-Small Grain Institute. The model was run with historical climate data for the eastern Free State (Bethlehem) from 1999 to 2018 as the baseline period. To determine the effects of climate change, the crop model simulation for wheat was run with future projections from four Global Climate Models (GCM): BCC-CSM1_1, GFDL-ESM2G, ENSEMBLE, and MIROC from 2020 to 2077.
Results: The average wheat yield for the historic climate data was 1145.2 kg/ha and was slightly lower than the highest average yield of 1215.9 kg/ha from GCM ENSEMBLE during Representative concentration pathways (RCP) 2.6, while the lowest yield of 29.8 kg/ha was produced during RCP 8.5 (GCM GFDL-ESM2G). Model GFDL-ESM2G produced low yields (29.8–47.74 kg/ha) during RCP 8.5 and RCP 6.0, respectively. The yield range for GCM BCC-CSM1_1 was 770.2 kg/ha during RCP 2.6 to 921.68 kg/ha during RCP 4.5 and 547.84 kg/ha during RCP 8.5 to 700.22 kg/ha during RCP 2.6 for GCM MIROC.
Conclusion: This study showed a declining trend in yield for future climate projections from RCP2.6 to RCP8.5, indicating that the possible impacts of higher temperatures and reduced rainfall in the projected future climate will slightly decrease wheat production in the eastern Free State. Adaptation measures to mitigate the potential impact of climate change could include possible changes in planting dates and cultivars. Using a crop model to simulate the response of crops to variations in weather conditions can be useful to generate advisories for farmers to prevent low yield.
Observations of the effects of climate trends on crop production indicate that climate change has already negatively affected wheat and corn yields in many regions as well as globally (FAO, 2015; Chandio et al., 2020; Saddique et al., 2020; Pequeno et al., 2021; Govere et al., 2022; Karatayev et al., 2022; Chandio et al., 2023). “Increasing temperatures and changes in precipitation are very likely to reduce cereal crop productivity. This will have strong adverse effects on food security” (Pachauri et al., 2014). Several studies have also observed this increase in temperature globally over the past decades (Kaushal et al., 2010; Hartmann et al., 2013; Van Wilgen et al., 2016; Masipa, 2017) and in South Africa (Kruger and Sekele, 2013; MacKellar et al., 2014). Within a period of 10 years (1997 and 2006), South Africa was observed to be 2% hotter and at least 6% drier compared to the 1970s. South Africa is one of the countries in Southern Africa that is prone to experience large impacts of climate variability as a result of a delay in implementation of adaptability strategies (IPCC, 2007). As agriculture is the mainstay of rural economies in South Africa, when crop production is adversely affected by climate change, it affects the whole community that is dependent on rain-fed agriculture (Thornton et al., 2011). As climate change variability increases, the impact on rainfed agriculture will increase and become a threat to crop production and food security in South Africa (Müller et al., 2011; Wheeler and Von Braun, 2013). This will lead to a decline in average annual yields of corn and wheat in particular, which are the staple foods of the majority of the population of South Africa (UNU-WIDER, 2016).
Therefore, it is important to determine the impact of global climate change on food production as the world is estimated to reach a population of approximately 10 billion by 2,100 (Boogaard et al., 2014; Chandio et al., 2023).
Wheat is the second most consumed grain crop after corn in South Africa (Nhemachena and Kirsten, 2017). It is one of the staple foods for the vast majority of the South African population and is also used for animal feed and alcohol beverage production (DAFF, 2010). In Africa, after Ethiopia, South Africa is the second largest producer of wheat, which is important for sustaining food security in the region. In South Africa, it is cultivated in 32 of the 36 crop-production regions (Nhemachena and Kirsten, 2017). Climate affects the top three wheat-producing provinces in different ways because they rely on different rainfall periods for production. In the Western Cape, dryland wheat uses winter rainfall; in the Free State, there are both dryland and irrigated wheat using stored summer rainfall, while wheat cultivated in the Northern Cape is under irrigation from the major rivers (Figure 1). In South Africa, approximately 25% and 75% of wheat production are from irrigated and dryland conditions, respectively, with 50% of this production coming from spring wheat grown under dryland conditions during winter in the Western Cape, while in the Northern Cape, spring wheat is grown along the main rivers under irrigation during winter months (Agri News Net Farming portal, 12 March 2020).
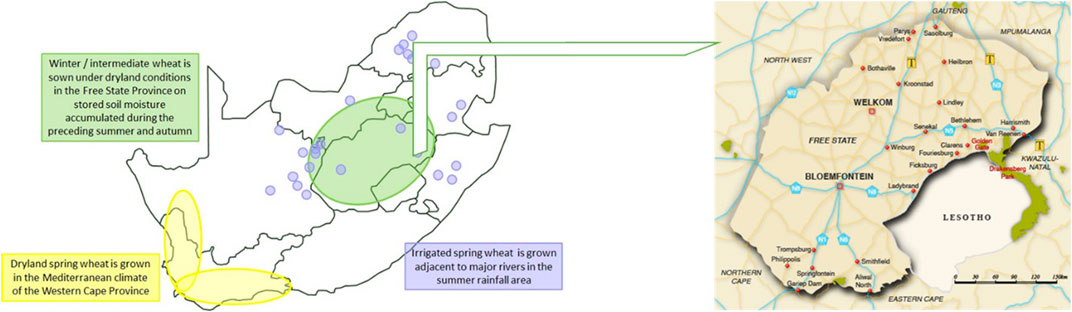
FIGURE 1. Wheat production is unique in South Africa, having three distinct wheat production areas: dryland in the Western Cape (yellow shading), widespread irrigated wheat north of the Orange River and concentrated in the Northern Cape, and dryland across the Free State (green shading), and a map of the Free State showing the Bethlehem location used in this study (Source: Roomforafrica (2023) and Agricultural Research Council (ARC-ISCW)).
South African wheat production increased by approximately 6.5% in 2021 compared to 2020, reaching about 2.3 million metric tons. With a total output of around 2.5 million metric tons in 2001, wheat production reached its peak. Furthermore, between 2000 and 2021, a decline in wheat production was observed in 2003, 2010, 2015, 2017, and 2019 (Statista, 2023). In the marketing year 2020/2021, the global production volume of wheat amounted to over 769 million metric tons, which means that 0.29% of global production was from South Africa. This makes South Africa's contribution to global wheat production as an African country very significant and any decline in production a major concern.
The relatively low production of wheat across Southern Africa is principally due to abiotic (drought and heat) and biotic (Russian wheat aphid, yellow rust, stem rust, septoria, and fusarium) stresses, which are increasing in intensity and frequency under climate change (Tadesse et al., 2019; Ajilogba and Walker, 2023). Furthermore, these significant declines can be linked to an increase in the price of wheat and increased domestic consumption (Statista, 2023). During the period 2015–2017, severe drought was experienced in Southern Africa and South Africa in particular.
The drought’s implications on wheat yield have been inconsistent, but they are all significant. The 2016 season yields were comparable to those of 2013, and the total national yield improved by 30% year over year (compared to 2015) and by 13% above the 3-year average (Western Cape Department of Agriculture, 2017). However, a significant decrease in yield was observed in 2015/2016 and 2017/2018 because of the drought. Record losses in wheat production were observed with a 47% decline from 1.1 million tons in 2016/2017 to 586,000 tons in 2017/2018 (Western Cape Department of Agriculture, 2018). The significant decrease in yield in 2017/2018 can be attributed to climate change because of drought leading to below-average rainfall and very low soil moisture in parts of the Western Cape (Archer et al., 2019).
During the drought period (2015–2016), wheat exportation in South Africa dropped by 76% (SADC, 2016). The drought was felt most in the Western Cape as it is the largest wheat-growing province in South Africa with over 90% dryland wheat cultivated (Otto et al., 2018). The second largest wheat-producing province is the Free State (Figure 2), which has a blend of both dryland and irrigated wheat production (where dryland wheat is the predominate method of production but irrigated wheat accounts for more than 50% of the total yield) (Tadesse et al., 2019).
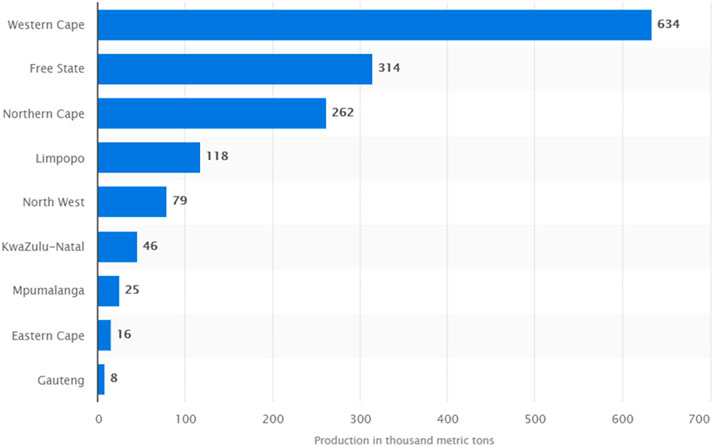
FIGURE 2. Wheat production in South Africa by province in 2019 (in 1,000 metric tons) (Source: Galal, 2021).
The drought scenario differed significantly from the yields observed after the drought. In the 2019 production year, the aggregate production of wheat in South Africa was roughly 1.5 million metric tons. The province with the highest production volume was Western Cape with 634 thousand metric tons. This accounts for approximately 42.2% of the total South African wheat production (Galal, 2021) (Figure 2).
Westhuizen and Trapnell (2015) observed a decline in the area of the cultivation of wheat in South Africa. Within a space of 32 years (1982–2014), the area of cultivated land for wheat in South Africa declined from over two million hectares of wheat to 482,000 ha. This is mostly the scenario in the summer rainfall region or the eastern Free State in particular (Figure 3). Some of the factors responsible for this decline of over 30 years have been linked to the cultivation of more favorable alternative crops, issues of profitability, and risk of production (DAFF, 2012).
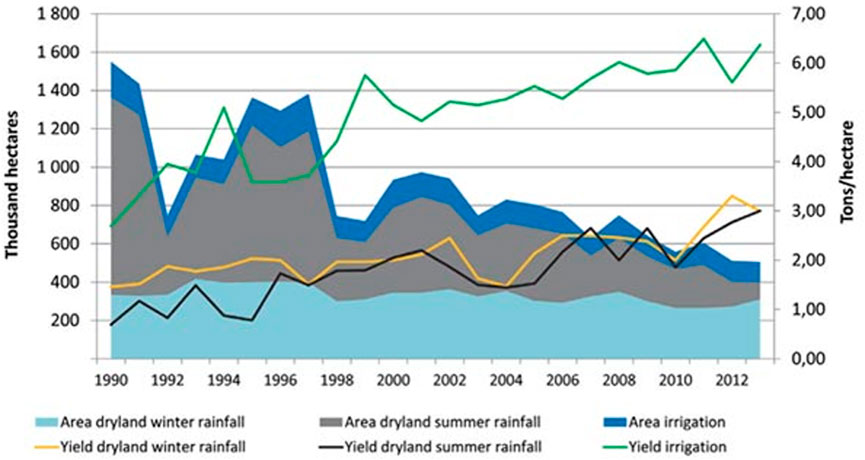
FIGURE 3. Areas of production for wheat and yield per hectare for dryland and irrigated regions of South Africa. Source: Westhuizen and Trapnell (2015) in Grain SA.
As part of the forecast from Bureau for Food and Agricultural Policy (BFAP), in 2024, only 100 kha of wheat will be grown using irrigation and only 250 kha will be grown in the winter rainfall areas compared to 326 kha in 2017. In the Free State, prospects of sufficient rain to cultivate wheat under dryland conditions are unsustainable and no expansion in wheat plantings is expected (Gouws, 2018). This is a clear indication that wheat imports will increase; it is estimated that by 2024, approximately 2.5 million tons of grain will come from abroad. Based on these findings, a change in the cultivar release criteria was recommended by BFAP to allow seed growers the opportunity to breed cultivars for better yield potential, instead of focusing only on wheat quality. (BFAP, 2018; Gouws, 2018). This makes it important to look at the agroclimatic modeling of wheat to determine crop yield and production beforehand (Wallace, 2013).
Crop simulation models can help determine the effect of climate change and its variability on the growth and development of plants because they incorporate the complex relationships between soil-water and plant-atmosphere. Some of the crop models developed for different crops and in particular wheat include DSSAT (Jones et al., 2003), APSIM (Keating et al., 2003), AquaCrop (Vanuytrecht et al., 2014), and STICS (Brisson et al., 2003). These models have been studied to be effective in simulating different management practices such as irrigation and fertilizer (nitrogen) management (Asseng et al., 2012; He et al., 2012), grain yield and quality forecasting (Asseng et al., 2002; Asseng and Milroy, 2006; de Wit and van Diepen, 2007; Li et al., 2018) and climate change evaluation (Angulo et al., 2013; Fan and Shibata, 2014). The decision support system for agrotechnology transfer (DSSAT) (Hoogenboom et al., 2004; Hoogenboom et al., 2012) is a robust decision support system (DSS) for evaluating management options. The simulation model of the cropping system (CSM) included in DSSAT v4.5 (Jones et al., 2003; Hoogenboom et al., 2004) is process oriented and dynamic and simulates growth, development, and yield for over 25 different crops.
The CERES (Crop Estimation through Resource and Environment Synthesis) cereal model is used to present the way cereal crops including wheat respond to different environmental and climatic factors based on their growth and development (Ritchie et al., 1985). Determining the impact of different management practices and future climate scenarios on wheat crop yield is possible using DSSAT-CSM-CERES. Several authors have also observed that the use of DSSAT-CSM-Wheat has helped to determine the best agricultural management strategies that can improve crop production within the constraints of different climatic and economic uncertainties (Ritchie et al., 1985; Jones et al., 2003; Hoogenboom et al., 2004; Thorp et al., 2010; Dettori et al., 2011; Attia et al., 2016; Li et al., 2018; Sar and Mahdi, 2019).
The model is parameterized using various agronomic parameters (phenological growth, accumulation of dry matter, leaf area index, physiological indices, and grain yield) and daily climate data (Table 1). Model efficiency is evaluated using model validation competency scores including d-stat, RMSE, and R2.
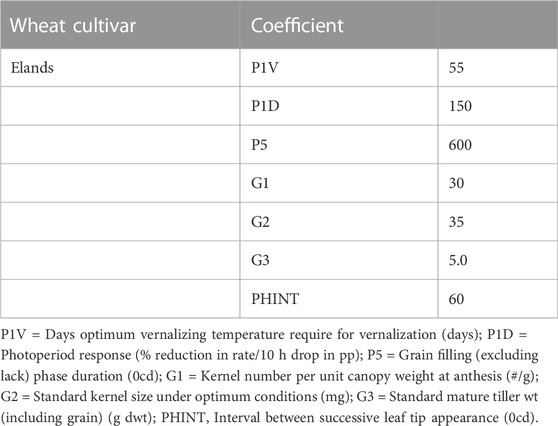
TABLE 1. Genetic coefficients of the South African wheat cultivar Elands used in wheat yield simulation at Bethlehem (Adapted from Serage 2014).
While crop models are important tools in simulating crop growth processes and yields (Yang et al., 2018), future climate change conditions are being projected using global climate models (GCMs) (Stocker et al., 2013). Therefore, coupling both crop models and GCM together will make it possible to determine the impact of these projected future climate conditions on the production of different crops especially staples of different regions (Stevens and Madani, 2016; Lizumi et al., 2017). Generally, the simulation of future climate change scenarios by GCMs is complex (Moss et al., 2010b) given the various interactions between the meteorological, physical, and biogeochemical factors of changing atmospheric composition and radiative forcing (Taylor et al., 2012).
With the limitations presented by the inherent complexities in agro-climatic modeling, this study helps to highlight areas given different climate scenarios, where climate change may be expected to have negative and positive impacts on the production of wheat, as well as potential adaptation and policy recommendations to mitigate these impacts.
To assess the potential impacts of climate change on wheat production in the Free State, the use of appropriate downscaled climate data and production models is required.
Therefore, in this study, in order to determine the impact of climate change in the near and mid-future for one of the important dryland wheat cultivation areas in South Africa, the Free State, the DSSAT wheat crop model was applied with input from four GCMs: RCP 2.6, RCP 4.5, RCP 6.0, and RCP 8.5.
Bethlehem is located in the eastern part of the Free State with a geographical location of a latitude of -28.16277 and a longitude of 28.29733 and an elevation of 1721 m above mean sea level, Bethlehem (Figure 1). Bethlehem normally receives approximately 506 mm of rain per year, with most rainfall occurring mainly during mid-summer (South African Weather Service, 2021; ARC-NRE, 2019). It receives the lowest rainfall amount (1 mm) in July and the highest (90 mm) in January (ARC-SCW, 2018). The monthly distribution of average daily maximum temperatures shows that the average midday temperatures for Bethlehem range from 15°C in June to 26.2°C in January (ARC-SCW, 2018; Biome South Africa, 2022). The region is the coldest during June when the temperature drops to 0°C on average during the night. In the eastern Free State, the dominant soils are those with plinthic horizons of the group C land types in a fairly broad strip from Tweespruit in the south to Lindley in the north, and the group B land types in another strip including Ladybrand, Bethlehem, Warden, and Harrismith.
The DSSAT model was used to simulate and estimate wheat yield as a prediction using Global Climate Model (GCM) data projection for Bethlehem areas of South Africa in order to test and develop adaptation and mitigation measures.
A crop simulation model CROPSIM - CERES (CSCER047) embedded in the DSSAT-Version 4.6 (Jones, et al., 2003) was used to simulate wheat under rainfed conditions. The DSSAT model requires, at minimum, climate data, soil environment data, gene/cultivar coefficient data, and management data (Jones, et al., 2003; Basso et al., 2013). For the biophysical crop modeling protocol, climate and soil data requirements were provided from the Agromet Database at the Agricultural Research Council, Natural Resources and Engineering (ARC-NRE) and Landtypes maps, respectively. Wheat crop management practices were obtained from the literature (Visser, 2014).
The climate data, maximum and minimum temperature (°C), daily rainfall (mm), and solar radiation (MJm2d−1) for 20 years (1999–2018) were obtained from the automatic weather station network of the ARC-NRE, Arcadia, Pretoria, South Africa. The raw data was compiled in MS Excel and missing data gaps were filled by using climate data extrapolation software and were again converted to the format of the DSSAT to form the baseline dataset from observed climate data.
For future climate data, the CCAFS-Climate data portal was used to generate and retrieve the models used in this study. CCAFS-Climate provides global and regional future high-resolution climate datasets that serve as a basis for assessing the climate change impacts and adaptation in a variety of fields including biodiversity, agricultural and livestock production, and ecosystem services and hydrology (http://ccafs-climate.org/data_bias_correction/) (Navarro-Racines et al., 2020). For the future period, four Global Climate Models (GCMs) were used: BCC-CSM1_1, ENSEMBLE, GFDL-ESM2G, and MIROC. These models were under the ‘very stringent’ concentration pathway and peak scenario RCP 2.6 (with radiative forcing level reaching 3.1 W/m2 by mid-century but returning to 2.6 W/m2 by 2,100), the intermediate concentration pathway RCP4.5 (with radiative forcing expected to stabilize at 4.5 W/m2 by 2,100), the stabilization scenario RCP6.0 (with total radiative forcing stabilized at 6.0 W/m2 by 2,100), and the high concentrations pathway RCP8.5 (with radiative forcing which is expected to reach 8.5 W/m2 by 2,100) (Moss et al., 2010a; Riahi et al., 2011; Rurinda et al., 2015; Taylor, 2009.). These were generated in the format required by the crop model. The baseline observed and simulated climate data were then entered directly into the DSSAT cropping system model.
Soil data include physical and hydrological properties of the local soil provided from Land Types of the Map 2,728 Frankfort, 2,828 Harrismith Memoir 28 October 2002. The chemical properties of the soil were lacking in this soil data information. However, the model was able to calculate the soil nitrogen content with the available data input.
Crop management data were collated from different postgraduate theses from the University of the Free State (UFS) and the University of KwaZulu Natal (UKZN). The UFS Research space (https://scholar.ufs.ac.za/handle/11660/5/discover) was searched for e-theses/dissertations. The keyword ‘wheat’ was searched in the Agricultural and Science Faculty, resulting in 353 theses from which 10 e-theses were selected with relevant information for this study, based on the titles and abstract having the word ‘wheat’ or not, having ‘South Africa’ and/or ‘Bethlehem’ and ‘Agronomy issues’, and not ‘nutrient composition’ etc.
The same procedure was carried out on the Research space of UKZN (https://researchspace.ukzn.ac.za/handle/10413/6523/discover)–389 theses were found but only one thesis had ‘crop management practices’, and was not a ‘pot experiment’ or a ‘greenhouse experiment’ and whose field experiment was located in Bethlehem.
General selection criteria are based on the following: if the study was on wheat or not; locations of the study and/or places close by or compound names. For example, in an e-thesis from UFS, the location should be Bethlehem or other locations close to it. The final e-theses were further streamlined to be sure they had some basic information as detailed in Supplementary Appendix S1.
Serage (2017) calibrated and validated the DSSAT CROPSIM-CERES using three wheat cultivars whose coefficients were obtained from the cultivar adaptation experiment of the Agricultural Research Council - Small Grains Institute (ARC-SGI, 2013). These parameters were used as DSSAT model parameters to represent the South African wheat cultivars, realistic response to soil and atmospheric conditions, and management practices. After the entry of data for climate, management, soil, and crop information into the model, the experimental mode in DSSAT was used to simulate continuous wheat yield for the periods under investigation.
Simulation experiments were carried out in the DSSAT model by imputing three sets of experimental datasets. These are the soil parameters that include the physical and chemical properties of soil (calculated by DSSAT) and the geographical locations of the experimental area. Crop management practices parameters were imputed and included the cultivar type (Table 1), planting dates, fertilizer type, quantity, irrigation type, and volume (Table 2). The third parameter set is the climate dataset in which both historic and future climate scenarios datasets were used.

TABLE 2. Crop management practices used in DSSAT for wheat yield simulation at Bethlehem.
Historic weather data spanned from 1999 to 2018 (20 years). Total precipitation was highest in January 2010 with 286.76 mm of rainfall. The lowest rainfalls were experienced between April and September throughout the 20 years with the lowest as 0 mm of precipitation in 14 different years (August 2020 June 2001, July 2002 June 2005, July 2006, July and August 2007, August and September 2008, July and September 2010 May 2012, June and July 2013, June and July 2014 August 2015, July 2017 June 2018), while the remaining 6 years had varying amounts of rainfall throughout each year.
The highest mean maximum temperature in the historic data was observed in December 2015 at 31.44°C, while the lowest was observed in July 2011 at 14.33°C. In the same regard, the highest mean minimum temperature was observed in February 2006 with a temperature of 15.07°C, while the lowest mean minimum temperature was observed in July 2016 with a temperature of −3.77°C. Solar radiation ranged from 28.03 MJm2d-1 in January 2018 as the highest to −70.28 MJm2d-1 in June 1999 as the lowest (Figure 4).
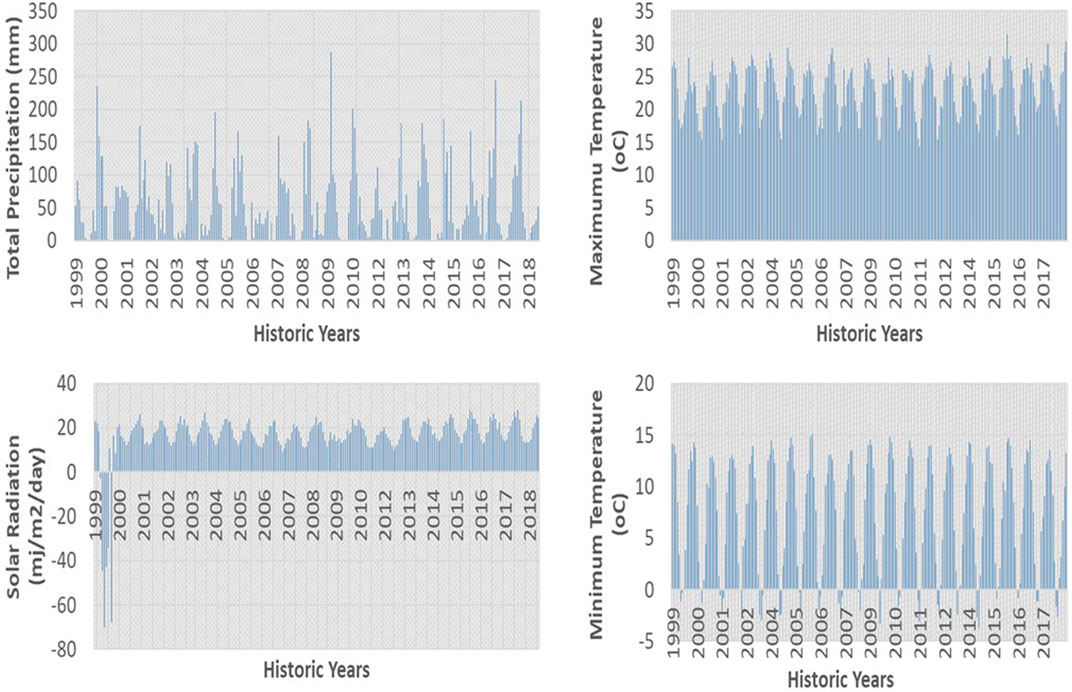
FIGURE 4. Total precipitation, maximum temperature, minimum temperature, and solar radiation for historic years from 1999 to 2018 in Bethlehem, Free State.
The highest total monthly precipitation of 185.176 mm was observed in January 2060, while months from April to September throughout the future years had 0 mm of precipitation using the GCM model BCC-CSM1_1. The month of February 2052 recorded the highest monthly mean maximum temperature of 32.43°C, while July 2064 had the lowest of 15.08°C. It was observed that January 2062 recorded the highest mean minimum temperature of 17.17°C and the lowest was observed in July 2064 with −1.78°C. Solar radiation was similar to the maximum temperature both in date and quantity of 33.04 MJm2d-1 which was highest in December 2065 and lowest of 7.28 MJm2d-1 in July 2052. The month of July was seen to have the lowest solar radiation, and maximum and minimum temperature occurred in the years 2052, 2064, and 2064, respectively (Figure 5).
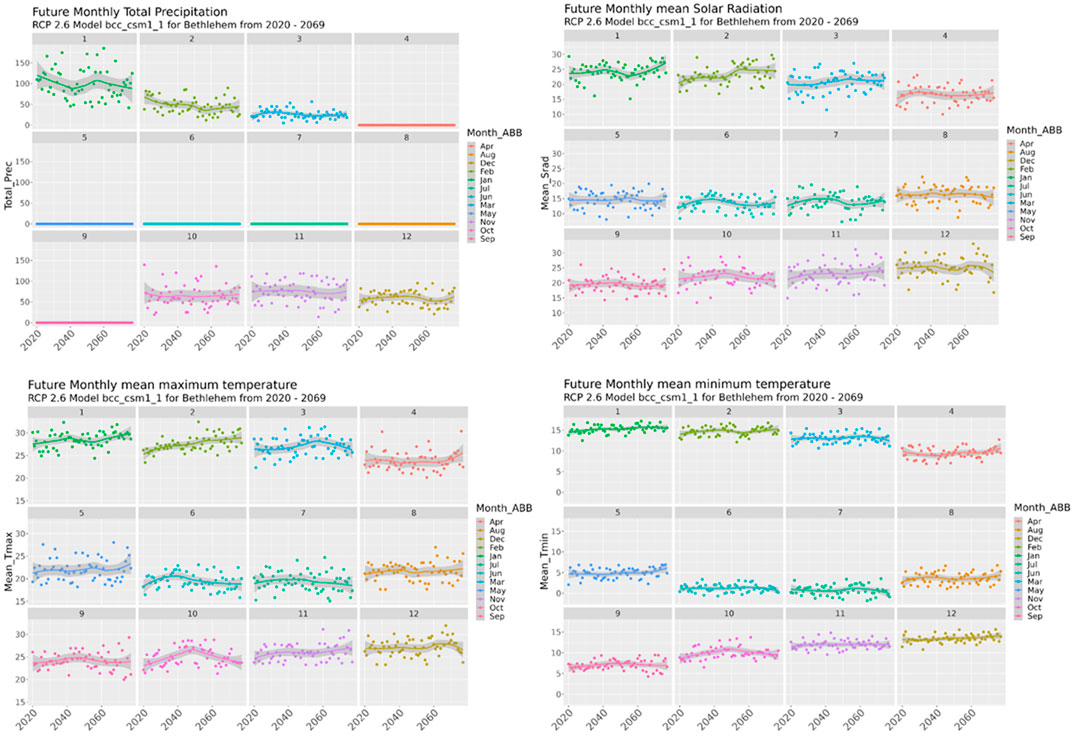
FIGURE 5. Future monthly total precipitation, mean solar radiation, mean maximum temperature, and mean minimum temperature for Bethlehem from 2020 to 2077 for BCC-ESM1_1 at RCP 2.6.
Global climate model ENSEMBLE revealed that the highest total precipitation of 103.57 mm was observed in November 2021 and the lowest was 0 mm from May to August (4 months of 0 mm of precipitation as compared to model BCC-ESM with 6 months of 0 mm of precipitation). The highest mean for maximum temperature 30.39°C was observed in January 2038, while the lowest was 17.60°C in June 2021. The highest mean minimum temperature of 16.32°C was observed in January 2055, while in July 2032, the lowest, −0.62°C, was observed. The highest and lowest minimum temperatures of model ENSEMBLE were observed in the same month as that of model BCC-ESM1_1. In December 2046, the highest solar radiation of 29.30 MJm2d-1 was observed, while the lowest, 11.63 MJm2d-1, was observed in June 2028 (Figure 6).
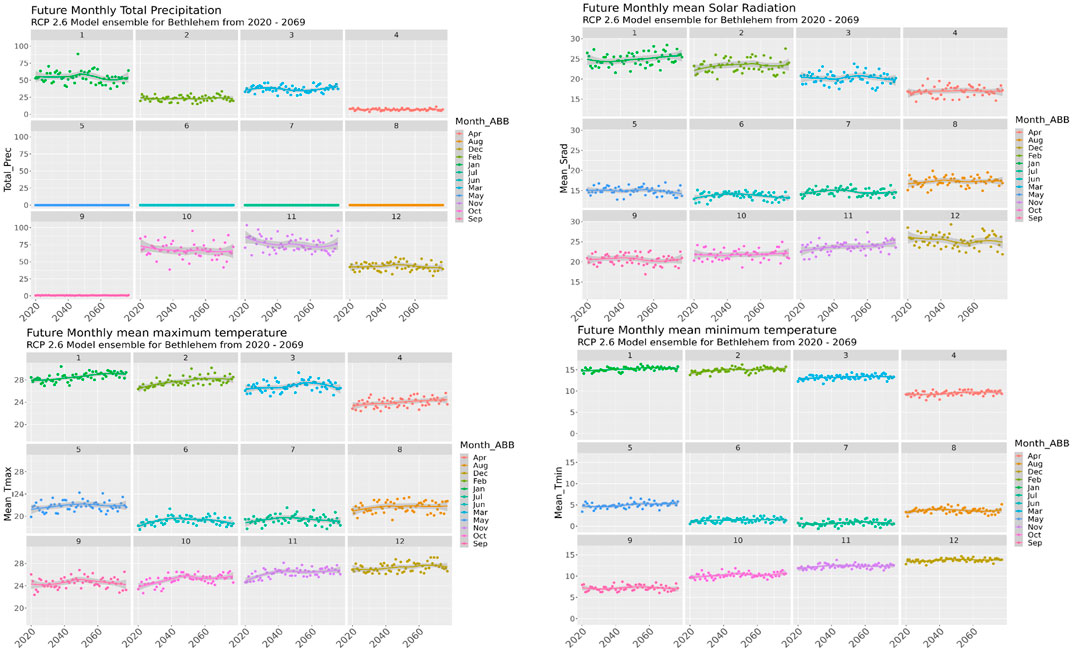
FIGURE 6. Future monthly total precipitation, mean solar radiation, mean maximum temperature, and mean minimum temperature for Bethlehem from 2020 to 2077 for GCM ENSEMBLE at RCP 2.6.
The total precipitation using the GCM model GFDL-ESM2G in RCP 2.6 was the lowest among the 4 GCMs used in this study. The highest total precipitation of 3.23 mm was observed in April 2073. There were only 4 months of precipitation, which included March and April, October and November, while December to February and May to September were 0 mm of precipitation even though in some of the years there was a little above 0 mm of precipitation in February. The highest maximum and minimum temperatures of 31.0°C and 17.23°C were observed in January 2029 and February 2021, respectively, while the lowest maximum and minimum temperatures of 16.28°C and −2.17°C were observed in July 2062 and 2069, respectively. Solar radiation was highest in December 2046 with 29.30 MJm2d-1 and lowest with 11.63 MJm2d-1 in June 2028 (Figure 7).
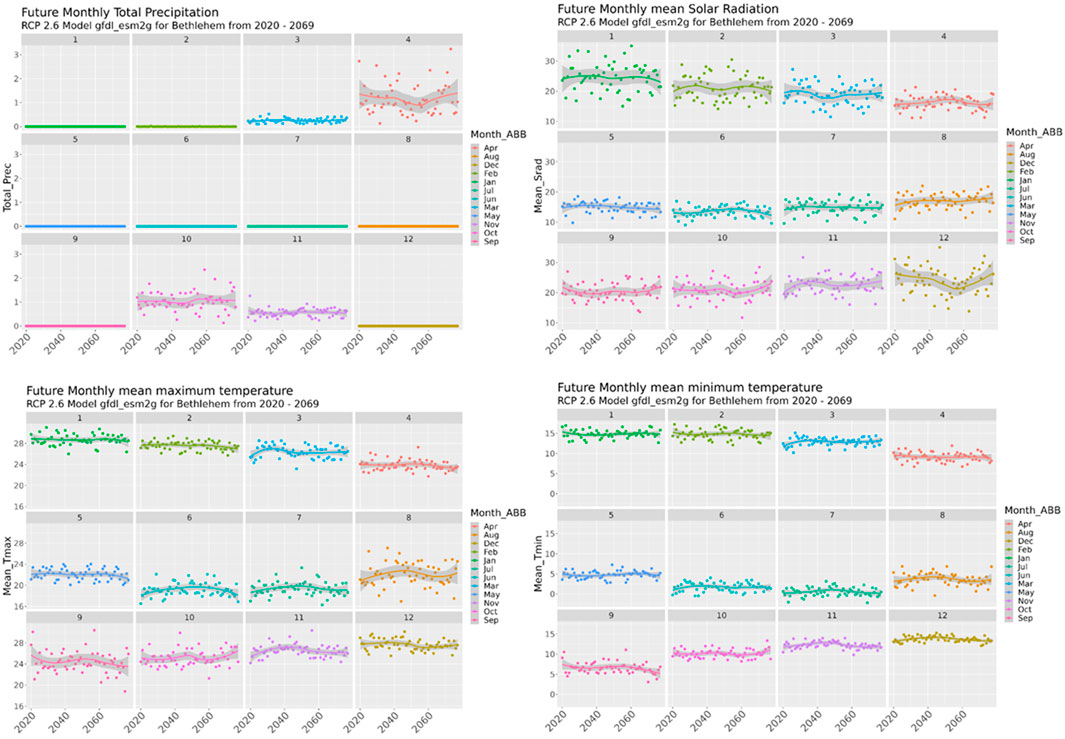
FIGURE 7. Future monthly total precipitation, mean solar radiation, mean maximum temperature, and mean minimum temperature for Bethlehem from 2020 to 2077 for GCM GFDL-ESM2G at RCP 2.6.
The months from April to August and most months of February had zero precipitation. Apart from the highest total precipitation of 146.71 mm observed in October 2033, the highest solar radiation of 31.83 MJm2d-1, the maximum temperature of 32.59°C, and the minimum temperature of 17.82°C were all observed in January 2053. However, the lowest solar radiation of 8.73 MJm2d-1 was observed in June 2050, while the lowest maximum and minimum temperatures of 17.70°C and −1.47°C were observed in July 2030 and 2028, respectively (Figure 8).
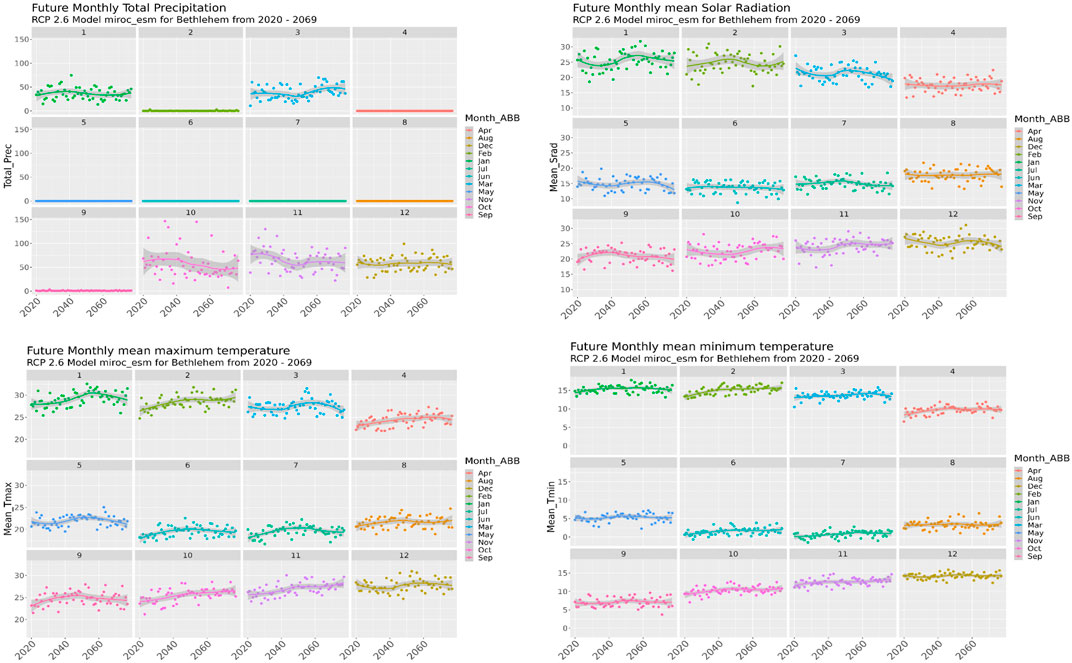
FIGURE 8. Future monthly total precipitation, mean solar radiation, mean maximum temperature, and mean minimum temperature for Bethlehem from 2020 to 2077 for MIROC_ESM at RCP 2.6.
A comparison of the historical climate data with the future data for wheat production showed either an increasing or a decreasing trend across each climatic condition. The value of precipitation decreased with respect to historical data; however, tmax, tmin, and srad increased (Figure 9).
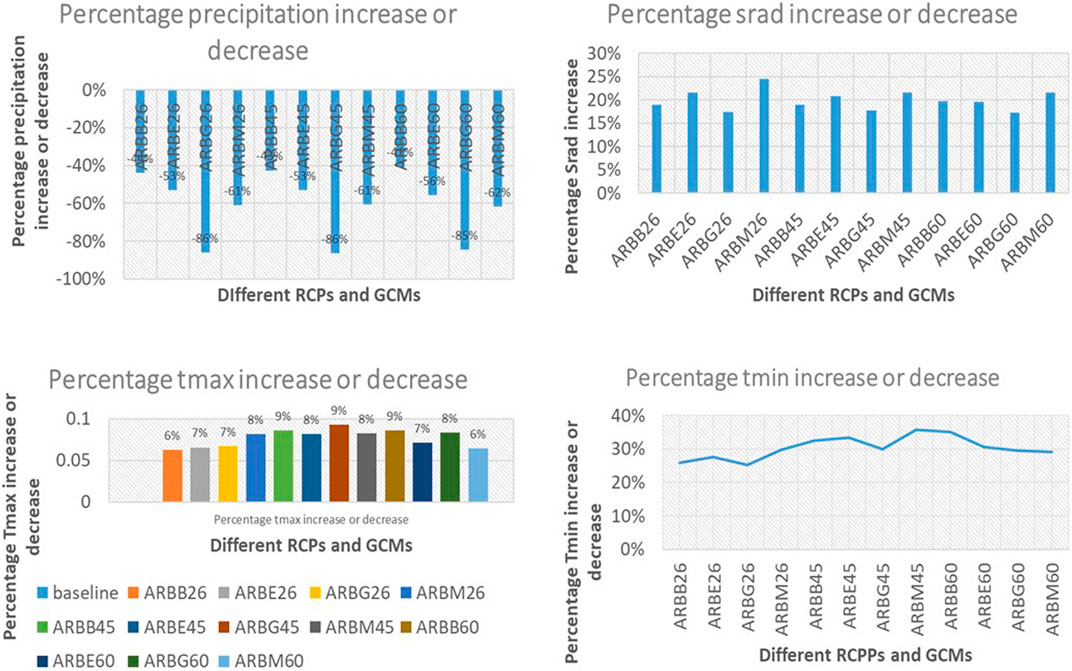
FIGURE 9. Percentage precipitation, srad, tmax, and tmin increased or decreased compared with baseline weather data.
The average wheat grain yield for the historic climate data in 2018 was 1,145.2 kg/ha, which was slightly lower than the highest average yield of 1,215.9 kg/ha from GCM ENSEMBLE. This could be because the DSSAT model did not produce the yields for both 1999 and 2018, making it an 11.4% increase in yield against the baseline yields. The percentage increase was observed only during the early century using GCM ENSEMBLE and RCP 2.6 (6%) and RCP 4.5 (3%). Wheat grain yield considerably decreased throughout the century for all RCPs and all other models, with GFDL-ESM2G the lowest-performing model in this study (Figure 10; Figure 11A, B).
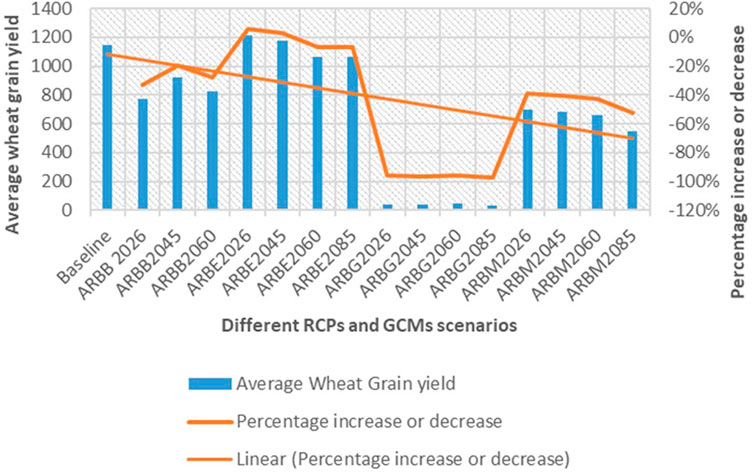
FIGURE 10. Percentage increase or decrease in wheat yield from baseline yield using 4 GCM models and RCP 2.6, RCP 4.5, and RCP 6.0 scenarios. ARBB2026 = GCM model BCC-CSM1_1 at RCP2.6; ARBB 2045 = GCM model BCC-CSM1_1 at RCP4.5; ARBB 2060 = GCM model BCC-CSM1_1 at RCP6.0; ARBB 2085 = GCM model BCC-CSM1_1 at RCP8.5.ARBE2026 = GCM model ENSEMBLE at RCP2.6; ARBE2045 = GCM model ENSEMBLE at RCP4.5; ARBE2060 = GCM model ENSEMBLE at RCP6.0; ARBE2085 = GCM model ENSEMBLE at RCP8.5.ARBG2026 = GCM model GFDL-ESM2G at RCP2.6; ARBG2045 = GCM model GFDL-ESM2G at RCP4.5; ARBG2060 = GCM model GFDL-ESM2G at RCP6.0; ARBG2085 = GCM model GFDL-ESM2G at RCP8.5.ARBM2026 = GCM model MIROC at RCP2.6; ARBM2045 = GCM model MIROC at RCP4.5; ARBM2060 = GCM model MIROC at RCP6.0; ARBM2085 = GCM model MIROC at RCP8.5.
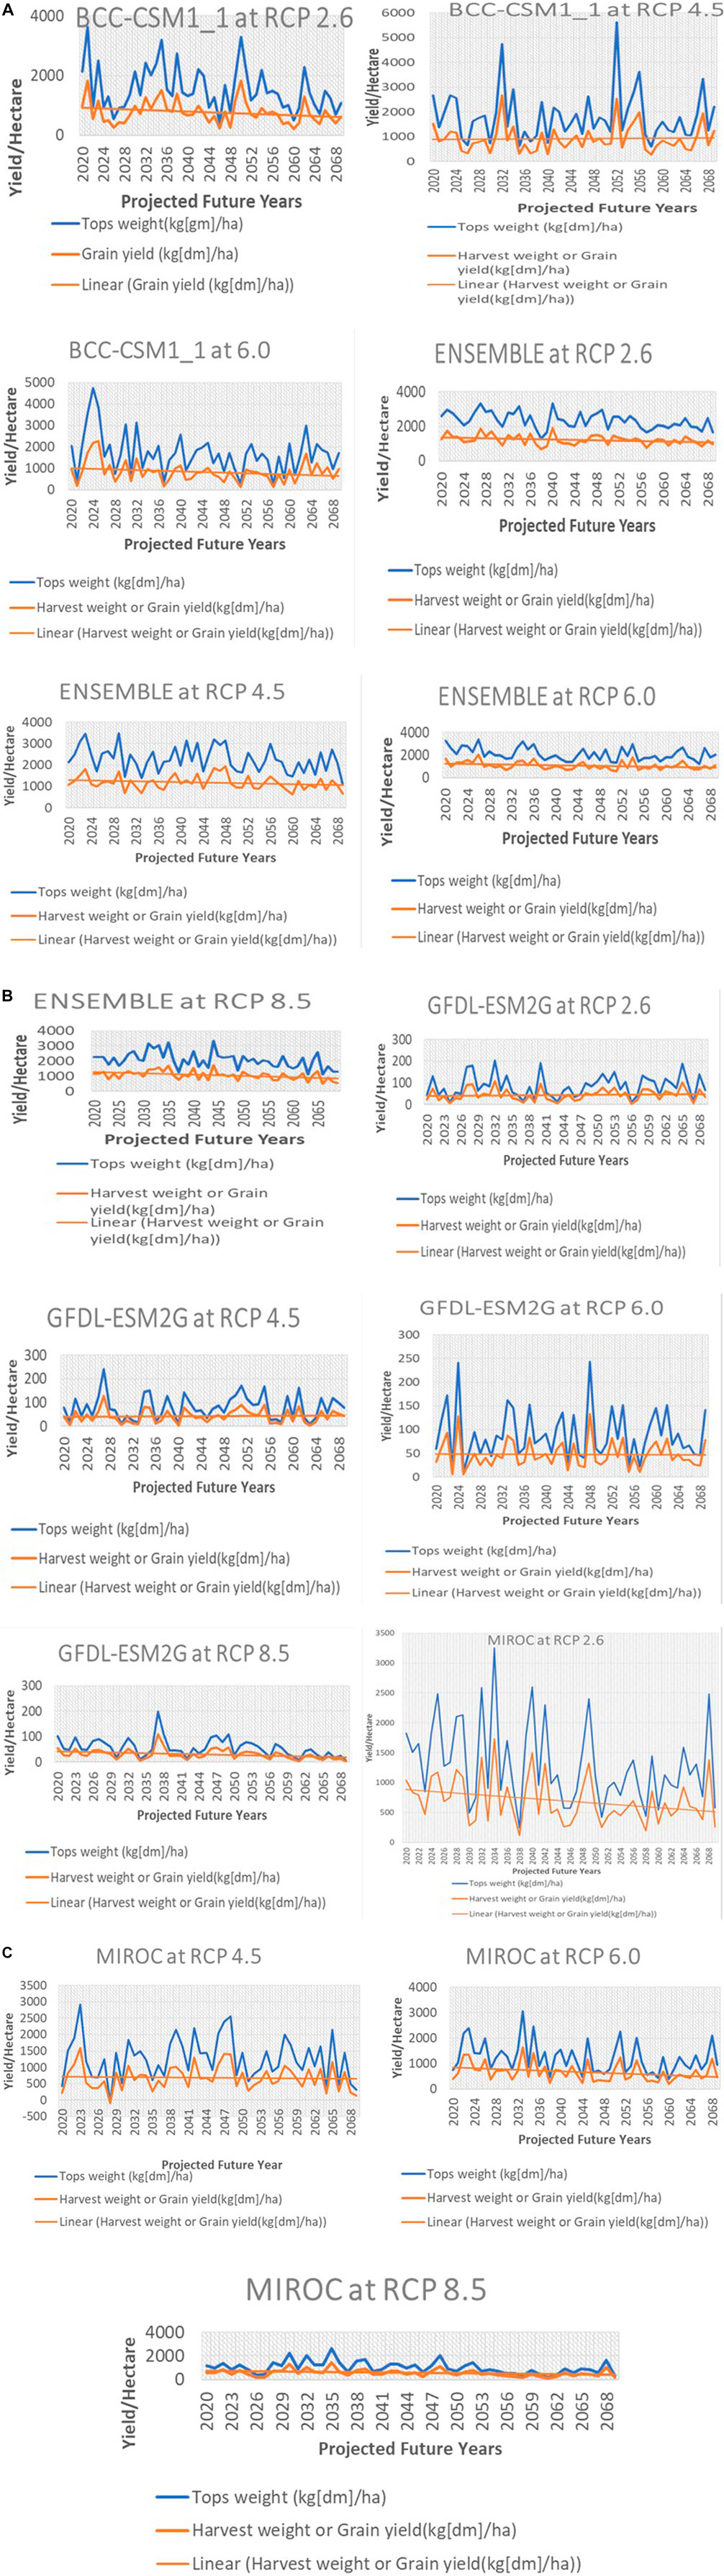
FIGURE 11. A Wheat grain yield and top weight for future years for GCM models BCC-CSM1_1, ENSEMBLE, GDFL-ESM2G, and MIROC at RCP 2.6, 4.5, 6.0, and 8.5 from 2020 to 2069.11 B Wheat grain yields and top weight for future years for GCM models BCC-CSM1_1, ENSEMBLE, GDFL-ESM2G, and MIROC at RCP 2.6, 4.5, 6.0, and 8.5 from 2020 to 2069.11 C Wheat grain yields and top weight for future years for GCM models BCC-CSM1_1, ENSEMBLE, GDFL-ESM2G, and MIROC at RCP 2.6, 4.5, 6.0, and 8.5 from 2020 to 2069.
The average grain yields from the GCM model GFDL-ES2M for RCP 2.6, 4.5, 6.0, and 8.5 had the lowest yields of 44.56, 42.28, 47.74, and 29.8 kg/ha respectively. Also, the average grain yield from GSM ENSEMBLE for RCP 2.6, 4.5, 6.0, and 8.5 had the highest yields of 1,215.9, 1,177.6, 1,066.66, and 1,064.38 kg/ha respectively. However, the average grain yields from GCM model BCC-ESM1_1 for RCP 2.6, 4.5, 6.0, and 8.5 had yields of 770.2, 921.68, and 824.16 kg/ha (with no complete yield data for RCP 8.5), respectively, while the average grain yield from GSM model MIROC for RCP 2.6, 4.5, 6.0, and 8.5 had yields of 700.22, 682.8, 658.9, and 547.84 kg/ha respectively. This shows that the average yield from the GCM ENSEMBLE was better than the other GCM models with the highest yield at RCP 2.6 of 1,215.9 kg/ha. GCM GFDL-ESM2G of RCP 8.5 had the least average yield of 29.8 kg/ha.
The average cumulative grain yield from GSM ENSEMBLE for all RCP had the highest cumulative yield of 4,524.54 kg/ha, GCM MIROC for all RCP had 2,589.76 kg/ha, while that of BCC-ESM1_1 had the lowest cumulative yield of 2,516.04 kg/ha (Figures 11A,B, 12). The average cumulative grain yield for RCP 2.6 for all GCM models had cumulative yields of 2,730.88 kg/ha, RCP 4.5 for all GCM models had the highest yield of 2,824.36 kg/ha, while that of RCP 6.0 for all GCM models had the least cumulative yield of 2,597.46 kg/ha (Figures 11B,C, 12).
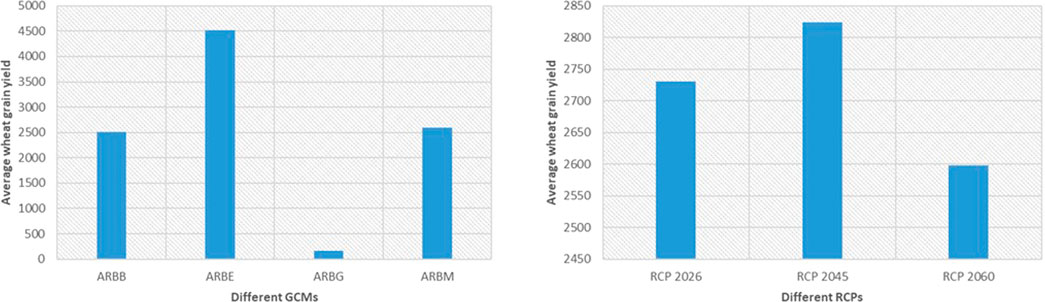
FIGURE 12. Sum of average wheat grain yield at different GCM models and RCPs. ARBB = GCM model BCC-CSM1_1; ARBE = GCM model ENSEMBLE; ARBG = GCM model GFDL-ESM2G; GCM model MIROC. RCP 2026 = GCM Scenario at RCP2.6; RCP 2045 = GCM Scenario at RCP4.5; RCP 2060 = GCM Scenario at RCP6.0.
The average wheat grain yield for the historic climate data in 2020 was 1,534 kg/ha, which was slightly higher than the highest average yield of 1,215.9 kg/ha from GCM ENSEMBLE.
This is the first time that secondary data can be harnessed for farm management practices to study the impact of climate change on wheat using the DSSAT model with future scenarios.
The change in climate has implications for any natural resource systems that are sensitive to climate, such as agriculture, fishery, animal husbandry, and forestry. With agriculture being at the forefront of food systems, it is imperative to note that changes in climatic factors such as temperature, precipitation, and solar radiation would severely impact crop yield (Tao et al., 2014). This study applied the DSSAT crop model and GCM coupled with four different RCPs to observe the impact of future climate on wheat productivity.
In our study, using the DSSAT crop simulation model, the wheat grain yield in Bethlehem increased by 6% and 3% under RCP 2.6 and RCP 4.5 using GCM ENSEMBLE for the 2020–2069 projections. This result agreed with a previous study, which found that high temperatures increased wheat yield by 0.9%–12.9% in northern China (Tao et al., 2014). Also, Zheng et al. (2020) corroborated this with a projected increase in yield for wheat between 2.8% and 14.8% under RCP 4.5, 6.0, and 8.5 at the Guanzhong Plain in northwest China. According to Smith et al. (2013) on the Canadian Prairies, spring wheat and winter wheat are estimated to increase by 37% and 70%, respectively, in the 2050 s. This is quite high compared to the results from this study. Wang et al. (2012) noted that the projected yield increase could be overestimated because crop models did not often simulate the effects of heat stress properly.
Average wheat yield was projected to decrease within the range of 20%–96% under RCP 4.5 and by 7%–97% under RCP 6.0 and RCP 8.5 during GCM GFDL when compared to the baseline. Tao et al. (2014) also reported that wheat yields were projected to decrease by 1.2%–10.2% in southern China. This means that an increased or decreased projection might depend on location and varying climatic conditions. In future climate scenarios, temperature (both Tmin and Tmax) and solar radiation followed a rising trend (Xiao et al., 2018); conversely, the wheat yield followed a declining trend similar to Zheng et al. (2020), who reported a 0.3%–6.5% decrease but was dependent on planting dates. Deryng et al. (2014) also observed in a study conducted in Canada that because of the projected heat stress under climate scenarios in the future, the wheat yield that was projected would also decrease even though there were huge disparities in climate across the regions. This is because warmer temperatures accelerate the development of phenology in wheat, leading to reduced opportunity for the plant to take up nutrients and causing radiation interception. This means that the duration of the growth and development of the plant is also reduced. When this happens during the growing season, there is also a reduction in the biomass produced and invariably reduced grain production in quantity and quality (Juknys et al., 2017).
All 4 GCM climate change scenarios were consistent in the projected direction of change in temperatures. Average temperature increases were projected to range from 6% to 9% over the 4 GCM scenarios. Generally, higher temperature increases are projected for GCM GFDL-ESM2G and BCC-ESM1_1, while lower for GCM ENSEMBLE and MIROC. All climate scenarios indicated decreased total precipitation and followed the same decreasing trend, similar to the case reported by Waffa and Benoit, (2015).
However, in order to resolve the lack of certainty involved in simulating wheat yields under climate change, Asseng et al. (2013) used 27 different wheat models and observed that the variability in crop models contributed significantly to the unpredictability of climate change impact forecasts compared to the variability in downscaled GCMs.
As model evaluations and modifications become more prevalent, this unpredictability should be considered, and additional models may be employed in subsequent studies (Rosenzweig et al., 2013). Only one crop model was used in this study, and the projected yield increase or decrease in Bethlehem dry land wheat in South Africa could have been overestimated or underestimated for the current wheat cultivar (Wang et al., 2012). However, comparison using different crop models is beyond the scope of this paper.
Farm management practices in this study are assumed to be the same throughout the century; therefore, the cultivar used is that which has been validated in the field by Serage (2017). In future scenarios, the average grain yields would decline by 20%–33% under GCM BCC-ESM1_1, 96% under GCM GFDL-ESM2G, and between 39% and 42% under GCM MIROC.
The projected future high temperatures could shorten the growing season for the current wheat cultivar. This means that the time needed for grain filling will be reduced, which may result in a decrease in yield because of heat stress, making it important for future cultivars to be improved with regard to heat resistance/tolerance (Wang et al., 2012). Crop cultivars with higher potential yields have not been extensively studied in research on the effects of climate change. However, according to Smith et al. (2013), new cultivars would require extra growing degree days and Minoli et al. (2022) observed that actual crop yields would rise by approximately 12% with extra growing season adaptation, decreasing the adverse impacts of climate change and improving the beneficial effect of CO2 fertilization. This is contrary to the report by Iizumi et al. (2021) regarding the need for more adaptation measures in Sudan, as their study proved that despite the use of adjusted sowing dates and existing heat-tolerant cultivars, wheat production may decrease from 16.0% to 4.5%–12.2% by 2050.
This decline in projected grain yield will have a negative impact on food security in South Africa, which will further increase the yield gap that already exists among farmers in this region. This reduction will also impact the livelihood and source of income among such rural farmers (Thornton et al., 2011). Generally, these yield losses can be attributed partly to the high temperatures projected for Bethlehem and low precipitation.
Since this is the first time we are using the methodology in which secondary data is collected for farm management practices, there might be some unforeseeable uncertainties. Due to the complexity of climate and the limitations of human cognition, the uncertainty of data input, model parameters, etc., unlikelihood exists in the process of climate simulation, resulting in greater uncertainty of simulation results. However, this study reflected only on the impact of future climate scenarios on wheat yields.
The change in climate has a great impact on crop yield and in most cases, the impact is negative. Therefore, adaptation measures should be prioritized within agricultural settings to forestall negative impacts. Therefore, to have long-term development in food production in South Africa, knowledge about the interaction and impact of climate change on food production is important. The baseline yield was slightly lower than the highest in the future data. The results from this study showed a declining trend in yield for all future climate projections from RCP 2.6 to RCP 8.5 except for GCM ENSEMBLE in RCP 2.6 and 4.5, indicating that the possible impacts of higher temperatures and reduced rainfall in the projected future climate will slightly decrease wheat production in the eastern Free State. Using a crop model to simulate the response of crops to variations in weather conditions can be useful to generate advisories for farmers based on the potential effects of climate change on yield and more studies can be conducted. The use of GCMs in crop modeling should be an ongoing process where new GCM data become available.
From our results in this study, potential future adaptations to climate change for wheat yields could require the development of a variety of wheat or wheat cultivars that are drought-tolerant and can better adapt to harsh future climatic conditions. These traits could include cultivars that require higher temperature and longer growing seasons (which is not badly affected by the warmer temperature) or higher temperature and shorter growing seasons (whose phenology development is not impacted). Other adaptation measures could include possible changes in planting dates and irrigation selection. Using a crop model to simulate the response of crops to variations in weather conditions can be useful to generate advisories for farmers based on the potential effects of climate change on yield.
As the future pattern shows the need for change in planting dates and the use of heat-resistant cultivars, farmers need to be educated on the different adaptation measures and the use of technologies to help forestall future crop failures. More research and collaboration needs to be carried out in wheat-growing areas to understand the different future patterns across South Africa. Such collaborations could include the generation of more timely and relevant climate information and comprehensive phenological crop data for decision-making and adaptation measurements in agriculture.
The original contributions presented in the study are included in the article/Supplementary Material, further inquiries can be directed to the corresponding authors.
Both Authors conceived the research idea, CA conceived the idea of data collection used and run the model. Both authors contributed to the manuscript writeup while SW supervised the research. All authors contributed to the article and approved the submitted version.
The authors want to thank the National Research Foundation for the grant to the first author and the Agricultural Research Council—Natural Resources and Engineering (ARC-NRE) for logistics and infrastructure support.
The authors declare that the research was conducted in the absence of any commercial or financial relationships that could be construed as a potential conflict of interest.
All claims expressed in this article are solely those of the authors and do not necessarily represent those of their affiliated organizations, or those of the publisher, the editors and the reviewers. Any product that may be evaluated in this article, or claim that may be made by its manufacturer, is not guaranteed or endorsed by the publisher.
The Supplementary Material for this article can be found online at: https://www.frontiersin.org/articles/10.3389/fenvs.2023.1067008/full#supplementary-material
Ajilogba, C. F., and Walker, S. (2023). Using crop modelling to find solutions to wheat diseases: An overview. Front. Environ. Sci. 10, 2706. doi:10.3389/fenvs.2022.987765
Angulo, C., Rotter, R., Lock, R., Enders, A., Fronzek, S., and Ewert, F. (2013). Implication of crop model calibration strategies for assessing regional impacts of climate change in Europe. Agric. For. Meteorology 170, 32–46. doi:10.1016/j.agrformet.2012.11.017
ARC-NRE (2019). Agrometeorology Database. Pretoria South Africa: Agricultural Research Council-Institute of Natural Resources and Engineering, Arcadia.
ARC-SCW (Agricultural Research Council-Soil, Climate and Water) (2018). National AgroMet Climate Databank. Pretoria, South Africa: ARC-ISCW.
ARC-SGI (2013). Wheat Production Guideline. Summer rainfall regions. Bethlehem: Agricultural Research Council – Small Grain Institute.
Archer, E., Landman, W., Malherbe, J., Tadross, M., and Pretorius, S. (2019). South Africa’s winter rainfall region drought: A region in transition? Clim. Risk Manag. 25, 100188. ISSN 2212-0963. doi:10.1016/j.crm.2019.100188
Asseng, S., Bar-Tal, A., Bowden, J. W., Keating, B. A., Van Herwaarden, A., Palta, J. A., et al. (2002). Simulation of grain protein content with APSIM Nwheat. Eur. J. Agron. 16, 25–42. doi:10.1016/s1161-0301(01)00116-2
Asseng, S., Ewert, F., Rosenzweig, C., Jones, J. W., Hatfield, J. L., Ruane, A. C., et al. (2013). Uncertainty in simulating wheat yields under climate change. Nat. Clim. Change 3 (9), 827–832. doi:10.1038/nclimate1916
Asseng, S., McIntosh, P. C., Wang, G. M., and Khimashia, N. (2012). Optimal N fertiliser management based on a seasonal forecast. Eur. J. Agron. 38, 66–73. doi:10.1016/j.eja.2011.12.005
Asseng, S., and Milroy, S. P. (2006). Simulation of environmental and genetic effects on grain protein concentration in wheat. Eur. J. Agron. 25, 119–128. doi:10.1016/j.eja.2006.04.005
Attia, A., Rajan, N., Xue, Q., Nair, S., Ibrahim, A., and Hays, D. (2016). Application of DSSAT-CERES-Wheat model to simulate winter wheat response to irrigation management in the Texas High Plains. Agric. Water Manag. 165, 50–60. doi:10.1016/j.agwat.2015.11.002
Basso, B., Cammarano, D., and Carfagna, E. (2013). Of Crop Yield Forecasting Methods and Early Warning Systems.
Bfap, (2018). Bureau for food and agricultural policy baseline agricultural outlook 2018 -2027. BFAP.
Boogaard, H., De Wit, A., Te Roller, J., and Van Diepen, C. (2014). WOFOST CONTROL centre 2.1; user’s guide for the WOFOST CONTROL centre 2.1 and the crop growth simulation model WOFOST 7.1. 7. Wageningen, Netherlands: Alterra.
Brisson, N., Gary, C., Justes, E., Roche, R., Mary, B., Ripoche, D., et al. (2003). An overview of the crop model STICS. Eur. J. Agron. 18 (3-4), 309–332. doi:10.1016/s1161-0301(02)00110-7
Chandio, A. A., Dash, D. P., Nathaniel, S. P., Sargani, G. R., and Jiang, Y. (2023). Mitigation pathways towards climate change: Modelling the impact of climatological factors on wheat production in top six regions of China. Ecol. Model. 481, 110381. doi:10.1016/j.ecolmodel.2023.110381
Chandio, A. A., Jiang, Y., Rehman, A., and Rauf, A. (2020). Short and long-run impacts of climate change on agriculture: An empirical evidence from China. Int. J. Clim. Change Strategies Manag. 12 (2), 201–221. doi:10.1108/ijccsm-05-2019-0026
DAFF (2012). Wheat market value chain profile. South Africa: Department of Agriculture, Forestry and Fisheries Pretoria.
DAFF (2010). Wheat production guideline. South Africa: Department of Agriculture, Forestry and Fisheries Pretoria.
de Wit, A. M., and van Diepen, C. A. (2007). Crop model data assimilation with the Ensemble Kalman filter for improving regional crop yield forecasts. Agric. For. Meteorology, 146, 38–56. doi:10.1016/j.agrformet.2007.05.004
Deryng, D., Conway, D., Ramankutty, N., Price, J., and Warren, R. (2014). Global crop yield response to extreme heat stress under multiple climate change futures. Environ. Res. Lett. 9, 034011. doi:10.1088/1748-9326/9/3/034011
Dettori, M., Cesaraccio, C., Motroni, A., Spano, D., and Duce, P. (2011). Using CERES-Wheat to simulate durum wheat production and phenology in Southern Sardinia, Italy. Field Crops Res. 120 (1), 179–188. doi:10.1016/j.fcr.2010.09.008
Fan, M., and Shibata, H. (2014). Spatial and temporal analysis of hydrological provision ecosystem services for watershed conservation planning of water resources. Water Resour. Manag. 28, 3619–3636. doi:10.1007/s11269-014-0691-2
Galal, S. (2021). Wheat production in South Africa by province in 2019 (in 1,000 metric)Tons. Posted Apr 6, Accessed July 20, 2021. Available at: https://www.statista.com/statistics/1135888/wheat-production-in-south-africa-by-province/#statisticContainer
Gouws, A. (2018). South African wheat production under the spotlight. FarmBiz. Available at: https://www.bizcommunity.com.
Govere, S., Nyamangara, J., and Nyakatawa, E. (2022). Beneficial effect of climate change on wheat yield and water footprints in the Middle-Manyame sub-catchment, Zimbabwe. J. Water Clim. Change 13, 2895–2910. doi:10.2166/wcc.2022.038
Hartmann, D., Klein Tank, A., and Rusticucci, M. (2013). “Observations: Atmosphere and surface,” in Climate change 2013: The physical science basis. Contribution of working group I to the fifth assessment report of the intergovernmental panel on climate change (Cambridge, UK and New York, NY, USA: Cambridge University Press). chap. 2 in.
He, J., Le Gouis, J., Stratonovitch, P., Allard, V., Gaju, O., Heumez, E., et al. (2012). Simulation of environmental and genotypic variations of final leaf number and anthesis date for wheat. Eur. J. Agron. 42, 22–33. doi:10.1016/j.eja.2011.11.002
Hoogenboom, G., Jones, J., Wilkens, P., Porter, C., Batchelor, W., Hunt, L., et al. (2004). Decision support system for agrotechnology transfer version 4.0. Honolulu, HI (CD-ROM): University of Hawaii.
Hoogenboom, G., Jones, J., Wilkens, P., Porter, C., Boote, K., Hunt, L., et al. (2012). Decision support system for agrotechnology transfer (DSSAT). [CD-ROM]. Version 4.5
Iizumi, T., Ali-Babiker, I. E. A., Tsubo, M., Tahir, I. S., Kurosaki, Y., Kim, W., et al. (2021). Rising temperatures and increasing demand challenge wheat supply in Sudan. Nat. Food. 2 (1), 19–27.
IPCC (2007). Contribution of working groups I, II and III to the fourth assessment report of the intergovernmental panel on climate change. Geneva, Switzerland: IPCC.Synthesis report
Jones, J. W., Hoogenboom, G., Porter, C. H., Boote, K. J., Batchelor, W. D., Hunt, L., et al. (2003). The DSSAT cropping system model. Eur. J. Agron. 18, 235–265. doi:10.1016/s1161-0301(02)00107-7
Juknys, R., Velicka, R., Kanapickas, A., Kriauciuniene, Z., Masilionyte, L., Vaguseviciene, I., et al. (2017). Projecting the impact of climate change on phenology of winter wheat in northern Lithuania. Int. J. Biometeorology 61, 1765–1775. doi:10.1007/s00484-017-1360-y
Karatayev, M., Clarke, M., Salnikov, V., Bekseitova, R., and Nizamova, M. (2022). Monitoring climate change, drought conditions and wheat production in eurasia: The case study of Kazakhstan. Heliyon 8, e08660. doi:10.1016/j.heliyon.2021.e08660
Kaushal, S. S., Likens, G. E., Jaworski, N. A., Pace, M. L., Sides, A. M., Seekell, D., et al. (2010). Rising stream and river temperatures in the United States. Front. Ecol. Environ. 8, 461–466. doi:10.1890/090037
Keating, B. A., Carberry, P. S., Hammer, G. L., Probert, M. E., Robertson, M. J., Holzworth, D., et al. (2003). An overview of APSIM, a model designed for farming systems simulation. Eur. J. Agron. 18 (3-4), 267–288. doi:10.1016/s1161-0301(02)00108-9
Kruger, A., and Sekele, S. (2013). Trends in extreme temperature indices in SouthSouth Africa: 1962–2009. Int. J. Climatol. 33, 661–676. doi:10.1002/joc.3455
Li, Z., He, J., Xu, X., Jin, X., Huang, W., Clark, B., et al. (2018). Estimating genetic parameters of DSSAT-CERES model with the GLUE method for winter wheat (Triticum aestivum L) production. Comput. Electron. Agric. 154, 213–221. doi:10.1016/j.compag.2018.09.009
Lizumi, T., Furuya, J., Shen, Z., Kim, W., Okada, M., Fujimori, S., et al. (2017). Responses of crop yield growth to global temperature and socioeconomic changes. Sci. Rep. 7, 1–10. doi:10.1038/s41598-017-08214-4
MacKellar, N., New, M., and Jack, C. (2014). Observed and modelled trends in rainfall and temperature for South Africa: 1960-2010. South Afr. J. Sci. 110, 13. doi:10.1590/sajs.2014/20130353
Masipa, T. S. (2017). The impact of climate change on food security in South Africa: Current realities and challenges ahead. Jàmbá J. Disaster Risk Stud. 9, 411–417. doi:10.4102/jamba.v9i1.411
Minoli, S., Jägermeyr, J., Asseng, S., Urfels, A., and Müller, C. (2022). Global crop yields can be lifted by timely adaptation of growing periods to climate change. Nat. Commun. 13 (1), 7079. doi:10.1038/s41467-022-34411-5
Moss, R. H., Edmonds, J. A., Hibbard, K. A., Manning, M. R., Rose, S. K., Van Vuuren, D. P., et al. (2010a). The next generation of scenarios for climate change research and assessment. Nature 463, 747–756. doi:10.1038/nature08823
Moss, R. H., Edmonds, J. A., Hibbard, K. A., Manning, M. R., Rose, S. K., van Vuuren, D. P., et al. (2010b). The next generation of scenarios for climate change research and assessment. Nature 463, 747–756. doi:10.1038/nature08823
Müller, C., Cramer, W., Hare, W. L., and Lotze-Campen, H. (2011). Climate change risks for African agriculture. Proc. Natl. Acad. Sci. 108, 4313–4315. doi:10.1073/pnas.1015078108
Navarro-Racines, C., Tarapues, J., Thornton, P., Jarvis, A., and Ramirez-Villegas, J. (2020). High-resolution and bias-corrected CMIP5 projections for climate change impact assessments. Sci. Data 7, 7. doi:10.1038/s41597-019-0343-8
Nhemachena, C. R., and Kirsten, J. (2017). A historical assessment of sources and uses of wheat varietal innovations in South Africa. South Afr. J. Sci. 113, 1–8. doi:10.17159/sajs.2017/20160008
Otto, F. E., Wolski, P., Lehner, F., Tebaldi, C., Van Oldenborgh, G. J., Hogesteeger, S., et al. (2018). Anthropogenic influence on the drivers of the Western Cape drought 2015–2017. Environ. Res. Lett. 13 (12), 124010.
Pachauri, R. K., Allen, M. R., Barros, V. R., Broome, J., Cramer, W., Christ, R., et al. (2014). Contribution of working groups I, II and III to the fifth assessment report of the intergovernmental panel on climate change. Climate change 2014: Synthesis report. IPCC Available at: http://www.mendeley.com/research/climate-change-2014-synthesis-report-contribution-working-groups-i-ii-iii-fifth-assessment-report-in-20.
Pequeno, D. N., Hernandez-Ochoa, I. M., Reynolds, M., Sonder, K., MoleroMilan, A., Robertson, R. D., et al. (2021). Climate impact and adaptation to heat and drought stress of regional and global wheat production. Environ. Res. Lett. 16, 054070. doi:10.1088/1748-9326/abd970
Riahi, K., Rao, S., Krey, V., Cho, C., Chirkov, V., Fischer, G., et al. (2011). Rcp 8.5—a scenario of comparatively high greenhouse gas emissions. Clim. Change 109, 33–57. doi:10.1007/s10584-011-0149-y
Ritchie, J. T., and Otter-Nacke, S. (1985). Description and performance of CERES-wheat: A user-oriented wheat yield model. Springfield, VA: ARS Wheat Yield Project, ARS-38. National Technical Information Service, 159–175.
Roomforafrica, (2023). Map and region. Available at: https://www.roomsforafrica.com/dest/south-africa/free-state.jsp (Accessed July 7, 2023)
Rosenzweig, C., Jones, J. W., Hatfield, J. L., Ruane, A. C., Boote, K. J., Thorburn, P., et al. (2013). The agricultural model intercomparison and improvement project (AgMIP): Protocols and pilot studies. Agric. For. Meteorology 170, 166–182. doi:10.1016/j.agrformet.2012.09.011
Rurinda, J., van Wijk, M. T., Mapfumo, P., Descheemaeker, K., Supit, I., and Giller, K. E. (2015). Climate change and maize yield in southern Africa: What can farm management do? Glob. Change Biol. 21, 4588–4601. doi:10.1111/gcb.13061
SADC (2016). Over 41.4 million people in southern Africa are food insecure. Available at: https://www.sadc.int/news-events/news/over-414-million-people-southern-africa-are-food-insecure/.
Saddique, Q., Li Liu, D., Wang, B., Feng, P., He, J., Ajaz, A., et al. (2020). Modelling future climate change impacts on winter wheat yield and water use: A case study in Guanzhong Plain, northwestern China. Eur. J. Agron. 119, 126113. doi:10.1016/j.eja.2020.126113
Sar, K., and Mahdi, S. S. (2019). Evaluation and performance of CERES-wheat DSSAT v4. 6 model for growth, development and yield in southern Bihar. Indian J. Ecol. 46 (1), 217–219.
Serage, K. L. (2017). Evaluating climate change adaptation strategies for disaster risk management: Case study for Bethlehem wheat farmers, South Africa. UFS Disaster Management Training and Education Centre for Africa, Faculty of Natural and Agricultural Sciences, MSc.
Smith, W. N., Grant, B. B., Desjardins, R. L., Kroebel, R., Li, C., Qian, B., et al. (2013). Assessing the effects of climate change on crop production and GHG emissions in Canada. Agric. Ecosyst. Environ. 179, 139–150. doi:10.1016/j.agee.2013.08.015
South African Weather Service (2021). Annual state of the climate of South Africa 2020. Pretoria. South Africa.
Statista, (2023). Production of wheat in South Africa from 2000 to 2021. Statista Research. Department, Accessed April 26, 2023. Available at: https://www.statista.com/statistics/1135547/production-of-wheat-in-south-africa/#statisticContainer
Stevens, T., and Madani, K. (2016). Future climate impacts on maize farming and food security in Malawi. Sci. Rep. 6, 36241. doi:10.1038/srep36241
Stocker, T. F., Qin, D., Plattner, G.-K., Tignor, M., Allen, S. K., Boschung, J., et al. (2013). Climate change 2013: The physical science basis. Contribution Work. group I Fifth Assess. Rep. Intergov. Panel Clim. Change.
Tadesse, W., Bishaw, Z., and Assefa, S. (2019). Wheat production and breeding in sub-saharan Africa: Challenges and opportunities in the face of climate change. Int. J. Clim. Change Strategic Manag. 11, 696–715. doi:10.1108/ijccsm-02-2018-0015
Tao, F., Zhang, Z., Xiao, D., Zhang, S., Rötter, R. P., Shi, W., et al. (2014). Responses of wheat growth and yield to climate change in different climate zones of China, 1981–2009. Agric. For. Meteorology 189–190, 91–104. doi:10.1016/j.agrformet.2014.01.013
Taylor, K. E. (2009). A summary of the CMIP5 experiment design. Available at: http://cmip-pcmdi.llnl.gov/cmip5/docs/Taylor_CMIP5_design.pdf.
Taylor, K. E., Stouffer, R. J., and Meehl, G. A. (2012). An overview of CMIP5 and the experiment design. Bull. Am. Meteorological Soc. 93, 485–498. doi:10.1175/bams-d-11-00094.1
Thornton, P. K., Jones, P. G., Ericksen, P. J., and Challinor, A. J. (2011). Agriculture and food systems in sub-Saharan Africa in a 4 C+ world. Philosophical Trans. R. Soc. A Math. Phys. Eng. Sci. 369, 117–136. doi:10.1098/rsta.2010.0246
Thorp, K. R., Hunsaker, D. J., French, A. N., White, J. W., Clarke, T. R., and Pinter, P. J. (2010). Evaluation of the CSM-CROPSIM-CERES-Wheat model as a tool for crop water management. J. ASABE 53, 87–102. doi:10.13031/2013.29505
UNU-WIDER (2016). Climate change effects on irrigation demand and crop yields in South Africa. UNU-WIDER, Helsinki, Finland. Available at: https://www.wider.unu.edu/publication/climate-change-effects-irrigation-demand-and-crop-yields-south-africa
Van Wilgen, N. J., Goodall, V., Holness, S., Chown, S. L., and McGeoch, M. A. (2016). Rising temperatures and changing rainfall patterns in South Africa's national parks. Int. J. Climatol. 36, 706–721. doi:10.1002/joc.4377
Vanuytrecht, E., Raes, D., Steduto, P., Hsiao, T. C., Fereres, E., Heng, L. K., et al. (2014). AquaCrop: FAO's crop water productivity and yield response model. Environ. Model. Softw. 62, 351–360. doi:10.1016/j.envsoft.2014.08.005
Visser, M. H. (2014). Influence of cropping sequence on wheat production under conservation agriculture in the eastern Free State. MSc thesis. University of the Free State.
Waffa, R., and Benoit, G. (2015). Simulation of climate change impact on wheat production in the tiaret region of Algeria using the DSSAT model. Eur. Sci. J. 11, 249–259. Available at: https://eujournal.org/index.php/esj/article/view/5293.
Wallace, M. (2013). Modelling the impact of future climate change on subregional wheat production in the Western Cape. PhD thesis. Town: University of Cape.
Wang, H., He, Y., Qian, B., McConkey, B., Cutforth, H., McCaig, T., et al. (2012). Short communication: Climate change and biofuel wheat: A case study of southern saskatchewan. Can. J. Plant Sci. 92 (3), 421–425. doi:10.4141/cjps2011-192
Western Cape Department of Agriculture, (2018). Drought policy brief. Cape Town: Western Cape Department of Agriculture.
Western Cape Department of Agriculture, (2017). Informing the western Cape agricultural sector on the 2015–2017 drought. Cape Town: Western Cape Department of Agriculture.
Westhuizen, D. V., and Trapnell, L. (2015). How do we compare with "down under"?— measuring and comparing the competitiveness of the South African wheat industry with Australia. The Bureau for Food And Agricultural Policy (BFAP), Grain SA. Available at: https://www.grainsa.co.za/how-do-we-compare-with-down-under.
Wheeler, T., and Von Braun, J. (2013). Climate change impacts on global food security. Science 341, 508–513. doi:10.1126/science.1239402
Xiao, D., Bai, H., and Liu, D. L. (2018). Impact of future climate change on wheat production: A simulated case for China’s wheat system. Sustinability 10, 1277. doi:10.3390/su10041277
Yang, M., Xiao, W., Zhao, Y., Li, X., Huang, Y., Lu, F., et al. (2018). Assessment of potential climate change effects on the rice yield and water footprint in the Nanliujiang catchment, China. Sustainability 10, 242. doi:10.3390/su10020242
Keywords: crop model, DSSAT, South Africa, wheat, global climate model (GCM), representative concentration pathway (RCP)
Citation: Ajilogba CF and Walker S (2023) Modeling climate change impact on dryland wheat production for increased crop yield in the Free State, South Africa, using GCM projections and the DSSAT model. Front. Environ. Sci. 11:1067008. doi: 10.3389/fenvs.2023.1067008
Received: 11 October 2022; Accepted: 21 June 2023;
Published: 17 July 2023.
Edited by:
Reza Mohammadi, AREEO, IranReviewed by:
Ye Huang, East China Normal University, ChinaCopyright © 2023 Ajilogba and Walker. This is an open-access article distributed under the terms of the Creative Commons Attribution License (CC BY). The use, distribution or reproduction in other forums is permitted, provided the original author(s) and the copyright owner(s) are credited and that the original publication in this journal is cited, in accordance with accepted academic practice. No use, distribution or reproduction is permitted which does not comply with these terms.
*Correspondence: Caroline F. Ajilogba, Y2Fyb2xpbmUuYWppbG9nYmFAZ21haWwuY29t Sue Walker, d2Fsa2Vyc0BhcmMuYWdyaWMuemE=
Disclaimer: All claims expressed in this article are solely those of the authors and do not necessarily represent those of their affiliated organizations, or those of the publisher, the editors and the reviewers. Any product that may be evaluated in this article or claim that may be made by its manufacturer is not guaranteed or endorsed by the publisher.
Research integrity at Frontiers
Learn more about the work of our research integrity team to safeguard the quality of each article we publish.