 Bilang Wu
 Chunna Liu1,2*
94% of researchers rate our articles as excellent or good
Learn more about the work of our research integrity team to safeguard the quality of each article we publish.
Find out more
TECHNOLOGY AND CODE article
Front. Environ. Sci., 16 March 2023
Sec. Environmental Informatics and Remote Sensing
Volume 11 - 2023 | https://doi.org/10.3389/fenvs.2023.1059217
In this paper, based on the improved DeepSORT algorithm, four target species of passing fish (Schizothorax o’connori, Schizothorax waltoni, Oxygymnocypris stewartii and Schizopygopsis younghusbandi) from a fishway project in the middle reaches of the Y River were used to achieve dynamic identification and automatic counting of passing fish species using fishways monitoring video. This method used the YOLOv5 model as the target detection model. In view of the large deformation by fish body twisting, the network structure of the re-identification (ReID) model was deepened to strengthen the feature extraction ability of the model. It was proposed to identify and track fish that cross the line by setting a virtual baseline to achieve the dynamic identification of fish species passing and the automatic counting of upward and downward quantities. The results showed that 1) among the five models, YOLOv5n, YOLOv5s, YOLOv5m, YOLOv5l, and YOLOv5x, the highest value of mean average precision (mAP) was 92.8% achieved by the YOLOv5x model. Specifically, recognition accuracies of 96.95%, 94.95%, 88.79%, and 91.93% were recorded for Schizothorax o’connori, S. waltoni, S. younghusbandi and O. stewartii, respectively. 2) The error rate of the improved ReID model was 20.3%, which was 20% lower than that before the improvement, making it easier for the model to obtain target features. 3) The average accuracy of the improved DeepSORT algorithm for counting four target fishes was 75.5%, among which the accuracy of Schizothorax o’connori, S. waltoni, S. younghusbandi and O. stewartii were 83.6%, 71.1%, 68.1%, and 79.3%, respectively. Meanwhile, the running speed was 44.6 fps, which met the real-time monitoring. This method is the first to implement intelligent identification of the target passing fish in fishways projects, which can accumulate long series monitoring data for fishways operation and management and provide a technical solution and reference for the work related to the realization of intelligent and informative passing fish monitoring.
While hydraulic and hydropower projects have various benefits such as flood control, power generation and water supply, they can cause certain damage to the natural environment, affecting the original hydrological situation of the basin, causing changes in the river’s water-sand relationship, water temperature and other environmental conditions, thus breaking the balance between the living environment of fish and other aquatic organisms and aquatic ecosystems (Ding et al., 2020; Zhang et al., 2020). As a connecting channel for upward and downward fish swimming, fishways can mitigate the impact of physical barriers of dams and promote gene exchange among fish species (Huang et al., 2020). In the process of fishway operation monitoring, dynamic identification of passing fish species and statistics of passing fish quantity are the focus to evaluate the fish passage effect. By monitoring the real fish passing data, the rationality of fishway design can be evaluated, and the existing scheme can be optimized and improved, thus improving the operation and management level of fishway (Baiyin et al., 2011; Chen et al., 2012). The existing fish passage effect monitoring is mainly through manual observation and the netting method to determine indicators such as the species and number of passing fish, which is too costly and difficult to achieve continuous monitoring over a long period of time, and requires managers to have a fairly strong fish identification ability (Zhang et al., 2017; Jin et al., 2022). With the advancement of hardware technology, the sonar method and the resistance method are gradually used for fish counting, but are still difficult to realize the identification of fish species. In the evaluation of the effect of a single fish passing, the radio frequency tagging tracking method is mainly used, which needs to mark the fish catch and are therefore not suitable for long-term continuous passing fish monitoring and evaluation (Tao et al., 2018; Wen et al., 2019; Jian et al., 2020; Tao et al., 2021).
Image recognition technology has been successfully applied in several fields with the advantages of high processing efficiency, low cost and batch repeatable detection (Huang and Li, 2017; Zhang et al., 2018; Jia et al., 2019; Ma et al., 2022). In the early studies of fish recognition, researchers constructed models based on the overall features (as color, texture and outline) or local features (as head, back and tail of the fish) of still images of fish and extracted key image features for recognition. For example Wan et al. (2012), achieved the recognition of four fish species, which were Cyprinus carpio, Carassius auratus, Ctenopharyngodon idellus and Parabramis pekinensis, by establishing back propagation (BP) neural network model and linear regression models based on the appearance morphological parameters such as length and width of fish and color characteristic parameters such as hue and saturation. Zion et al. (2000) achieved the static recognition of fish species by processing and analyzing images of three fish species, including C. carpio, Oreochromis mossambicus and Mugil cephalus, based on their characteristic parameters such as fish tail and body length. The above methods need to design the corresponding phenotypic feature values in the model for different fish species, so the generalizability of the models is poor, and the recognition accuracy for overall fish species is low, which is still difficult to use in practical production. In recent years, with the rapid development of deep learning (DL) in artificial intelligence (AI) (Gupta et al., 2021; Mirra et al., 2022), a novel target detection algorithm has been gradually applied to the field of fast fish identification. Specifically, it is driven by massive image data in a specific scene and input it into a deep convolutional neural network (CNN) (Cai and Zhao, 2020; Liimatainen et al., 2021), which then adaptively acquires high-level semantic features characterizing the feature information of the target image. Further, the input samples are matched through a template library, and the accurate classification of the target image is finally achieved (Lin, 2017; Gu and Zhu, 2018; Li J et al., 2019; Li Q. Z et al., 2019; Zhang et al., 2019). Based on the visual geometry group (VGG) model, Lin, (2017) realized the recognition and classification of 6 kinds of fish images as Thunnus alalunga, Thunnus obesus and Coryphaena hippurus by using data augmentation and stochastic gradient descent. Gu and Zhu, (2018) designed a fish classification algorithm combining CNN with support vector machines (SVM), and the classification accuracy could reach over 95%. Li J et al. (2019) used a migration learning approach based on CNN to fuse fish recognition models, significantly improving the accuracy of marine fish recognition in complex scenes. In order to improve the robustness of the model, Zhang et al. (2019) used the weighted convolution for extracting image features, which further improved the model’s ability to extract key features. Their model achieved a recognition accuracy of 90% for fish images observed on the seabed. Li Q. Z et al. (2019) addressed the problems of limited arithmetic power and insufficient known sample size in embedded systems, based on the YOLO (You Only Look Once) algorithm, and achieved real-time detection of small target fish by simplifying the model and migrating learning.
The current research on fish species identification is mainly aimed at the static images of fish in marine and aquatic fields (Pepe et al., 2007; Bingpeng et al., 2018; Chai et al., 2021; Pereira et al., 2021). Although some achievements have been made, however, the actual situation is that the fish swimming through fishway is a dynamic process, and the body of fish is often in a torsional state of deformation, making it difficult to directly carry out research on the identification of passing fish targets in real fishways engineering scenarios using existing algorithms. Therefore, in order to solve the problem of dynamic identification of fish species and automatic statistics of fish quantity in fishway monitoring, this paper proposes an improved DeepSORT (Simple Online and Realtime Tracking with a Deep association metric) algorithm based on YOLOv5. It can give full play to the DL algorithm to automatically extract fish image features according to different scene features, and through continuous adaptive learning the difference between the predicted value and the real value, to achieve the target detection needs in the dynamic scene of fishway. Furthermore, we apply this algorithm to a fishway project in Y River, aiming at innovating the traditional fishway monitoring method and realizing the intelligent monitoring of fishway passing effect, and at the same time, accumulating long-sequence monitoring data to provide support for fishway operation and management.
As the representative of one-stage target detection algorithm, YOLOv5 (Redmon et al., 2016; Shafiee et al., 2017) algorithm has five structures, YOLOv5n, YOLOv5s, YOLOv5m, YOLOv5l and YOLOv5x. The basic framework of their networks is similar, but differ in network depth and width. The specific parameters are shown in Table 1. This changes the number of convolution cores and bottleneck layers in their models, so that the combination of different network depths and widths can be achieved to make the balance between accuracy and speed.
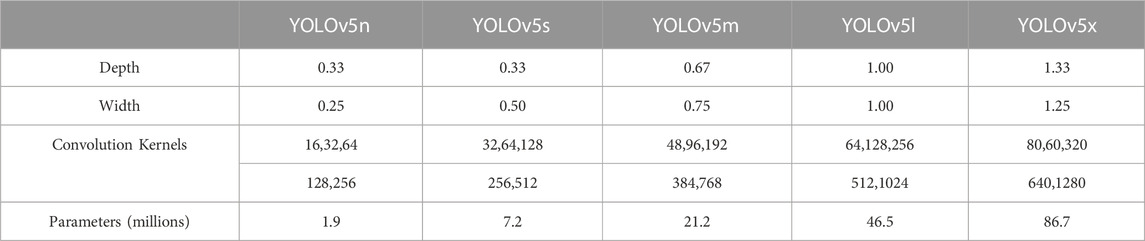
TABLE 1. Comparison of the parameters of the different versions of YOLOv5.
The network structure of YOLOv5 is shown in Figure 1, which is mainly composed of three parts, backbone network (Backbone), network layer (Neck) and output (Head). Backbone is the core network of the model, which extracts features at different levels in the image through a Cross Stage Partial (CSP) structure and Spatial Pyramid Pooling—Fast (SPPF) structure. The Neck network adopts the combination of feature pyramid network (FPN) and path aggregation network (PAN) to integrate the information of different network layers in Backbone and improve the detection capability of the network model. As the detector of the model, the Head output mainly predicts the category and position of objects in images of different scales by using three modules.
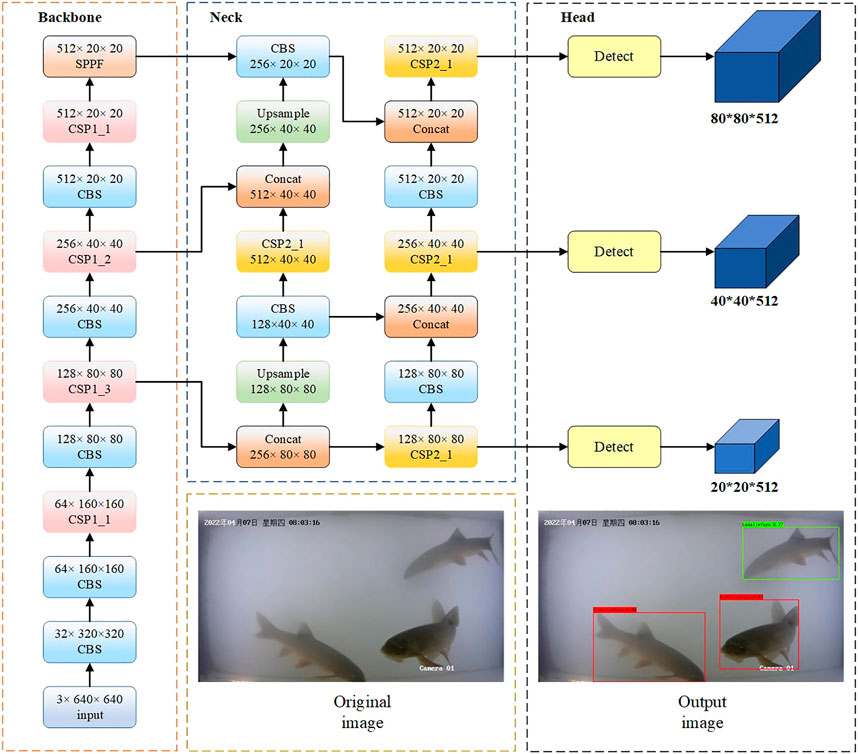
FIGURE 1. Algorithm structure of YOLOv5.
The flow chart of YOLOv5 model prediction is shown in Figure 2. For prediction, it outputs the location information and types of objects existing in a given image in the form of detection boxes and labels. First, the input image is divided into N*N grids. If the center of a target fish falls within a grid, the grid is responsible for detecting the target fish. Then, each grid is detected and classified through the detection network, and the bounding box is output. Each bounding box contains 5 prediction parameters: x, y, w, h and confidence, where x, y constitute the coordinates of the predicted bounding box, and w, h represent its width and height. Finally, the non-maximum suppression method is used for post-processing to remove redundant detection results, and the detection frame with the highest confidence is used as the prediction result.
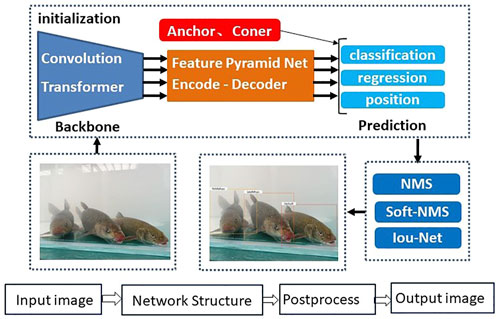
FIGURE 2. Flow chart of YOLOv5 model prediction (Cao et al., 2022).
It can be seen from Figure 2 that YOLOv5 algorithm can locate and recognize passing fish targets based on images. When the input content is video, it can track the target by detecting each frame. However, in this tracking method, each frame is independent and the information association between frames in the video is not considered. If the algorithm misses a frame, it loses tracking of the target. For the dynamic fish passing image, the fish keeps swimming, and its body deformation is large, which will inevitably affect the recognition. If a frame recognition exception occurs at this time, continuous tracking cannot be achieved.
The basic concept of DeepSORT (Bewley et al., 2016; Wojke et al., 2017) algorithm is Tracking By Detection (TBD), which realizes target tracking through recursive Kalman filter (Grewal and Andrews, 2001; Zhang et al., 2022) and data correlation between adjacent frames. When the algorithm detects the target, the Hungarian matching algorithm with weights is used to match the previous motion track with the current detection object, and then the motion track of the target is determined. The prediction of the motion state of the target can be described by using an 8-dimensional state space as follows.
where
The correlation of the motion information is obtained by calculating the tracking boundary box of Kalman filter to predict the motion state of existing targets through Mahalanobis distance, and comparing it with the detection boundary box obtained from target detection. Then the Mahalanobis distance and the set threshold value
where
The re-identification (ReID) model is introduced when the Mahalanobis distance cannot be well measured. It uses the appearance characteristics of the target as correlation information and can effectively recover targets lost due to occlusion or missed detection, etc. The structure of the model is shown in Table 2.
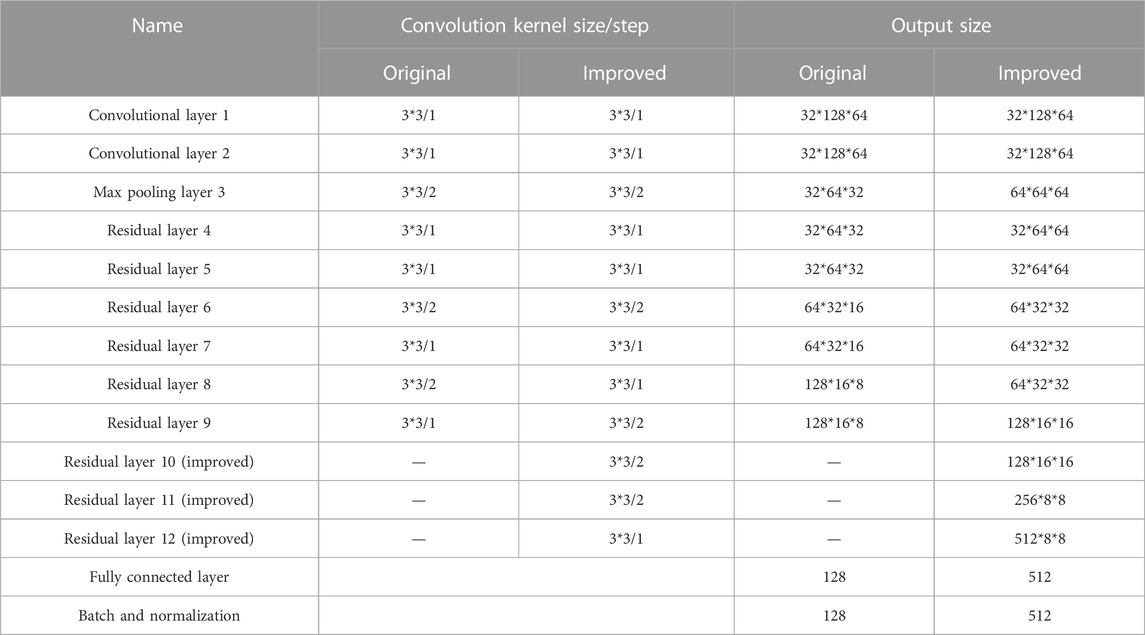
TABLE 2. Network structure of’ the DeepSORT re-identification (ReID) model (original and improved).
Appearance information association can be measured by the minimum cosine distance between the detected feature description and the tracked feature description. By comparing the cosine distance of the association with the training correlation threshold
A linearly weighted combination of Eqs 3, 5 gives a threshold function for determining whether an association is successful, which can be expressed as follows.
where
According to the need for automatic statistics of the number of objective passing fish in fishway engineering, this paper makes the following improvements on the basis of DeepSORT algorithm: 1) The detector in DeepSORT algorithm is replaced by YOLOv5 from Faster R-CNN, and encapsulated into a module. By calling the updated algorithm module, the system can quickly respond to and output the prediction information to ensure the accuracy and speed of the detection algorithm. 2) Increase the depth of the convolution layer and strengthen the feature extraction ability of ReID. As shown in Table 3, the network structure of ReID is replaced by networks of 2 convolutional layers and 6 residual layers to 2 convolutional layers and 9 residual layers, corresponding to the change of the feature dimension of the model output from 128 to 512. 3) The input image size is improved to make the model suitable for fish feature extraction. According to the aspect ratio characteristics of fish, the size of the model input image is replaced from 64*128 pixels (width*height) to 128*64 pixels. 4) Add the fish counting module. By drawing a baseline in the center of the fish moving image, fish crossing the line are counted in the upward and downward direction.
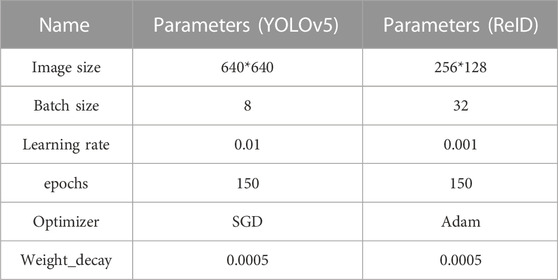
TABLE 3. Main training parameters of model.
The main processing steps of fish multi-target tracking are shown in Figure 3. 1) Read the input video frame by frame. 2) Use the YOLOv5 target detection algorithm to obtain the target detection box. 3) Extract the appearance features and motion feature information of the detected frame target. 4) Carry out similarity calculation to evaluate the matching degree of targets between adjacent frames. 5) Data association, assign a unique ID to the target in each frame according to the matching results.
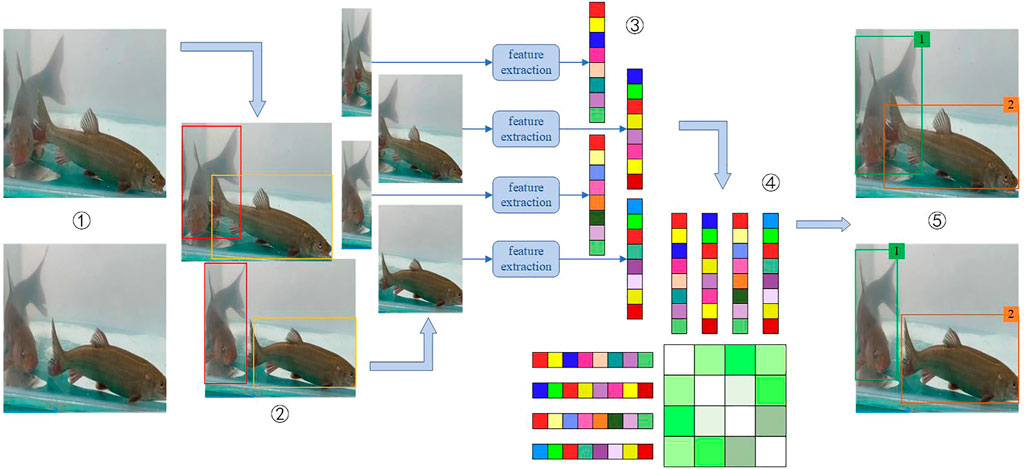
FIGURE 3. Main processing steps for multi-objective tracking of fish (Ciaparrone et al., 2020).
Fish counting is implemented based on fish tracking. Figure 4 shows a schematic diagram of fish counting from frame T to frame T + 1. Different frames are correctly associated with each other through ID numbers. In frame T, the number of detected targets in the figure changes from 3 to 4, and the target ID number d is added. At frame T + 1, target b intersects the fish counting baseline and reaches the counting condition. Target c disappears, target a and target d still exist, but both fail to pass the baseline and reach the counting condition. Target e appears at T + 1, but the counting condition is not reached because the baseline is not reached. Therefore, from frame T to frame T + 1, the number of upward fish increases by 1.
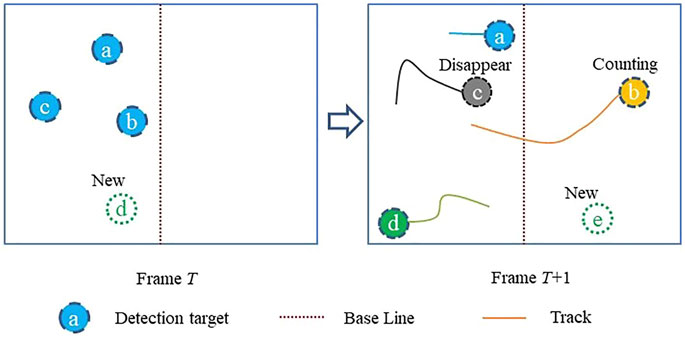
FIGURE 4. Schematic of fish counting based on DeepSORT.
In this study, a fishway project in the middle reaches of Y river is taken as the research object, and relevant researches on dynamic identification of passing fish species and automatic counting are carried out, aiming at realizing the intelligent monitoring of passing fish in fishways. The flow chart of the method proposed in this paper is shown in Figure 5, which mainly includes the following four steps:
(1) Collect passing fish image information in fishways: develop an underwater image acquisition system, seal the underwater camera, install and debug it, determine the reasonable shooting distance, and obtain clear passing fish image information through light compensation, noise reduction and other techniques.
(2) Produce datasets: screen passing fish videos, extract key frames, and produce fish target detection and ReID datasets.
(3) Construct a target fish species recognition network: input the fish target detection and target re recognition data sets into the ReID model and YOLOv5 model successively for training, and use them for target detection and feature extraction in multi-target tracking.
(4) Research and development of species identification and counting model: YOLOv5 model and ReID model are used in the improved DeepSORT algorithm to realize the dynamic identification of fish species and automatic statistics of fish counting.

FIGURE 5. Technical route.
The scattering of light and the effect of color distortion will lead to poor image quality acquired underwater, which is characterized by blurring, low contrast, short visual distance and, etc. When collecting fish image information, an underwater image acquisition system should be first developed. To ensure the underwater camera system can capture every passing fish image and maximize the real passing fish scene of the fishway, it needs to be customized according to the swimming behavior of fish, flow rate preference and the structural characteristics of the fishway itself. At the same time, it is necessary to improve the underwater image acquisition environment through the light compensation system. Therefore, the underwater camera system shown in Figure 6 is developed for vertical slit fishway. Firstly, the camera is individually encapsulated, and secondly, the underwater camera, LED light wall and fish box culvert are combined into a frame structure. Finally, it is arranged between two vertical slit isolation plates, and the overflow network is fixed on the upper side of the underwater camera system to ensure that fish can only pass through the fish box culvert.
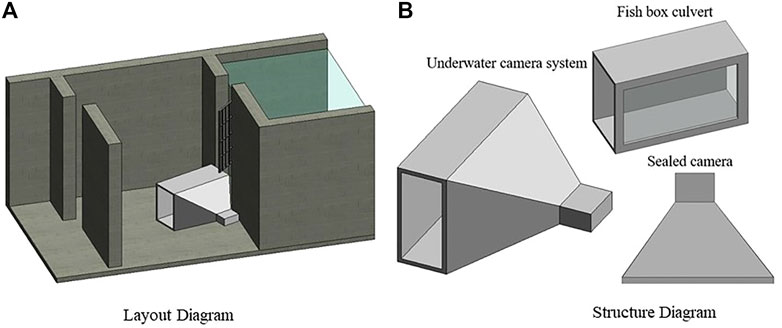
FIGURE 6. Schematic and structural diagram of the underwater camera system arrangement.
The camera model used in this study is Hikvision DS-2CD3T66F, with a resolution of 1,280 * 720 pixels, a storage format of mp4, and a video frame rate of 30f/s. It is transmitted to the recorder and server in real time through cables and switches based on real time streaming protocol (RTSP). The video image acquisition time is March 18–24, 2022 and April 4–10, 2022. During the continuous monitoring, 807 videos are exported, with an average duration of 25 min. After screening, 322 valid videos were retained, covering different time periods in the morning, noon and evening, after removing the clips without passing fish. Firstly, part of the video is processed by frames. One frame is extracted every 10 frames and added to the dataset. Secondly, the ffmepg tool is used to extract the fast fish swimming clips in the video every 5 frames, and add them to the dataset as key frames to enhance the diversity of the dataset. Thirdly, use the image marking tool named “labelimg” label the target fish in the image. Among them, through manual verification of fish passing data during the monitoring period, four fish passing videos were collected, namely, Schizothorax o’connori Schizothorax waltoni, Schizopygopsis younghusbandi and Oxygymnocypris stewartii, as the target fish of this experiment. Finally, 13,216 labeled images are made into target detection data sets, which are randomly divided into training sets and test sets according to the proportion of 8:2. Some images are shown in Figure 7. The total tag number of the target detection data set is 14,541. The number of tags for Schizothorax o’connori S. waltoni, S. younghusbandi and O. stewartii are 4,757, 3,565, 3,112 and 3,107 respectively.
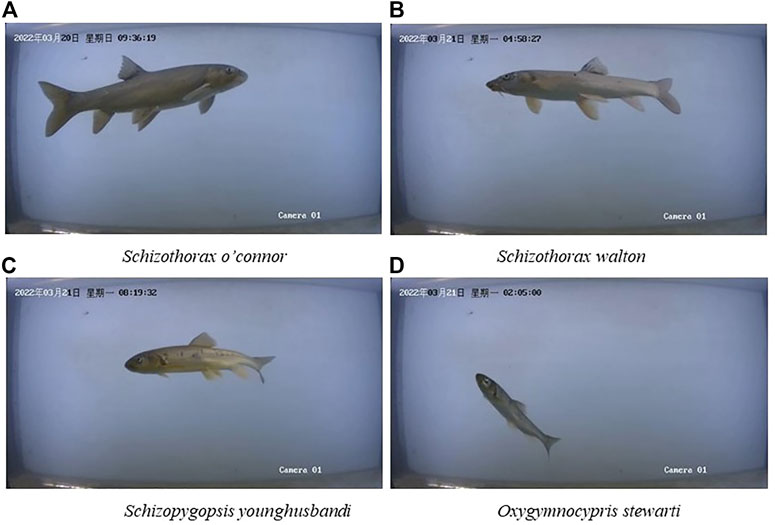
FIGURE 7. Sample of target fish dataset.
In order to improve the robustness of the ReID model, it is necessary to produce a fish re-identification dataset based on the passing fish image in fishways, and ensure that the individual fish in the video is unique. Therefore, according to different time periods, the video of passing fish is screened twice to ensure that the same fish does not appear in different videos, and the video is labeled with the Darklabel tool. Individual fish are distinguished according to different ID numbers, which is used to build a fish reidentification dataset, as shown in Figure 8. A total of 83 fish were tagged this time, with a total of 6,274 images as the data set. Each fish has more than 20 images.
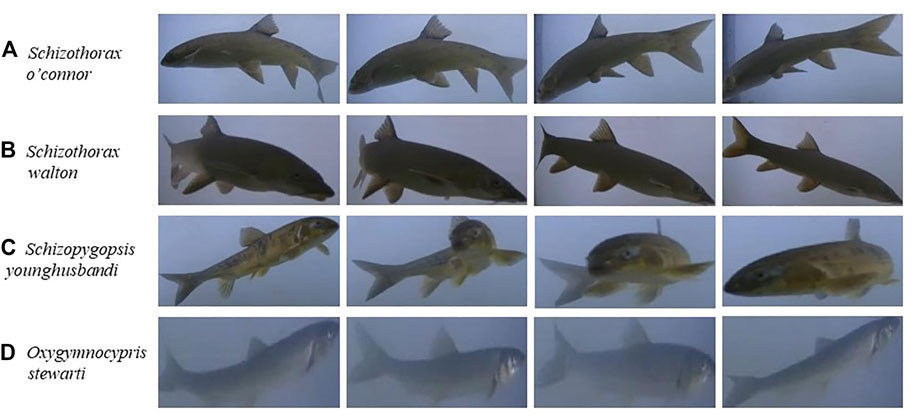
FIGURE 8. Sample ReID dataset.
DeepSORT as a TBD algorithm, its tracking accuracy and speed depends on the merits of the target detection algorithm. Therefore, this paper improves the DeepSORT algorithm model by comparing YOLOv5 target detection model and ReID model. The parameters of the experimental server are as follows: hardware environment: Win10 operating system, processor is Intel i7-11800H 16 core CPU, 32G RAM, RTX3080 LaptopGPU graphics card. Software configuration: Cuda Toolkit 11.4 as the computing platform, Cudnn 8.2.4 as the GPU acceleration library of deep neural network, Python 3.7 as the programming language, and PyTorch 1.8 as the deep learning model framework. The main training parameters of YOLOv5 and ReID models are shown in the Table 4.
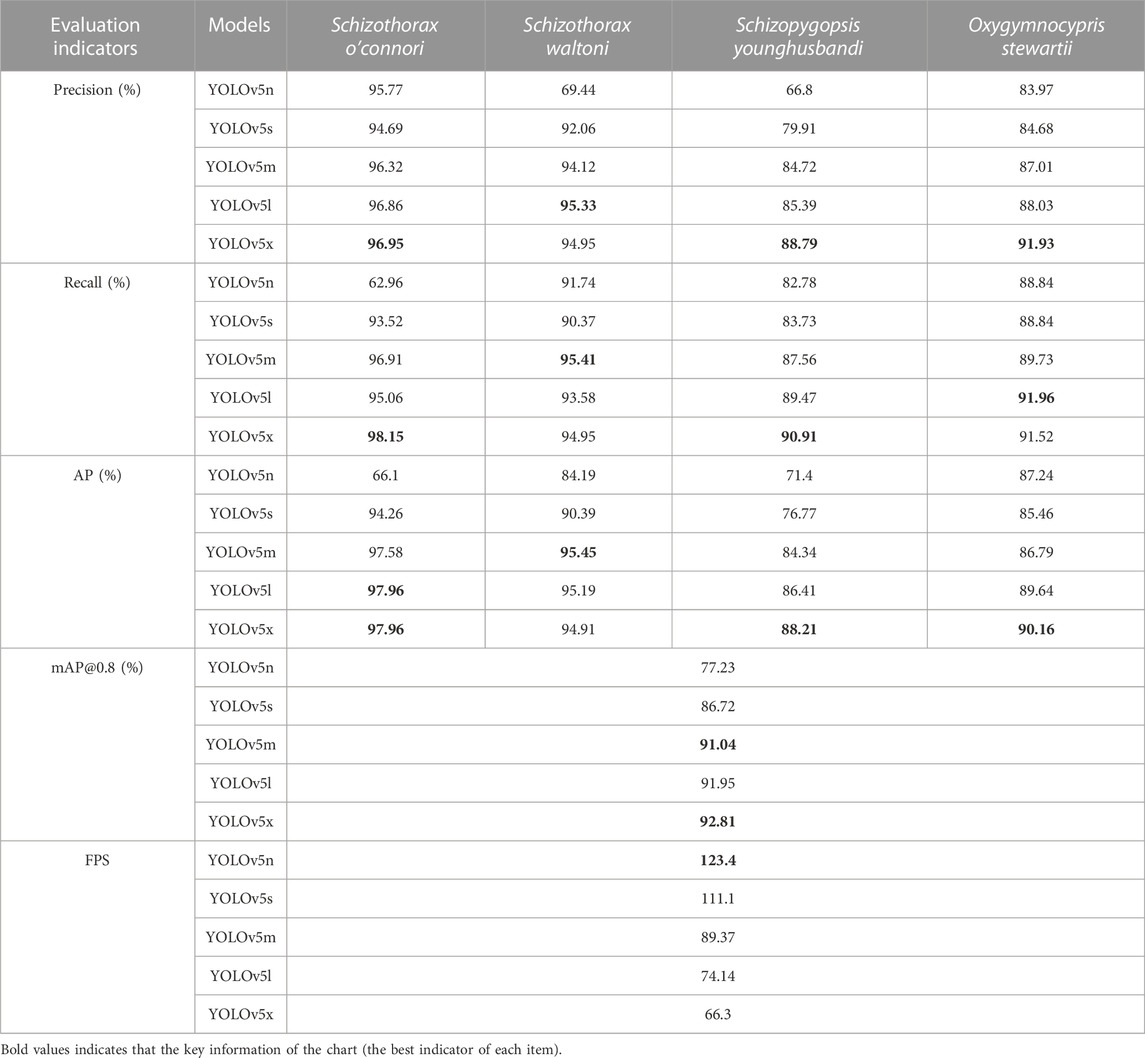
TABLE 4. Comparison of target detection results for different algorithms.
Firstly, input the prepared fish target detection data set into YOLOv5 algorithm, and use YOLOv5n, YOLOv5s, YOLOv5m, YOLOv5l and YOLOv5x for training, respectively. Then, the accuracy (P), recall rate (R), mean average accuracy (mAP), and frame per second (FPS) are used to evaluate the performance of the model. FPS represents the frame rate per second. The larger the value, the faster the algorithm will process. The calculation formulas for other parameters are as follows.
In the equation,
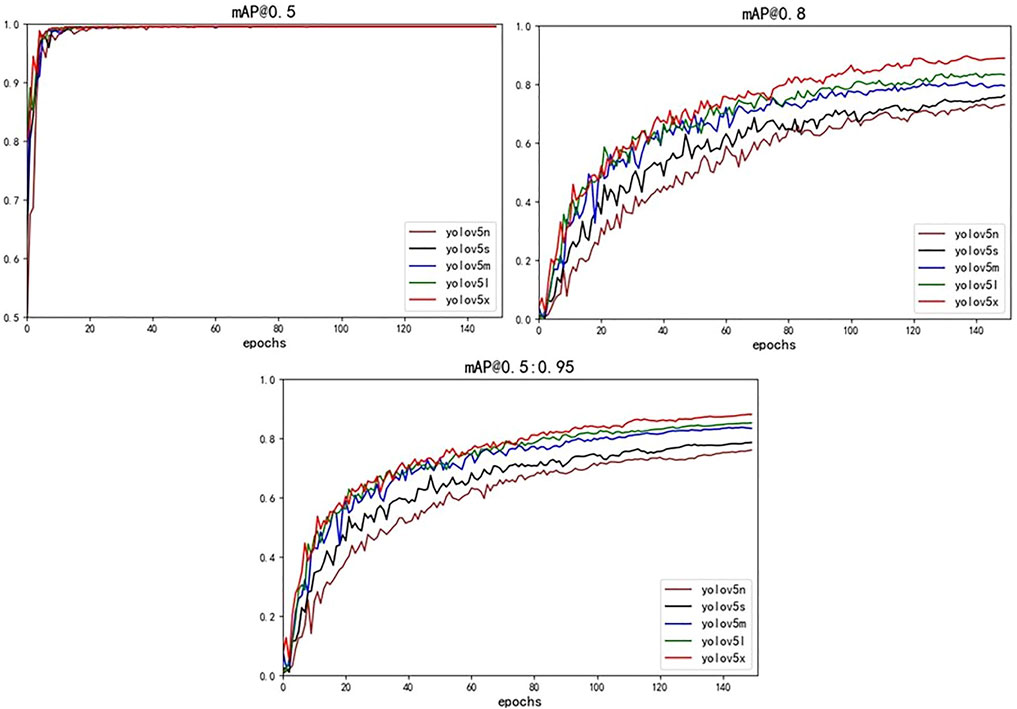
FIGURE 9. mAP change curve during YOLOv5 training with different structures.
The five models in the trained YOLOv5 were tested under the same test set. Figure 10 shows the detection results of YOLOv5, where the models are still able to identify targets for cases where the image target fish is not heavily occluded (Figures 10A–D).

FIGURE 10. The recognition effect of YOLOv5 model.
The corresponding indicators calculated based on Eqs 8–11 are shown in Table 5. It can be seen from the table that the mAP value of YOLOv5x model is the highest, which is 92.81%. The average recognition accuracy of four target fishes, namely, Schizothorax o’connori, S. waltoni, S. younghusbandi and O. stewartii, is 96.95%, 94.95%, 88.79%, and 91.93%, respectively, and the FPS reaches 44.63, which can meet the requirements of real-time detection. Therefore, after quantitative evaluation of the accuracy and running speed of the five models of YOLOv5 algorithm, this paper selects YOLOv5x model as the detector of DeepSORT algorithm to improve the effect of target detection.

TABLE 5. Results of passing fish in fishways identification and counting.
However, it is inevitable that fish will block each other when swimming through the fishway. At this time, YOLOv5 algorithm can only recognize fish based on their local features, which easily affects the accuracy of recognition, and thus affects tracking. Therefore, it is not enough to rely only on the detection performance of YOLOv5 algorithm. ReID model is also needed to improve the matching ability of fish images between different frames through feature learning. The ability of ReID model to extract image representation information can be improved by increasing the number of layers of convolutional neural network. The network structure before and after the model improvement is shown in Table 2. This paper first divides the dataset shown in Figure 8 into training set and validation set, and then inputs them into the ReID model for training. The training process is shown in Figure 11. Finally, the top1err (top-1 error) error rate is used as an indicator to evaluate the performance of the ReID model before and after improvement. Top1err indicates the proportion of the fish species with the highest probability predicted by the algorithm to the total number of samples. The lower the top1err, the lower the model error rate, that is, the more accurate the model. The improved model top1err is 40.3%, while the improved model top1err is 20.3%, which reduces the error rate by 20% compared with the original model.
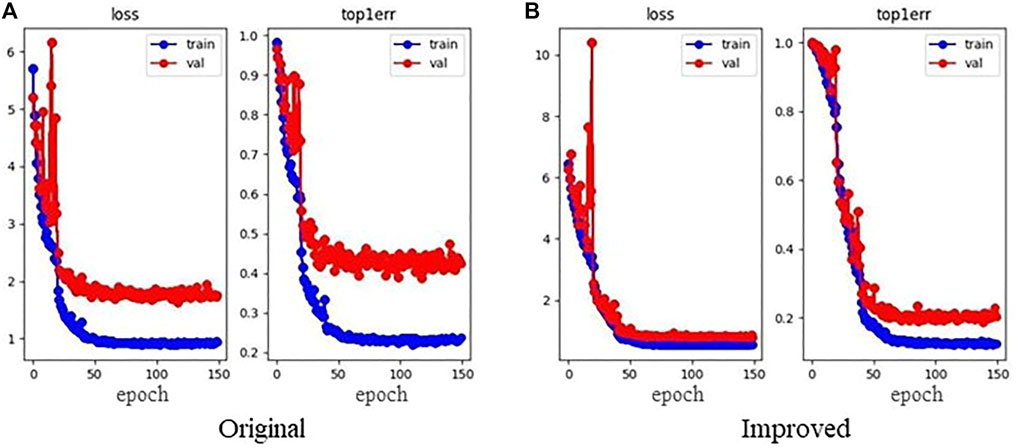
FIGURE 11. Top1err change curve during original model and improved model.
Through the comparison and analysis of YOLOv5 target detection model and ReID model before and after improvement, this paper refines the DeepSORT algorithm by combining YOLOv5x model and the improved ReID model, and conducts experiments on fish species recognition and counting. First, manually count the passing fish in the fishways in the video. The video is played and the center of video is taken as the reference line, the types of fish, the corresponding number of upward and downward are recorded and until the end of video. Obtain the upward and downward quantity and total quantity of each target fish in the fishway during the monitoring period. Then use the improved algorithm to read the video frame by frame, and automatically count the fish species, number, upward and downward in the video. Finally, compare the output results of the algorithm with the results of manual counting to evaluate the accuracy of the algorithm. In this paper,
where
Figure 12 is an example of tracking results of passing fish video based on the algorithm proposed in this paper. It can be seen that from frame 1 to 64, the algorithm continuously tracks two fish with ID numbers of 1 and 2 respectively and remains unchanged. At frame 64, the third fish appears, and the algorithm still tracks the original targets (ID1 and ID2) when assigning its ID (ID3). At frame 124, the fish block each other and target 1 is lost. However, at frame 169, the algorithm matches the original ID1 target and recovers its tracking. Therefore, although there is intermittent occlusion and part of the tracking information is lost when the fish swims through the fishway, the improved DeepSORT algorithm can still recover the tracking of the target by matching and keep the original ID unchanged.
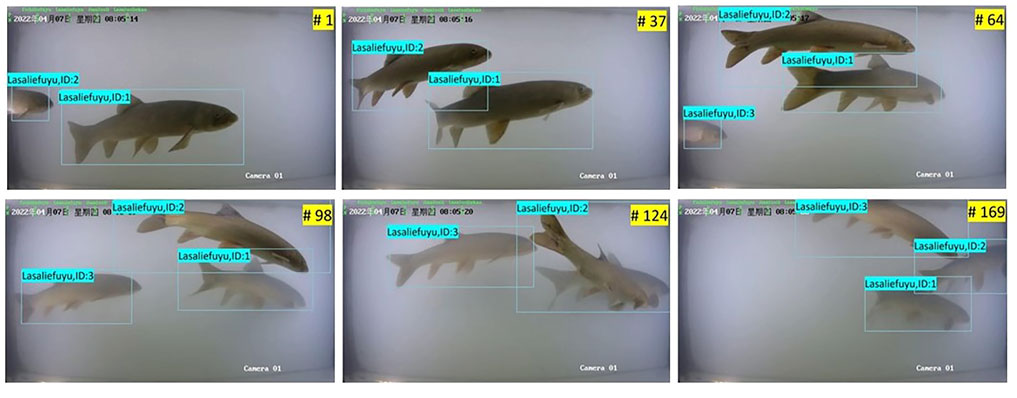
FIGURE 12. Example of video tracking of the passing fish in fishways.
For manual counting, the following method is adopted in this paper: 2 researchers who have the ability to identify the target fish are selected to review the video of passing fish during the monitoring period and record the fish species and upward and downward information. Lastly, the statistical results of the two people are compared and verified to obtain the final accurate data of passing fish. The results of manual counting and algorithm counting are shown in Table 5. Based on the formula 12, 13, the counting accuracy of Schizothorax o’connori, S. waltoni, S. younghusbandi, O. stewartii were 83.6%, 71.1%, 68.1% and 79.3% respectively, with the average counting accuracy of 75.5%. The algorithm results in this paper have a certain degree of deviation from the results of manual counting, which may be mainly due to the ambiguity of fish images, the uncertainty of direction caused by the change of swimming posture, etc., which causes the error of target detection and affects the target tracking effect.
We use FPS(Frame Per Second) to assess the running speed of the model. Taking the number of fish in the video as the index, we select three scenarios: low density (
The main reason why there is still a certain gap between the method proposed in this paper and manual counting is that it is affected by the bad underwater imaging environment. The water body and suspended particles in the water make the light suffer from scattering and absorption effects in the water, leading to defects such as low contrast, blurred texture and low chromaticity of the acquired underwater image. The fish appearance feature is the most critical indicator for this method to distinguish and track different fish. Therefore, if the input image quality is poor, the recognition accuracy will be significantly affected. In addition, combined with Figure 5, it can be seen that the appearance phenotypic characteristics of Schizothorax o’connori and S. waltoni are relatively obvious. But for S. younghusbandi and O. stewartii, they are similar in other aspects except for the difference between the body surface with or without spots. Especially when the characteristics of juvenile fish are not fully developed, the similarity between target fish is large, and it is difficult to distinguish them by this method only through the existing appearance characteristics.
This paper is based on video information to track and count passing fish through the fishway. When fish enter the monitoring area, the algorithm will record the type information and location information of the detected target, and judge whether to count according to the counting conditions. Compared with the method of traffic flow statistics and pedestrian counting (Li et al., 2022; Zhu et al., 2022), the randomness of fish movement state (location and direction of movement) is stronger, which further increases the difficulty of this algorithm in identifying fish species and counting statistics. In Table 5, except for the O. stewartii, the number of fish descending counted by this algorithm is higher than the result of manual counting, which may be caused by the difference between the two counting standards and the movement of fish. The upward movement of a fish is part of the process of swimming against the current. If its swimming speed is lower than the flow velocity in the fishway, it will be washed down by the water. For manual counting, because researchers have certain fish identification ability, they can judge whether the fish washed down by the current is the fish that has passed the baseline before. If it is the same fish, it will not be counted as downward. However, for this method, considering the running efficiency and computational power of the algorithm, it only supports the retrieval and recording of targets within 30 frames. Therefore, if the camera does not obtain the image of a fish for a long time, when the fish reappears, this algorithm will record it as a new target and count it down. In this study, the camera is fixed, when the fish moves, there is a relative movement between them. Especially when the fish swims fast, it is easy to cause the camera image to be blurred. If the algorithm cannot detect the target in the baseline crossing area, the counting result will be smaller than the manual counting result. Mutual occlusion of fish and twisting of fish bodies can also lead to missed fish detection and can also cause algorithmic counts to be smaller than manual counts.
Compared with the manual statistical results of professionals with fish identification ability, this method is superior to the latter in terms of processing efficiency and cost, although it is less accurate. In addition, fish identification requires professional technical support, and the staff in daily operation and maintenance management of the fishway need to be trained to have the corresponding ability. For this method, as long as there is enough sample size for learning and training, the species identification and counting of target fish can be achieved. In the future, the accuracy of fish counting can be further improved by upgrading image acquisition equipment, improving algorithms and expanding the amount of model data.
In this paper, the DeepSORT algorithm is improved by replacing the detector from Faster R-CNN to YOLOv5, improving the ReID model and adding the baseline crossing count. In addition, the dynamic identification and automatic counting of the number of passing fish through the fishway are studied with examples. The main findings are as follows:
(1) A method of YOLOv5 with DeepSORT for dynamic identification and automatic counting of passing fish passing through the fishway is innovatively proposed, which preliminarily realizes the non-destructive and accurate evaluation the effect of the passing fish in the fishways.
(2) A neural network model for dynamic identification of fish species and automatic statistics of fish counting in the fishway project in the middle reaches of the Y River was constructed, and was first applied to engineering practice. It has realized the species identification and counting of four target fishes, including Schizothorax o’connori, S. waltoni, S. younghusbandi and O. stewartii, with an average counting accuracy of 75.5%. The model provides a technical scheme for monitoring passing fish through the middle reaches of the Y River, and provides a research example for evaluating the passing fish effect of similar fishway projects in other watersheds.
(3) This method is highly applicable and can be used to construct different fish species identification and counting models according to the characteristics of passing fish facilities and targets. In the future, the data set will be further expanded, the robustness of the model will be improved, the structure of the algorithm will be optimized, and the accuracy and application scope of the algorithm will be improved.
(4) The method of dynamic identification and automatic counting of the number of passing fish through the fishway proposed in this paper is more time-efficient than the traditional monitoring method and can realize real-time monitoring of passing fish through the fishway. It makes up for the shortcomings of traditional monitoring methods in the evaluation of passing fish in fishways effect, such as strong contingency as well as short time sequence, and greatly reduces the monitoring cost. In the future, it is recommended that this method be applied to long time series fishway monitoring, thus providing data and technical support for decision making in fishway monitoring and adaptive management of fishway projects.
The raw data supporting the conclusion of this article will be made available by the authors, without undue reservation.
Ethical review and approval was not required for the animal study. This research only involves the acquisition and processing of fish images, which belongs to the field of aquatic ecological monitoring.
BW is the first author of this article. CL is the corresponding author of this article. All authors of this article share the identity of the last author. BW and JL worked together to prepare the data and plots whileCL, BW, and FJ discussed ideas and wrote the manuscript. ZY supplemented some additional experiments.
Key projects of intergovernmental international scientific and technological innovation cooperation. (2022YFEO117400). Co-funded by the China Institute of Water Resources and Hydropower Research “Five Talents” special project (SD0145B032021, SD0145B022021) and the National Natural Science Foundation of China (51809291).
We wish to acknowledge all the members of groups with their sharing contributions in this research. We thank IWHR for the financial support.
ZY was employed by Huaneng Tibet Yarlu Zangbo River Hydropower Development Investment Co., Ltd.
The remaining authors declare that the research was conducted in the absence of any commercial or financial relationships that could be construed as a potential conflict of interest.
All claims expressed in this article are solely those of the authors and do not necessarily represent those of their affiliated organizations, or those of the publisher, the editors and the reviewers. Any product that may be evaluated in this article, or claim that may be made by its manufacturer, is not guaranteed or endorsed by the publisher.
The Supplementary Material for this article can be found online at: https://www.frontiersin.org/articles/10.3389/fenvs.2023.1059217/full#supplementary-material
Baiyin, B., Guo, J., and Wu, Y. (2011). Construction and operation of typical foreign fish crossing facilities. J. China Acad. Water Resour. Hydropower Sci. 9 (02), 116–120.
Bewley, A., Ge, Z., Ott, L., Ramos, F., and Upcroft, B. (2016). “Simple online and realtime tracking with a deep association metric,” in 2016 IEEE International Conference on Image Processing (ICIP), Beijing, China, 25-28 Sept. 2016.
Bingpeng, X., Heshan, L., Zhilan, Z., Chunguang, W., Yanguo, W., and Jianjun, W. (2018). DNA barcoding for identification of fish species in the Taiwan Strait. PLoS One 13 (6), e0198109. doi:10.1371/journal.pone.0198109
Cai, T., and Zhao, Z. (2020). Convolutional neural network-based surgical instrument detection. Technol. Health Care 28 (S1), 81–88. doi:10.3233/thc-209009
Cao, J., Li, Y., Sun, H., Xie, J., Huang, K., and Pang, Y. (2022). A review of visual target detection techniques based on deep learning. Chin. J. Graph. 27 (06), 1697–1722.
Chai, Z., Wang, C., and Bi, H. (2021). Rapid identification between two fish species using UV-vis spectroscopy for substitution detection. Molecules 26 (21), 6529. doi:10.3390/molecules26216529
Chen, K. L., Chang, Z. N., Cao, X. H., and Ge, H. F. (2012). Current status and prospects of fish passage construction in China. J. Water Resour. 43 (2), 182–188+197.
Ciaparrone, G., Luque Sánchez, F., Tabik, S., Troiano, L., Tagliaferri, R., and Herrera, F. (2020). Deep learning in video multi-object tracking: A survey. Neurocomputing 381, 61–88. doi:10.1016/j.neucom.2019.11.023
Ding, L. Q., He, X. H., Li, X. F., Fang, D. A., and Xu, D. P. (2020). The larvae and juvenile fish resources of the four major Chinese carps at Anqing section in the lower reaches of the Yangtze River from 2016 to 2018. J. Lake Sci. 32 (04), 1116–1125. doi:10.18307/2020.0419
Grewal, M. S., and Andrews, A. P. (2001). Kalman filtering: Theory and practice using MATLAB. Upper Saddle River: Prentice-Hall.
Gu, Z., and Zhu, M. (2018). Research on fish classification algorithm based on deep learning. Comput. Appl. Softw. 35 (1), 200–205.
Gupta, R., Srivastava, D., Sahu, M., Tiwari, S., Ambasta, R. K., and Kumar, P. (2021). Artificial intelligence to deep learning: Machine intelligence approach for drug discovery. Mol. Divers 25 (3), 1315–1360. doi:10.1007/s11030-021-10217-3
Huang, H., and Li, Q. (2017). Image recognition of seepage water disease in shield tunnel based on deep learning. Chin. J. Rock Mech. Eng. 36 (12), 2861–2871.
Huang, Y. P., Cai, L., and Yuan, X. (2020). Fish behavior research and flow design of fish passage facilities. Beijing: Science Press.
Jia, S., Gao, H., and Hang, X. (2019). Research progress on image recognition technology of crop diseases and insect pests based on deep learning. Trans. Chin. Soc. Agric. Mach. 50 (1), 313–317.
Jian, Z., Yichuan, W., Senfan, K., Yanqin, B., Junjun, T., Zhixiong, L., et al. (2020). Monitoring effect of half-duplex PIT telemetry. Chin. J. Ecol. 39 (08), 2802–2809.
Jin, Y., Wang, X., Tao, J., and Hu, W. B. (2022). Analysis of fish passage efficiency and fish behavior in vertical slit fishways based on PIT telemetry. J. Agric. Eng. 38 (04), 251–259.
Li, J., Zhu, K., and Yang, S. (2019). A migration learning-based approach for marine fish identification in complex scenes. Comput. Appl. Softw. 36 (9), 168–174.
Li, Q. Z., Li, Y. B., and Niu, J. J. (2019). Real-time detection of underwater fish targets based on improved YOLO and migration learning. Pattern Recognit. Artif. Intell. 32 (3), 193–203.
Li, Y., Ma, R., and Zhang, M. (2022). Improving YOLOv5s+DeepSORT for monitoring video traffic statistics. Comput. Eng. Appl. 58 (05), 271–279.
Liimatainen, K., Huttunen, R., Latonen, L., and Ruusuvuori, P. (2021). Convolutional neural network-based artificial intelligence for classification of protein localization patterns. Biomolecules 11 (2), 264. doi:10.3390/biom11020264
Lin, M. W. (2017). Fish image recognition and classification based on convolutional neural network. Electron. Technol. Softw. Eng. 2017 (6), 82–83.
Ma, T., Xiao, P., Zhang, X., Duan, H., and Qiu, Y. (2022). Based on video monitoring image ring of chaohu cyanobacteria real-time dynamic monitoring. Lake Sci. 2022, 1–6.
Mirra, G., Holland, A., Roudavski, S., Wijnands, J. S., and Pugnale, A. (2022). An artificial intelligence agent that synthesises visual abstractions of natural forms to support the design of human-made habitat structures. Front. Ecol. Evol. 10. doi:10.3389/fevo.2022.806453
Pepe, T., Trotta, M., Di Marco, I., Anastasio, A., Bautista, J. M., and Cortesi, M. L. (2007). Fish species identification in surimi-based products. J. Agric. Food Chem. 55 (9), 3681–3685. doi:10.1021/jf063321o
Pereira, L. H. G., Castro, J. R. C., Vargas, P. M. H., Gomez, J. A. M., and Oliveira, C. (2021). The use of an integrative approach to improve accuracy of species identification and detection of new species in studies of stream fish diversity. Genetica 149 (2), 103–116. doi:10.1007/s10709-021-00118-6
Redmon, J., Divvala, S., Girshick, R., and Farhadi, A. (2016)). “You only Look once: Unified, real-time object detection,” in 2016 IEEE Conference on Computer Vision and Pattern Recognition (CVPR), Las Vegas, NV, USA, 27-30 June 2016.
Shafiee, M. J., Chywl, B., Li, F., and Wong, A. (2017). A fast you only Look once system for real-time embedded object detection in video. J. Comput. Vis. Imaging Syst. 3 (1). doi:10.15353/vsnl.v3i1.171
Tao, J. P., Wen, J. Y., and He, D. (2018). Research progress on monitoring the effect of upstream overfish facilities. Resour. Environ. Yangtze Basin 27 (10), 2270–2282.
Tao, Y., Shi, X., Zhang, J., Jiang, Z. W., luo, J. M., Lei, Q. S., et al. (2021). Monitoring and analysis of overfish effect of full-duplex radio frequency identification technology. Chin. J. Hydroecology 42 (4), 84–90.
Wan, P., Pan, H., Long, C., and Chen, H. (2012). Design of online recognition device for freshwater fish species based on machine vision technology. Food and Mach. 28 (06), 164–167.
Wen, J., Chen, A., Cao, N., Huang, R., Wang, H., and Wang, P. (2019). Review on the evaluation and monitoring technology of operation effect of overfish facilities at home and abroad. Prog. Water Conservancy Hydropower Sci. Technol. 39 (05), 49–55.
Wojke, N., Bewley, A., and Paulus, D. (2017). “Simple online and realtime tracking with a deep association metric,” in 2017 IEEE International Conference on Image Processing (ICIP), Beijing, China, 17-20 Sept. 2017.
Zhang, J.-L., Zeng, G.-S., and Qin, R.-F. (2019). A deep learning-based method for fish identification in seafloor observation videos. Comput. Appl. 39 (2), 376–381.
Zhang, J., Kong, F., Wu, J., Zhai, Z., Han, S., and Cao, S. (2018). Cotton disease recognition model based on improved VGG convolutional neural network. J. China Agric. Univ. 23 (11), 161–171.
Zhang, S., Peng, F., Ji, Y., Zhang, J., Zhang, Q., Li, Q., et al. (2022). Research on a novel data assimilation algorithm for real-time identification of coupled sensitive parameters--a case study of lake algae simulation. Lake Sci. 2022, 1–16.
Zhang, W., Ma, Q., Li, M., Chen, Z., and Xin, G. (2020). Hatch dates and growth rates of grass carp (Ctenopharyngodon idellus) and silver carp (Hypophthalmichthys molitrix) juveniles in Three Gorges Reservoir, Lake Dongting and Lake Poyang. J. Lake Sci. 32 (03), 804–812. doi:10.18307/2020.0320
Zhang, Y. Y., He, Z. J., He, Y., Zhang, J. M., and Zhang, K. (2017). Evaluation of fish passage effect of low head dam project. J. Hydraulic Eng. 48 (6), 748–756.
Zhu, J., Zhang, T., Xie, Y., Zhang, J., Li, B., Zhao, L., et al. (2022). An intelligent statistical method for video foot traffic taking into account small target features. J. Southwest Jiaot. Univ. 57 (04), 705–712+736.
Keywords: DeepSORT, YOLOv5, re-identification (ReID), dynamic identification of passing fish species, automatic counting
Citation: Wu B, Liu C, Jiang F, Li J and Yang Z (2023) Dynamic identification and automatic counting of the number of passing fish species based on the improved DeepSORT algorithm. Front. Environ. Sci. 11:1059217. doi: 10.3389/fenvs.2023.1059217
Received: 01 October 2022; Accepted: 06 March 2023;
Published: 16 March 2023.
Edited by:
Flavio Cannavo’, National Institute of Geophysics and Volcanology, ItalyReviewed by:
Mihir Durve, Italian Institute of Technology (IIT), ItalyCopyright © 2023 Wu, Liu, Jiang, Li and Yang. This is an open-access article distributed under the terms of the Creative Commons Attribution License (CC BY). The use, distribution or reproduction in other forums is permitted, provided the original author(s) and the copyright owner(s) are credited and that the original publication in this journal is cited, in accordance with accepted academic practice. No use, distribution or reproduction is permitted which does not comply with these terms.
*Correspondence: Chunna Liu, bGl1Y25AaXdoci5jb20=
Disclaimer: All claims expressed in this article are solely those of the authors and do not necessarily represent those of their affiliated organizations, or those of the publisher, the editors and the reviewers. Any product that may be evaluated in this article or claim that may be made by its manufacturer is not guaranteed or endorsed by the publisher.
Research integrity at Frontiers
Learn more about the work of our research integrity team to safeguard the quality of each article we publish.