 Guangxia Zhang
 Yanfang Liu
 Ying Jing
 Huiting Chen
 Yiheng Wang1
94% of researchers rate our articles as excellent or good
Learn more about the work of our research integrity team to safeguard the quality of each article we publish.
Find out more
ORIGINAL RESEARCH article
Front. Environ. Sci., 26 January 2023
Sec. Land Use Dynamics
Volume 11 - 2023 | https://doi.org/10.3389/fenvs.2023.1057812
This article is part of the Research TopicTowards Sustainable Urban Development: Use of Geographic Big Data for Spatial PlanningView all 25 articles
With the rapid development of high-speed railway (HSR), many scholars have studied the competition between HSR and aviation or inter-city coach, but few studies have discussed the supply-service relationship within the railway system. This paper explores the competition and cooperation between HSR and conventional railway (CR) at the city-pair level of 39 core cities in China from the temporal perspective. Comprehensive considering the departure time and arrival time between city pairs as the representation of train service quality, we find that the proportion of superior quality service of high-speed train (HST) is far higher than that of conventional train (CT). However, the time slots representing the competition degree show that CR with fewer superior quality trains is easier to be replaced than HSR. The supply-service relationships of the railway system indicate that HSR has become the main transportation mode between core cities, and the CR, as an auxiliary transportation, shows a certain complementary effect in the temporal perspective. Spatially, HSR and CR services are more likely to generate temporal competition on the mainline, but temporal complementarity between city pairs on non-arterial lines. This study can provide inspiration for regional spatial planning by better understanding the operation strategy of railway passenger transport system.
A new method to identify the supply service relationship between high speed railway (HSR) and conventional railway (CR) is proposed.
We propose a method to divide train service quality based on time availability.
We find the characteristics of quantity and quality of HSR and CR are very different.
The supply service relationship between HSR and CR shows that they have cooperation potential in terms of time.
As a physical connection between cities, railway is one of the most important basic conditions for urban development. High-speed railway (HSR), as the most significant technological breakthrough of railway system since 1964, has greatly shortened the intercity travel time (Spiekermann and Wegener, 1994; Shaw, Fang, Lu, and Tao, 2014). Because of its high accessibility and high frequency, HSR generates substitution effect by attracting passengers from other transport modes, which leading to a reallocation of the passenger market (Lee and Chang, 2006; Zhang et al., 2018; Wang et al., 2020b; Yang et al., 2018a). For example, China has built the world’s largest HSR network after more than 10 years of rapid development, making the proportion of railway passenger traffic in 2020 to be 4.4 times that in 2010. In addition, HSR also reduces CO2 emissions and haze pollution by influencing the intercity traffic patterns (Jiang et al., 2021; Li et al., 2022). However, the high construction and operation costs of HSR cannot be ignored by government departments and urban planners. Therefore, exploring the competition and cooperation between HSR and other intercity traffic modes is an important research issue for regional sustainable development and transportation optimization.
The impacts of HSR on air travel have been analyzed in many countries due to the high speed characteristics of two transport modes (Dobruszkes et al., 2014; Castillo-Manzano et al., 2015; Delaplace and Dobruszkes, 2015; Zhang et al., 2018). In recent years, the impacts of HSR on the railway system have gradually attracted the attention of scholars. For example, the change of passenger flow indicates that the development of HSR has a strong substitution effect on conventional railway (CR) in China due to the time-saving advantages of HSR (Cheng and Chen, 2021). But CR is still the best choice for cities with lower population density and poor socioeconomic performance (Shaw et al., 2014). Recent studies have shown the importance of cooperation between HSR and CR in improving travel efficiency and achieving spatial and social equity (Zhang. H et al., 2020; Huang and Zong, 2022). However, although some studies have compared the similarity and difference of the spatial pattern between HSR and CR from accessibility or network structure (Zhang. H et al., 2020; Huang and Zong, 2022), the exploration from the time dimension has not yet been seen. Therefore, it is necessary to deeply study the operation strategy of railway passenger transportation system from the perspective of time.
Traditionally, the schedules reflect the operation and management strategy of public transport supplier (Burghouwt and de Wit, 2005; Dobruszkes, 2011; Huang and Wang, 2017), which scholars have used to conduct a large number of empirical studies. For example, while there is potential temporal competition between China’s HSR and airlines, the two have complementary spatial and temporal effects in resisting different types of hazards (Wang et al., 2020b; Li and Rong, 2022). In the railway system, train schedules show that the service intensity of HSR and CR are complementary in terms of spatial distribution (Huang and Zong, 2022). Railway departments operate more frequent high-speed trains (HST) during the peak hours of passenger travel (Wang et al., 2020b), but the characteristics of time slot between HST and conventional trains (CT) have not yet received attentions. To fill this gap, this paper explores the supply-service relationship between HSR and CR at the city-pair level based on train schedules, in order to better understand the competition and cooperation strategy of railway system. In addition, this paper measures the service quality level by comprehensively considering the departure time and arrival time of trains to distinguish the homogeneous train service in previous studies. And we assume that the smaller the time slot of departure time, the greater the degree of competition between HST and CT in the same city pair.
As the HSR is mainly designed to connect large cities, in general, core cities benefit more from HSR than peripheral cities (Levinson, 2012; An et al., 2022). In addition, studies have shown that the core layer is the densest cluster in the railway network structure (Zhang. H et al., 2020), carrying most of the traffic flow (Huang and Zong, 2022). Therefore, we attempt to enrich the research on HSR and CR supply-service relationships among core cities, and take 39 core cities with high administrative level or high population in China as research objects. Under the study objectives above, this paper 1) analyzed the distribution characteristics of service intensity of the HST and CT between core city-pairs, 2) distinguished the service quality types of HST and CT which determined by both departure time and arrival time, and 3) measured the level of substitutability between HST and CT from time slot perspectives. Furthermore, according to the quantity and quality of trains, the improved classification method identifies relationships between HSR and CR at the city-pair level, including single mode dominant type, cooperation complementary type and competition type.
The structure of this paper is as follows: Section 2 reviews the existing researches on the relationship between HSR and other transportation modes; Section 3 introduces the development of HSR in China and the research methods in this paper. Section 4 presents the results; Section 5 discusses the policy implications of the relationship between the two rail services; and Section 6 draws conclusions.
The emergence of HSR has directly shortened the space-time distance, and indirectly changed the intercity travel mode. Empirical studies in many countries show that the construction of HSR can significantly improve the accessibility between cities (Shaw et al., 2014; Wang, 2018; Weng et al., 2020), making some governments strive for HSR stops. Due to differences in geographic regions and population sizes, the impacts of HSR development on economic growth are uneven (Guo et al., 2020; Jiao et al., 2020; Zhang. F, et al., 2020). With the advantages of low price compared with air and time saving compared with CR, HSR has led to the redistribution of market share by attracting passengers from other transportation modes (González-Savignat, 2004; Lee and Chang, 2006; Yang et al., 2018a). In addition, studies have shown that HSR has become an important tool to promote regional integration by providing convenient intercity travel services, which in turn will generate new intercity transportation needs (Cascetta and Coppola, 2015). For example, due to the high housing prices in Beijing and the convenient HSR services with surrounding small cities, a number of passengers have taken HST as their daily commuter. However, HSR is not always the best choice for low-density and economically underdeveloped areas due to the huge cost of construction and operation.
Many studies have explored the competitiveness of intercity transport from different perspectives, including individual trips, changes in passenger traffic, and provision of services. For individuals, although the influence degree of each factor varies depending on the travel distance, transportation mode choice is the result of the combination of transportation mode attributes, travel attributes, and individual passenger attributes (Castillo-Manzano et al., 2015; Lee et al., 2016; Li. X. W et al., 2021). Specifically, passengers with higher education levels, higher income levels, or business trips are more likely to choose comfortable and time-saving transportation modes, such as HSR and airline. While passengers who are concerned about travel costs and are not time-sensitive are more likely to choose CR or intercity coach (Wang et al., 2017; Zhou et al., 2019). In terms of passenger traffic, HSR is more competitive in cities with better social economy, regardless of whether it is compared to airline or CR (Yang et al., 2018a; Yang et al., 2018b; Cheng and Chen, 2021). Empirical evidence shows that HSR is the most competitive compared to airline when the travel distance is within 500–800 km (Chen, 2017). In China, the substitution effect of HSR on CR varies spatially in different corridors (Huang and Zong, 2022). In terms of supply, the frequency change in the time dimension and the travel time change in the space dimension of HSR have a significant impact on air passenger flow (Yang et al., 2018a). Considering the high cost of HSR, railway operators need to adjust the service frequency of HSR to cover the cost.
In addition to competition, HSR has great demand and potential for cooperation with other transportation modes, including multimodal combined transport and complementation. From the perspective of individual travel, the combined of multiple transportation modes can significantly improve the accessibility and transportation efficiency of the whole journey chain. For example, integrated railway stations can realize rapid transfer between HST and CT, which significantly improve the efficiency of the railway system (Zhang. H et al., 2020). In addition, the effective connections between HSR and urban public transport can significantly shorten the total travel time (Huang and Zong, 2021), making up for the lack that HSR stations are far away from urban centers (Wang et al., 2013; Diao et al., 2017). Therefore, the travel efficiency will be further improved with the construction of comprehensive stations that can serve multiple transportation modes. In terms of spatial cooperation and complementarity, HST services in China are more concentrated in regions with better socio-economic performance, while CT services are better at providing more extensive geographical coverage (Huang and Zong, 2022). As for temporal coordination and complementation, HST and air services coordinate and facilitate round-trip travel. Further, the space-time complementary effect of multiple traffic modes can improve the robustness against different types of hazards (Li and Rong, 2022).
In recent years, the importance of HSR services has been recognized, and many scholars have shifted from location-based network structures to timetable-based service characteristics. On one hand, location-based reachability often overestimates the results due to ignoring the intensity differences of services between nodes (Moyano et al., 2018). On the other hand, location-based evaluations only reveal the potential of transport network configuration, which cannot reflect the actual operational characteristics of traffic facilities. Fortunately, the availabilities of more and more operation schedules make it possible for scholars to explore transportation services from the perspective of suppliers. For example, small cities in Europe and China are underserved by HSR due to insufficient potential markets (Moyano and Dobruszkes, 2017; Huang and Zong, 2022). In addition, traffic dispatching not only affects the competition of multimodal transport (Dobruszkes et al., 2014; Castillo-Manzano et al., 2015; Lee et al., 2016; Broman and Eliasson, 2017), but also affects the time competition across transport modes (Espinosa-Aranda et al., 2015). Previous studies have investigated the competition between HSR and flights between cities by using the time window method, which only considered the departure time (Wang et al., 2020b).
To sum up, the introduction of HSR will have great impacts on the market share and service supply of other transportation modes. Therefore, exploring the competition and cooperation among different transportation modes is of great significance for optimizing transportation services. Existing studies have carried out a lot of researches on the relationship between HSR and airline, while the relationship between HSR and CR in the railway system has not received enough attentions. Although scholars have explored the spatial distribution of HSR and CR, they are limited to differences in spatial network structure and spatial service distribution. The relationship between these two transport services has not been analyzed from the perspective of time. Therefore, we interpreted the competition and collaboration between HSR and CR supply services from a time perspective. This study not only enriches the empirical research of comparative analysis of different intercity traffic, but also has important significance for optimizing the railway service system.
Since the reform and opening up from 1978, in order to better serve the development of urbanization, China’s traditional railway lines have rapidly formed the main trunk lines shown in Figure 1A. China released the HSR construction plan in 2004 (revised in 2016), and opened the first high standard HSR line between Beijing and Tianjin in 2008. In order to relieve the pressure on CR from the growing passenger demand, the Chinese government usually arranged HSR lines to be parallel to the existing CR lines (Figure 1B). The construction of China’s HSR network is long-term and balanced, and the opened lines gradually expand from large cities to small and medium-sized cities and inland areas (Perl and Goetz, 2015; Xu et al., 2018). At present, “the four-horizontal and four-vertical HSR trunk lines” have been put into operation, and “the eight-horizontal and eight-vertical HSR lines” are also being gradually opened. The latest research shows that China’s train service presents a complex hierarchical network (Xin and Niu, 2022), and core cities have a large number of HST services and CT services at the same time (Huang and Zong, 2022). Therefore, this paper takes cities with high administrative level or urban permanent population larger than one million in mainland China as core cities, including 39 cities in Figure 1, which is the research object of this paper.
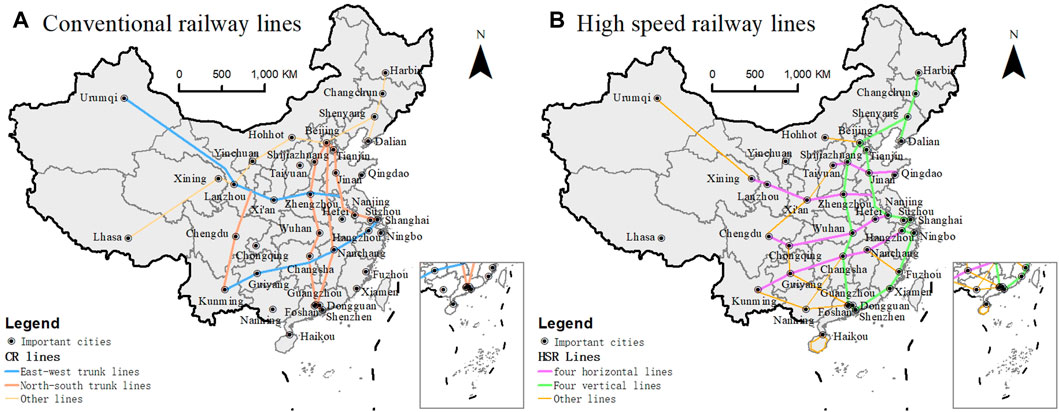
FIGURE 1. Spatial distribution of CR lines (A) and HSR lines (B) in operation in 2020.
As shown in Table 1, there are seven types of train number initials in the train timetable. The minimum planned running speed of the train prefixed with C\D\G is 200 km/h, which is called HST in this paper. CT include four types of railway trains, but the maximum speed is only 160 km/h. The Chinese government regards HSR as an important tool to improve railway transport capacity (Wu et al., 2014). Therefore, the number of HST in service is increasing year by year, while the number of CT is experiencing a gradual decline. G-type trains are the most in operation between core cities, and HST accounts for three-quarters of the total trains (Table 1).
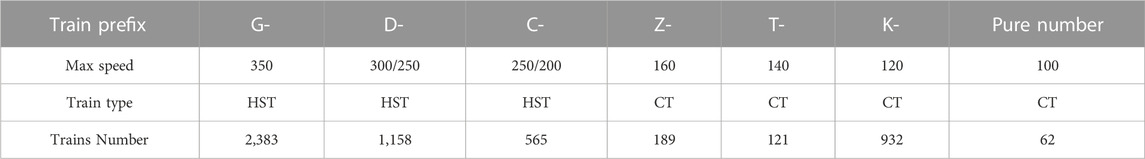
TABLE 1. Classification of train types.
Since the railway timetable is adjusted at a certain time, and the schedule of 1 day is fixed for a period of time, we obtained the domestic railway timetable of September 2020 (http://www.12306.com), which can represent the daily dynamics of intercity railway service arrangement. The location of the railway station was found on Baidu map (https://map.baidu.com). Geographic vector data obtained from 14 million basic topographic maps, including national boundaries in China. The administrative location coordinates of core cities selected are also from Baidu map, which is used to calculate the distance between cities.
The train schedule directly reflects the connections between stations. We first used the P-space model to build the connection networks of HSR and CR. Subsequently, we simplified the station connection network to the city connection network according to the station attribution. We noticed that some cities may have more than one railway station. For example, Wuhan has three railway stops: Wuhan Station, Wuchang Station and Hankou Station. In the process of simplifying the network, we ignored the connection between stations in the same city, and considered the connection between multiple stations of the same train between two cities as only one connection. We defined city pairs with only one service as OnlyHSR/OnlyCR city pairs, while city pairs with both HST and CT services are defined as overlapping city pairs. For actual travel, passengers need to choose a way of overlapping city pairs according to their own conditions. Therefore, it is necessary to further explore whether these two railway services are competitive or complementary in overlapping city pairs from a temporal perspective.
The supply service intensity is measured by the train frequency widely used in current research (Jiao et al., 2017; Wang et al., 2020b). For a city pair, the obtained supply service intensity is the number of trains between the departure city and the arrival city in 1 day, which can be obtained from the train schedule. For a city, we no longer emphasized the directionality of service supply, and measured the service intensity with the sum of the train frequency of the city as the departure endpoint and the arrival endpoint, as shown below.
Where
Where
This paper defines the service quality of trains from the perspective of time, which is different from that characterized by topology and number of trains (Zhang. F et al., 2020). Railway scheduling determines the availability of train services in terms of time, which in turn influences passenger travel mode choices (Dobruszkes et al., 2014; Castillo-Manzano et al., 2015; Lee et al., 2016). Many empirical studies of door to door full journey show that the time spent before and after the train can not be ignored. Therefore, we believe that the time when passengers can connect with public transport is the superior time period of trains. In China, although the service time of bus or subway varies slightly in different cities or seasons, we find that it is usually between 6:30–22:30. Therefore, we defined this time period as superior service time.
This study defined the service quality provided by the train based on the departure time and arrival time. As shown in Figure 2, the color of the arrow represents the service quality types. Specifically, if the time of train T1 in departure city i and destination city j are both within the superior time period, it is considered that T1 provides superior service for city pair ij. If only the departure time or the arrival time is within the superior time period, it is considered as a moderate service, including 4 situations. If the departure time and arrival time are both not within the superior time period, it is considered to be a poor service, which also includes 4 situations. It is worth noting that the stopping time of a train at different stations varies, which may lead to differences in the quality service provided by the same train between different city pairs.
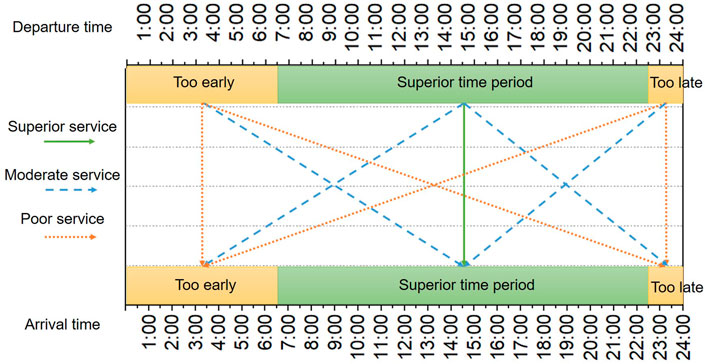
FIGURE 2. Classification methods of railway service quality.
Broman and Eliasson (2017) proposed that the competition took place between trains with similar departure times. In this paper, considering the quality of train services, it is recognized that only superior train services can compete (Borenstein and Netz, 1999). Put forward an index to quantify the time difference, the Time Difference Index (TDI), which refers to the absolute difference between the departure times of two transportation modes. For example, if an HST is scheduled at 8:00 a.m. and a CT is scheduled at 22:00 p.m., in this case, the TDI value is equal to 14. Since we define the superior service time as 6:30 to 22:30, the maximum TDI is 16 h. Superior overlapping city pairs, that is, city pairs with both superior quality CT and HST, are the objects that need to measure TDI. We calculate the TDIs between all superior HSTs and CTs in the same city, and calculate their average and minimum values, as shown in the following formula.
Where
Some studies have suggested that different transportation modes with TDI less than 1 h are substitutable (Wang et al., 2020b). According to this scheme, we regard HST and CT services with TDI less than 1 h as mutually replaceable, and count the frequencies of HST and CT that can be replaced according to the city pair, as shown below.
Where
Some studies have explored the relationship between different transportation modes, including spatial relationship or temporal relationship (Wang et al., 2020b; Huang and Zong, 2022). For the relationship types, it is generally considered that they can be classified as single transportation mode dominant, multi-modal coordination and complementary type, and multi-modal competition type. However, there is no consensus on the specific method of classifying relationship types, which needs to vary depending on the indicators measured in the study. Therefore, according to the general cognition, this paper divides the relationship between HSR and CR into the above three types. By referring to relevant studies (Wang et al., 2020b) and combining with the specific indicators measured in this paper, we propose a method to classify the supply-service relationship between HSR and CR at the city-pair level from the temporal perspective, as shown below. It is worth noting that the classification of relationship types is only for overlapping city pairs with superior HST and superior CT at the same time.
The first step can distinguish the dominant type of single railway model. For some city pairs, the number of superior HST in a day may be significantly larger or smaller than that of CT, indicating that intercity travel is dominated by a single train mode. Taking into account the Pareto principle (Craft and Leake, 2002), we defined HST as dominant when HST accounts for more than 80% of the total superior service for a city pair. On the contrary, the city pair is considered to be the CT dominant type when the proportion of superior CT exceeds 80% of the total superior services. It is possible that the city pairs with different single-model dominant have very different characteristics, which is why rail providers use different approaches to primarily serve them.
The second step distinguished is the type of coordination complementarity. Coordination complementarity as defined in existing studies implies the integration or maximization of benefits between different transportation modes (Givoni and Banister, 2006; Jiang and Zhang, 2014; Xia and Zhang, 2017). However, the coordination complementarity defined in this paper is for the TDI of departure time between HST and CT in a city pair. If the minimum TDI is large, it means that the train can serve passengers at different times for 1 day, which meeting the travel needs of different travel periods. Based on the thinking of time slot in previous studies (Wang et al., 2020b), we also divided city pairs with TDImin greater than 4 h into coordination complementary types.
In the third step, the competition types of the two railway services are divided. The competition in this paper is defined from the perspective of passengers. If the time slot of HST and CT in the same city pair is small, passengers need to consider choosing one, in which case there is competition between the two rail services. For different city pairs, we note the significant differences in the degree of competitions. Therefore, we further divided the competition into full competition, partial competition and slight competition according to the minimum TDI and substitutability index measured in 3.3.3. In this process, the substitutable index is graded based on a three-point scale, as shown in the following 3 steps. 1) Full competition: TDImin is within 1 h, and the substitutable index is greater than 0.67. Not only the departure times of HST and CT between these city pairs are close, but also the frequency of substitutable trains is high; 2) Partial competition: TDImin is within 1 h, and the substitutable index is between 0.33–0.67 or TDImin is greater than 1 h but less than 2 h, indicating that the degree of competition between HST and CT of these city pairs is moderate; 3) Slight competition: TDImin is within 1 h, but the substitutable index is less than 0.33 or TDImin is greater than 2 h but less than 4 h, which means that there is less competition between HST and CT for these city pairs.
As shown in Figure 3A, B, the HSR network has higher service intensity and CR network covers a wider space. CR network serves 1,137 city pairs among all core cities, while HSR network only includes 810 city pairs. The HSR network mainly connects cities in the southeast of Hu Huanyong Line, with a daily average frequency of 19.96. The CR network has a long distance feature, which makes the average distance between city pairs reach 1276.22 km. But 76.67% of the city pairs have a relative strength lower than 1. Generally speaking, the service intensity of the two networks are both limited by the distance. The greater the distance between cities, the lower the service intensity. However, there are city pairs with large distance but high service intensity in both networks. For example, the distance between Urumqi and Xi’an in CR network exceeds 2,100 km, while there are still 16 traditional trains every day. And the distance between Beijing and Shanghai in the HSRnetwork is close to 1,100 km, while there are nearly 50 high-speed trains every day.
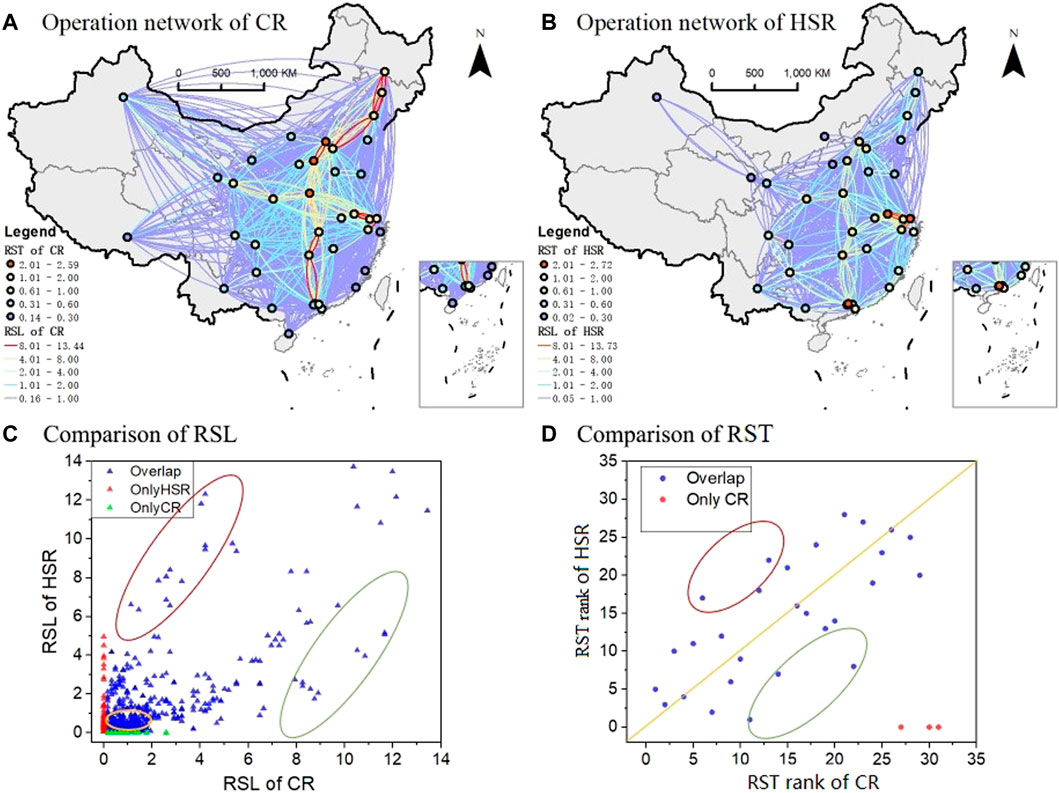
FIGURE 3. The spatial distribution of service intensity in CR network (A) and HSR network (B), and the comparison of RSL (C) and RST rank (D) between the two railway modes.
The relative service intensity of HSR is more advantageous in the south, while CR is more advantageous in the north. As shown in Figure 3C, there are 412 OnlyCR city pairs, but their relative strength is relatively low, and only 2 city pairs have RSL exceeding 2. Some OnlyHSR city pairs have higher RSL, with Fujian-Xiamen having the highest value, close to 5. For overlapping city pairs, the relative intensity of the two services varies greatly, with 76.41% of them having higher CR service intensity. According to the spatial distribution of service intensity, we found that the high CR service city pairs represented by the green circles are generally located in the northern region, while the high HSR service city pairs represented by the red circles are generally located in the southern region. In addition, some cities have very low HSR and CR frequencies (shown by the yellow circles), indicating that these two services work together to meet the transportation needs of these city pairs.
For cities, the daily train service intensity of the two networks is very different. On the whole, the average daily train frequency of each city in CR network is 359.74, while the value of HSR is as high as 872.92. Specifically, in CR network, the values of relative service intensity in Zhengzhou, Beijing and Shijiazhuang are greater than 2. In the HSRnetwork, the service intensity values of Nanjing, Shanghai and Guangzhou are more than twice the average. As shown in Figure 3D, compared with the CR network, the relative intensity of cities in the HSR network are quite different, with the most significant increase in Hefei and Nanjing (green circle), while the most significant decrease in Shenyang and Lanzhou (red circle). This means that the two rail service levels are spatially unbalanced. Some cities represented by the Yangtze River Delta region have better HSR services, while some cities represented by the three northeastern provinces have more advantages in CR services.
The time structure of train operation reflects the quality characteristics of supply service. The daily departure and arrival rhythm of trains in HSR and CR networks are quite different.We aggregated the number of departing and arriving HST(CT) per hour in a day from the train schedule, as shown in Figures 4A, B. In HSR network, the trend of departure and arrival rhythm changes with time is the same, but the changing time nodes are different. The number of HST departures and arrivals both surged from 6 a.m, and the peak numbers were almost the same. The peak time of HST departure is 9:00 a.m. to 17:00 p.m., while the peak time of HST arrival is 14:00 p.m. to 22:00 p.m. The intersection of the two curves shows that the number of HST departures is greater than the number of arrivals before 12:00 during the day, while the opposite is true after 17:00 p.m. In CR network, the departure number of CTs wavelike rises with time, while the arrival number of CTs has the opposite trend. Unlike the HSR network, CT has more arrivals than departures before 12:00 a.m. This means that the service time of HSTs and CTs is different in a day, and they are complementary to each other to a certain extent.
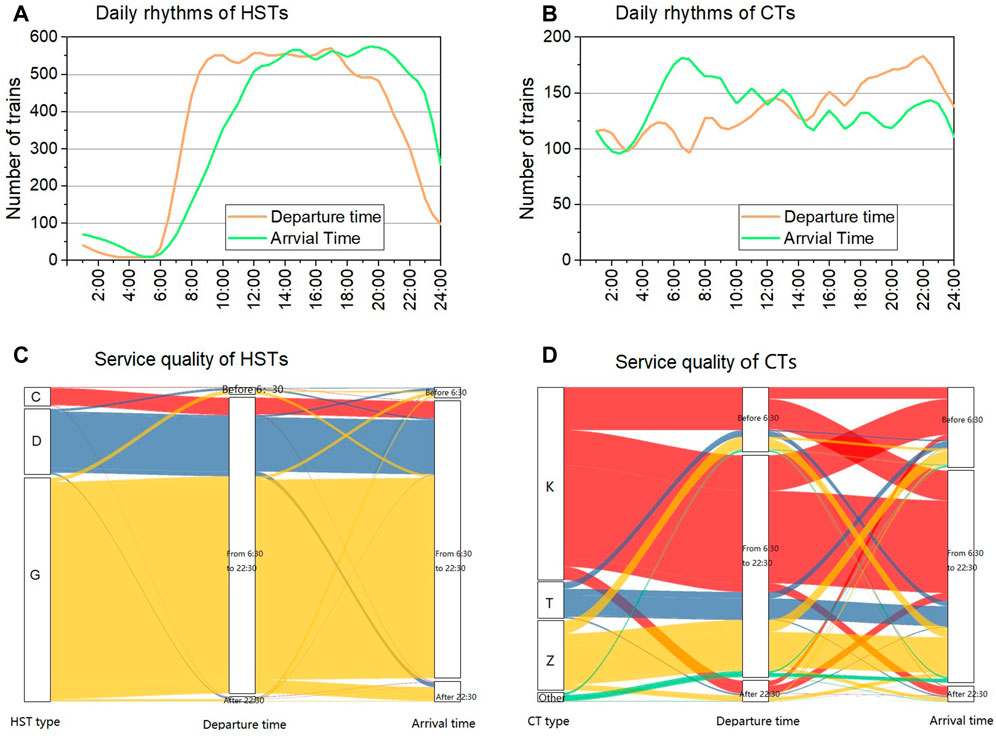
FIGURE 4. Daily rhythme of HSTs (A) and CTs (B) and the service quality of HSTs (C) and CTs (D) for overlapping city pairs.
Considering the departure time and arrival time of trains between city pairs, as shown in Figures 4C, D, the service levels of different train types are very different. In the HSR network, G-type service is the largest, accounting for 72.75%, and C-type service only accounts for 5.92%. However, the superior service proportion of G-type and C-type are both about 90%, while that of D-type is only 82.85%. In the CR network, K-type trains serve the most, accounting for 62.74%, followed by Z-type trains. Type T has the best service quality, with superior services accounting for 55.01%. Other-types trains are not only the least in number but also the worst in service. In general, the service quality of HST is much higher than that of CT. As there are few high-speed trains running at night, most HST departure and arrival times are located in superior service areas, making the proportion of superior service as high as 88.33%. The superior service rate of CTs is only 51.08%, which means that only half of CTs can provide convenient boarding and alighting services for passengers. However, for price-conscious passengers, HST’s superior service is not attractive. Therefore, although the quantity and quality of CT services are not dominant, it still has the potential to replace HST to a certain extent.
For city pairs, the distribution of superior services in HST and CT is very different. Figures 5A, B show the change in the number and quality of services for city pairs with distance. In the HSR network, the superior service rates of most city pairs are distributed on both sides of the average, which means that the average can reflect the overall situation. Most of the city pairs with RSL greater than 1 have a higher proportion of superior service rates than the average, which means that these city pairs with greater service intensity also have higher service quality. In addition, citie pairs with low service intensity also have the possibility of high service quality. In the CR network, the city pairs with superior ratios of 0 and 1 account for 15.39% and 33.25%, respectively, so that the average value cannot represent the general value. The proportion of superior ratios in cities with greater service intensity is widely distributed with RSL. For example, the superior CT ratio between Beijing and Shijiazhuang is as high as 63.89%, while the value between Tianjin and Shenyang is only 11.11%. We noticed that although some city pairs are close in distance, their service intensity and superior ratio are very small.
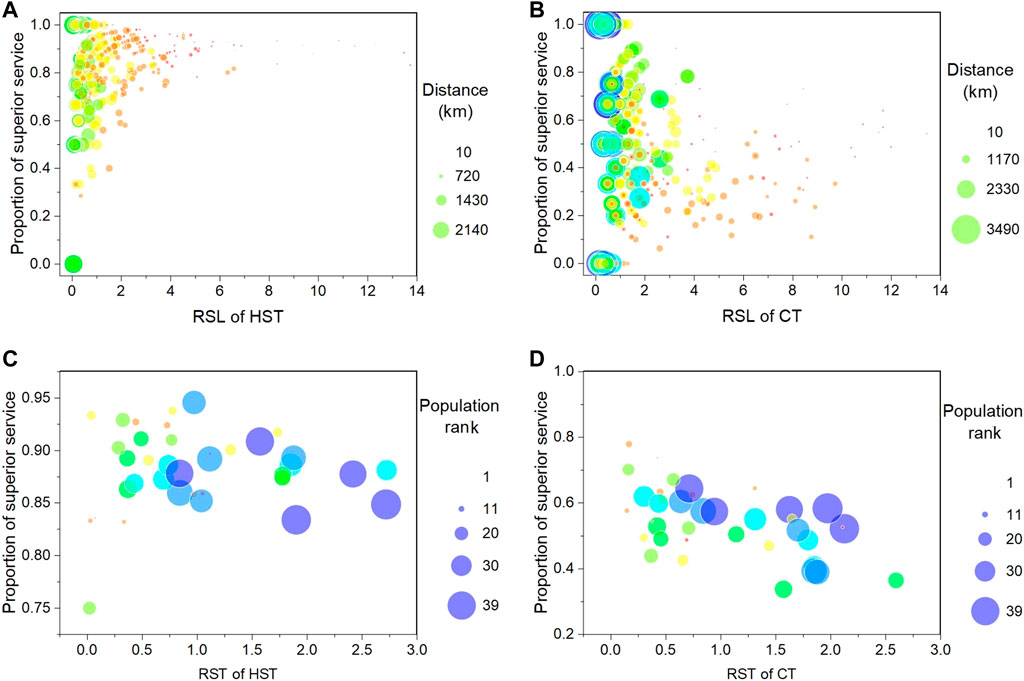
FIGURE 5. Distribution characteristics of HST superior service (A) and CT superior service (B) with RSL at city pair level, and the distribution characteristics of HST superior service (C) and CT superior service (D) with RST at city level.
For cities, as shown in Figures 5C, D, the proportion of superior ratios in the HSR network decreases slightly with the increase of RSL, but this trend is more obvious in the CR network. However, the proportion of HST and CT superior rates have nothing to do with the size of the urban resident population. Cities are divided into 4 types based on RSL and average quality rate. In the HSR network, among the super cities, Shenzhen and Tianjin belong to high quantity and high quality, while Chengdu and Chongqing belong to low quantity and low quality. Suzhou, Hefei and Shijiazhuang, which belong to big cities, also belong to high quantity and high quality. In the CR network, although the central provincial capital cities of Zhengzhou, Wuhan and Changsha have greater service intensity, the superior service rates of them are lower than 40%. This means that these cities have a large number of trains passing by due to their superior geographical location, but the departure or arrival times of these trains are mostly during non-quality service time periods.
This paper assumes that competition only occurs between premium HST and CT services, that is, non-premium services with similar departure times cannot substitute for premium services. We calculate the time difference index between superior HST and CT services for the same city pair, for a total of 624 city pairs. Figure 6A shows that the number of city pairs in the hourly interval of TDIave follows a normal distribution. The number of city pairs with TDIave between 4 and 8 account for 72.87%, and these cities have a higher number of superior HST and CT services (Figure 6C). This is because the train departure times of high-frequency city pairs are widely distributed in the superior time, resulting in a large time slot difference between HST and CT. For city pairs with fewer train frequencies, if the TDIave is very small, the departure time of HST and CT is relatively concentrated, which will lead to greater competition. Conversely, if TDIave is very large, it indicates that the departure times of HST and CT are very scattered, and the two services have complementary effects in time.
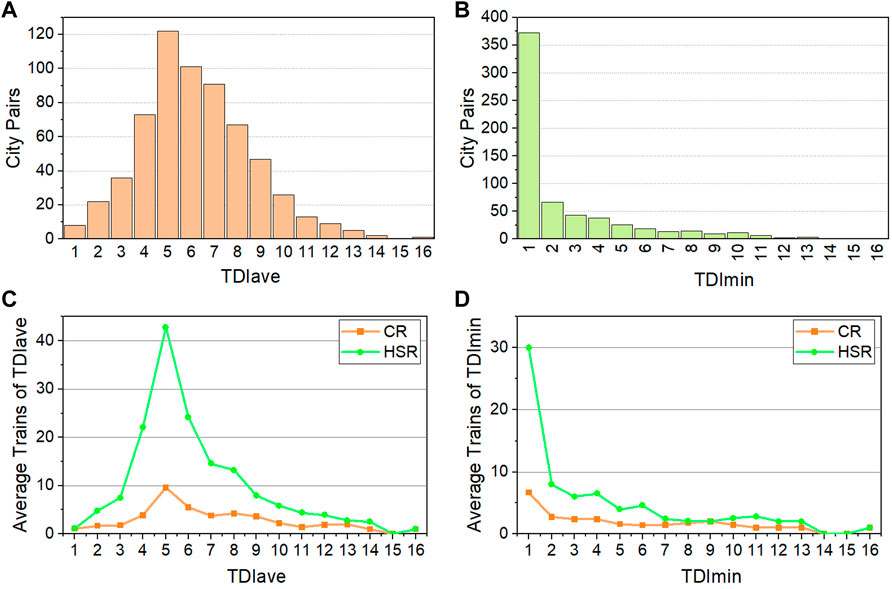
FIGURE 6. Number distribution characteristic of city pairs of TDIave (A) and TDImin (B), and the average number of trains of TDIave (C) and TDImin (D).
Different from TDIave, Figure 6B shows an exponential distribution of the number of city pairs per hour in TDImin.The proportion of city pairs with CT services before or within 1 h after HST departure accounted for 59.71%. This suggests that superior HST services in these city pairs are at risk of being replaced by CT services at least once. The average superior HST and CT services of city pairs with a TDImin of more than 4 h did not exceed 5 trains (Figure 6D), indicating that the two rail services play a coordinating and complementary role in the connection between these city pairs. Combined with Figure 3, we found that the endpoints of a few city pairs with TDImin over 10 h are not on the same trunk line, such as Nanning-Hefei, Guangzhou-Jinan, Changsha-Taiyuan and Tianjin-Lanzhou. In addition, the departure time of the railway service between these city pairs follows the mode of “HST in the morning, CT in the evening”.In general, HST and CT services are more likely to generate temporal substitutability on trunk lines and temporal complementarity between non-trunk city pairs.
We further analyze the substitutability degree between superior HST and CT services in city pairs with TDImin less than 1 h. There are 372 city pairs, and they have 89.21% superior HST services and 82.44% superior CT services, respectively. Overall, 59.01% of these HST services can be replaced, while up to 74.05% of these CT services are at risk of being replaced. For city pairs, the degree of mutual substitution between HST and CT services varies with the number of services and the distance between city pairs. As shown in Figure 7A, the substitutability of most city pairs with more than 150 superior HST services exceeds 80%, indicating that these city pairs have fierce competition for HST and CT. In addition, distant city pairs generally have lower quality HST services, but the substitution degree of them widely distributed between 0 and 1. As shown in Figure 7B, there are 147 city pairs facing HST competition for all superior CT services, accounting for 39.52% of the potential competing pairs. They include not only short-distance high-CT service city pairs, such as Beijing-Shijiazhuang, but also long-distance low-CT service city pairs, such as Fuzhou-Xi’an. Only a few city pairs with high CT service have low substitutability, such as Lanzhou-Urumqi.
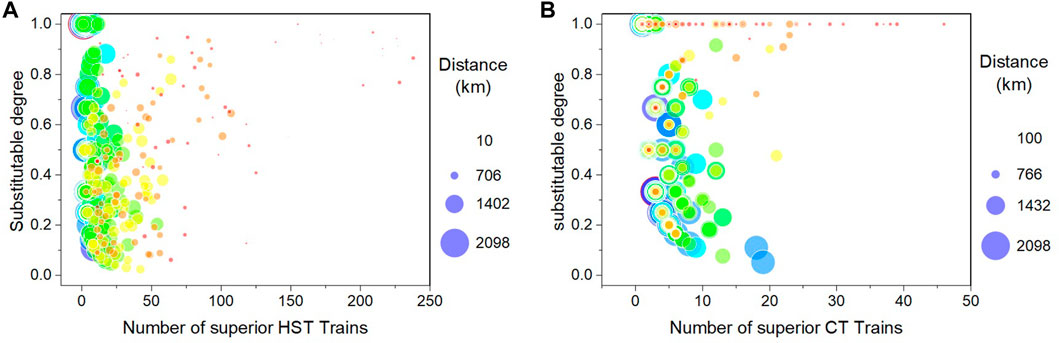
FIGURE 7. Distribution characteristics of substitutable degree of superior HST (A) and superior CT (B).
According to the classification framework of 3.3.4, we obtain the relationship types of HST and CT for 624 overlapping superior city pairs, and the results are summarized in Table 2. Specifically, HST services dominate 34.67% of the city pairs, significantly higher than the number of city pairs dominated by CT services. The proportion of city pairs with complementary coordination between HST and CT is 13.48%. In addition, 9.47% of the city pairs have fierce competition between HST and CT services, and the city pairs with partial and slight competition both account for about 20%. Figure 8 shows the characteristics and spatial distribution of the three types of service relationship patterns.
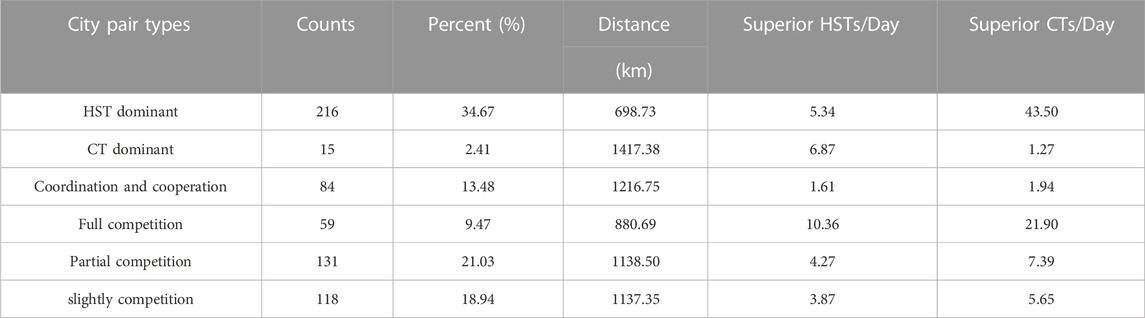
TABLE 2. Summary of supply-service relationship of superior overlapping cities.
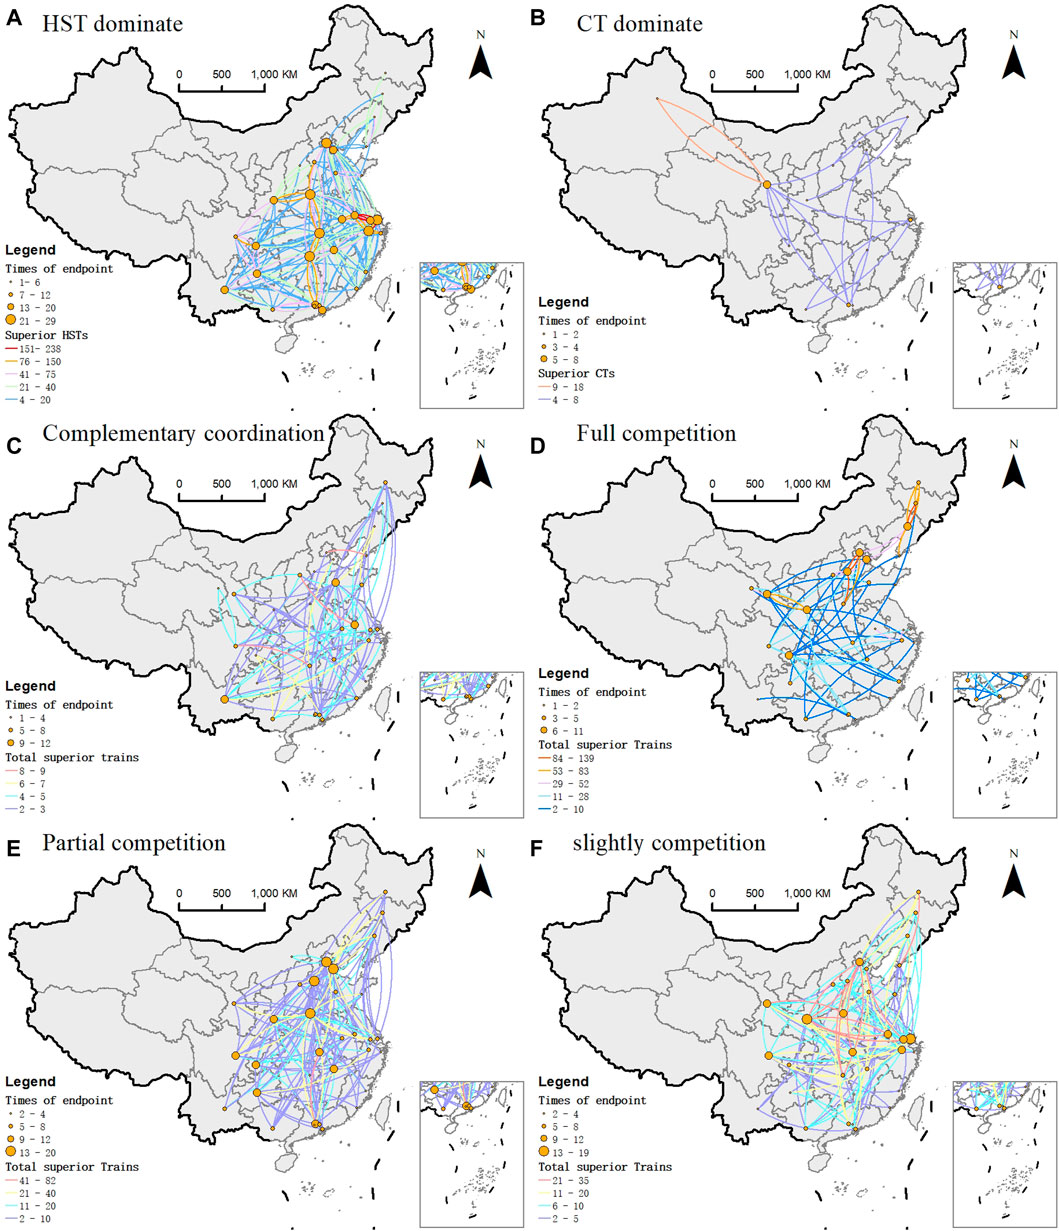
FIGURE 8. Spatial distribution of relationship types between HSR and CR: (A) HST dominated city pairs; (B) CT dominated city pairs; (C) Coordinated complementary city pairs; (D) Fully competitive city pairs; (E) Partially competitive city pairs; (F) Slightly competitive city pairs.
As shown in Figures 8A, B, the spatial distribution of HST-dominated and CT-dominated city pairs is very different. Spatially, the city pairs dominated by HST are mainly concentrated between cities along the eastern coast, southwest and the Yangtze River Economic Belt. The average distance of these city pairs is the smallest, only 698.73 km, and the average superior superior HST reaches 43.50 frequencies per day. The C-type HSR provides high-frequency connections between urban agglomerations. Typical city pairs are Beijing-Tianjin in the Beijing-Tianjin-Hebei region, Shanghai-Nanjing in the Yangtze River Delta, and Guangzhou-Shenzhen in the Pearl River Delta. A few CT-dominated city pairs are characterized by long distances and low frequencies, with an average distance of 1417.38 km. Except for Urumqi-Lanzhou, the frequency of superior CT per day in other cities does not exceed 8. Typical city pairs are Tianjin-Guangzhou and Lanzhou-Guangzhou in the north-south direction, Shanghai-Nanning and Shanghai-Lanzhou in the east-west direction. We note that more than half of the CT-dominant city pairs have Lanzhou as the endpoint.
As shown in Figure 8C, the spatial range of coordinated complementary city pairs is relatively wide, and also has the characteristics of long distances. While the average premium HST and CT for these city pairs were particularly low, the difference in departure times for both rail services was more than 4 h. Typical city pairs include Beijing-Lanzhou, Fuzhou-Chengdu, and Nanjing-Changchun. For individuals, travelers in competing city pairs may have different transportation options in the same time period, while travelers in coordinated and complementary city pairs have more choices of departure time within a day. This shows the importance of considering the time factor when analyzing the competition of different transportation modes, otherwise it would be impossible to distinguish between low-frequency competition and coordination and complementarity. For low-frequency competitive city pairs, the railway department should coordinate the departure times of the two railway services as much as possible when the train services remain unchanged. For low-frequency coordinated and complementary city pairs, the primary consideration is to increase train frequency.
About half of the citie pairs have competitive relationship between HSR and CR, and their competitive degree and spatial distribution are very different. As shown in Figure 8D, the city pairs with full competition are generally medium distance, with an average of 880.69 km, and the average number of high quality HST is about twice that of CT. Among them, a few city pairs are not only close to each other but also have high train service frequency, such as those located in northeast China and the Beijing-Tianjin-Hebei region. In addition, as a transit hub between northwest China and central and eastern China, Xi’an -Lanzhou city pair is also in full competition with high frequency. Partially and slightly competitive city pairs were generally long distance (Figures 8E, F), but the average distance was lower than that of coordinately coupled and CT-dominated city pairs. In addition, the high quality train frequency of partially competitive city pairs is higher than that of slightly competitive city pairs, and the average number of high quality HST of both two types is only slightly higher than that of CT. However, there are some differences in the spatial distribution of these two types of competition. Partially competitive city pairs generally end up with cities in the central and western regions, especially Beijing, Tianjin, Shijiazhuang and Zhengzhou. The slightly competitive city pairs generally end in cities in the northern region, and some of them have higher train frequency. Furthermore, those cities with low frequency and low level of competition have potential coordination and cooperation re-lations.
This paper explores the relationship of supply services between HSR and CR from a temporal perspective, extending the study of railway systems from spatial to spatiotemporal perspective. The results show that China’s HSR and CR services are spatially and temporally differentiated, and have shown a certain complementary pattern, but the two still have great potential for cooperation. Specifically, we divide the service quality of HST and CT from the perspective of time, which makes up for the lack of homogeneity of trains in different city pairs. Since most of the HST departure and arrival times are in the superior time period, the proportion of superior service is as high as 88.33%, while that of CT is only 51.08%. This means that the previous measure that only used train frequency to express strength has overestimated the CR level of some cities to a certain extent. For example, Zhengzhou, due to its superior geographical location, has the most CTs services every day, but only 37.00% of them are provided with superior services. Further, we found, HST and CT also have high-frequency competition and low-frequency competition, similar to the competition of HST and air (Wang et al., 2020b). In addition, HST and CT have cooperation potential not only in space (Huang and Zong, 2022), but also in time. This shows the importance of considering the time factor when analyzing the relationship between services of different transport modes.
Although the route length of HSR in China’s railway system is still lower than that of CR, the service provided by HSR is much higher than that of CR in terms of quantity and quality. Therefore, China has entered the era of HSR, which is inseparable from the multi-faceted policy support of the government (Li. H et al., 2021). On the one hand, HST’s high-intensity service provides convenient conditions for passengers to travel, gradually changing the public’s perception of travel difficulties (Lee and Chang, 2006; Delaplace and Dobruszkes, 2015; Wei et al., 2017). As a result, more and more passengers choose HST as their first choice for travel, and new travel behaviors are constantly being born (Wang et al., 2019). On the other hand, HSR provides opportunities for economic interaction between core cities and provides transportation conditions for the creation of a unified national economic market. At the same time, the HSR service of core cities to surrounding small cities provides a guarantee for regional integration.
For HSR, the current challenges come from two aspects. On the one hand, due to the continuous impact of COVID-19, the government’s control of travel behavior has greatly reduced intercity interaction (Cai et al., 2021). For example, in the first half of 2022, the net profit of Beijing-Shanghai Railway, which was the most profitable in the past, has lost 1.028 billion yuan, a year-on-year decrease of 137%. Another challenge comes from the fact that most of the HSR stations are built far away from the city center, and the HSR stations have insufficient driving force for the city. However, with the country’s strict control of urban expansion, it is difficult to realize the original intention of allowing HSR to drive urban development.
For CR in the HSR era, the impact is self-evident, but there are still two opportunities. On the one hand, opportunities come from low- and middle-income groups, i.e., price-sensitive but time-insensitive travelers (Lee and Chang, 2006; Delaplace and Dobruszkes, 2015; Wei et al., 2017). It is necessary to make full use of CT’s features of night operation and low price to open more trains with “starting at night and arriving at morning.” So as to provide comfortable and affordable services for long-distance cities, especially core cities of non-trunk lines. On the other hand, opportunities come from cities with small population and underdeveloped economy. From the perspective of social equity, it is also necessary to open HST in these cities. However, due to the high operation and maintenance costs of HSR, these cities have limited access to HST services (Moyano and Dobruszkes, 2017). Therefore, for cities that have opened HSR, the CT service should be staggered by more than 4 h from the HST service as much as possible. For city pairs without direct HSR, CR service should improve service quality on the basis of satisfying service quantity.
Our findings have policy implications for the sustainable development of both rail systems and cities. First, the method of exploring the service relationship considering the quantity and quality of trains can provide inspiration for the railway department to improve the policy. Secondly, the results of this paper determine the different modes of HST and CT supply service relationship between core cities, which can provide some support for railway dispatching optimization. For example, in the highly competitive market, the railway department should pay more attention to the service quality of HST and CT. In addition, the city pairs with low frequency competition can be transformed into coordinated city pairs by optimizing train dispatching. Third, this paper reveals the advantages and disadvantages of the core cities in different aspects of railway services, which helps to determine the city’s position and formulate development strategies. For example, although CR services have certain advantages in the three northeastern provinces, their proportion of superior services is lower than the average of all cities.
The rapid development of HSR not only shortens the time and space distance, but also affects the market share of other intercity transportation. As the future development direction of integrated transportation network, in-depth study of the competition and cooperation mode between HSR and other modes is a very important research issue for regional development and transportation optimization. Previous studies mostly analyzed the similarities and differences of different transportation modes from a spatial perspective, while the research on the relationship between multiple transportation modes from a time perspective was insufficient. This paper takes China’s core cities as the research object, and interprets the relationship between HSR and CR supply services from the perspective of time and space, so as to better understand the operation strategy of the railway passenger transport system. Specifically, the HSR network has higher service intensity and is more advantageous in the south, and the CR network covers a wider range of space and has an advantage in the north. Due to the fact that there are few high-speed trains at night, the proportion of HST superior services is as high as 88.33%. And only half of the CTs can provide passengers with superior pick-up and drop-off at the same time. Additionally, 59.01% of HST services can be replaced, while up to 74.05% of CT services are at risk of being replaced. Spatially, HST and CT services are more likely to generate temporal substitution on the mainline and temporal complementarity between city pairs on the non-mainline.
In conclusion, based on the difference in operating time between HST and CT, we found that in addition to being competitive, they are complementary in terms of time to a certain extent. What we emphasize is the importance of time competition and cooperation between the two railway supply services to ease the pressure on passenger flow and achieve social equity. However, our study has at least two limitations. On the one hand, due to the availability of data, we cannot obtain the exact number of seats purchased between city pairs. In this study, we considered the train capacity of different trains and the same train in different city pairs to be homogeneous. At present, the allocation of seat tickets in China is dynamic, and more trains can represent more actual seats to a certain extent. Therefore, the limitations of the data do not affect the validity of our conclusions. On the other hand, we assume that passenger preferences in different cities are consistent, that is, the demands for HST and CT are the same. Due to the differences in the economies of different regions, the proportions of time-sensitive and price-sensitive passengers are actually different. To understand the supply relationship between the two railway modes from the perspective of passengers, a large-scale survey is needed to distinguish passenger preferences in different regions, so as to better realize the rational allocation of HST and CT services. In short, our research only discusses the time differences and similarities between HSR and CR in China from the perspective of suppliers. In short, our study only explores the differences and similarities of train services between HSR and CR in China from a temporal perspective. Due to China’s vast geographical scope and differences in economic development, it is necessary to conduct in-depth research on the relationship between HSR and CR from different perspectives and data.
The original contributions presented in the study are included in the article/Supplementary Material, further inquiries can be directed to the corresponding author.
GZ: conceptualization, methodology, writing—original draft, visualization. YL: conceptualization, writing—reviewing and editing, supervision. YJ: conceptualization, writing—reviewing and editing. HC: methodology, writing-reviewing and editing. YW: writing-reviewing and editing, visualization. ZW: writing—reviewing and editing, methodology.
This research was financially supported by the Key Program of National Natural Science Foundation of China (No. 42230107).
The authors declare that the research was conducted in the absence of any commercial or financial relationships that could be construed as a potential conflict of interest.
All claims expressed in this article are solely those of the authors and do not necessarily represent those of their affiliated organizations, or those of the publisher, the editors and the reviewers. Any product that may be evaluated in this article, or claim that may be made by its manufacturer, is not guaranteed or endorsed by the publisher.
An, Y., Wei, Y. D., Yuan, F., and Chen, W. (2022). Impacts of high-speed rails on urban networks and regional development: A study of the Yangtze River Delta, China. Int. J. Sustain. Transp. 16 (6), 483–495. doi:10.1080/15568318.2021.1897909
Borenstein, S., and Netz, J. (1999). Why do all the flights leave at 8 am?: Competition and departure-time differentiation in airline markets. Int. J. industrial Organ. 17 (5), 611–640. doi:10.1016/s0167-7187(97)00058-1
Broman, E., and Eliasson, J. (2017). Market dynamics in on-rail competition. 19th Euro Work. Group Transp. Meet. (Ewgt2016) 22, 232–244. doi:10.1016/j.trpro.2017.03.030
Burghouwt, G., and de Wit, J. (2005). Temporal configurations of European airline networks. J. Air Transp. Manag. 11 (3), 185–198. doi:10.1016/j.jairtraman.2004.08.003
Cai, M., Guy, C., Héroux, M., Lichtfouse, E., and An, C. (2021). The impact of successive COVID-19 lockdowns on people mobility, lockdown efficiency, and municipal solid waste. Environ. Chem. Lett. 19 (6), 3959–3965. doi:10.1007/s10311-021-01290-z
Cascetta, E., and Coppola, P. (2015). New high-speed rail lines and market competition short-term effects on services and demand in Italy. Transp. Res. Rec. 2475 (2475), 8–15. doi:10.3141/2475-02
Castillo-Manzano, J. I., Pozo-Barajas, R., and Trapero, J. R. (2015). Measuring the substitution effects between High Speed Rail and air transport in Spain. J. Transp. Geogr. 43, 59–65. doi:10.1016/j.jtrangeo.2015.01.008
Chen, Z. H. (2017). Impacts of high-speed rail on domestic air transportation in China. J. Transp. Geogr. 62, 184–196. doi:10.1016/j.jtrangeo.2017.04.002
Cheng, J. M., and Chen, Z. H. (2021). Impact of high-speed rail on the operational capacity of conventional rail in China. Transp. Policy 110, 354–367. doi:10.1016/j.tranpol.2021.06.016
Craft, R. C., and Leake, C. (2002). The Pareto principle in organizational decision making. Manag. Decis. 40, 729–733. doi:10.1108/00251740210437699
Delaplace, M., and Dobruszkes, F. (2015). From low-cost airlines to low-cost high-speed rail? The French case. Transp. Policy 38, 73–85. doi:10.1016/j.tranpol.2014.12.006
Diao, M., Zhu, Y., and Zhu, J. R. (2017). Intra-city access to inter-city transport nodes: The implications of high-speed-rail station locations for the urban development of Chinese cities. Urban Stud. 54 (10), 2249–2267. doi:10.1177/0042098016646686
Dobruszkes, F., Dehon, C., and Givoni, M. (2014). Does European high-speed rail affect the current level of air services? An EU-wide analysis. Transp. Res. Part A Policy Pract. 69, 461–475. doi:10.1016/j.tra.2014.09.004
Dobruszkes, F. (2011). High-speed rail and air transport competition in western Europe: A supply-oriented perspective. Transp. Policy 18 (6), 870–879. doi:10.1016/j.tranpol.2011.06.002
Espinosa-Aranda, J. L., Garcia-Rodenas, R., Ramirez-Flores, M. D., Lopez-Garcia, M. L., and Angulo, E. (2015). High-speed railway scheduling based on user preferences. Eur. J. Operational Res. 246 (3), 772–786. doi:10.1016/j.ejor.2015.05.052
Givoni, M., and Banister, D. (2006). Airline and railway integration. Transp. Policy 13 (5), 386–397. doi:10.1016/j.tranpol.2006.02.001
González-Savignat, M. (2004). Will the high-speed train compete against the private vehicle? Transp. Rev. 24 (3), 293–316. doi:10.1080/0144164032000083103
Guo, Y., Li, B., and Han, Y. (2020). Dynamic network coupling between high-speed rail development and urban growth in emerging economies: Evidence from China. Cities 105, 102845. doi:10.1016/j.cities.2020.102845
Huang, J., and Wang, J. E. (2017). A comparison of indirect connectivity in Chinese airport hubs: 2010 vs. 2015. J. Air Transp. Manag. 65, 29–39. doi:10.1016/j.jairtraman.2017.07.002
Huang, Y., and Zong, H. (2021). Has high-speed railway promoted spatial equity at different levels? A case study of inland mountainous area of China. Cities 110, 103076. doi:10.1016/j.cities.2020.103076
Huang, Y., and Zong, H. M. (2022). The intercity railway connections in China: A comparative analysis of high-speed train and conventional train services. Transp. Policy 120, 89–103. doi:10.1016/j.tranpol.2022.02.007
Jiang, C. M., Wan, Y. L., Yang, H. J., and Zhang, A. M. (2021). Impacts of high-speed rail projects on CO2 emissions due to modal interactions: A review. Transp. Res. Part D-Transport Environ. 100, 103081. doi:10.1016/j.trd.2021.103081
Jiang, C., and Zhang, A. (2014). Effects of high-speed rail and airline cooperation under hub airport capacity constraint. Transp. Res. Part B Methodol. 60, 33–49. doi:10.1016/j.trb.2013.12.002
Jiao, J. J., Wang, J. E., Zhang, F. N., Jin, F. J., and Liu, W. (2020). Roles of accessibility, connectivity and spatial interdependence in realizing the economic impact of high-speed rail: Evidence from China. Transp. Policy 91, 1–15. doi:10.1016/j.tranpol.2020.03.001
Jiao, J., Wang, J., and Jin, F. (2017). Impacts of high-speed rail lines on the city network in China. J. Transp. Geogr. 60, 257–266. doi:10.1016/j.jtrangeo.2017.03.010
Lee, J. H., and Chang, J. S. (2006). Effects of high-speed rail service on shares of intercity passenger ridership in South Korea. Railways, 1943, 31–42. doi:10.1177/0361198106194300105
Lee, J. K., Yoo, K. E., and Song, K. H. (2016). A study on travelers' transport mode choice behavior using the mixed logit model: A case study of the seoul-jeju route. J. Air Transp. Manag. 56, 131–137. doi:10.1016/j.jairtraman.2016.04.020
Levinson, D. M. (2012). Accessibility impacts of high-speed rail. J. Transp. Geogr. 22, 288–291. doi:10.1016/j.jtrangeo.2012.01.029
Li, C., Lin, T., Zhang, Z., Xu, D., Huang, L., and Bai, W. (2022). Can transportation infrastructure reduce haze pollution in China? Environ. Sci. Pollut. Res. 29 (11), 15564–15581. doi:10.1007/s11356-021-16902-y
Li, H. C., Wang, K., Yu, K. M., and Zhang, A. M. (2020). Are conventional train passengers underserved after entry of high-speed rail?-Evidence from Chinese intercity markets. Transp. Policy 95, 1–9. doi:10.1016/j.tranpol.2020.05.017
Li, H., Dong, X. C., Jiang, Q. Z., and Dong, K. Y. (2021). Policy analysis for high-speed rail in China: Evolution, evaluation, and expectation. Transp. Policy 106, 37–53. doi:10.1016/j.tranpol.2021.03.019
Li, T., and Rong, L. L. (2022). Spatiotemporally complementary effect of high-speed rail network on robustness of aviation network. Transp. Res. Part a-Policy Pract. 155, 95–114. doi:10.1016/j.tra.2021.10.020
Li, X. W., Ma, R. Y., Guo, Y. Y., Wang, W., Yan, B., and Chen, J. (2021). Investigation of factors and their dynamic effects on intercity travel modes competition. Travel Behav. Soc. 23, 166–176. doi:10.1016/j.tbs.2021.01.003
Limtanakool, N., Dijst, M., and Schwanen, T. (2007). A theoretical framework and methodology for characterising national urban systems on the basis of flows of people: Empirical evidence for France and Germany. Urban Stud. 44 (11), 2123–2145. doi:10.1080/00420980701518990
Moyano, A., and Dobruszkes, F. (2017). Mind the services! High-speed rail cities bypassed by high-speed trains. Case Stud. Transp. Policy 5 (4), 537–548. doi:10.1016/j.cstp.2017.07.005
Moyano, A., Martinez, H. S., and Coronado, J. M. (2018). From network to services: A comparative accessibility analysis of the Spanish high-speed rail system. Transp. Policy 63, 51–60. doi:10.1016/j.tranpol.2017.11.007
Perl, A. D., and Goetz, A. R. (2015). Corridors, hybrids and networks: Three global development strategies for high speed rail. J. Transp. Geogr. 42, 134–144. doi:10.1016/j.jtrangeo.2014.07.006
Shaw, S. L., Fang, Z. X., Lu, S. W., and Tao, R. (2014). Impacts of high speed rail on railroad network accessibility in China. J. Transp. Geogr. 40, 112–122. doi:10.1016/j.jtrangeo.2014.03.010
Spiekermann, K., and Wegener, M. (1994). The shrinking continent - new time-space maps of Europe. Environ. Plan. B-Planning Des., 21(6), 653–673. doi:10.1068/b210653
Sun, J. Y. (2015). Clustered airline flight scheduling: Evidence from airline deregulation in Korea. J. Air Transp. Manag. 42, 85–94. doi:10.1016/j.jairtraman.2014.09.004
Wang, F., Wei, X. J., Liu, J., He, L. Y., and Gao, M. N. (2019). Impact of high-speed rail on population mobility and urbanisation: A case study on Yangtze River Delta urban agglomeration, China. Transp. Res. Part a-Policy Pract. 127, 99–114. doi:10.1016/j.tra.2019.06.018
Wang, J., Du, D., and Huang, J. (2020a). Inter-city connections in China: High-speed train vs. inter-city coach. J. Transp. Geogr. 82, 102619. doi:10.1016/j.jtrangeo.2019.102619
Wang, J. E., Huang, J., and Jing, Y. (2020b). Competition between high-speed trains and air travel in China: From a spatial to spatiotemporal perspective. Transp. Res. Part a-Policy Pract. 133, 62–78. doi:10.1016/j.tra.2019.12.030
Wang, J. J., Xu, J., and He, J. F. (2013). Spatial impacts of high-speed railways in China: A total-travel-time approach. Environ. Plan. a-Economy Space 45 (9), 2261–2280. doi:10.1068/a45289
Wang, L. (2018). High-speed rail services development and regional accessibility restructuring in megaregions: A case of the Yangtze River Delta, China. Transp. Policy 72, 34–44. doi:10.1016/j.tranpol.2018.09.015
Wang, Y., Yan, X. D., Zhou, Y., and Xue, Q. W. (2017). Influencing mechanism of potential factors on passengers' long-distance travel mode choices based on structural equation modeling. Sustainability 9 (11), 1943. doi:10.3390/su9111943
Wei, S., Yuan, J., Qiu, Y., Luan, X., Han, S., Zhou, W., et al. (2017). Exploring the potential of open big data from ticketing websites to characterize travel patterns within the Chinese high-speed rail system. Plos One 12 (6), e0178023. doi:10.1371/journal.pone.0178023
Weng, J., Zhu, X. L., and Li, X. (2020). Impact of high-speed rail on destination accessibility: A case study of China. J. China Tour. Res. 16 (4), 494–509. doi:10.1080/19388160.2019.1709937
Wu, J. H., Nash, C., and Wang, D. (2014). Is high speed rail an appropriate solution to China's rail capacity problems? J. Transp. Geogr. 40, 100–111. doi:10.1016/j.jtrangeo.2014.05.004
Xia, W., and Zhang, A. (2017). Air and high-speed rail transport integration on profits and welfare: Effects of air-rail connecting time. J. Air Transp. Manag. 65, 181–190. doi:10.1016/j.jairtraman.2017.06.008
Xin, Z., and Niu, F. (2022). Structure and robustness of China’s railway transport network. Transp. Lett., 1–11. doi:10.1080/19427867.2022.2053280
Xu, W. T., Zhou, J. P., and Qiu, G. (2018). China's high-speed rail network construction and planning over time: A network analysis. J. Transp. Geogr. 70, 40–54. doi:10.1016/j.jtrangeo.2018.05.017
Yang, H., Dijst, M., Witte, P., van Ginkel, H., and Wang, J. e. (2019). Comparing passenger flow and time schedule data to analyse High-Speed Railways and urban networks in China. Urban Stud. 56 (6), 1267–1287. doi:10.1177/0042098018761498
Yang, H. R., Burghouwt, G., Wang, J. E., Boonekamp, T., and Dijst, M. (2018a). The implications of high-speed railways on air passenger flows in China. Appl. Geogr. 97, 1–9. doi:10.1016/j.apgeog.2018.05.006
Yang, H. R., Dobruszkes, F., Wang, J. E., Dijst, M., and Witte, P. (2018b). Comparing China's urban systems in high-speed railway and airline networks. J. Transp. Geogr. 68, 233–244. doi:10.1016/j.jtrangeo.2018.03.015
Zhang, F., Graham, D. J., and Wong, M. S. C. (2018). Quantifying the substitutability and complementarity between high-speed rail and air transport. Transp. Res. Part A Policy Pract. 118, 191–215. doi:10.1016/j.tra.2018.08.004
Zhang, F., Yang, Z., Jiao, J., Liu, W., and Wu, W. (2020). The effects of high-speed rail development on regional equity in China. Transp. Res. Part A Policy Pract. 141, 180–202. doi:10.1016/j.tra.2020.09.013
Zhang, H., Cui, H. D., Wang, W., and Song, W. B. (2020). Properties of Chinese railway network: Multilayer structures based on timetable data. Phys. a-Statistical Mech. Its Appl. 560, 125184. doi:10.1016/j.physa.2020.125184
Keywords: intercity competition modes, supply service quality, substitutability degree, highspeed railway, conventional railway
Citation: Zhang G, Liu Y, Jing Y, Chen H, Wang Y and Wang Z (2023) Unraveling the supply-service relationship between high-speed railway and conventional railway: A temporal perspective. Front. Environ. Sci. 11:1057812. doi: 10.3389/fenvs.2023.1057812
Received: 30 September 2022; Accepted: 16 January 2023;
Published: 26 January 2023.
Edited by:
Salvador García-Ayllón Veintimilla, Technical University of cartagena, SpainReviewed by:
Qingsong He, Huazhong University of Science and Technology, ChinaCopyright © 2023 Zhang, Liu, Jing, Chen, Wang and Wang. This is an open-access article distributed under the terms of the Creative Commons Attribution License (CC BY). The use, distribution or reproduction in other forums is permitted, provided the original author(s) and the copyright owner(s) are credited and that the original publication in this journal is cited, in accordance with accepted academic practice. No use, distribution or reproduction is permitted which does not comply with these terms.
*Correspondence: Yanfang Liu, eWZsaXU2MTBAeWVhaC5uZXQ=
Disclaimer: All claims expressed in this article are solely those of the authors and do not necessarily represent those of their affiliated organizations, or those of the publisher, the editors and the reviewers. Any product that may be evaluated in this article or claim that may be made by its manufacturer is not guaranteed or endorsed by the publisher.
Research integrity at Frontiers
Learn more about the work of our research integrity team to safeguard the quality of each article we publish.