 Emmanuel Sawadogo
 Harouna Sandwidi2
 Emmanuel M. Hema
- 1Laboratoire de Biologie et Ecologie Animales, Université Joseph KI ZERBO, Ouagadougou, Burkina Faso
- 2Inspecteur des Eaux et Forêts, Ministère de L’Environnement, de l’Eau et de l’Assainissement, Ouagadougou, Burkina Faso
- 3Laboratoire de Biologie et Ecologie Animales, UFR-SVT, Université Joseph KI-ZERBO, Ouagadougou, Burkina Faso
- 4Département de Biologie Générale, UFR-SAT, Université de Dédougou, Dédougou, Burkina Faso
This study aimed to determine the impact of land use and illegal activities on elephant distributions in 2003, 2015, and 2021. Geospatial data inclusion satellite images of different characteristics were used as well as aerial count of animals along linear transects of varying widths. Using ArcMap 10.8, we laid grilles of 100 km2 covering the entire study area. We performed clipping to display and estimate the area of elephant’s occupancy in each grid. As such, we were able to determine the number of elephants and the number of illegal activities in each grid. Correlation analysis were performed to understand relationships between elephants’ number and land-use units as well as the illegal activities. The identified different land use units were: rainfed crop, gallery forest, Wooded savanna, shrubby savanna, grass savanna, and water surface. Of the variables studied, only annual crop, gallery forest, shrubby savanna and illegal activities were significantly correlated with elephant numbers. Annual crop and illegal activities were negatively correlated with elephant numbers, while gallery forest and shrubby savanna were positively correlated with elephant abundance. These results confirmed that water, forage and serenity are the main factors that explain the distribution of elephant in protected areas.
Introduction
The environmental landscape in West Africa is changing rapidly due to the expansion of human populations. These are exerting significant and increasing pressures on the habitat relict of the many small and isolated elephant populations in the sub-region (Parker and Graham, 1989; Hema, 2011). Within protected areas, three main factors are responsible for the distribution of animals: forage, water and tranquility (Sawadogo, 2010). Elephants tend to congregate where there is water, food and comfort such as shade (Wild, 2017). The development of water points should thus be in harmony with the occupation of the land in order to ensure a good distribution of animals and a better use of resources by these animals. An increase in illegal killing of elephants in the sub-region has been reported, particularly in Benin and Burkina Faso since 2010 (Bouche et al., 2015). There is therefore a need to conduct an inventory of elephants in order to know their numbers and distribution for effective conservation. Elephant have habitat preferences (land-use units) within Protected Areas. Land-use units change over time, gaining or losing area. It is therefore necessary to take stock of the evolution of the land-use units as well as the distribution of elephants in relation to these units in order to appreciate the challenges of their conservation and propose actions to be considered in the management of these Protected Areas.
The general objective of the study is to determine the distribution factors of elephants in Arly National Park. More specifically, it is to spatialize elephants and illegal activities in Arly National Park using aerial surveys in 2003, 2015 and 2021; to establish the statistics of the different classes of land occupation in 2003, 2015, and 2021 and finally to determine the impact of land occupation and illegal activities on the distribution of elephants in 2003 2015 and 2021.
Presentation of the study area
Arly National Park, a World Heritage Site, is located in the southeast of Burkina Faso between longitudes 1° 10′27″ and 1° 43′48″ East and latitudes 11° 14′51″ and 11° 42′36″ North. Arly National Park covers an area of 217,930 ha and 767,000 ha with adjacent hunting areas. It is eighty (80) km from Diapaga, the capital of the province to which it belongs. The protected areas adjacent to the Arly National Park are the hunting concessions of Koakrana, Pagou-Tandougou, Ougarou, Konkombouri, Singou, Pama-North, Pama-Central-North, Pama-Central-South and Pama-South. Figure 1.
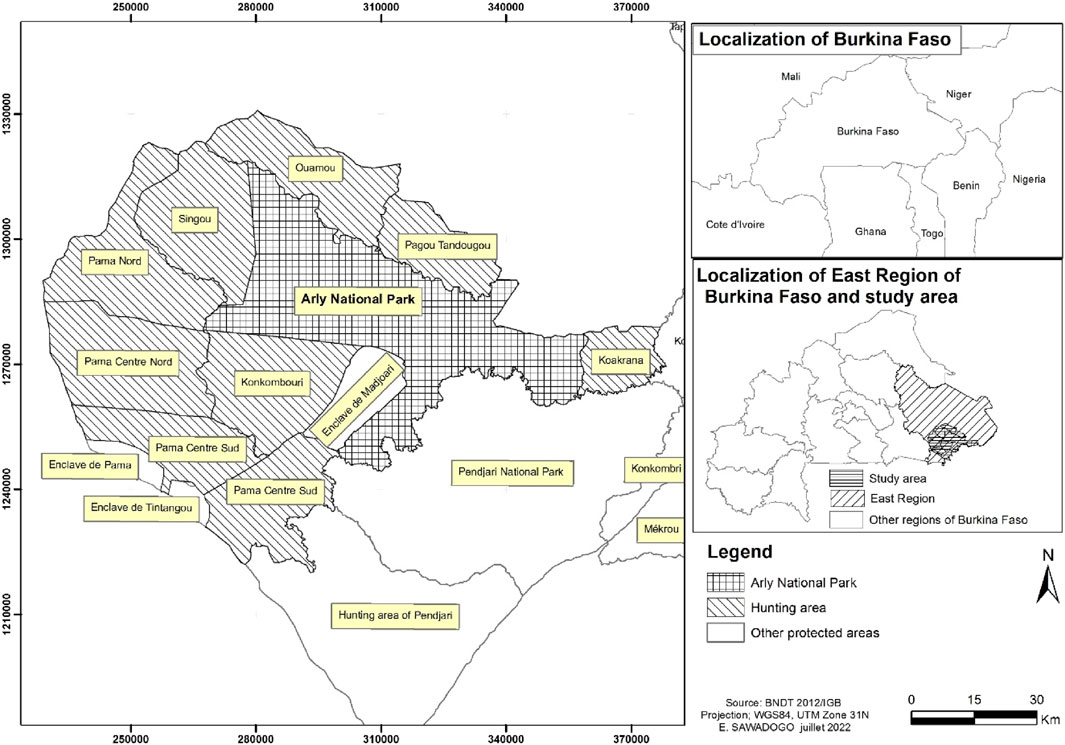
FIGURE 1. Arly National Park with adjacent hunting concessions.
The flora of the Arly National Park is very diversified (Doamba, 2012). Terminalia avicennioides (Guill. & Perr), formations colonize the soils with good cultivation potential and are the most prized by the farmers; on the other hand, the skeletal soils less favorable to agriculture generally constitute old fallow lands and shelter groups with Combretum molle (R. Br. 1827), Combretum nigricans (Lepr. ex Guill. & Perr) with a herbaceous stratum dominated by Andropogon pseudopricus (Stapf) and Laudetia togoensis (Pilg.). Rarely do you find the once abundant forest formations represented by groups of Anogeissus leiocarpa (DC. Guill. & Perr) and Wissadula amplissima (L.), apart from the Parinari congoensis (F. Didr) formations along watercourses such as the Pendjari. At the level of the Gobnangou mountain range, which is a particular ecosystem, a diversity of vegetation groups develops: the dry Manilkara multi-vegetation forests, the shrubby savannas with Ficus abutilifolia (Miq.), Euphorbia sudanica (A.Chev.), Pteleopsis suberosa (Engl. & Diels) and Bridellia scleroneura (Müll.Arg).
Concerning the fauna, here we almost all the large mammals of the savanna. The large fauna is represented by the elephant [Loxodonta africana (Cuvier, 1825)], the hyppotrague [Hippotragus equinus koba (É. Geoffroy Saint -Hilaire, 1803)], the hartebeest [Alcelaphus buslaphus major (Pallas, 1766)], the buffalo [syncerus caffer savanensis (Sparrman, 1779)], the lion [Pantthera leo (Linnaeus, 1758)] hippopotamus [Hippopotamus amphibious (Linnaeus, 1758)], defassa cob [Kobus ellipsiprimnus deffasa (Ogilby, 1833)], buffalo cob [Kobus kob (Erxleben, 1777)], harnessed guib [Tragelaphus scriptus scriptus (Pallas, 1766)], and warthog [Phacochoerus africanus (Gmelin, 1788)]. Cynocephalus are also common in large families.
The periphery of the park supports a large human population. It is surrounded by 11 communes that are home to several hundred villages. According to the 2019 general population and housing census of Burkina Faso (INSD, 2022), the rural population of the three provinces that contain Arly National Park was estimated to be around 1,160,725. Agriculture is the main livelihood activity in the Arly area and employs most of the population. The sector is poorly developed and the mode of exploitation of the land relies not only on human strength but also on very rudimentary agricultural equipment. There is extensive livestock farming practiced by the communities which is entirely dependent on natural resources for sustenance. Natural herbaceous and aerial pastures and crop residues are by far the most exploited food resources by the livestock.
Methodology
Statistics of the different land use classes in 2003, 2015, and 2021
Geospatial data consider satellite images of different characteristics was used in this research. The pre-processing operations carried out concerned the realization of colored composition and the extraction of the study area. A colored composition near infrared/red/green (bands 5/4/3) for the images of 2015 and 2021 (Landsat 8) and another (bands 4/3/2) for that of 2003 (Landsat 7) was carried out. For each class type identified, four (4) training sites or regions of interest (ROI) were created. They were delimited far from the transition zones in order to avoid including mixed pixels, i.e., pixels that could be classified in two distinct classes. For the selection of these sites, points were surveyed in the field by land use class and were used to create the training sites on the images of the three (3) periods.
Maximum likelihood classification was the method used to classify the images. The classified images were vectored and transferred to ArcGIS10.8 software for analysis and map editing. This also allowed for the calculation of land use type statistics for each of the three periods. Before the analyses, we tested the normality of our data and the analyses were done to ascertain if our data would follow a normal distribution or not. In order to analyze the evolution of the land use units, several statistical indicators were calculated; these are the rates of change and the transition matrix. Transition matrices are developed to describe these land use changes over a period of time (Schlaepfer, 2002). The reference used for the identification of land use units is: NTDB 2012, IGB Burkina Faso. The common naming being: Open forest, gallery forest, forest plantation, wooded savannah, wooded steppe, agroforestry park, shrubby savannah, shrubby steppe, habitat, annual crop, rice paddy, permanent crop, orchard, wetland, water surface, grassy savannah, grassy steppe, bare soil (eroded, denuded), dune, sand dune, bare rock.
Determining the geographic locations of elephants and illegal activities through aerial surveys
The method chosen for this study was direct aerial enumeration by sampling on line transects of varying widths. The reasons for this choice were as follows: the size of the park constrains sampling; also, the method has been used successfully in similar ecosystems (Pendjari, Park W.). The inventory was conducted in the second quarter of the year to be comparable to the 2003 and 2015 inventories; the need to harmonize the methodology with those years became apparent. The method adopted was aerial sample counts using the systematic reconnaissance flight (SRF) method (Norton-Griffiths, 1978). It should be remembered, however, that aerial counting is only really appropriate for counting large, group-living species that can be easily detected from 100 m above ground (Jachmann, 2002). Figure 2.
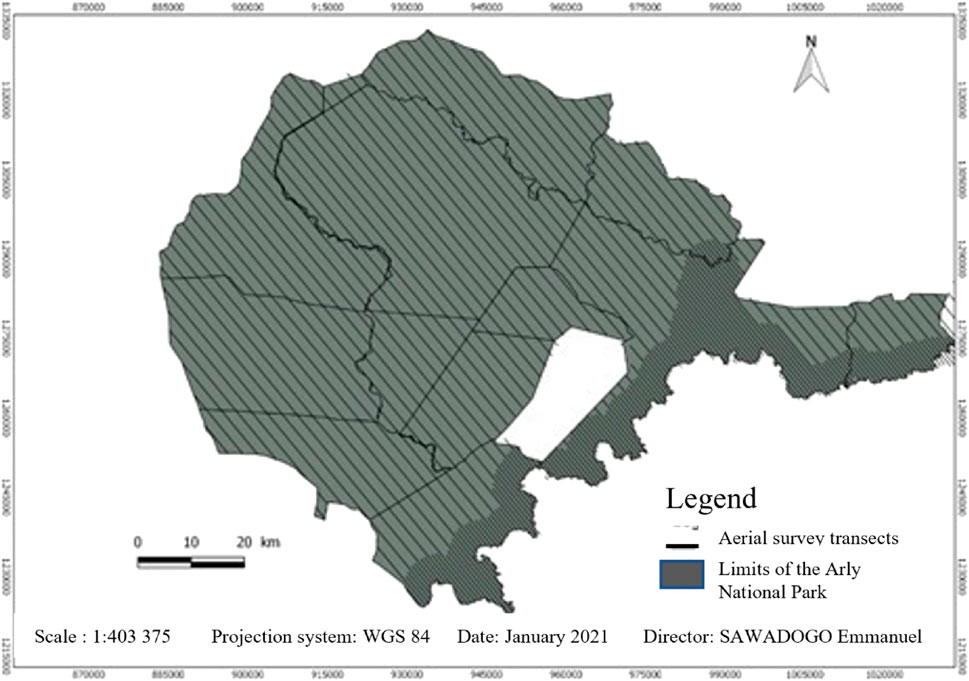
FIGURE 2. Transects flown; source: Inventory 2021.
A single engine Cessna C182 aircraft was used for the operation. Transects were generated using QGIS 2.8. Transects within each block were oriented along the ecological gradient. A total count in all areas within 5 km of the main and permanent streams in the park, as this is where the majority of animals are found during the dry season. Equidistant transects of 700 m with counting strips of 350 m on each side were walked in the area corresponding to the 5 km strip on each side along the permanent rivers of the park. This area was 100% covered. A sample count in the intermediate areas further from the water. The 2,100-m equidistance between transects gave us the highest level of accuracy for a more optimal time sampling count. The 2,100-m equidistance corresponds to a 50% coverage rate of the area more than 5 km from the main waterways. Transects were flown at a higher elevation of 500 feet at a speed of 100 knots (185 km per hour).
Data processing
Data was processed using the Jolly 2 method for unequal sample sizes (Northon-Griffiths, 1978; Bouché et al., 2015). Data were entered into Arc Map software and then into QGIS to establish a spatial database of the site. Using the map making software to have QGIS and ArcMap, the geo-referenced data of the species observations were entered into the said programs in order to present the distribution in a realistic way.
The impact of land use and illegal activities on the distribution of elephants
To do this, the study:
- Identified the land-use units frequented by the different herds at the time of the observations. ArcMap 10.8 was used to grid the study area into 10 km square grids. We then performed clipping to display and estimate the area of each occupancy unit in each grid. The following counts were then performed:
- the number of elephant sightings per grid; within the 5 km limit around the rivers, this number is halved because the fields of observation cover the entire area but only half beyond the 5 km,
- the number of elephants observed per grid,
- the number herd of domestic animals observed per grid,
- the number of illegal activities per grid (including the number of domestic animal sightings).
This count allowed the correlations between elephant sightings and illegal activities to be made These included domestic animals (when domestic animals enter classified forests), uncontrolled fires (accidental vegetation fires), elephant carcasses (carcasses resulting mainly from poaching), fields (when there are agricultural activities within the park), human presence (irregular presence of people in the park such as poachers, herders, fishermen), evidence of fishing and poaching (poachers’ camps, fishing facilities).
The results of the 2003 and 2015 surveys followed the same methods to correlate land use and illegal activities with elephant distribution. The 2003, 2015, and 2021 inventories took place in the second quarter of the year in May, in June and May respectively.
IBM SPSS statistics 21 and Past statistical software were used to conduct the statistical analyses. Normality tests were performed and logarithmic transformations (Logx) were performed to normalize data that did not follow a normal distribution. Using SPSS, we determined the Pearson correlations and their significance at the 95% level between elephant abundance and each variable studied.
Results
Proportion of different land use units in the park
The analysis of our data from 2021 shows that land use is dominated by shrubby savanna with an area of 578439.1801 ha (75.36%) compared to 86181.14073 ha (11, 23%) for wooded savanna and respectively 62413.668 ha (8.13%), 30617.90674 ha (4%), 9035.577544 ha (1.18%), 845.2322029 ha (0.11%) for grassy savanna, gallery forest, annual crops and water surfaces. The difference between the six (06) occupancy types is significant (F = 211.312, ddl = 5, p = 0.000). Between 2003 and 2021, gallery forest and shrubby savanna lost area while the other occupancy units gained area, but these differences in area between years is not significant (p = 0.6758) (Table 1).
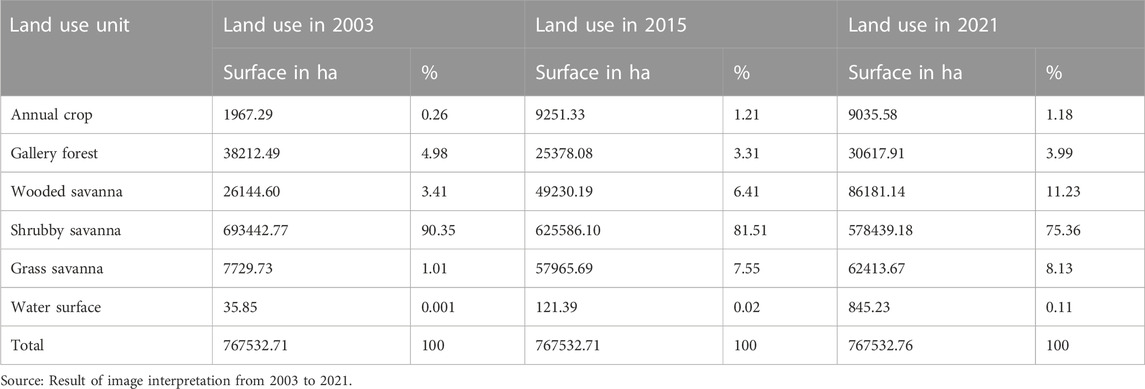
TABLE 1. Statistics of different land use classes in 2003, 2015, and 2021.
Impact of land use and illegal activities on elephant distribution
Spatial distribution of elephants and illegal activities
This sighted distribution of elephants and illegal activities allowed them to be correlated (Figure 3).
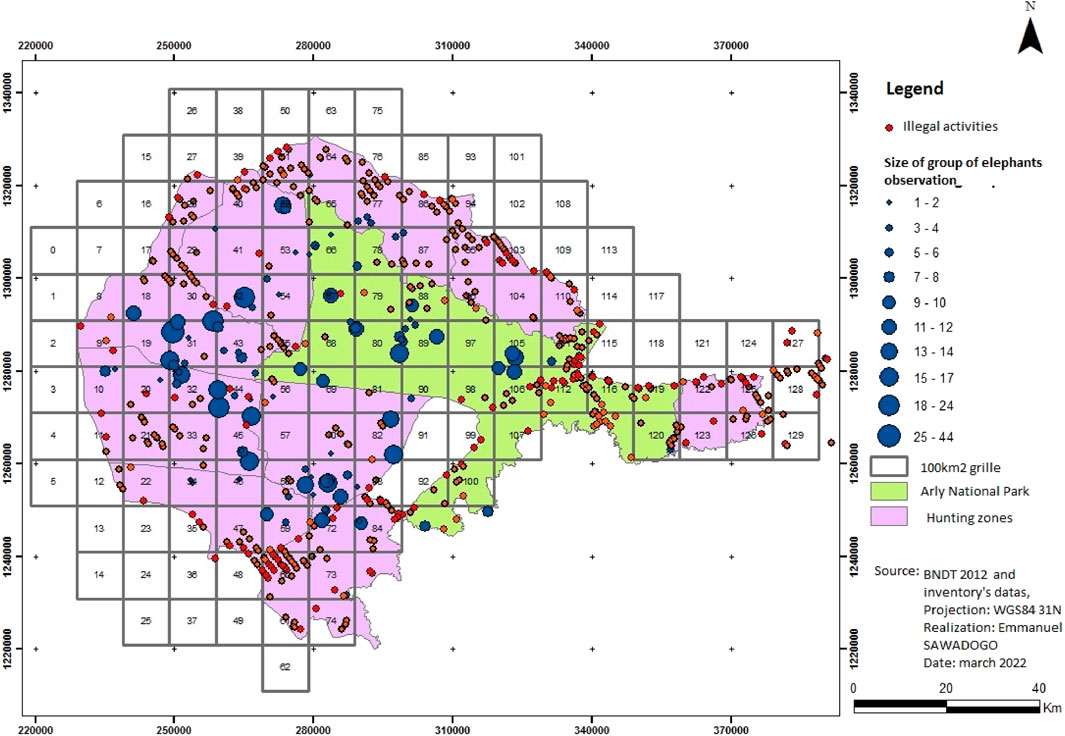
FIGURE 3. Sighting grids (source: Aerial Survey 2021).
It is clear from Map 2 that the higher the density of illegal activities in a locality, the fewer elephants there are.
Correlation between variables and elephant abundance
Table 2 shows that only annual cropping, gallery forest, shrubby savanna and illegal activities are significantly correlated with elephant numbers. Annual cropping and illegal activities are negatively correlated with elephant numbers while gallery forest and shrub savanna are positively correlated with elephant abundance.

TABLE 2. Correlation between occupancy units/illegal activities and elephant abundance (all 3 years of data).
We were then able to eliminate the non-significant variables. These include the following land use units: wooded savanna, water surface and grassy savanna.
We then calculated these correlations and their significance for each variable retained and by year.
Table 3 shows that annual crops and illegal activities are negatively correlated with elephant numbers in all 3 years, while gallery forest and shrubby savanna are positively correlated in all 3 years. The extreme correlations are gallery forest (0.81) and illegal activities (−0.014) in 2015.
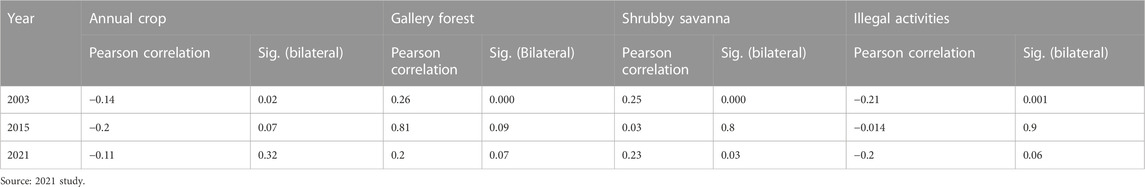
TABLE 3. Correlation between significant variables and elephant numbers by year.
The graphs below illustrate the correlations discussed by variable and by year (Figures 4–7).
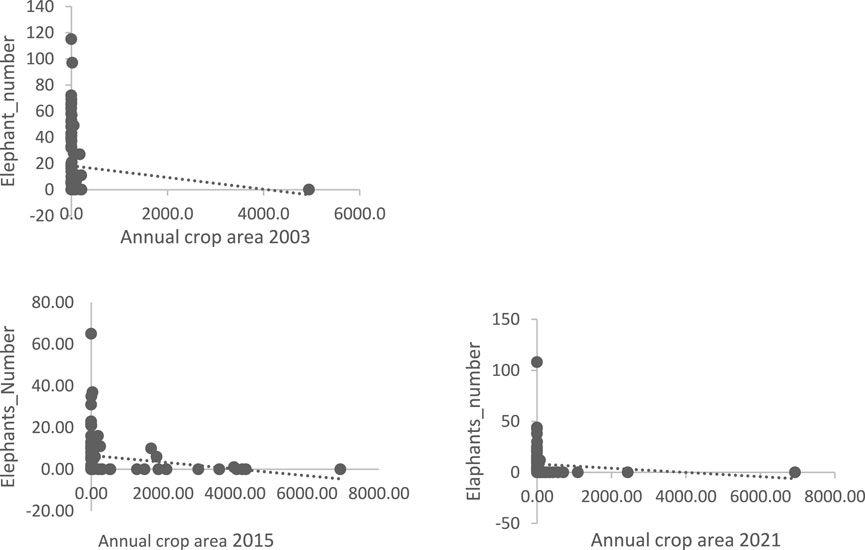
FIGURE 4. Number of elephants in relation to the area (ha) of annual crops, in 2003, 2015, and 2021. Source: 2021 survey data.
The graphs (Figure 4) show that the area of annual crops is negatively correlated with the presence of elephants. The scatterplots show the same pattern for all 3 years.
The graphs (Figure 5) show that the area of the gallery forest is positively correlated with the presence of elephants. The scatterplots show the same pattern for all 3 years.
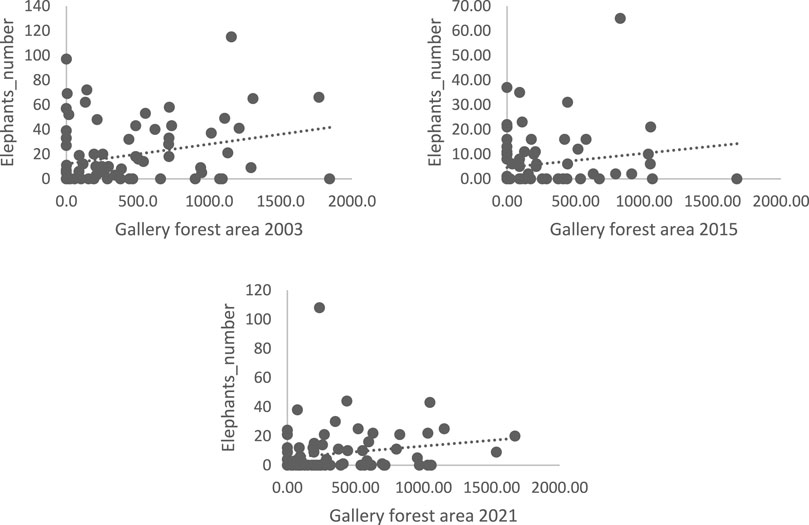
FIGURE 5. Elephant numbers as a function of area (ha) in the gallery forest in 2003, 2015, and 2021; Source: 2021 survey data.
The graphs (Figure 6) show that the area of shrubby savanna is positively correlated with the presence of elephants. However, the scatterplots do not look the same in all 3 years. For the 2015 scatterplot, there is a very weak correlation between area and elephant numbers compared to the other 2 years.
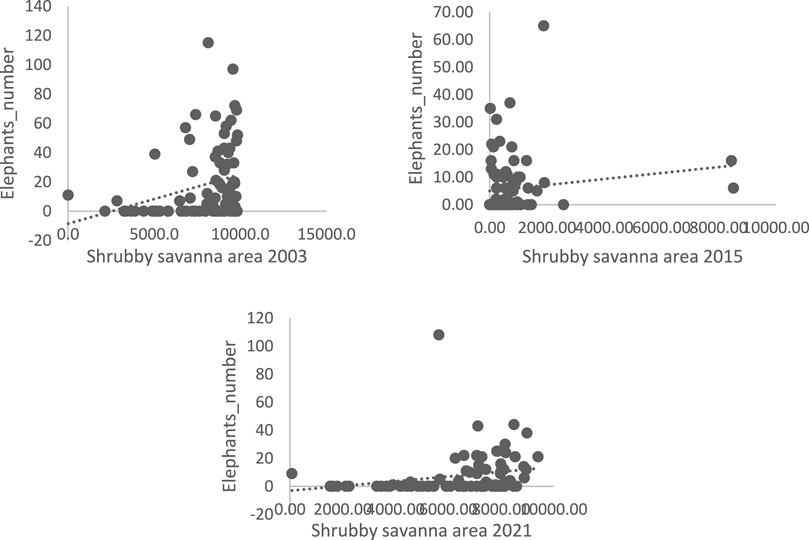
FIGURE 6. Elephant numbers as a function of area (ha) of shrubby-savanna 2003, 2015, and 2021; Source: 2021 survey data.
The graphs (Figure 7) show that illegal activities are positively correlated with the presence of elephants. The scatterplots show almost the same pattern for all 3 years. Only the 2015 scatterplot shows a relatively weak correlation compared to the other 2 years.
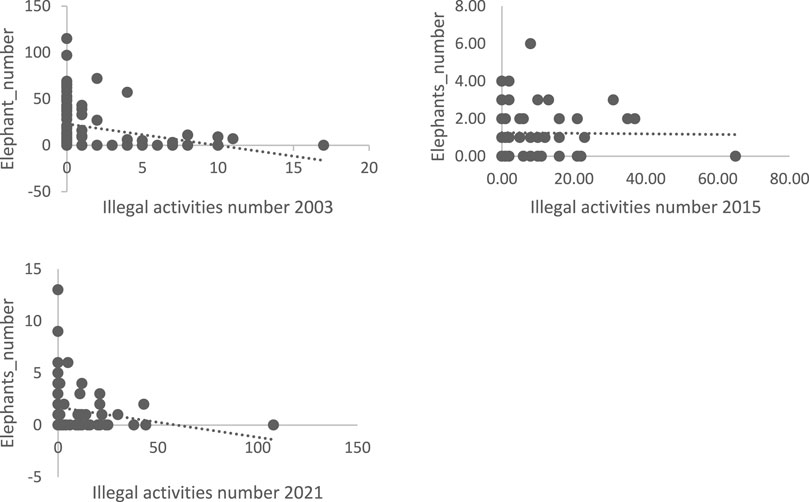
FIGURE 7. Elephant numbers as a function of illegal activity 2003, 2015, and 2021; Source: 2021 survey data.
Logistic regression equations that give the logarithm for each grid of the probability of seeing an elephant divided by the probability of not seeing an elephant as a function of land use and illegal activity was then applied. This then allowed us to deduce the probability of observing an elephant in a grid as a function of the proportions of the land-use units and the number of illegal activities in the grid.
CA: Annual Crops; FG: Gallery Forest; SA Tree Savanna; AI: Illegal Activities; Y and y: probability that Y is equal to a given y value.
It can be seen that the logistic regression equations for all years consider all four occupancy units and illegal activities with the exception of 2015 where the equation is primarily related to gallery forest.
Discussion
The study found that annual cropping, gallery forest, shrubby savanna and illegal activities were significantly correlated with elephant numbers. Annual cropping (−0.144) and illegal activities (−0.207) were negatively correlated with elephant numbers while gallery forest (0.255) and shrubby savanna (0.251) were positively correlated. This is because at the time of the survey I May there is no harvesting in the fields, and because these fields have few trees, shrubs and grasses, the elephants have no interest in visiting them. In the dry season, Nazinga elephants congregate near water (Jachmann, 1991; Hien, 2001). According to Jachmann, (1991), during this time elephants avoid the periphery of the ranch that is close to villages.
With regard to illegal activities, elephants avoid them for reasons of disturbance. Elephants flee areas of heavy poaching and illegal grazing. This is also true for areas of high human presence. Bouchée et al. (2004) and Ouédraogo et al. (2007) point out that human occupation of space is a factor structuring elephant itineraries, mobility and distribution, and that in the dry season, elephants preferred the integral conservation zone that was not disturbed by gunfire. According to Selier et al. (2015), accounting for anthropogenic disturbance is important in determining the distribution of large, wide-ranging, mammal species in increasingly human-dominated landscapes; Human activities within different management units forced elephant to trade-off between disturbance avoidance, and good food and water availability.
The shrubby savanna is attractive to elephants because of the availability of forage. Ecological factors, such as food availability, are correlated with the presence of elephants (De Boer and al., 2013). According to Barnes (1982), during the rainy season elephants eat mainly grass while during the dry season they eat mainly woody elements. Hema, (2004) identified eight plant species that are most damaged by elephants and among these species at least seven were shrubs. This confirms the results of this study which show that the shrubby savanna is attractive to elephants. According to Goheen and Palmer, (2010), elephants select small woody plants within these patches.
Tehou and Sinsin, (2000), in his study of species consumed by elephants found that the three most consumed species were shrubs {Piliostigma thonningii (Schumach.), Strychnos spinosa (Lam), Cassia sieberiana (DC). Seven species (Piliostigma thonningii (Schumach.), Strychnos spinosa (Lam), Cassia sieberiana (DC), Acacia sieberiana [var. vermoesenii (De Wild.) Keay & Brenan], Balanites aegyptiaca (Delile), Diospyros mespiliformis (Hochst. ex DC), and Adansonia digitate (L.)]} are regularly eaten throughout the area with a higher frequency. Most of these species are shrubs. They add that species choice is therefore limited and elephants regularly take the same species of food along the rangelands.
The gallery forest is favorable to elephants because of the presence of water. Elephants are very dependent on water and generally live in relatively small radius around waterholes in protected areas. According to Chase and Griffin, (2009), during the two dry season surveys, most herds were scattered in the northern part of the park with only a few herds in the southwestern corner of the park about 6.5 km from the Kwando River in Zambia. This corroborates Traoré’s view that water (gallery forest), fodder (shrubby savanna and gallery forest) and quietness (illegal activities) are the main factors in the distribution of wildlife in the protected areas. Sawadogo, studying the causes of the difference in the frequentation of the pools of the W Burkina National Park by mammals in 2019 showed that the pools where the animals had more quietude were the most frequented. It also showed that the type of vegetation covers also played a role in the frequentation of ponds by animals.
In 2015, the extreme correlations were gallery forest (0.81) and illegal activities (−0.014). At the time of the inventory in 2015, only water practically influenced the distribution of elephants in the park. Indeed, the 2014 rainy season saw a significant deficit in the amount of water that fell. This caused significant water stress in the second quarter of 2015. The park’s water points dried up causing significant mortality of wildlife and displacement of some animals beyond the boundaries of the protected area. As a result, other land use units and illegal activities had little impact on wildlife distribution in relation to water. Bouché et al., (2004) have shown that during the dry season animals do not stray more than 5 km from waterholes. This area surrounding the ponds, with a radius of about 5 km, is referred to as the “carrying capacity” for wildlife (Clark, 2007).
The carrying capacity is the green pasture available in the dry season in this area around the permanent water points. Thus, the more limited the number of pools, the greater the pressure on the vegetation in this zone.
The regression equations for all the years show the same pattern for all four occupancy units and illegal activities except for 2015 where the equation is primarily related to gallery forest. This confirms the effects of water stress on elephant distribution.
Unfortunately, the gallery forest and shrubby savanna are the units of occupation that are favorable to elephants and are in decline. Actions must be taken to reverse this trend for the sustainability of elephant management.
Conclusion
This study was able to explain the distribution of elephants in relation to land use and illegal activities in Arly National Park. The results of the study confirm those of several previous studies. The study found that only annual cropping, gallery forest, shrubby savanna and illegal activities were significantly correlated with elephant numbers. Annual cropping (−0.144) and illegal activities (−0.207) were negatively correlated with elephant numbers while gallery forest (0.255) and shrubby savanna (0.251) were positively correlated. These results confirmed that water, forage and quietness are the main factors that explain the distribution of elephant in protected areas.
Data availability statement
The original contributions presented in the study are included in the article/Supplementary Materials, further inquiries can be directed to the corresponding author.
Author contributions
All authors listed have made a substantial, direct, and intellectual contribution to the work and approved it for publication.
Acknowledgments
Thanks to: W-Arly-Pendjari Complex supervisory authorities; African Parks Network Benin, GIZ WAP Transfrontier Biosphere Reserve/Integrated management of the WAP Complex projet (GIZ RBT WAP/GIC WAP).
Conflict of interest
The authors declare that the research was conducted in the absence of any commercial or financial relationships that could be construed as a potential conflict of interest.
The reviewer HY declared a past co-authorship with the author EH to the handling editor.
Publisher’s note
All claims expressed in this article are solely those of the authors and do not necessarily represent those of their affiliated organizations, or those of the publisher, the editors and the reviewers. Any product that may be evaluated in this article, or claim that may be made by its manufacturer, is not guaranteed or endorsed by the publisher.
References
Barnes, R. F. W. (1982). Elephant feeding behaviour in ruaha national park, Tanzania. Afr. J. Ecol. 20, 123–136. doi:10.1111/j.1365-2028.1982.tb00282.x
Bouchée, P., Frederick, H., and Kohi, E. M. (2015). Inventaire aérien de l’écosystème W-Arly-Pendjari, Rapport, UICN, Oouagadougou, 64.
Bouchée, P., Lungren, C. G., and Hien, B. (2004). Recensement aérien total de la faune de l’écosystème naturel Po-Nazinga-Sissili, rapport technique, UICN, Ouagadougou, 10.
Chase, M., and Griffin, C. (2009). Seasonal abundance and distribution of elephants in sioma ngwezi national park, southwest Zambia. Pachyderm 45, 88–97.
Clark, G. L. (2007). Stratégie pour l’Aménagement des Points d’Eau dans les Aires Fauniques en Savane Soudano-Guinéenne. Burkina Faso, 24.
De Boer, W. F., van LangeveldePrins, F, H. H. T., de Ruiter, P. C., Blanc, J., VisGaston, M. J. P. K. J., Hamilton, I. D., et al. (2013). Understanding spatial differences in African elephant densities and occurrence, a continent-wide analysis. Biol. Conserv. 159, 468–476. doi:10.1016/j.biocon.2012.10.015
Doamba, P. (2012). Impact de l’utilisation des produits forestiers ligneux et non ligneux sur la gestion du Parc National d’Arly, mémoire de fin d’étude. Ouagadougou: Secheresse. 58.
Douglas, H. I., and Burill, A. (1991). Using elephant carcass ratios to determine population trends. African Wildlife: Research and management. International Council of Scientific Unions. Pg 98-105.
Goheen, J. R., and Palmer, T. M. (2010). Defensive plant-ants stabilize megaherbivore-driven landscape change in an African savanna. Curr. Biol. 20 (19), 1768–1772. doi:10.1016/j.cub.2010.08.015
Hema, M. E. (2011). Distributions de l’éléphant (Loxodonta africana africana blumenbach 1797) et impact sur l’environnement dans la savane ouest-africaine: Le cas du ranch de gibier de Nazinga au Burkina Faso. Thèse de doctorat. Laboratoire de Biologie et ecologie animales. Ouagadougou: UFR/SVT. Université de Ouagadougou.
Hema, M. E. (2004). Les effets des activités humaines, de la végétation et de l’eau sur la distribution des éléphants (Loxodonta africana africana B.) et des antilopes chevales (Hippotragus equinus D.) dans le Parc National des Deux Balé (Burkina Faso). Mémoire DEA Sciences Biologiques Appliquées. Ouagadougou: Université de Ouagadougou. Pg 49.
Hien, M. (2001). Etudes des déplacements des éléphants, liens avec leur alimentation et la disponibilité alimentaire dans le Ranch de Gibier de Nazinga, Province du Nahouri, Burkina Faso. Burkina Faso: Thèse de Doctorat ; Université de Ouagadougou. Pg 136.
INSD (2022). Cinquième Recensement Général de la Population et de l’Habitation du Burkina Faso. Ouagadougou: INSD, pg136.
Jachmann, H. (2002). Comparison of aerial counts with ground counts for large African herbivores. J. Appl. Ecol. 39, 841–852. doi:10.1046/j.1365-2664.2002.00752.x
Jachmann, H. (1991). Evaluation of four survey methods for estimating elephant densities. Afr. J. Ecol. 29, pg188–195. doi:10.1111/j.1365-2028.1991.tb01001.x
Lausanne (2023). Laboratoire de gestion des écosystèmes (GECOS), École polytechnique fédérale de Lausanne, pg11.
Norton-Griffiths, M. (1978). Counting animals, 2nd edition, Handbook no 1. Nairobi: African Wildlife Foundation, pg139.
Ouédraogo, M., Delvingt, W., Doucet, J. L., Vermeulen, C., and Bouché, P. (2007). Estimation des effectifs des populations d’éléphants par la méthode d’inventaire pédestre total au Ranch de Gibier de Nazinga, faculté universitaire des sciences agronomiques de Gembloux, Laboratoire de foresterie des Régions tropicales et subtropicales. Burkina: Natureplus, 10.
Parker, I. S., and Graham, A. D. (1989). Elephant decline: downward trends in African elephant distribution and numbers (Part II). International Journal of Environmental Studies 35 (1–2), 13–26.
Sawadogo, E. (2010). Contribution des aménagements à la gestion durable du Parc National d’Arly, rapport de fin de cycle. Diapaga: Mémoire de fin d’étude. 58.
Sawadogo, E. (2019). Etude des cortèges faunistiques fréquentant les mares du parc national W Burkina Faso à l’aide de camera-pièges. Diapaga: Mémoire de Master. 65.
Selier, J., Slotow, R., and Minin, E. D. (2015). Large mammal distribution in a Transfrontier Landscape: Trade-offs between resource availability and human disturbance. Biotropica 47 (3), 389–397. doi:10.1111/btp.12217
Tehou, A. C., and Sinsin, B. (2000). Écologie de la population d’éléphants (Loxodonta africana) de la Zone Cynégétique de Djona (Bénin). Mammalia 64 (1), 29–40. doi:10.1515/mamm.2000.64.1.29
Keywords: land use, elephant, illegal activities, Arly, park, distribution
Citation: Sawadogo E, Sandwidi H and Hema EM (2023) Impact of land use and illegal human activities on the spatio-temporal distribution of Loxodonta africana (Cuvier, 1825) during the dry season in Arly National Park in Burkina Faso. Front. Environ. Sci. 11:1057675. doi: 10.3389/fenvs.2023.1057675
Received: 11 October 2022; Accepted: 27 June 2023;
Published: 07 July 2023.
Edited by:
Arnaldo Marín, University of Murcia, SpainReviewed by:
Harissou Yahou, Ministry of Environment, NigerSarah-Anne Jeanetta Selier, South African National Biodiversity Institute, South Africa
Copyright © 2023 Sawadogo, Sandwidi and Hema. This is an open-access article distributed under the terms of the Creative Commons Attribution License (CC BY). The use, distribution or reproduction in other forums is permitted, provided the original author(s) and the copyright owner(s) are credited and that the original publication in this journal is cited, in accordance with accepted academic practice. No use, distribution or reproduction is permitted which does not comply with these terms.
*Correspondence: Emmanuel Sawadogo, ZXNhd2Fkb2dvMTdAZ21haWwuY29t