 Wei He
 ShiWei Zheng1,2
95% of researchers rate our articles as excellent or good
Learn more about the work of our research integrity team to safeguard the quality of each article we publish.
Find out more
ORIGINAL RESEARCH article
Front. Environ. Sci. , 13 February 2023
Sec. Land Use Dynamics
Volume 11 - 2023 | https://doi.org/10.3389/fenvs.2023.1042264
It is of great significance to carry out research on the evolution of urban resilience and the detection of influencing factors to promote urban safety management and guide urban planning. This paper constructs urban resilience evaluation indicators based on Scale-Density-Morphology, adopts the “polyhedron method” to evaluate the urban resilience of the Chengdu-Deyang-Mianyang Economic Belt from 2010 to 2020, analyzes the temporal and spatial changes in urban resilience, and explores the impact of natural, social, economic and other factors on urban resilience, to provide a basis for regional sustainable development. The results show that 1) The overall level of urban resilience is not high, showing a clear downward trend and imbalance. Urban resilience decreased from 0.296 in 2010 to 0.213 in 2020. The proportion of districts and counties with high urban resilience is relatively small and continues to decline. The differences in urban resilience in the region are significant and gradually increasing, and there is an obvious imbalance in urban resilience. 2) Urban resilience presents the spatial distribution characteristics of continuous expansion of low-resilience and lower-resilience urban, and shrinkage of the distribution of high-resilience and higher-resilience urban. The types of evolution are mainly manifested as rapid decline and fluctuation decline. 3) The influencing factors affecting the spatial differentiation of urban resilience are different. Ecological factors represented by per capita ecological land area have gradually become the primary factor. The influence of factor interactions is greater than that of individual factors, including both non-linear enhancement and two-factor enhancement.
At present, the uncertainty of urban development has become a common concern of all countries in the world, and it has also made the study of urban system resilience a key and difficult issue facing urban management research and practice (Philibert Petit E, 2022; Gao, 2016). A core difficulty of urban safety management is facing unknown uncertainties at all times. Resilience disaster management, planning, and community construction can use and adapt to this uncertainty to help cities and the external environment achieve dynamic balance (Li and Zhai., 2017), Achieving this dynamic balance require the participation or collaboration of different stakeholders (Zhao and Song., 2010), and better integration of the concept of resilience into urban planning and management.
Since 1973, Holling CS. (1973) introduced the concept of resilience in ecosystem research to describe the response of ecosystems to external disturbances and the ability of ecosystems to reconstruct themselves after disturbances. Over time, academia has gradually shifted the focus of resilience from the perspective of natural ecology to the perspective of human ecology (Shao and Jiang., 2015). As cities are the socio-ecological systems where most human activities take place (Shi et al., 2022; Zeng et al., 2022), the concept of resilience is naturally applied to the study of urban, laying a solid foundation for the study of urban resilience (Chan et al., 2020). Urban resilience refers to the ability of urban systems and all socio-ecological networks and socio-technological networks throughout the temporal and spatial scales to maintain or rapidly return to the desired functional state when disturbed and to adapt to this change and enable rapid change in the system that cannot adapt (Meerow et al., 2016). The essence of urban resilience is the complex, dynamic, and inherently uncertain ability formed by the interaction of social, economic, and ecological factors (Feng et al., 2020a).
Spatial planning is the foundation of urban management, and scholars have proposed a “Scale-Density-Morphology” urban resilience assessment framework for urban spatial planning with the help of the basic theories and analytical tools of landscape ecology, constantly enriching the research on urban resilience assessment (Chunliang et al., 2018; Wang. S et al., 2021). Starting from the basic characteristics of cities, such as scale, density, and morphology, the evaluation framework integrates the concept of resilience into urban spatial planning through the area size, population density, urban development intensity, and distribution patterns presented by urban entities. Relevant studies have theoretically analyzed the relationship between urban security risks and their essential characteristics and consider that the scale, density, and morphology of cities are the factors affecting the vulnerability of large cities (Wang. S et al., 2021). The combination of Scale-Density-Morphology can better reflect the resilience level of the city. Under the process of urbanization, different cities are facing the problems of reduced resilience (Wang. W et al., 2021).
This paper draws on the analysis framework of urban resilience based on Scale-Density-Morphology constructed by predecessors (Xiu Chunliang, et al., 2018; Wang. S et al., 2021). Among them, “Urban scale” refers to the area size and population size of urban development; “Urban density” is a measure of the intensity of urban development, such as population density, building density, etc.; “Urban morphology” mainly refers to the spatial form expressed by the urban entity (Chunliang and Xhu., 2003). When disasters occur, excessive urban size and population density are the most direct causes of increased exposure and risk, and poor urban morphology exacerbates urban safety problems due to scale and density (Brunetta and Caldarice., 2020).
Chengdu-Deyang-Mianyang Economic Belt is located in the transition zone between the hills of the eastern plains and the mountains of the western plateau in Sichuan Province and is at the forefront of economic development in western China. This study analyzes the resilience level of the Chengdu-Deyang-Mianyang Economic Belt and its spatiotemporal evolution and quantitatively measures the influence of ecological, natural, social, economic, and other factors on urban resilience. The results provide a better understanding of the variability of resilience components inside regional cities and can help to design targeted policies to increase the resilience level of vulnerable urban areas.
Scale, density, and morphology are the basic characteristics of a city. This article draws on predecessors (Chunliang et al., 2018; Wang. S et al., 2021) who proposed the Scale-Density-Morphology urban resilience evaluation framework, which uses the “polyhedron method” to evaluate comprehensive urban resilience, the urban resilience evaluation framework is shown in Figure 1.
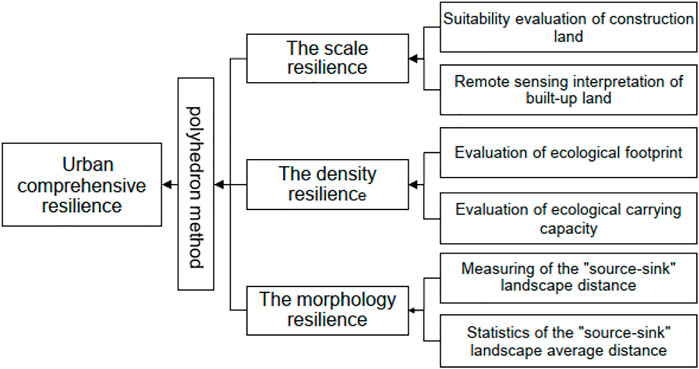
FIGURE 1. Scale-density-morphology urban resilience evaluation framework.
Formula (1) is used to calculate the scale resilience index of each district and county in the study area:
In the formula, RS is the scale resilience index; Ls is the suitable construction land area, and Ld is the built-up land area. A large-scale resilience index indicates that there will be more construction land available in the future, hence the urban-scale resilience is high; a small-scale resilience index indicates that the urban has less room for future development, hence the urban-scale resilience is low.
The area of built-up land is obtained through the statistics of MCD12Q1 (MODIS Land Cover Type Products) data. The evaluation of suitable construction land is based on the suitability of land for urban expansion (Tian et al., 2020). This is evaluated for the actual situation of the study area based on three aspects: natural conditions, location factors, and ecological factors. The eight indicators associated to the three factors are combined using weights based on AHP (Table 1).
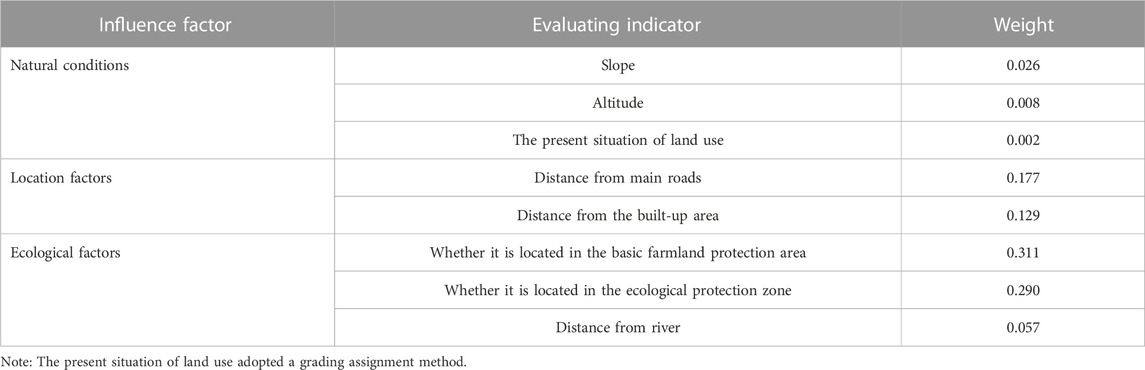
TABLE 1. Evaluation index of suitability for spatial expansion of construction land.
Urban density resilience is measured in terms of the ecological footprint and ecological carrying capacity (Chunliang et al., 2018). The ecological production land is divided into six categories: construction land, cultivated land, forestland, grassland, water area, and fossil energy land, by the city hectare model method (Zhao and Song., 2010), and the corresponding yield is calculated based on the average productivity of the city land. First select the factor and balance factor (Liu et al., 2010), and calculate the ecological footprint and ecological footprint of each district and county through the ecological footprint formula (Wackernagel and Rees., 1996) and the ecological carrying capacity formula (Yang et al., 2015). According to the report of the World Commission on Environment and Development (WCED. 1987), 12% of the ecological capacity needs to be reserved for the protection of biodiversity. Therefore, formula (2) is used to calculate the urban density resilience index.
Where Rd is the urban density resilience index; Ec is the ecological carrying capacity; Ef is the ecological footprint; the larger Rd is, the higher the density resilience of the city; conversely, the lower Rd is, the lower the density resilience of the city.
Based on the “source-sink” landscape theory, this paper uses the “source-sink” landscape average distance index to describe urban morphology. Taking MCD12Q1 as the data source, the built-up land was used as the “sink” patch, and woodland, grassland, and water were used as the “source” patch (Zhang. P et al., 2018). Formula (3) was used to calculate the Morphology resilience index of each district and county. The greater the distance from the “sink” patch to the “source” patch, the worse the spatial balance between construction land and ecological land, and the lower the resilience. In contrast, the greater the resilience.
In the formula, Rm is the urban Morphology resilience index; Ld is the distance from the “sink” patch to the “source” patch in each district and county; L is a constant, and its value is set as the “source-sink” landscape of the entire study area in 2010. The average distance value is 936.97 m.
We referred to the polyhedron method proposed by related scholars (Xu et al., 2016) to calculate the comprehensive resilience index of each district and county in the study area. The triangular pyramid polyhedron is constructed with the three dimensions of “scale-density-morphology”, and the volume of the polyhedron is defined as the comprehensive urban resilience index. The larger the volume of the polyhedron is, the higher the comprehensive urban resilience. The calculation formula is:
In the formula, RA is the comprehensive urban resilience index; Rs is the scale resilience index; Rd is the density resilience index, and Rm is the Morphology resilience index.
It can be seen from Figure 2 that the urban comprehensive resilience is a polyhedral volume with the joint action of “scale, density, and form”. As shown in the figure, the three dimensions of S1M1D1 polyhedron are higher than each dimension of the SMD polyhedron. Therefore, the volume of the S1M1D1 polyhedron is also larger than that of the SMD polyhedron, indicating that the urban comprehensive resilience is high and the city is safer in this state. The dimensions of S2M2D2 are higher and lower than those of SMD. The urban comprehensive resilience is determined by the volume of the polyhedron formed by the joint action of the three.
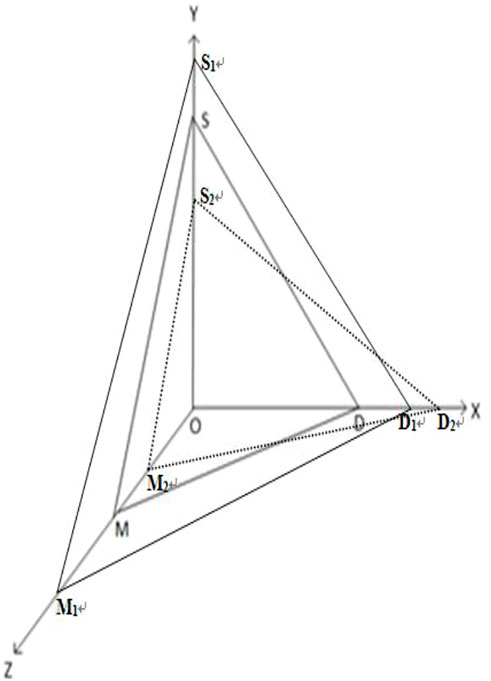
FIGURE 2. Schematic diagram of urban comprehensive resilience index polyhedron method.
The geographical detector is a quantitative statistical analysis method to test the spatial heterogeneity of univariate variables and to detect the causal relationship between two variables by testing the consistency of the spatial distribution of two variables (Wang and XU., 2017). In this paper, the factor detector and the interaction detector are used for analysis.
Based on a review of relevant studies (Zhang. Y et al., 2018; Sun and Zhen., 2021; Shi LY, et al., 2022), and on the actual characteristics of urban in the Chengdu-Deyang-Mianyang Economic Belt, 8 influencing factors were selected from the aspects of the natural environment, ecology, population, transportation, industries, and social economy to analyze their impact on the urban resilience (Table 2).
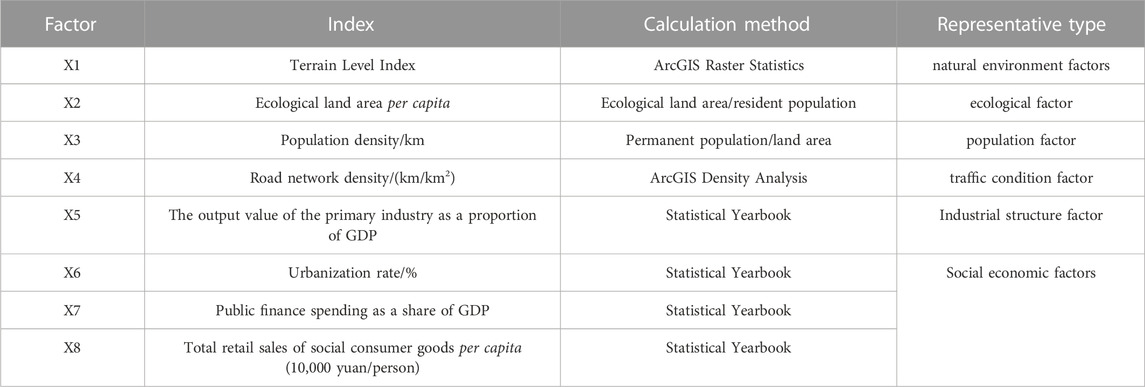
TABLE 2. Geographic Detection factor indicators.
The factor detector mainly detects the explanatory power of the influence factor X on the spatial differentiation of urban resilience. The explanatory power of the influence factor is measured by the q value, and its expression is:
where L represents the number of classifications of the urban resilience index Y or influencing factors X; N and Nh represent the 34 spatial units and the number of research units in each classification, respectively;
It is used to identify the interaction between different influencing factors. By comparing the q value when two single factors X1 and X2 act on Y and the q value when X1 and X2 interact, we evaluate whether factors X1 and X2 work together to increase or decrease the explanatory power of urban resilience or whether these factors have independent effects on urban resilience. The relationship between the two factors can be divided into the following categories (Table 3).
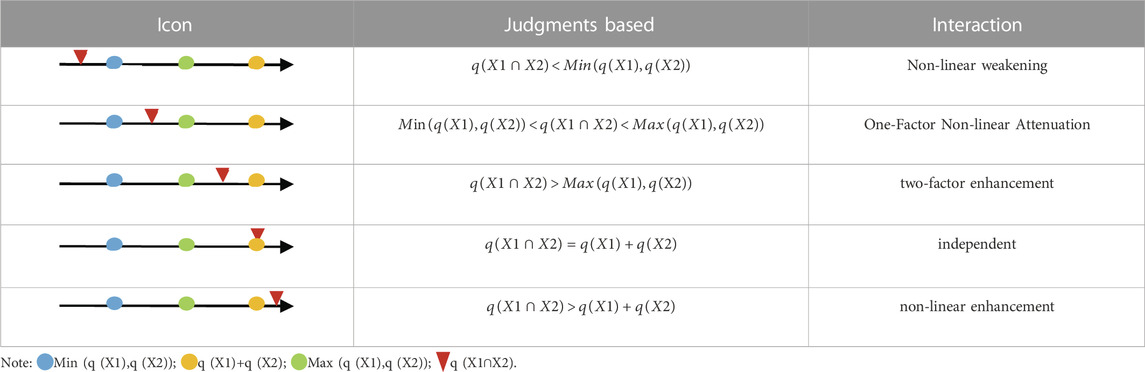
TABLE 3. Types of the interaction of two independent variables corresponding to variables.
The Chengdu-Deyang-Mianyang Economic Belt is located in the central and western parts of Sichuan Province in the transition zone between the plains and hills to the east of Sichuan and the plateau and mountains in the west (Figure 3). The study area is dominated by mountains, accounting for 46.18%, plains 27.99%, hills 25.61%, and plateaus 0.22%. The climate of the region varies greatly. The northern part has a subtropical mountain humid climate, the eastern part and the southern part mostly have a mid-subtropical humid monsoon climate, the western mountainous area has a large altitude difference, and the climate is vertically zonal. Terrain and geomorphic conditions and climate types lead to dangers of natural disasters in the region, such as earthquake, collapse, landslide, debris flow, rainstorm, flood, etc.
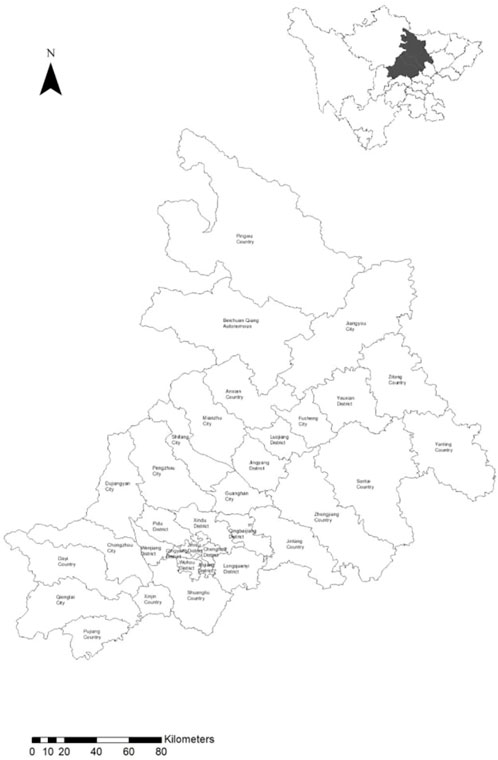
FIGURE 3. Schematic diagram of the scope and location of the study area.
The Chengdu-Deyang-Mianyang Economic Belt is the Frontier area of economic development in western China and the important economic development area in the Chengdu-Chongqing double-city economic circle in China. As of 2020, the GDP of the Chengdu-Deyang-Mianyang Economic Belt was 2313.088 billion yuan, accounting for 47.60% of the GDP of Sichuan Province; the total GDP of the tertiary industry accounted for more than 50% of the GDP of the tertiary industry in Sichuan Province. The resident population of the study area is 29.26 million, and the urban population is 20.02 million. The urbanization rate is 68.43%, which is 14.43% higher than the average level of Sichuan Province.
The socioeconomic data used in this study are mainly from the “Sichuan Statistical Yearbook”, the text and planning data are from the “Overall Plan for Land Use (2006–2020)” of Chengdu, Deyang, and Mianyang, and the current land use data are from MODIS satellite data products; DEM data come from Geospatial Data Cloud (http://gscloud.cn); administrative division data come from the national 1:1 million basic geographic databases published by the National Basic Information Center (www.wedmap.cn). This paper uses the MCD12Q1 data (from NASA’s official website https://ladsweb.modaps.eosdis.nasa.gov) to obtain the land cover types in the study area in 2010, 2015, and 2020 and classifies the land cover types in the study area into six categories. They are construction land, cultivated land, forestland, grassland, water area, and unused land. The data of basic farmland and nature reserves are based on the basic farmland protection data and the results of ecological red line delineation in the “Overall Land Use Plan” of each region and are combined with the land use data.
According to the polyhedron method and formula above, the results of the urban resilience index in the study area from 2010 to 2020 were calculated (Table 4).

TABLE 4. Urban resilience level of chengdu-deyang-mianyang economic belt from 2010 to 2020.
From 2010 to 2020, the urban resilience level of the study area based on Scale-Density-Morphology” showed obvious changes, which was more consistent with the actual development of the study area.
The overall urban-scale resilience index showed a downward trend. It dropped from an average of 1.49 in 2010 to 1.26 in 2020, indicating that the future development of this region will face the constraints of scale security. From 2010 to 2015, the scale resilience declined rapidly, mainly due to the rapid urbanization development, the rapid expansion of construction land, and the increasing shortage of land resources; the downward trend slowed down from 2015 to 2020, during which time the overall land-use plan was strictly implemented to delineate urban development boundaries, the expansion rate of construction land slowed down significantly so that the decline in scale resilience was effectively controlled.
The urban density resilience index showed a slight growth trend. The increase from an average of 0.80 in 2010 to 0.83 in 2020 indicates that the regional ecological footprint continues to be higher than the ecological carrying capacity, the ecological deficit is relatively serious, and there are still hidden ecological dangers such as high population density, uneconomical utilization of fossil energy, and food insecurity in the region. From 2015 to 2020, as the national and local governments paid more attention to ecological environmental protection, the density resilience index of each county and urban area rebounded, but the differences between counties were significant and gradually increased.
The overall urban Morphology resilience index also showed a downward trend, it dropped from an average of 1.28 in 2010 to 1.08 in 2020. The Morphology resilience of 25 districts and counties declined from 2010 to 2015. This is because urban expansion was mainly infill or marginal expansion during the period, ignoring urban ecology. From 2015 to 2020, the change in the Morphology resilience index of each district and county was relatively small, and 15 districts and counties showed a rebounding trend of Morphology resilience. The Morphology resilience of five districts and counties, including Jinjiang District, has always remained at a low level.
From 2010 to 2020, the overall urban comprehensive resilience of the study area was not high and showed a clear downward trend. The average values of the comprehensive urban resilience index in 2010, 2015, and 2020 were 0.296, 0.240, and 0.213 (Table 3), with declines of 23.33% and 12.68%, respectively. Among them, urban resilience dropped sharply from 2010 to 2015, which was related to the rapid economic development of the study area and the continuous occupation of cultivated land and ecological land for construction land. Although comprehensive urban resilience decreased slightly from 2015 to 2020, the decline has slowed down. From the perspective of the three cities, the overall resilience index of the districts and counties in Chengdu is the lowest, the overall resilience index of the counties in Deyang is the highest, and the overall resilience of the districts and counties in Mianyang is in the middle.
We calculated the maximum, minimum, variation coefficient, skewness coefficient, kurtosis coefficient, and other descriptive statistical index values of the comprehensive urban resilience index in the study area (Table 5).

TABLE 5. Descriptive statistical indicators of urban comprehensive resilience.
From the skewness coefficient, it can be seen that the urban comprehensive resilience index of the Chengdu-Deyang-Mianyang Economic Belt exhibits a right-skewed distribution and continues to decrease, that is, the mean value is on the right side of the kurtosis, indicating that the proportion of districts and counties with high comprehensive urban resilience is relatively small and decreasing. The kurtosis coefficients are all positive, indicating that the distribution is steeper than the standard normal distribution, and the counties with similar urban comprehensive resilience indices tend to be concentrated in space. The coefficient of variation has always been at a high level and has increased, indicating that the differences between counties in the study area are significant and differences are increasing. Although the range of the districts and counties in different stages of the study period has narrowed, the range over the 3 years has always been high, which also shows the urban resilience of the districts and counties in the Chengdu-Deyang-Mianyang Economic Belt is unbalanced.
According to the same classification criteria (Table 6), the urban resilience index of the 34 research units of the Chengdu-Deyang-Mianyang Economic Belt is divided into four categories: low urban resilience, lower urban resilience, higher urban resilience, and high urban resilience (Table 7), and visualized (Figure 4).

TABLE 6. Classification criteria for urban resilience levels in the study area.
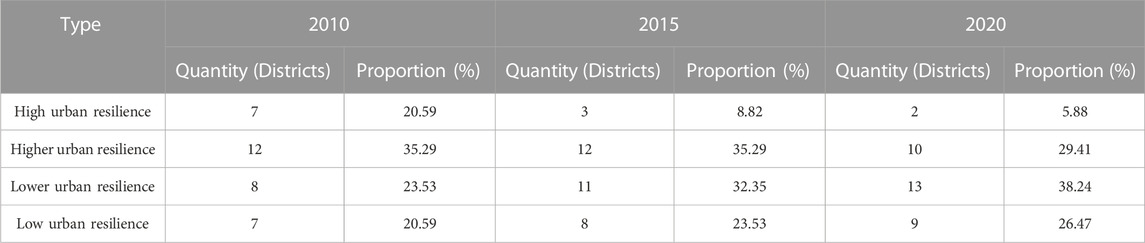
TABLE 7. Types of urban resilience levels in the study area.
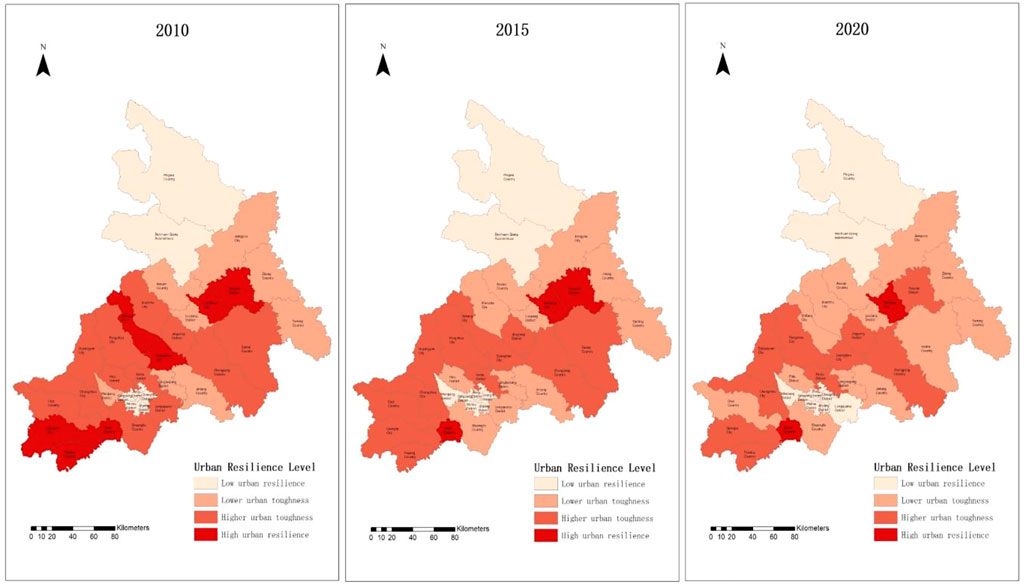
FIGURE 4. Spatial pattern and changes in urban resilience level.
The spatial distribution of urban resilience in the Chengdu-Deyang-Mianyang Economic Belt showed that the areas with low urban resilience and lower urban resilience gradually expanded, and areas with higher urban resilience and high urban resilience continued to shrink. In 2010, the study area was mainly composed of higher urban resilience districts and counties with relatively higher urban resilience. High urban resilience districts and counties were mainly distributed in plain areas, higher urban resilience districts were mainly distributed around high urban resilience districts, and lower urban resilience districts were mainly distributed in Chenghua District, Anzhou District, Jiangyou City, Zitong County, Yanting County, and other places, low urban resilience districts and counties were spatially clustered in the central Chengdu Plain and the Plateau area in the northwest of Mianyang. In 2015, the number of high urban resilience districts and counties in the study area decreased significantly, and the number of lower urban resilience and low urban resilience districts and counties increased. The reduction of high urban resilience districts and counties is mainly concentrated in Chengdu, Deyang, and central Mianyang; the number of districts and counties with high urban resilience remained unchanged, but, there are certain changes in districts and counties. Some high urban resilience districts and counties have changed to higher urban resilience districts and counties, while some higher urban resilience districts have shifted to lower or low urban resilience districts; In 2020, the study area was dominated by areas with lower urban resilience and low urban resilience, and the spread was obvious in the northern and eastern parts of the study area; the high urban resilience districts and counties were further reduced and scattered in space; compared with 2015, the number of districts and counties with high urban resilience has further decreased, shifting from the urban center to the periphery.
We calculated the change rate of urban resilience in each district and county in the two time periods of 2010–2015 and 2015–2020. According to the overall change rate of the resilience level, each district and county are divided into fast descent type, slow descent type, volatility down type, and Gradual rise type (Table 8).
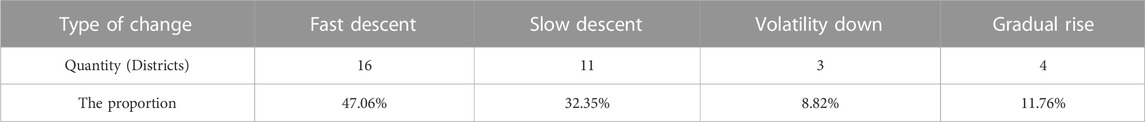
TABLE 8. Statistics on the types of changes in the level of urban resilience.
The fast descent type refers to districts and counties in which the urban resilience index continues to decline during the period and the decline exceeds the average level; The slow descent type refers to the districts and counties in which the urban resilience index continued to decline during the period, but the decline rate was lower than the average level; The volatility down type refers to the districts and counties where the urban resilience index generally decreases but has oscillations during the study period; The gradual rise type refers to the districts and counties in which the urban resilience index rose steadily during the study period (Figure 5).
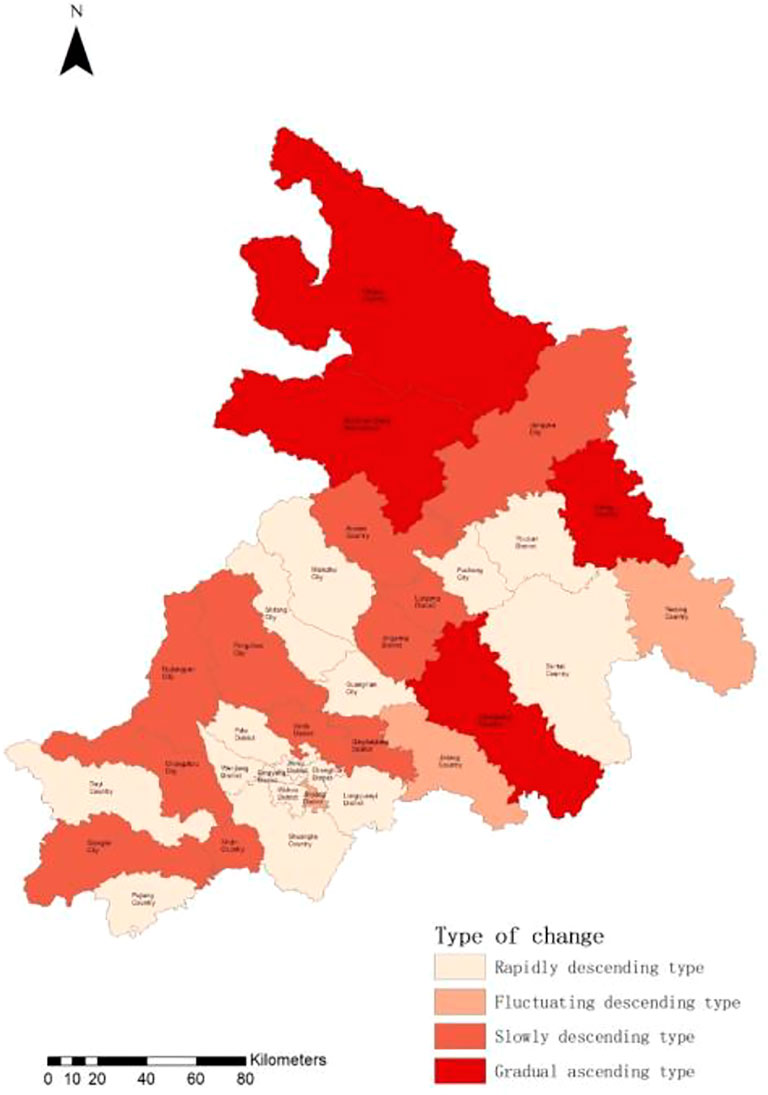
FIGURE 5. Types of the spatial evolution of urban resilience levels.
From 2010 to 2020, 88.24% of the districts and counties in the Chengdu-Deyang-Mianyang Economic Belt were in a state of decline, and only 11.76% of the districts and counties gradually increased their resilience. There are 16 fast descent type districts and counties, accounting for 47.06%, which are mainly distributed around the central urban area of Chengdu, Pujiang County, and Shifang City: the rapid economic development and rapid urbanization in these areas have resulted in a fast descent in urban resilience. There are 11 slow descent type districts and counties, accounting for 32.35%, which were mainly far from central cities. Due to the weak driving effect of the central urban, the urban expansion rate is slow, and its economic development is dominated by agriculture, so urban resilience declines slowly. There is 3 volatility down type districts and counties, accounting for 8.82% of the total area, which is spread over the region. These districts are close to regional urban centers and are subject to the integrated economic development policy of Chengdu-Deyang-Mianyang. The impact of urban resilience showed a downward trend from 2010 to 2015, and after 2015, due to the vigorous promotion of ecological civilization construction, the urban resilience index rebounded. There are 4 gradual rise type districts and counties, accounting for 14.71%. These urban can be divided into two categories: Zhongjiang County, Zitong County, and other large agricultural counties, where a large number of people go out to work, have an ecological surplus, the density resilience is gradually improved, and there is a large space for the expansion of construction land and urban areas, hence, the resilience is gradually increasing; The other category includes Pingwu County and Beichuan Qiang Autonomous County, these counties are rich in forest resources and tourism resources, and the urban morphology is constantly optimized, and the urban resilience is constantly enhanced.
The q-values of the influence of each factor on the urban resilience index are obtained and ranked by applying the aforementioned factor detector method (Table 9).
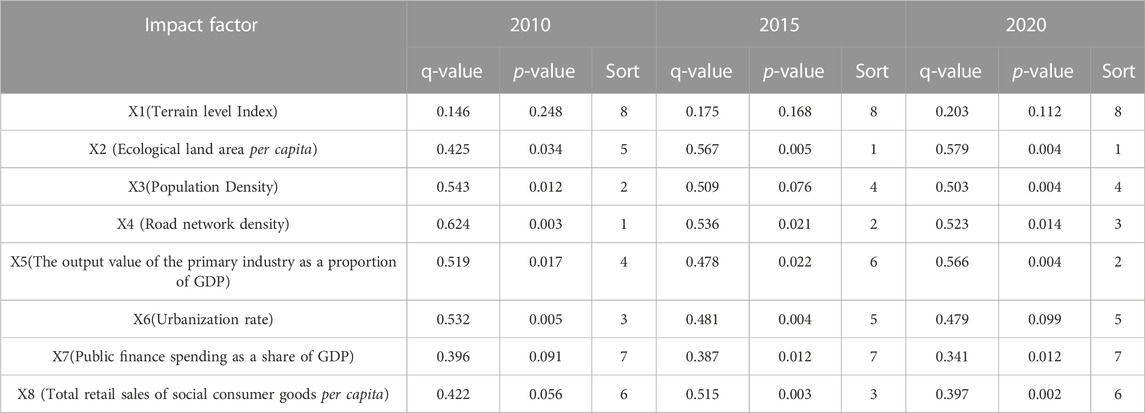
TABLE 9. The intensity of Impact Factors from 2010 to 2020.
From the changing trend of the q value, it can be seen that the influence of each factor on the spatial distribution of urban resilience changes significantly in different periods, and the main factors affecting the spatial distribution of urban resilience in different periods are also different. From 2010 to 2020, the role of topographic location and per capita ecological land area gradually increased, and per capita ecological land area became the main factor affecting the spatial pattern of urban resilience in 2015 and 2020; The effect of population density, road network density and urbanization rate, which represent social factors, gradually weakens, but the change in 10 years is relatively small; The trends of the role the output value of the primary industry in GDP, the public financial expenditure in GDP and the total retail sales of social consumer goods per capita, which represent economic factors, are different. Among them, the role of the output value of the primary industry in GDP first weakens and then increases, showing a fluctuating and increasing trend; The influence q value of the proportion of public financial expenditure in GDP and the total retail sales of social consumer goods per capita increased first and then decreased. To sum up, during the analyzed period, the main factors affecting the spatial distribution of urban resilience have changed from prevailing social factors to prevailing natural and economic factors.
An interaction detector was used to evaluate whether the combined effects of factors X1 and X2 would increase or decrease the control effect of the dependent variable on urban resilience or play an independent role. The q value on the diagonal line is the degree of influence of a single detection factor on the spatial differentiation of urban resilience; the remaining q values are the explanatory power of the interaction of factors X1 and X2 on the spatial distribution of urban resilience. Based on the results, the type of interaction among each pair of factors is determined (Table 10).
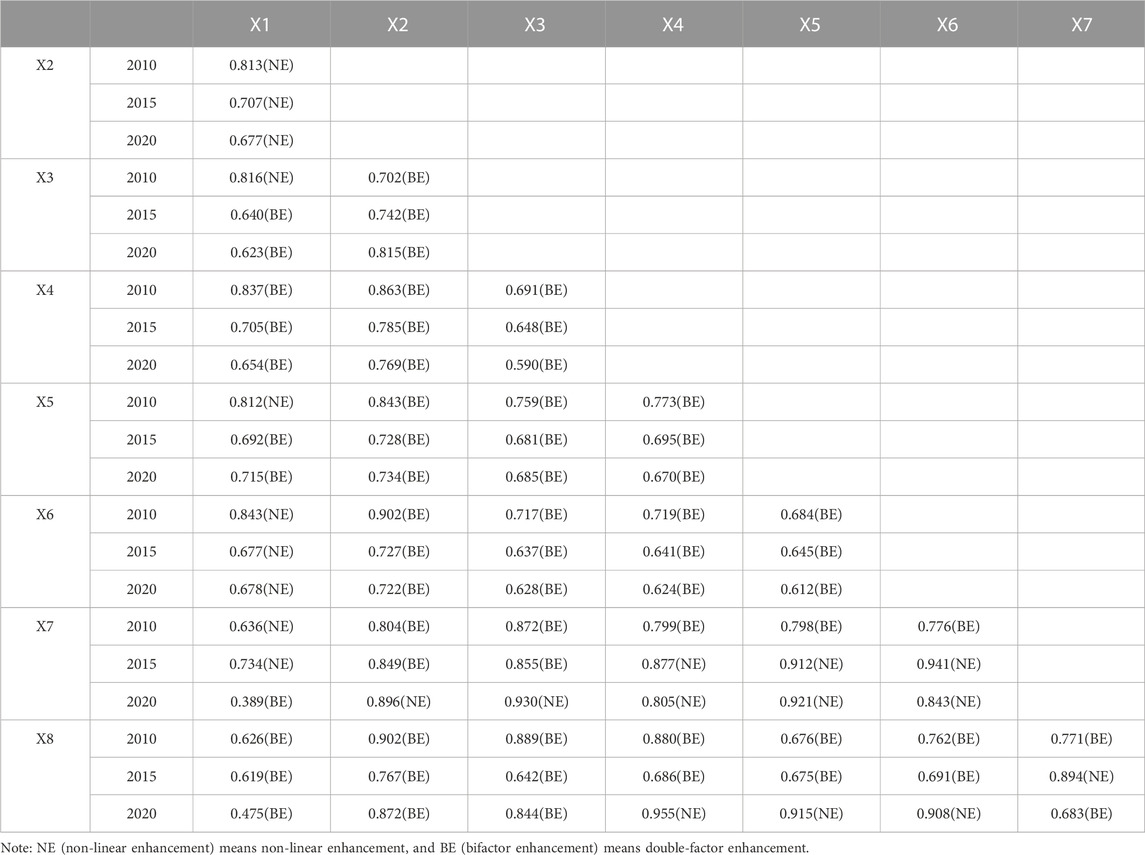
TABLE 10. Interaction q-values and the interaction types of each factor.
It can be seen from Table 10 that the interaction between two factors usually has a greater impact on the spatial pattern of urban resilience than a single factor. The interaction between the two factors has greater control over the spatial pattern of urban resilience than that of a single factor. The q value of the interaction between the per capita ecological land area and each factor is the largest, indicating that the per capita ecological land area is the leading factor affecting the spatial differentiation of urban resilience.
From the perspective of the types of interactions among factors, the two-factor enhanced type is the main type, and a few factors show the non-linear enhanced type, where the effect is greater than the two-factor enhanced effect. Among them, the terrain level index and road network density, per capita ecological land area and population density, population density, road network density, the proportion of primary industry output value in GDP, and urbanization rate are always two factors enhanced. The relationship between the topographic index and per capita ecological land area, and urbanization rate are always non-linear enhancement. The terrain level index, population density, and the proportion of public financial expenditure in GDP have changed from non-linear enhanced type to two factors enhanced type, and the other factors have changed from two factors enhanced type to non-linear enhanced type. It can be seen that when ecological factors, social economy, traffic conditions, and industrial structure interact, there will be a double-factor enhancement effect, but the effect is not as significant as the non-linear enhancement effect. Therefore, it is necessary to pay attention to the enhancement effect of the topographic index on ecological factors, social economy, traffic conditions, and industrial structure.
Based on the above results and analysis, several interesting phenomena were highlighted.
First, urban resilience is a complex system, and there are various assessment methods based on different perspectives, but the urban resilience assessment method based on “scale-density-morphology” is useful for spatial planning. In this assessment method, scale resilience reflects the relationship between urban built-up land and suitable land for construction, revealing constraints and pressures on urban spatial expansion; density resilience reflects the relationship between ecological footprint and ecological carrying capacity, and reveals the status of urban ecological carrying; Morphology resilience reflects the spatial relationship between construction land and ecological land, and reveals whether the urban form is well designed (Chunliang et al., 2018; Feng et al., 2020b; Wang and Han., 2021); The assessment results comprehensively reflect the spatial connection between the urban and the ecological environment, effectively identify the resilience characteristics of the urban region, and accurately reveal the contradiction between the pressure of human activities and the supporting capacity of resources and the environment (Bao et al., 2022; Kong L., et al., 2022). Therefore, it has a more important guiding significance for spatial planning (Fu and Wang., 2018; Shi and Qi., 2019).
Second, like other regions in China, the urban resilience of the study area has also experienced a change process from a rapid decline to a slow decline, which reflects the changes in China’s increasing emphasis on ecological construction and environmental governance in recent years. From 2010 to 2015, the urban resilience of districts in the study area declined rapidly, and from 2015 to 2020, the downward trend of urban resilience slowed down. The research results are consistent with China’s Pearl River Delta region (Wang. S et al., 2021), Yangtze River Delta region (Chen and Xia., 2020), Dalian City (Chunliang et al., 2018), Shenyang (Feng et al., 2020a), Lanzhou (Wang. W et al., 2021), Hangzhou (Xia CY, et al., 2022) and other places. These research results show that great attention must be paid to future urban development. In recent years, China has gradually attached importance to ecological construction and environmental governance and has continuously promoted the safe development of cities through measures included in spatial planning instruments, which have achieved certain results (Wang. S et al., 2021).
Third, there is a close relationship between urban resilience and nature. The results confirm that ecological factors are the primary factors affecting urban resilience (Feng et al., 2020b), and further support urban ecological protection and green infrastructure construction as important means to improve urban resilience (Snep R P, et al., 2020; Vargas-Hernández and Zdunek-Wielgoaska., 2021). Future spatial planning should take the natural environment pattern as the basis, further optimize the urban and rural spatial layout, and create resilient urban and rural settlements (Bush and Doyon., 2019). The research results also found that among the factors affecting urban resilience, there is a significant double-factor enhancement effect (Meng et al., 2021,). Therefore, strategies to enhance urban resilience such as ecosystem-based planning and nature-based solutions should combine different elements (Almenar J B, et al., 2021), and fully consider natural conditions, socio-economic conditions, urbanization level, and policy factors in an integrated perspective (Serdar et al., 2022).
There is still room for further improvement in this study. Urban resilience is affected by many factors, such as sudden natural disasters and other uncertain factors. How to incorporate these factors into the assessment methods, to achieve a comprehensive grasp and accurate evaluation of uncertain risk factors, is worthy of further research in the future (Kong L., et al., 2022). At the same time, the study focused on the selection of indicators related to the scale of urban space. In future research, the quality of ecological space should be reasonably quantified and reflected, to obtain more realistic results and guiding conclusions. Policy factors are an important factor in urban resilience management, but also an important content that must be considered in urban planning. This paper is more based on the analysis of spatial and statistical data, the policy factors are not considered. This aspect can be improved in the future.
This paper takes the Chengdu-Deyang-Mianyang Economic Belt as the research object, constructs the Scale-Density-Morphology urban resilience evaluation index, uses the “polyhedron method” to calculate the urban comprehensive resilience index from 2010 to 2020, and analyzes its spatiotemporal evolution. The main findings are the following.
(1)The urban resilience level of the Chengdu-Deyang-Mianyang Economic Belt during the study period was not high and showed an obvious downward trend and imbalance. The urban scale resilience dropped from an average of 1.49 in 2010 to 1.26 in 2020, and future regional development will still face the constraints of scale security. The urban density resilience index showed a weak growth trend, rising from 0.80 in 2010 to 0.83 in 2020, but the increase is not large, indicating that the regional ecological footprint continues to be higher than the ecological carrying capacity, and the ecological deficit is relatively serious. The urban morphology resilience index shows a slight downward trend, from 1.28 in 2010 to 1.08 in 2020. The comprehensive resilience dropped from 0.296 in 2010 to 0.213 in 2020. Differences in the comprehensive resilience of cities are significant and gradually increasing, and there is an obvious imbalance in the development of urban resilience.
(2)The spatial distribution of urban resilience in the Chengdu-Deyang-Mianyang Economic Belt is characterized by the continuous expansion of low-resilience and lower resilience urban and the continuous shrinking of high resilience and higher resilience urban. The spatial evolution is mainly characterized by the fast descent and the slow descent types. In terms of spatial distribution, the low resilience urban in the Chengdu-Deyang-Mianyang Economic Belt expanded significantly in the north and east of the study area, the lower resilience areas expanded from the center to the periphery, and the higher resilience areas changed from a block-like distribution to a flake-like distribution. The high resilience areas changed from patchy to sporadic distribution. The main trend of spatial evolution is to decline. The fast descent type and the slow descent type each account for 47.06% and 32.53%, which are mainly distributed in rapid economic development, rapid urbanization, and districts and counties close to regional central cities; The Volatility down type accounts for 8.82%, mainly distributed in the districts and counties far from the central urban; The gradual rise type accounted for 11.76%, mainly agricultural counties with prominent population loss and districts and counties rich in forest and tourism resources.
(3)From the perspective of influencing factors, different factors have different effects on the spatial distribution of urban resilience in the study area in different periods. With the change in time, the per capita ecological land area has gradually become the primary factor affecting the spatial pattern of urban resilience in the study area. The effect of each factor affecting the spatial distribution of urban resilience in the study area is as follows: ecological factor > industrial structure factor > traffic condition factor > population factor > socioeconomic factor > natural environment factor. The interaction test results show that the influence of the interaction of different factors is greater than that of a single factor, and the interaction types are non-linear enhancement and two-factor enhancement. Attention should be paid to the enhancement of the topographic index on the dimensions of ecological factors, social economy, traffic conditions, and industrial structure.
The original contributions presented in the study are included in the article/supplementary material, further inquiries can be directed to the corresponding author.
Project administration, WH Methodology, all; investigation, XZ; software, SZ; validation, WH; resources, SZ; writing—original draft, XZ; writing—review and editing, WH.
This research is funded by the foundation Science and technology innovation project of the Sichuan Provincial Department of natural resources (KJ-2018-19).
The authors declare that the research was conducted in the absence of any commercial or financial relationships that could be construed as a potential conflict of interest.
All claims expressed in this article are solely those of the authors and do not necessarily represent those of their affiliated organizations, or those of the publisher, the editors and the reviewers. Any product that may be evaluated in this article, or claim that may be made by its manufacturer, is not guaranteed or endorsed by the publisher.
Almenar, J. B., Elliot, T., Rugani, B., Philippe, B., Navarrete Gutierrez, T., Sonnemann, G., et al. (2021). Nexus between nature-based solutions, ecosystem services and urban challenges. Land Use Policy 100, 104898. doi:10.1016/j.landusepol.2020.104898
Bao, H., Zhang, X. Y., Jiang, M., and Zhang, M. (2022). Study on the city evaluation index system oriented to territorial space safety from the perspective of resilience. China Land Sci. 36 (05), 21–30. doi:10.11994/zgtdkx.20220426.151807
Brunetta, G., and Caldarice, O. (2020). “Spatial resilience in planning: Meanings, challenges, and perspectives for urban transition,” in Sustainable cities and communities, encyclopedia of the UN sustainable development goals. Editors F. W. Leal, A. Marisa Azul, L. Brandli, P. Gökçin Özuyar, and T. Wall (Germany: Springer).
Bush, J., and Doyon, A. (2019). Building urban resilience with nature-based solutions: How can urban planning contribute? Cities 95, 102483. doi:10.1016/j.cities.2019.102483
Chan, X., Wen, T., and Liu, S. (2020). Review on urban and regional resilience research in China. City Plan. Rev. 44 (4), 106–120. doi:10.11819/cpr20200414a
Chen, S., and Xia, A. (2020). Spatial-temporal evolution of urban resilience and diagnosis of obstacle indicators in rapidly urbanized regions: A case study of the urban agglomerations in the middle reaches of the Yangtze River. Mod. Urban Res. (1), 37–44. doi:10.3969/j.issn.1009-6000.2020.01.006
Chunliang, X., Ye, W., and Wang, Q. (2018). Evaluation of urban resilience of Dalian city based on the perspective of "Size -Density-Morphology. Acta Geogr. Sin. 73 (12), 2315–2328. doi:10.11821/dlxb201812004
Chunliang, X., and Zhu, X. (2003). Countering the sudden calamity: Human resident security and the policy of metropolis. Hum. Geogr. 18 (5), 26–30. doi:10.13959/j.issn.1003-2398.2003.05.006
Feng, X., Xiu, C., Bai, L., Zhong, Y., and Wei, Y. (2020b). Comprehensive evaluation of urban resilience based on the perspective of landscape pattern: A case study of Shenyang city. Cities 104 (4), 102722. doi:10.1016/j.cities.2020.102722
Feng, X., Lei, J., Xiu, C., Li, J., Bai, L., and Zhong, Y. (2020a). Analysis of spatial scale effect on urban resilience: A case study of Shenyang, China. Chin. Geogra. Sci. 30 (6), 1005–1021. doi:10.1007/s11769-020-1163-7
Fu, X., and Wang, X. (2018). Developing an integrative urban resilience capacity index for plan making. Environ. Syst. Decis. 38, 367–378. doi:10.1007/s10669-018-9693-6
Gao, E. (2016). Defensiveness, vulnerability and resilience. Three Paradigms Urban Saf. Stud. 11, 105–110. doi:10.3782/j.issn.1006-0863.2016.11.18
Holling, S. C. (1973). Resilience and stability of ecological systems. Annu. Rev. Ecol. Syst. 4 (1), 1–23. doi:10.1146/annurev.es.04.110173.000245
Kong, L., Mu, X., Hu, G., and Zhang, Z. (2022). The application of resilience theory in urban development: A literature review. Environ. Sci. Pollut. Res. 29 (33), 49651–49671. doi:10.1007/s11356-022-20891-x
Li, Y., and Zhai, G. (2017). Research on urban disaster resilience evaluation and promotion strategies in China. Planners 33 (8), 5–11. doi:10.3969/j.issn.1006-0022.2017.08.001
Liu, M., Li, W., and Xie, G. (2010). China's ecological footprint production coefficient based on net primary productivity. Estimation. J. Ecol. 29 (3), 592–597. doi:10.3969/j.issn.1673-4831.2010.05.001
Meerow, S., Newell, J. P., and Stults, M. (2016). Defining urban resilience: A review. Landsc. Urban Plan. 147, 38–49. doi:10.1016/j.landurbplan.2015.11.011
Meng, H. X., and Shen, Q. J. (2021). Disaster resilience of urban ecological space: concepts, influencing factors, and strategies. Urban and Rural Planning 3, 28–34. doi:10.12049/j.urp.202103004
Philibert Petit, E. (2022). Smart city technologies plus nature based solutions: viable and valuable resources for urban resilience. Smart Cities Policies and Financing, 377–398. doi:10.1016/b978-0-12-819130-9.00001-2
Shao, Y., and Jiang, X. (2015). Understanding urban resilience: A conceptual analysis based on integrated international literature review. Urban Plan. Int. 30 (2), 48–54.
Shi, L. Y., Zheng, Q. Y., Yang, M., and Liu, L. Y. (2022). A review of definitions, influence factors, and assessment of urban resilience. Acta Ecol. Sin. 42 (14), 601–6029. doi:10.5846/stxb202107121874
Shi, M., and Qi, C. (2019). Research progress and improvement measures of resilience theory from the perspective of urban and rural planning. West. Hum. Settlements Environ. J. 34 (06), 32–41. doi:10.13791/j.cnki.hsfwest.20190605
Snep, R. P., Voeten, J. G., Mol, G., and Van Hattum, T. (2020). Nature based solutions for urban resilience: A distinction between No-tech, low-tech and high-tech solutions. Front. Environ. Sci. 8, 599060. doi:10.3389/fenvs.2020.599060
Sun, H., and Zhen, F. (2021). Spatial characteristics and influencing factors of urban resilience from the perspective of daily activity: A case study of nanjing, China. Chin. Geogr. Sci. 31 (3), 387–399. doi:10.1007/s11769-021-1201-0
Serdar, M. Z., Koç, M., and Al-Ghamdi, S. G. (2022). Urban transportation networks resilience: indicators, disturbances, and assessment methods. Sustainable Cities and Society 76, 103452–103463. doi:10.1016/j.scs.2021.103452
Tian, P., Song, H., Peng, Y., and Yang, L. (2020). The suitability evaluation and development trend prediction of urban and rural construction land in Zhejiang City based on ArcGIS. J. Wuhan Univ. Eng. 42 (01), 85–90. doi:10.19843/j.cnki.CN42-1779/TQ.201907010
Vargas-Hernández, J. G., and Zdunek-Wielgoaska, J. (2021). Urban green infrastructure as a tool for controlling the resilience of urban sprawl. Environ. Dev. Sustain. 23 (2), 1335–1354. doi:10.1007/s10668-020-00623-2
Wackernagel, M., and Rees, W. E. (1996). Our ecological footprint: Reducing human impact on the earth. Gabriela Island: New Society Publishers.
Wang, J., and Xu, C. (2017). Geographical detectors: Principles and prospects. Acta Geogr. Sin. 72 (01), 116–134. 69. doi:10.11821/dlxb201701010
Wang, J. K., and Han, Q. (2021). Spatial-temporal pattern of the coupling coordination of urban economy-society-environment in China. Econ. Geogr. 41 (5), 193–203. doi:10.15957/j.cnki.jjdl.2021.05.021
Wang, S., Cui, Z., Lin, J., Xie, J., and Su, K. (2021). Coupling relationship between urbanization and ecological resilience in the Pearl River Delta. Acta Geogr. Sin. 76 (4), 973–991. doi:10.11821/dlxb202104013
Wang, W., Guo, Z., Wan, W., Wang, N., and Liu, W. (2021). Temporal and spatial characteristics of urban resilience in Lanzhou: Based on the perspective of "size-density-morphology. J. Lanzhou Univ. Nat. Sci. 57 (1), 39–46. doi:10.13885/j.issn.0455-2059.2021.01.006
Xia, C. Y., Dong, Z. Y. Z., and Chen, B. (2022). Spatio-temporal analysis and simulation of urban ecological resilience: A case study of Hangzhou. Acta Ecol. Sin. 42 (1), 116–126. doi:10.5846/stxb202101030007
Xu, Y., Duan, J., and Xu, X. (2016). Comprehensive measurement method and application of regional multidimensional development. Acta Geogr. Sin. 71 (12), 2129–2140. doi:10.11821/dlxb201612005
Yang, Y., and Jia, T. (2015). Changes in Shaanxi’s ecological footprint and carrying capacity since the 21st century. Acta Ecologica Sinica 35 (24), 7987–7997. doi:10.5846/stxb201407111419
Zeng, X., Yu, Y., Yang, S., Yang, L., and Islam Sarker, M. N. (2022). Urban resilience for urban sustainability: Concepts, dimensions, and perspectives. Sustainability 14, 2481. doi:10.3390/su14052481
Zhang, P., Yu, W., and Zhang, Y. (2018). The spatial and temporal differentiation of urban resilience in Shandong Province and its influencing factors. Urban issues. (09), 27–34. doi:10.13239/j.bjsshkxy.cswt.180904
Zhang, Y., Xiong, L., and Tian, Y. (2018). Study on ecological function zoning in the municipal administrative area based on the landscape ecology source-sink theory: A case study of tongliao, inner Mongolia. Acta Ecol. Sin. 38 (1), 65–72. doi:10.5846/stxb201611242403
Keywords: urban resilience, Scale-Density-Morphological, Chengdu-Deyang-Mianyang Economic Belt, influencing factors, geographic detector
Citation: He W, Zheng S and Zhao X (2023) Exploring the spatiotemporal changes and influencing factors of urban resilience based on Scale-Density-Morphology—A case study of the Chengdu-Deyang-Mianyang Economic Belt, China. Front. Environ. Sci. 11:1042264. doi: 10.3389/fenvs.2023.1042264
Received: 12 September 2022; Accepted: 26 January 2023;
Published: 13 February 2023.
Edited by:
Chiara Cortinovis, Humboldt University of Berlin, GermanyReviewed by:
Ombretta Caldarice, Polytechnic University of Turin, ItalyCopyright © 2023 He, Zheng and Zhao. This is an open-access article distributed under the terms of the Creative Commons Attribution License (CC BY). The use, distribution or reproduction in other forums is permitted, provided the original author(s) and the copyright owner(s) are credited and that the original publication in this journal is cited, in accordance with accepted academic practice. No use, distribution or reproduction is permitted which does not comply with these terms.
*Correspondence: Wei He, Y2R3aGVAMTYzLmNvbQ==
Disclaimer: All claims expressed in this article are solely those of the authors and do not necessarily represent those of their affiliated organizations, or those of the publisher, the editors and the reviewers. Any product that may be evaluated in this article or claim that may be made by its manufacturer is not guaranteed or endorsed by the publisher.
Research integrity at Frontiers
Learn more about the work of our research integrity team to safeguard the quality of each article we publish.