 Sophie Reinermann
 Sarah Asam2
 Tobias Ullmann
 Claudia Kuenzer
95% of researchers rate our articles as excellent or good
Learn more about the work of our research integrity team to safeguard the quality of each article we publish.
Find out more
ORIGINAL RESEARCH article
Front. Environ. Sci. , 20 June 2023
Sec. Drylands
Volume 11 - 2023 | https://doi.org/10.3389/fenvs.2023.1040551
This article is part of the Research Topic Grassland Agriculture and Ecology Research with Multisource Remote Sensing View all 6 articles
Introduction: Grasslands cover one third of the agricultural area in Germany and are mainly used for fodder production. However, grasslands fulfill many other ecosystem functions, like carbon storage, water filtration and the provision of habitats. In Germany, grasslands are mown and/or grazed multiple times during the year. The type and timing of management activities and the use intensity vary strongly, however co-determine grassland functions. Large-scale spatial information on grassland activities and use intensity in Germany is limited and not openly provided. In addition, the cause for patterns of varying mowing intensity are usually not known on a spatial scale as data on the incentives of farmers behind grassland management decisions is not available.
Methods: We applied an algorithm based on a thresholding approach utilizing Sentinel-2 time series to detect grassland mowing events to investigate mowing dynamics in Germany in 2018–2021. The detected mowing events were validated with an independent dataset based on the examination of public webcam images. We analyzed spatial and temporal patterns of the mowing dynamics and relationships to climatic, topographic, soil or socio-political conditions.
Results: We found that most intensively used grasslands can be found in southern/south-eastern Germany, followed by areas in northern Germany. This pattern stays the same among the investigated years, but we found variations on smaller scales. The mowing event detection shows higher accuracies in 2019 and 2020 (F1 = 0.64 and 0.63) compared to 2018 and 2021 (F1 = 0.52 and 0.50). We found a significant but weak (R2 of 0–0.13) relationship for a spatial correlation of mowing frequency and climate as well as topographic variables for the grassland areas in Germany. Further results indicate a clear value range of topographic and climatic conditions, characteristic for intensive grassland use. Extensive grassland use takes place everywhere in Germany and on the entire spectrum of topographic and climatic conditions in Germany. Natura 2000 grasslands are used less intensive but this pattern is not consistent among all sites.
Discussion: Our findings on mowing dynamics and relationships to abiotic and socio-political conditions in Germany reveal important aspects of grassland management, including incentives of farmers.
Grasslands shape the landscape in large parts of Germany and constitute about one third of the agriculturally used area (Destatis, 2021) Grasslands in Germany are mainly used to produce fodder for livestock and are therefore regularly mown and/or grazed. Apart from that, grasslands fulfill multiple ecosystem services, like storage of carbon, filtration of water, erosion control and provision of habitats for numerous species (White et al., 2000; Bengtsson et al., 2019). In addition to site conditions, the management of grasslands determines these ecosystem services by a large degree.
Apart from the provision of fodder, grasslands are also mown or grazed at least once per year to prevent bush encroachment and the shift to tree-dominated ecosystems. In addition, some grasslands are fertilized with manure or chemical fertilizers (Schoof et al., 2020a; Schoof et al., 2020b). The intensity of grassland management–like the frequency of fertilizer application and mowing–has an impact on the species composition and on the provision of ecosystem services of grasslands. More intensive use (i.e., more frequent fertilizer application and mowing events) aims at higher biomass productivity rates which usually comes at cost for the remaining ecosystem services as species richness is reduced (Socher et al., 2012; Neyret et al., 2021). In particular the transition from extensive to intermediate grassland use results in a strong biodiversity loss also on larger spatial scales as it leads to a homogenization of grassland communities (Gossner et al., 2016). Closely related are negative effects on bird and insect species richness which were discovered for intensively used grasslands (Chisté et al., 2016; Jungandreas et al., 2022). In addition, studies found a reduction of soil carbon through intensive grassland use (Ward et al., 2016; Kühnel et al., 2019). Within grasslands, 80%–94% of carbon is stored within soils as soil organic carbon or below-ground biomass (Carvalhais et al., 2014), which makes carbon storage in grassland ecosystem not as short-lived as in forests, for instance. Intensive grassland management does not only lead to a loss but also reduced sequestration potential of carbon due to alteration of grassland soil processes (Liu et al., 2022).
Furthermore, grassland management and use intensity influence the resistance and resilience of grassland ecosystems to extreme weather conditions, like drought events (Isbell et al., 2015; Ingrisch et al., 2018). More diverse grasslands, which are associated with extensive grassland use, were found to be more resistant against weather extremes (Kreyling et al., 2008; Isbell et al., 2015). This is probably a result of higher functional and phenological diversity within species rich grasslands (Kreyling et al., 2008; Beierkuhnlein et al., 2011). Further, managed mountain grasslands were found to be less resistant to droughts than abandoned grasslands, but showed faster recovery (Ingrisch et al., 2018). This highlights that grassland management (and use intensity) alters the effect of climate change on grassland ecosystem functions.
In Germany, grassland parcels are relatively small and the management actions conducted on individual parcels depend on the farmers’ decisions. This results in small-scale–in use intensity and type alternating–grassland parcels. Information on management activities on sub-parcel or parcel level for larger areas is limited and not openly provided in Germany. As grassland management co-determines ecosystem functions of grasslands, the large variety in management practices combined with a lack of knowledge of grassland management and use intensity for a broader scale, aggravates large-scale analyses of grassland ecosystem services. Without spatial information on grassland management, large-scale assessments of grassland ecosystem services, e.g., carbon storage or biodiversity, can hardly be reliably achieved (Kühnel et al., 2019). In particular–but not only–in regard of climate change, large-scale assessments of grassland ecosystem services are crucial to enable holistic optimized management strategies for the future. Grasslands are also dominant land cover types in other north-western European countries, for which monitoring of grassland management is necessary to inform on nutrient cycling and yields according to EU regulations. Previous literature showed the potential of optical and SAR data to investigated grassland management and bio-physical parameters in Ireland and France, for instance (Barrett et al., 2014; Dusseux et al., 2014; Ali et al., 2017), however, national-scale monitoring systems are still missing.
In addition to missing information on grassland functions, there is a lack of national-scale information of grassland yields in Germany. Grassland biomass is used as fodder for livestock; it is either grazed or fed as hey or silage which is produced from the mown plant material. The fodder is usually not sold but directly used on farms. As a consequence, there is no quantified information on grassland yields publicly available, apart from estimations based on expert knowledge. Potential drops in grassland yields due to extreme weather are difficult to quantify. There have been some exceptionally dry and hot periods in Germany within the last years [e.g., 2018 (DWD, 2020)] with significant stress on vegetation (Reinermann et al., 2019), which are assumed to increase in frequency and severity in the future due to climate change. In addition, investigations of regional variations and exact calculations of the reduction in yields are limited. Information on the timing and frequency of mowing events and the amount of biomass mown each time are needed to quantify grassland yields for multiple years and on fine spatial scales. This is particularly relevant for highly diverse and dynamic grassland landscapes, like in Germany, as yield estimations are limited there due to the varying small-scale management activities.
Earth observation enables large-scale investigations of various grassland characteristics (Reinermann et al., 2020). In particular, satellites of the Copernicus Mission (e.g., Sentinel-1 and Sentinel-2) deliver freely available remote sensing imagery at high temporal and spatial resolution suited to investigate highly dynamic and diverse grassland proxies, like management activities or biomass, over large extents. Optical spectral bands and vegetation indices, like the Normalized Difference Vegetation Index (NDVI) or the Enhanced Vegetation Index (EVI), are related to grassland greenness, density and vitality (Huete et al., 2002). Temporal information of grassland characteristics can, therefore, be exploited from time series of optical and, to some degree, Synthetic Aperture Radar (SAR) time series (Holtgrave et al., 2020). Combined with in-situ data, like biomass samples, satellite data was used to estimate and map grassland vegetation biomass (Edirisinghe et al., 2011; Edirisinghe et al., 2012; Magiera et al., 2017; Quan et al., 2017; Wang et al., 2017; Yin et al., 2018; Zeng et al., 2019). In addition to that, Earth observation data was successfully used to classify grasslands according to their use (intensity) (Franke et al., 2012; Asam et al., 2015; Gomez-Gimenez et al., 2017; Lange et al., 2022). Lange et al. (2022) proposed an approach to estimate grassland use intensity as a proxy of mowing frequency, grazing intensity and fertilization for entire Germany using Sentinel-2 (S2) and a Convolutional Neural Network (CNN) classification, resulting in averaged F1-Scores of 0.55 for grazing intensity, 0.57 for mowing frequency and 0.81 for fertilization. Several studies focused on the detection of grassland mowing dates (Voormansik et al., 2013, 2020; Tamm et al., 2016), which mostly relied on Sentinel-1 (S1), S2 and Landsat time series and used a classification (Taravat et al., 2019; Lobert et al., 2021) or a rule-based change detection approach (Kolecka et al., 2018; Griffiths et al., 2020; De Vroey et al., 2021, 2022; Schwieder et al., 2021; Reinermann et al., 2022). Machine learning approaches have the disadvantage of being limited in their spatial and temporal transferability as the models are potentially overfitted (Meyer et al., 2018; Ploton et al., 2020). Schwieder et al. (2021) detected mowing events in Germany for several years using a thresholding approach based on theoretical assumptions and S2 and Landsat 8 time series. Reinermann et al. (2022) conducted and validated a mowing detection based on a calibrated thresholding approach using S2 time series for entire Germany with relatively similar accuracies compared to Schwieder et al. (F1-Score = 0.64 for 2019 for both), despite using a larger and more diverse validation data set, to our knowledge.
Beside these approaches to investigate grassland use intensity and detect mowing events, large-scale, multi-annual grassland mowing dynamics have not been exhaustively assessed and relationships to influencing environmental factors have not been analyzed and understood. In addition, the cause behind the distribution of grasslands characterized by different use intensity levels have not yet been investigated. In Germany, grasslands usually occur on sites which are less productive, as more nutritious sites are used for the production of crops (Bruns et al., 2000). Many grasslands were converted to croplands in the past in the course of intensification processes of agricultural production in Germany, which led to a general homogenization of landscapes (Wolff et al., 2021). Intensive land management usually takes place in favorable areas concerning geo-physical and climatic conditions, but socio-economic factors have also shown to play an important role (Levers et al., 2018). The conditions which have to be fulfilled for intensive or extensive grassland use have not been investigated spatially and for larger areas. Grassland mowing dynamics over time and the relationship to external influences are crucial information needed to comprehensively monitor and assess grassland ecosystem services and to provide the basis for sustainable management recommendations. Here, we use the approach from Reinermann et al. (2022) based on S2 only, to detect mowing events as a central aspect of grassland use intensity for multiple years (2018–2021) over entire Germany and its sub-regions. Time series of the EVI is utilized on pixel level to detect mowing events by locating strong minima, defined by a thresholding approach. In a next step, we analyze spatio-temporal patterns of mowing dynamics, i.e., the mowing frequency and the timing of the first mowing event of grasslands. Subsequently, we investigate the relationship of use intensity to potential influencing factors of mowing dynamics, like temperature, precipitation, elevation, slope, soil type, and conservation schemes. Our objectives are i) to identify the spatial and temporal patterns of grassland mowing dynamics in Germany within the years 2018–2021 and ii) to analyze the influence of climatic, topographic, soil and socio-political conditions on these patterns in order to provide science-based information for policy makers.
Germany is a federal republic in Central Europe, covers an area of approximately 357,000 km2 and lies within the maritime west and the continental east of Europe. As a result, there is a gradient from west to east considering the influence of mild and moist weather conditions originating from the Atlantic Ocean. The average elevation in Germany is about 370 m.a.s.l. and altitudes reach elevations of up to 2,962 m.a.s.l., with a rough gradient from the coastal areas in the north towards the Alps in the south (Figure 1A). Germany has a humid temperate climate with warm summers (Koeppen, 1936). The annual rainfall rates average to 791.3 mm within Germany and annual mean temperatures are 9.3 °C for the current reference period of 1971–2020 (Imbery et al., 2021). Highest temperatures on average can be found in the Upper Rhine Valley and the Neckar Valley in the south-east and the Upper Rhine area in western Germany. The averaged start of the vegetation growing season in Germany also shows earliest start of vegetation growth in the areas with the highest temperatures and latest start of growing season in areas of higher altitudes (Figure 1C).
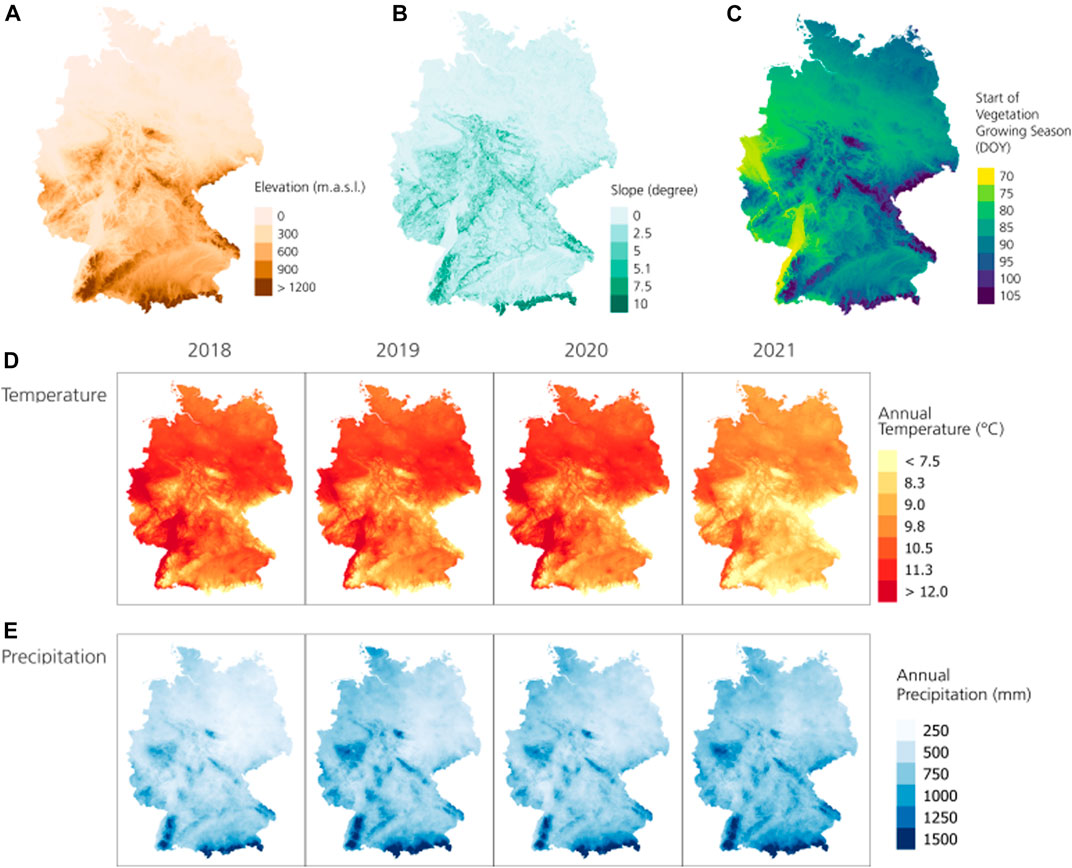
FIGURE 1. Topographic (A,B) derived from EU-DEM (Copernicus, 2016), vegetation onset (C) provided by German Weather Service (DWD Climate Data Center, 2023) and climatic conditions (D,E) also from German Weather Service (DWD Climate Data Center, 2018b) of Germany for the years 2018–2021.
The years 2018, 2019 and 2020 were unusually warm compared to the years since systematic weather recordings (Imbery et al., 2021) with mean temperature anomalies of +2.3 K, +2.1 K and +2.2 K compared to the reference period of 1961–1990, respectively (Imbery et al., 2021) (Figure 1D). In addition, 2018 was extremely dry as mean precipitation rates were 586.3 mm, which is 202.6 mm lower than the average of the reference period 1961–1990 (DWD, 2020). The year 2021 was characterized by rather warm temperatures (+0.9 K compared to 1961–1990) and precipitation rates slightly above average (801 mm) (DWD, 2022) (Figures 1D,E). The comparison of the timing of phenological stages of some indicator plants shows that in early spring, the onset of vegetation growth was latest in 2018 (Figure 2). This, however, changed in ongoing spring and early summer, when the timing of vegetation growth stage was earliest in 2018 and latest in 2021 comparing the 4 years of interest.

FIGURE 2. Comparison of the timings of phenological stages of indicator plants, including the greening of permanent grassland, the flowering of perennial foxtail and the flowering of elderberry, during the period of 1st of March to 9th of June for each year of interest. The data was derived from the German Weather Service (DWD, 2023).
Approximately one third of the agriculturally used area in Germany is covered by grasslands [Figure 3; (Copernicus, 2018)]. Globally, grasslands are defined as areas which are covered by herbaceous vegetation, that mostly consists of grass species (Poaceae) and other graminoids (Cyperaceae, Juncaceae). In addition, there are potentially large herb-layers and a small proportion of woody vegetation present in grasslands (Dengler et al., 2020). In Germany, most grasslands are secondary grasslands, which means that they developed and are maintained under human influence (Dengler et al., 2020). Natural grasslands might only occur in Alpine regions that are too cold for forest growth in Germany. Grasslands are present within various landscapes and vary within their species composition and physiognomy within Germany. They are characterized by successive growth and flowering periods and are usually harvested one to multiple times per year, either by mowing or grazing (Schoof et al., 2020a). Some grasslands are mown as well as grazed whereby grazing takes place rather at the beginning or at the end of the vegetation period (March to November). Mowing takes place one to six times per year at any time throughout the vegetation period. In addition, many grasslands are fertilized regularly (Schoof et al., 2020a).
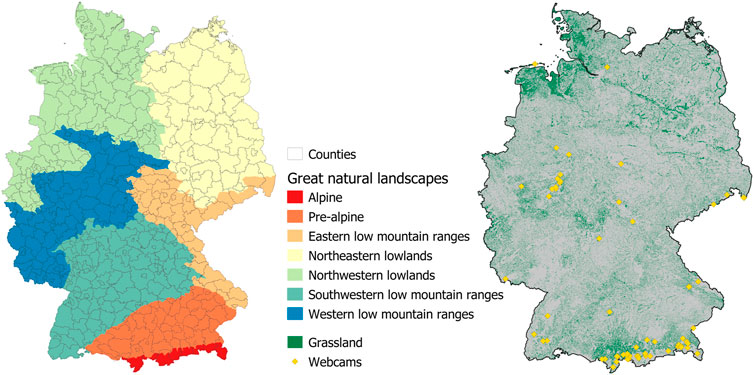
FIGURE 3. Great natural landscapes and counties of Germany (left), and areas covered by grassland (right) according to the Copernicus High Resolution Layer 2018 (Copernicus, 2018).
The analysis of grassland mowing dynamics is based on Copernicus S2 time series which are freely accessible online (Drusch et al., 2012). The two S2 satellites (S2A and S2B) acquire data in 10, 20 and 60 m spatial resolution with a revisit frequency of two to 5 days over Germany. Due to overlapping orbits the coverage is not homogeneous for Germany (compare Figure 4). A total of 63 S2 tiles covering Germany were processed for the years 2018, 2019, 2020 and 2021. Only data between March and November was included as the vegetation is not active during the winter months (December to February) in Germany. This resulted in 4,374 scenes in 2018, 3,483 scenes and in 2019, 4,122 scenes in 2020, and 3,191 scenes in 2021. The S2 data was pre-processed with the MAJA algorithm version 3.3 and areas covered with clouds, cloud shadows or topographic shadows were excluded (Hagolle et al., 2017).
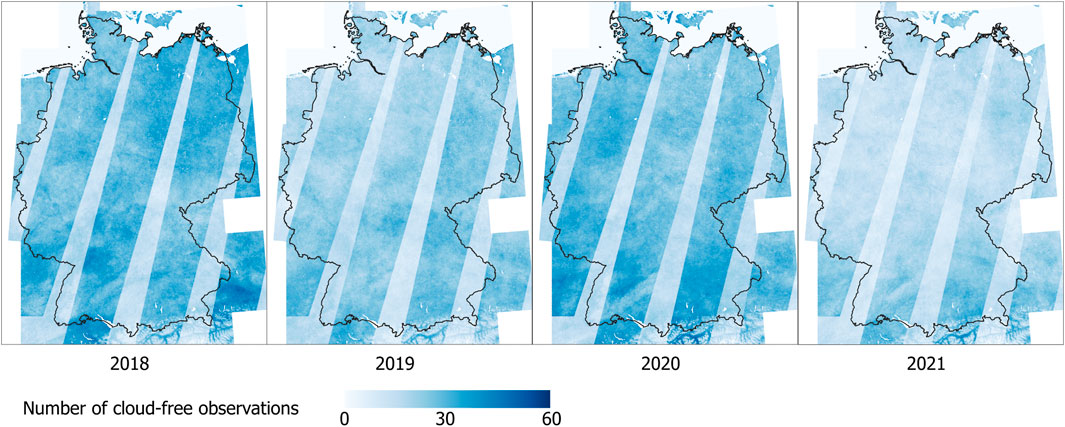
FIGURE 4. Data availability of S2 for the years 2018–2021 after applying the MAJA pre-processing algorithm and filtering out areas which are covered by clouds, cloud shadows or topographic shadows.
A satellite-independent dataset with ground-truth information on grassland management was created by exploiting webcam and self-installed RGB camera imagery on various grassland sites in Germany (Figure 3). The reference dataset was used to calibrate and validate the satellite data-based mowing event detection and gain some additional insights in common grassland management in Germany. Cameras (n = 11) were installed at farms of collaborating farmers in southern Germany, acquiring management information of 13 differently used grassland, which was used for calibration of the mowing detection approach. In addition to these self-installed cameras, images of public webcams (n = 69) were used to create a validation dataset for multiple sites in Germany, covering the entire spectrum of management options and use intensity of grasslands. These openly accessible webcams, which actually fulfill the purpose of informing tourists, acquired at least daily images of one to around eight grassland parcels. The location of the webcams and grasslands covered by them were made out using Google Earth imagery and the information provided on the website of the cameras. All camera images were visually examined to extract mowing dates.
The reference dataset includes information on mowing activities (exact dates), fertilization and grazing activities, on parcel level for all investigated years (2018–2021). The number of reference grassland parcels and mowing events were 49–192, depending on the year (Table 1). In total, there were 1,475 mowing events available for validation among the years. The number of ground observations varies among the years as webcam images were continuously tracked from 2019 onwards, resulting in a lower number of observed mowing events in 2018, for which only webcams with online image storage could be used. In addition, some cameras were out of order for some periods during the 4 years or changed their view angle leading to a variability within the number of observed grassland parcels and mowing activities (Table 1). As some accuracy statistics, like the F1-Score (see Section 3.2.2) include the number of false positives, also information about days without mowing events is needed to evaluate the mowing event detection. Only cameras–and mowing events extracted from these–which have continuous RGB imaged without gaps are included in the calculation of the F1-Score. The frequency distribution of the number of mowing events within each year was relatively similar for the years 2019–2021, for which most cameras were available (Table 1). More information on the reference data extraction and processing can be found in Reinermann et al. (2022).
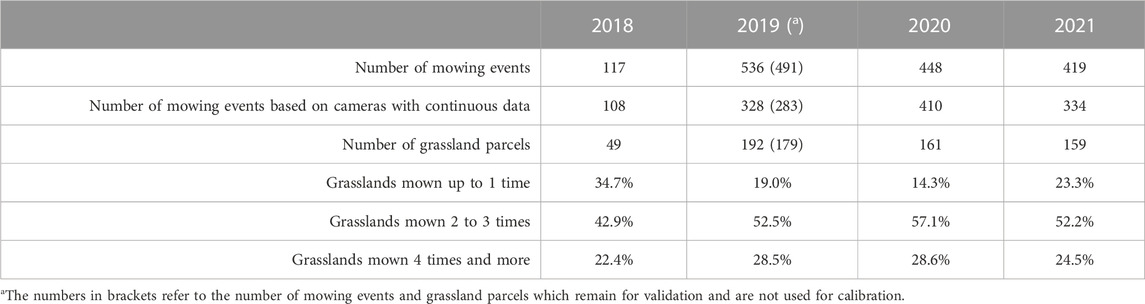
TABLE 1. Reference data with observed mowing events on various grassland parcels in Germany for the years 2018–2021 based on the interpretation of webcam images.
The influence on mowing dynamics was investigated with several datasets: annual precipitation, annual temperature, elevation, slope, soil classes and Natura 2000 sites. The climate data used originates from the German Weather Service (DWD). The variables (temperature, precipitation) are raster datasets in 1 km spatial resolution and are interpolated station data (DWD Climate Data Center, 2018a). The precipitation data used here is the sum of rainfall throughout the year in millimeters. The temperature data are the annual mean values in degree Celsius. Climate data from the year 2020 was investigated within this study.
The elevation and slope information are based on the EU-DEM provided by Copernicus (Copernicus, 2016) in 25 m resolution (Figures 1A,B). Soil classes were derived from the compiled soil map of Germany in 1:250,000 [BUEK 250 (BGR, 2018)]. The Natura 2000 sites were downloaded from the European Environmental Agency (EEA, 2021) and both classes, from the Habitats Directive and the Birds Directive were included in the analysis.
Two geospatial datasets, consisting of a geographic classification (great natural landscapes) and administrational units (counties) of Germany, were used to aggregate the results and investigate patterns of mowing dynamics on different spatial resolution. The great natural landscapes of Germany, which consist of seven terrestrial regions were used in that regard (Figure 3). The great natural landscapes are defined by geographical conditions (e.g., climate and/or topography) and provided by the national environmental protection agency (Meynen et al., 1962). In addition, counties within Germany are used for the analysis (Figure 3). Furthermore, the Copernicus High Resolution Grassland Layer (Copernicus, 2018) of 2018 in 10 m resolution was used to extract the grassland covered area in Germany.
Grassland mowing events were detected based on S2 time series in 10 m resolution according to Reinermann et al. (2022), described in the following. The mowing detection approach was conducted and extensively evaluated within Reinermann et al. for the year 2019 and the approach leading to the best detection results is applied here. According to the mowing detection approach the Enhanced Vegetation Index (EVI) was calculated from the blue, red and near-infrared (NIR) bands of the S2 sensor (Huete et al., 2002):
The EVI time series covering Germany was filtered, interpolated and smoothed per pixel and for each year individually. First, negative values and values above two were excluded as vegetation surfaces usually show positive EVI values, and EVI values above two were considered as outliers. Then, the time series were linearly interpolated to daily time steps and afterwards the Savitzky-Golay filter was applied to smooth smaller fluctuations (Savitzky and Golay, 1964).
Based on this pre-processed S2 EVI time series, a calibrated thresholding approach was applied to detect grassland mowing dates: i) Local minima within the time series are localized. ii) The EVI value range between the local minimum and the preceding local maximum is calculated. For a mowing detection, this EVI amplitude needs to exceed a threshold of 0.07. iii) The local minimum has to be followed by an EVI increase of at least 0.02 to detect a mowing event. If these conditions (i-iii) are met, a mowing event is detected. The mowing date is placed between the local maximum and following local minimum, as the mowing detection is a result of the EVI drop between those and the mowing event could have happened anytime in-between. The thresholds were determined according to the highest accuracy reached in detecting mowing events using the calibration sites (compare Reinermann et al., 2022).
The mowing detection approach, developed in previous work, was applied here to all areas covered by grassland in Germany, according to the Copernicus High Resolution Layer 2018, for the years 2018, 2019, 2020 and 2021. Based on the detected mowing events, the annual mowing frequency and the timing of the first mowing event taking place in each year were further examined.
A subset of the reference data from 2019 (n = 13 grassland parcels, n = 45 mowing events) was used to develop and calibrate the mowing detection approach (Reinermann et al., 2022). The selection of the most suitable satellite-based parameter and the calibration of the thresholds for the mowing detection were conducted according to the most successful detection condition, defined by the F1-Score. The F1-Score is a metric which combines the success rate of correctly detected mowing events (recall) with the exactness (precision) of the detection:
Where
The F1-Score reaches values between zero and one, while the highest accuracy of the detection is achieved when the F1-Score is highest. It is a valuable measure of the detection accuracy here, as the number of false positives is included, without which more detections would automatically lead to higher accuracies. The remaining reference data (n = 1,475 mowing events in total, and n = 1,134 mowing events of cameras with continuous data) was used to validate the detected mowing events for the years 2018–2021 by calculating the percentage of detected mowing events, the F1-Score for each year’s map and by comparing the detected from the true mowing frequency. A deviation of up to 7 days between detected and actual mowing date was accepted as correct mowing event detection.
The multi-annual mowing detections were investigated regarding their spatial patterns and temporal dynamics in Germany. The mowing frequency and the timing of the first mowing event were mapped and averaged to selected geospatial boundaries, like great landscape types or counties in Germany, to highlight spatio-temporal patterns. In addition, the relationships between the mowing frequency and the timing of the first mowing event to climate, topographic and socio-political parameters were investigated. Therefore, linear correlations between these variables were analyzed and the mowing frequency and the timing of the first mowing event were mapped for varying climatic, topographic, soil and socio-political classes. Only areas which are covered by two S2 orbits remain in the analysis of relationships to climatic, topographic, soil and socio-political conditions to guarantee that this analysis is not influenced by artefacts resulting from inhomogeneous satellite data availability.
To enable a comparison to annual temperature and precipitation, the mowing frequency and the timing of the first mowing event, both derived from the S2-based mowing detections, were re-projected (to EPSG: 31467) and resampled to 1 km spatial resolution to match with the climate data. For the mowing frequency, the values between 0 and 6 were averaged within the 1 × 1 km area. As a consequence, the mowing frequencies change from ordinal classes to floating numbers. Regarding the timing of the first mowing event, the dates were also average per 1 × 1 km area. Elevation and slope data were also re-projected to the EPSG: 31467 and resampled to 1 km spatial resolution to enable a comparison to the other raster datasets. The soil classes of the BUEK250 were attributed to the major soil types of the World Reference Base of Soil Resources to enhance universal comparability. The Natura 2000 sites were filtered and only grassland areas which consisted of at least 1 ha remained.
Within the results, spatial and temporal patterns of the mowing frequency and the timing of the first mowing event are analyzed for all 4 years per great natural landscape and on pixel level. In addition, spatial patterns of intensive and extensive grassland use are investigated per county for the year 2020 as it has the best data availability. Lastly, the validation of the mowing detection is presented.
Regarding all of Germany, the highest share of grasslands experienced one or two mowing events per year (69% in 2018, 72% in 2019, 68% in 2020 and 72% in 2021). This is followed by grasslands with three mowing events for the years 2018–2020, and zero mowing events in 2021. The amount of intensively used grasslands, which are mown four to six times per year, stayed relatively constant with shares of 2% (2021) to 5% (2020) of the grassland area in Germany.
Multi-annual mean mowing frequencies (MFmean) for the four investigated years (2018–2021) are displayed per great natural landscape in Germany along with the shares of grassland of varying mowing frequencies for each year (Figure 5). Within Germany, the Pre-Alpine region shows the most intensive grassland use as approximately half of the grassland area is mown at least three times per year. In addition, this region has the least share of grasslands which are not mown at all. The Pre-Alpine region is followed by the Alpine region, which is characterized by intensively used grasslands in the valleys and extensively used grasslands on steep slopes and high altitudes. The least intensively used region is the Northeastern Lowland area, where more than 80% of all grasslands are mown maximally twice a year. Within this region, the management stays relatively constant within the four investigated years. Rather low mowing frequencies are found in the Western Low Mountain Ranges and an intermediate distribution of grassland mowing frequencies in the Northwestern Lowlands, the Southwestern and Eastern Low Mountain Ranges.
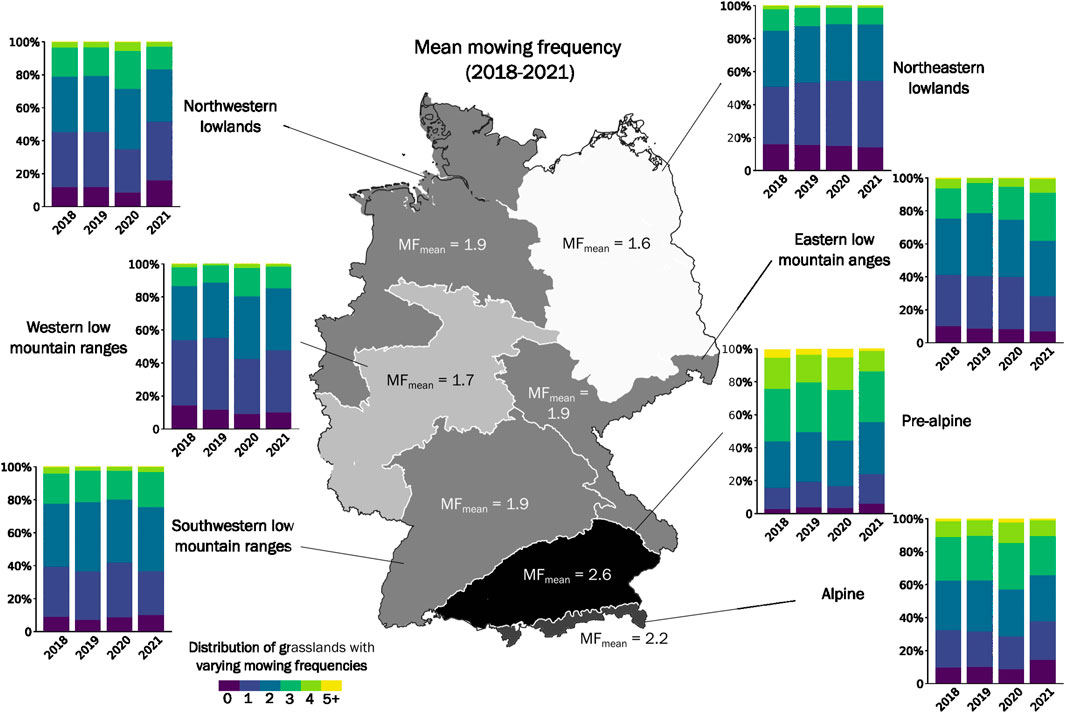
FIGURE 5. Multi-annual (2018–2021) mean mowing frequency (MF) per great natural landscape in Germany (map) and per year mowing frequency proportions in these landscapes (bar charts).
For some regions a variability in mowing frequencies is detected between the years. The Northwestern Lowlands, Western Low Mountain Ranges, Pre-Alpine and Alpine regions show a larger area with higher mowing frequencies in 2020 compared to the other years (Figure 5 Bar charts). The Eastern Low Mountain Ranges is the only landscape which has a higher number of mowing frequencies within 2021 compared to the other years. For all landscapes, the number of grasslands, which are mown two times per year, stays relatively constant. Highest variability is found for grasslands that are mown one time or three times.
To assess the grassland management at a finer spatial detail, pixel-wise (10 m resolution) grassland mowing dynamics are depicted for all 4 years in Figure 6. It highlights the fine resolution of the mowing detection approach as parcel borders are visible but also within-parcel variations are potentially detected. Similar to what was observed on the level of landscape regions, most grasslands with high mowing frequencies (mown more than three times) are found in southern/south-eastern regions of Germany among all years (Figure 6). The general mowing frequency patterns are consistent among the years, but there are differences visible on smaller scales as single grassland parcels show changed mowing frequencies within the years (compare Figures 6A–D). In 2020, the mowing frequencies were for large parts of Germany higher than for the other years; in 2021, the mowing frequencies were lower. Regions with a weaker data availability due to single orbit coverage (compare Figure 4) might be visible through less detected mowing events (West of Figure 6D). The zooms in Figures 6A–D illustrate the grassland mowing frequency in four representative grassland landscapes in Germany, characterized by large shares of grassland and varying abiotic conditions. The zoom region in the very north of Germany (Figure 6A) is characterized by a relatively humid climate and a potential influence of groundwater due to the proximity to the marshes which are typical for the north-eastern coast of Germany. In this region, for intensive grassland use with more than three mowing events per year, grasslands are usually drained. The subset shows higher mowing frequencies in 2019 and 2020 and lower mowing frequencies in 2018 and 2021. The region in eastern Germany (Figure 6B) shows larger grassland parcels compared to the other regions which is characteristic for the land-use in the former German Democratic Republic of East Germany. This subset appears to be under rather consistent treatment during the four investigated years. The landscape in the subset in the west of Germany (Figure 6C) is characterized by gentle hills and small, alternating parcels of grassland, crops and forests. The region shows–to a relatively small degree–higher mowing frequencies in 2018 and 2020 compared to the other years. The region in the south of Germany (Figure 6D) is among the rainfall-richest areas of the country, lies on the foothills of the Alps and shows a large share of grasslands with varying use intensities and up to 5–6 harvests per year. It shows higher mowing frequencies within 2018 and 2020 compared to the other years.
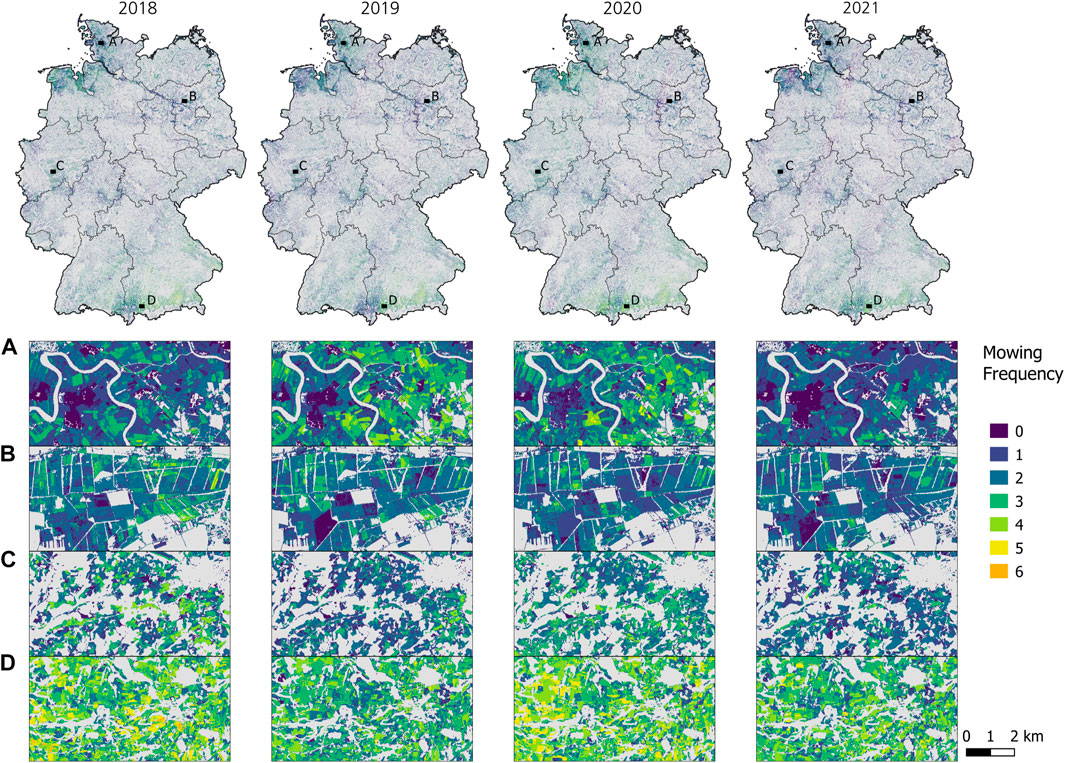
FIGURE 6. Pixel-wise grassland mowing frequency for Germany for the years 2018–2021 with four zooms (A–D) showing grassland of various landscapes (A) the Schleswig Geest; (B) the North Brandenburg Plateaux and Upland; (C) the Bergisches Land/Sauerland; and (D) the Southern Alpine Foreland).
The timing of the first mowing event of each year shows similar patterns to the mowing frequencies as regions in the south and north-west of Germany–which show high mowing frequencies (see above)—are mown relatively early, while regions in central and eastern Germany–which exhibit rather low mowing frequencies–are mown relatively late (Figure 7). However, in addition, areas in the central-west of Germany are mown comparably early. In 2018 the timing of the first mowing event was earlier compared to the other years in large parts of the country, in particular in southern Germany. In 2021, the date of the first mowing event was later than in the previous years for many regions.
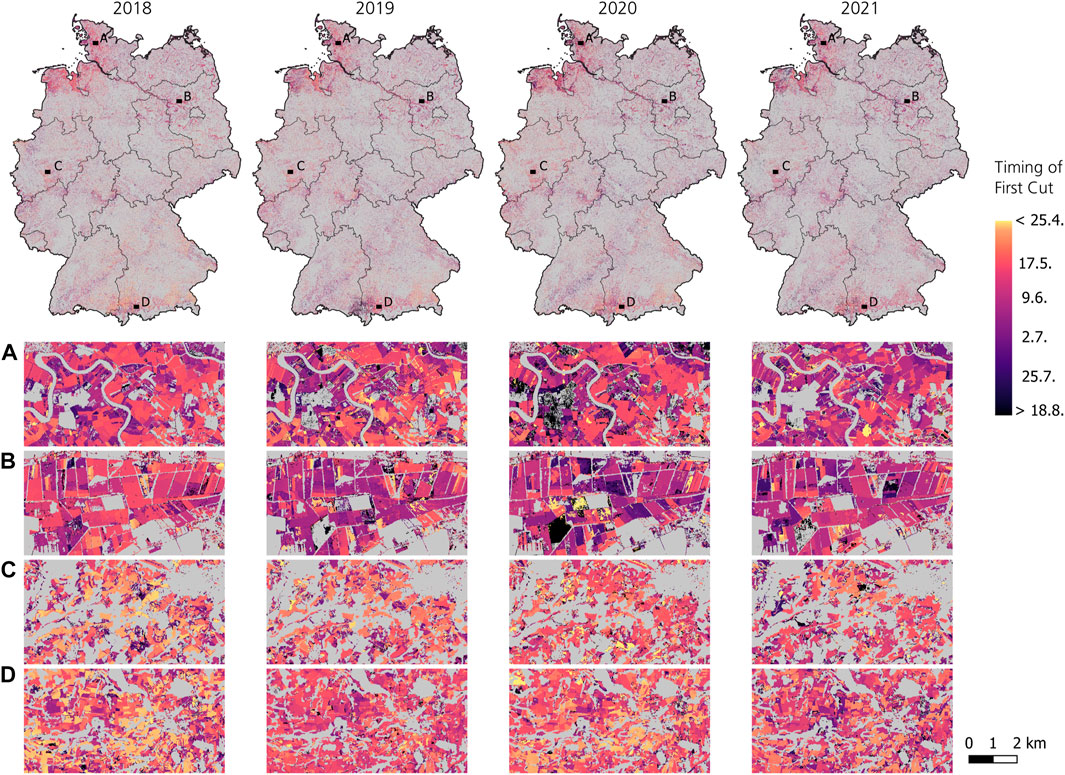
FIGURE 7. Calendar dates of first mowing event of grasslands in Germany for the years 2018–2021 with four zooms (A–D) showing grassland of various landscapes.
For the three great natural landscapes with the largest proportion of grassland areas in Germany (at least 15% of the area is covered by grassland) the timing of the first mowing event is investigated in more detail.
The violin plots (Figure 8) show the distribution of the timing of the first mowing event for these three regions and the 4 years under investigation. They indicate if the timing of the first mowing event (on a pixel basis) was rather early or late for each year, if large proportions of grassland is mown around the same date, or if there are multiple dates where many grasslands are mown for the first time. Broad sections of violin bellies indicate that many grasslands were mown within this period of time in the region, the bold blue line indicates the mean timing of the first mowing event per year and region. Figures 8A–C reveals differences between the years for the three great landscape regions. In 2018, many grasslands were mown comparably early (especially for the Pre-alpine region). In 2019, there are two (for the Northwestern lowlands and the Western low mountain ranges) or even more (for Pre-alpine region) dominant date ranges for the first mowing event observable. In 2020, the first mowing event took place later than in the 2 years before, in particular in the Northwestern Lowlands (Figure 8A). In 2021, the first mowing event was rather late for all three regions, but especially for the Western Low Mountain Ranges and the Pre-Alpine region (Figures 8B, C). It can be assumed that the timing of the first mowing event relates to the stage of vegetation growth. Comparing the timing of phenological growth phases of different indicator plants (Figure 2) with the timing of the first mowing events of the 4 years gives shows that the patterns stages of vegetation growth in early spring (March) seem less similar to the patterns of the timing of the first mowing event compared to the stages of vegetation growth in late April and May. This becomes visible, for example, when examining the patterns in 2018, as the vegetation onset was rather late, but phenological phases in April and May were reached comparably early compared to the other years (Figure 2). In addition, the first mowing event took place rather early in large parts of Germany (Figures 7, 8).
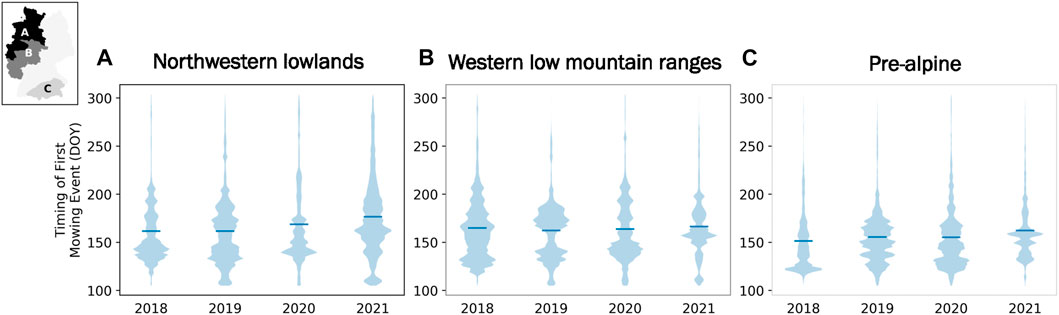
FIGURE 8. Distribution of the timing of the first mowing event for three great natural landscape types (A–C) in Germany for the years 2018–2021. The blue line shows the mean of the first mowing event per year and landscape.
The year 2020 showed a good satellite data availability (Figure 4) and was investigated in more detail with respect to hotspot regions of high use intensity, early mowing and large variability of grasslands (Figure 9). By aggregating information on mowing dynamics to county level (next to great natural landscapes and patterns on pixel-level), the proportions of intensively or extensively used grasslands and the variability of mowing intensity are highlighted.
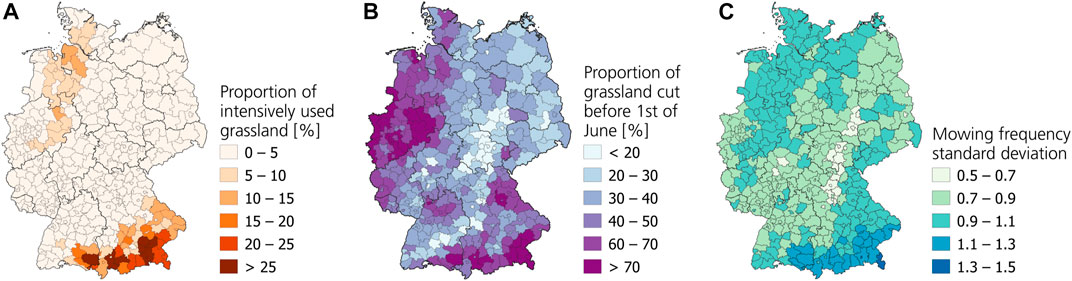
FIGURE 9. Per-county proportions of intensively used grasslands [mown 4–6 times, (A)], grasslands mown before first of June (B) and the standard deviation on spatial scale of mowing frequencies per county (C) in 2020.
The aggregation of the pixel-wise mowing frequency data to counties (Figure 9) highlights that intensive grassland use (4–6 mowing events per year) can be found in southern Germany mainly and to a lesser degree in the north-west (Figure 9A). For some counties (“Rosenheim”, “Mühldorf am Inn”, “Erding”, “Weilheim-Schongau”, Ostallgäu” and “Ravensburg”) up to 25% of the entire grassland is used intensively. Grasslands which are for a majority mown before first of June can be found in the south and west of Germany, with many early mown grasslands in North Rhine-Westphalia in 2020 (Figure 9B). Generally, intensively used grasslands are mown relatively early; however, there are also many regions with lower mowing frequencies that have a high share of grasslands which are mown before 1st of June in Germany (e.g., regions in Franconia in the southern-central east or the “Sauerland-Bergisches Land” area in the northern-central west). The standard deviation of the mowing frequency per county (Figure 9C) is an indicator for the regional diversity in grassland mowing dynamics, i.e., counties with higher mowing frequency standard deviations are less uniformly managed. Regions with more intensively used grasslands generally also show a higher diversity within their mowing dynamics per county and these counties have high shares of early mown grasslands. The high standard deviation indicates that next to the intensively used grasslands also intermediate and extensively used grasslands exist. This high variability of grassland management might be related to the diversified landscape with valleys, and different gradients of slopes and altitudes.
The mowing events which were detected based on S2 time series were validated with an independent reference dataset, consisting of 179 grassland parcels and 1,475 mowing events among the years 2018–2021. Within 2020, best results were achieved where approx. two thirds of the mowing events were correctly detected, allowing a time period of 7 days between detected and observed mowing date (Table 2). In 2019, results were almost equally good. In 2018 and 2021, the mowing detection was less successful compared to the other years. The exactness of the mowing detection (precision) was highest in 2019, resulting in the highest F1-Score of 0.64, closely followed by 2020 (F1-Score = 0.63). The mowing detection in 2021 and, in particular, in 2018 show lower precision rates and, consequently, lower F1-Scores of 0.52 and 0.50 compared to the other years, which indicates a lower mowing detection accuracy. The average time span between detected and observed mowing date was lowest for 2018 (2.5 days) and highest for 2021 (3.4 days). Between one half to three thirds of all grasslands reveal correctly detected mowing frequencies or only one additional or missed mowing event when comparing the detected to the observed mowing frequency (63% in 2018, 74% in 2019, 76% in 2020 and 52% in 2021).
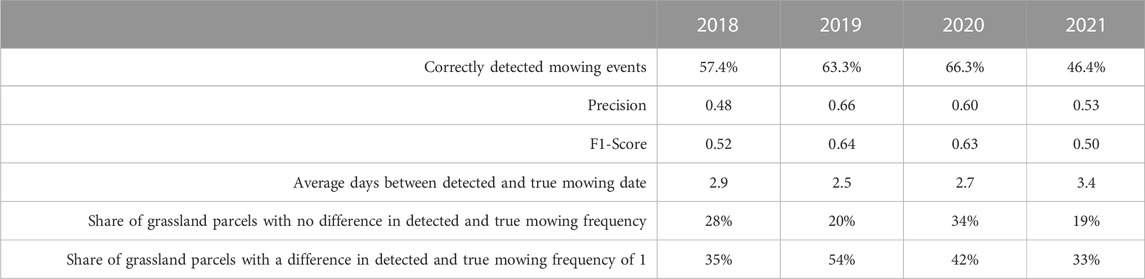
TABLE 2. Results of the validation of detected mowing events in Germany for the years 2018–2021 based on an independent reference dataset. The allowed time period between detected and true mowing date was 7 days.
To investigate the spatial relationship between mowing dynamics and climate as well as topographic conditions, linear regression analyses were conducted between the mowing frequency and the timing of first mowing event (response variables) and the independent variables temperature, precipitation, slope and elevation for the year 2020. Table 3 shows the results of the correlation analyses for the year 2020 as this year was the one with the highest number of available data, but the other years have similar correlation results. All climate and topographic variables showed significant relationships (Table 3) to grassland management. However, the correlations were rather weak, not exceeding 13% of explained variance (Table 3). The highest correlation coefficient was identified for the relationship between the mowing frequency and annual precipitation in 2020 (Pearson’s r = 0.36).

TABLE 3. Results of simple linear regressions of climate and topographic parameters and the mowing frequency and the timing of the first mowing event for Germany in 2020.
Annual mean temperature, total precipitation, slope and elevation of grassland use-intensity classes were investigated to identify under which climatic or topographic conditions grasslands are used rather intensively or extensively. The range of climatic conditions of all grasslands was compared to the range of intensively used, extensively used and early mown grasslands, and to the timing of the first mowing event of the year (Figures 10A–C). Two levels of intensive use were defined for grasslands that were mown at least three times and grasslands which were mown at least four times per year. Even though three mowing events are sometimes considered as a rather medium use intensity, it was defined as intensive use here as the mowing frequencies were resampled to a coarser resolution (from 10m to 1 km) to match with the climate data and, therefore, the higher mowing frequencies are probably underrepresented. When comparing the climatic condition range of intensively used grasslands to all grasslands it became visible that grasslands which were mown at least three times per year occurred in smaller temperature and precipitation ranges than all other grasslands (Figure 10A). Grasslands which were mown three to six times per year occurred in regions which showed annual mean temperatures between approximately 8.4°C–11.2 °C and precipitation amounts of 600–1,500 mm in 2020. The climatic conditions of intensively used grasslands, which were mown four to six times per year, showed even smaller ranges. In contrast, extensively used grasslands (mown zero to one time per year) occurred in the entire climatic range of grasslands in Germany (Figure 10B). Regarding the timing of the first mowing event in 2020, there is a relatively clear boundary visible as grasslands which were mown before 1st of June only appeared in regions with an annual temperature of at least 8 °C (Figure 10C). However, these grasslands occurred in the entire precipitation range. Grasslands which were mown even earlier (1st of May) in 2020 show smaller climatic ranges (9.5°C–12.2°C and 500–1,000 mm). Considering slope and elevation, a comparable picture was revealed (Figures 10D–F). Intensively used grasslands (mown three to six times) occurred mainly on smaller slopes (until around 5°) and for elevations of ca. 900 m (a.s.l.) with an interrupt between 100 and 200 m, approximately, compared to all grasslands in Germany (Figure 10D). Grasslands which were mown four to six times showed even smaller slopes (until around 2°) and a smaller elevation range of 400–850 m (a.s.l.), approximately. As for the climate variables, extensively used grasslands occurred on the entire range of slope and elevation (Figure 10E). Early mown grasslands, in particular grasslands mown before 1st of May, occurred on lower elevations and relatively small slopes compared to the entire grassland area (Figure 10F).
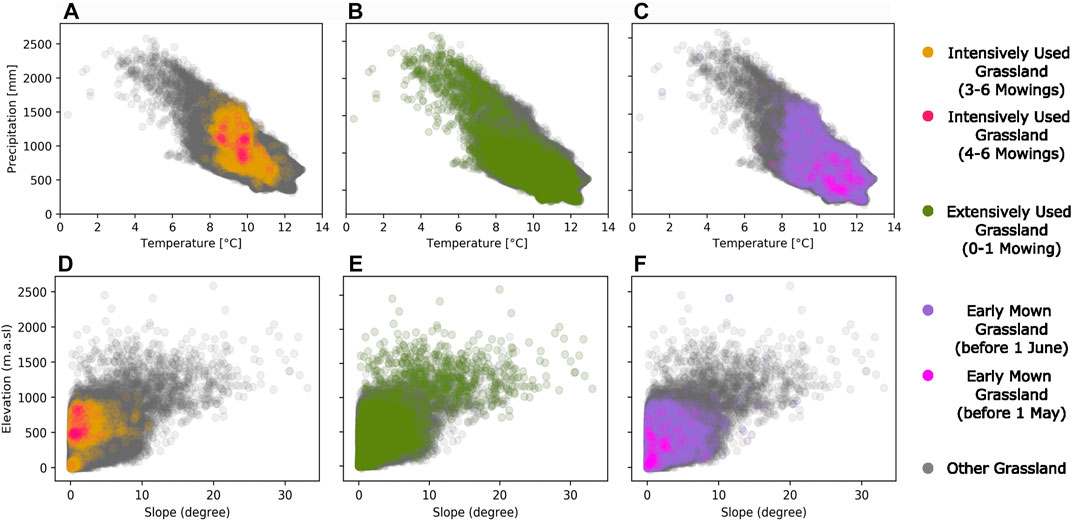
FIGURE 10. Scatterplots of grassland areas according to mean temperature and annual precipitation in 2020 (A–C), and slope and elevation (D–F), showing all grasslands in Germany (grey), the intensively used grasslands (red and orange), the extensively used grasslands (green) and grasslands which are mown early in 2020 (violet and pink).
The value ranges of temperature in 2020, precipitation in 2020, slope and elevation of intensive grassland use (mown three to six times) extracted from the overlay of mowing frequencies and climatic and topographic parameters (Figure 10) are mapped to highlight their spatial extents in Germany (Figure 11). Values outside of intensive grassland use in 2020 were greyed out for all four variables. The thresholds were estimated from visual inspection of the feature space covered by grasslands with different mowing intensity levels (Figure 10). Assuming that these variables might co-determine grassland use intensity in Germany, areas which are potentially too hot, cold, dry, steep or high for intensive grassland use are revealed (Figure 11).
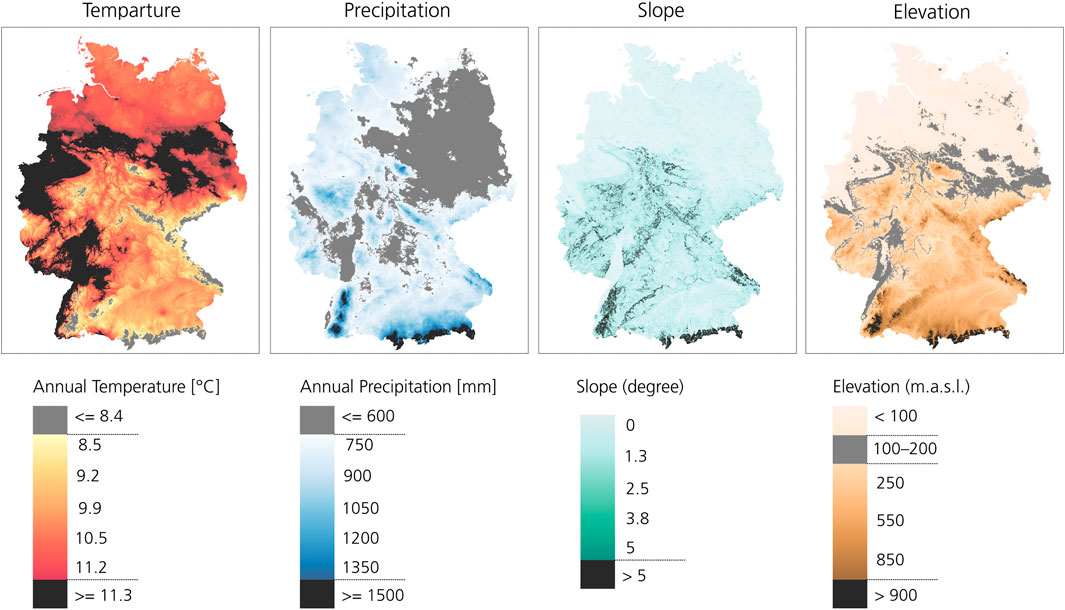
FIGURE 11. Areas where temperature, precipitation, slope and elevation are within the distribution range of intensively used grasslands (mown 3 to 6 times) (in colors) and areas outside this range (grey).
To examine whether grasslands on some soil classes are mown more often or less often than on other soil classes, the mowing frequency in 2020 was mapped for each soil class and the distributions of mowing frequencies were compared (Figures 12A–D). Almost one third of all grassland soils are Cambisols (33%) in Germany. Histosols and Gleysols together make up for a bit more than one third (36%) of grassland soils and the remaining soil classes have smaller shares. Regarding the use intensity, there is not one soil class which is used only intensively or extensively, however there are some tendencies visible. Leptosols and Chernozems reveal lower grassland mowing frequencies, Histosols higher ones (Figure 12D). When examining the mowing frequencies spatially, the patterns match with the frequency distributions as heterogeneous mowing intensities are visible among different soils (Figures 12B, C). In the landscape in northern Germany, Gleysols show higher mowing frequencies and Histosols mixed patterns (Figures 12B, C). In central Germany, more intensive grassland use can be found on Cambisols, whereas Leptosols are less intensively used (Figures 12B, C). Some regions in the south of Germany are particularly intensively used. Here, Luvisols and Gleysols show high mowing frequencies (Figures 12B, C). When focusing on highly intensively used grasslands, which are mown four times or more, most of these grasslands occur on Cambisols (30%) or Gleysols (20%). However, Cambisol and Gleysols are among the most common grassland soils in Germany. When for each soil class the shares of intensively and extensively used grasslands are estimated, grasslands mown four to six times show overall small shares below 10%. When comparing the share of these grasslands among soil classes, Luvisols show the highest share (9%), followed by Histosols (7%). When focusing on extensively used grasslands, which are mown only up to once per year, again Cambisols (31%) and Gleysols (22%) show the highest amounts considering all soil classes. When investigating the share of extensively used grassland per each individual soil class, Chernozem (64%) is followed by Leptosols (49%), Anthrosols (44%) and Podzols (43%). It has to be added, that Chernozems are usually highly productive and the area covered by grassland is relatively low.
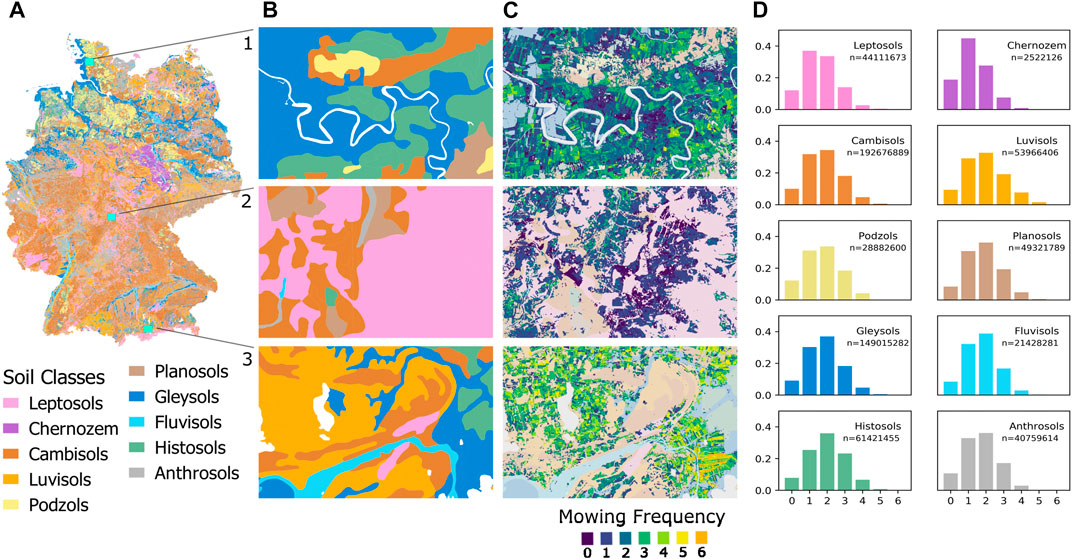
FIGURE 12. Distribution of soil classes in Germany (A) and for three zoom regions in the north, center and south of Germany (B). Mowing frequency of 2020 for the three subset regions (C) and the mowing frequency distribution of 2020 for all soil classes (D).
While abiotic conditions seem to shape the environmental framework for intensive grassland use, the question remains, under which conditions grasslands are rather extensively used. We investigated the influence of protected areas by comparing the mowing frequency and the timing of the first mowing event for areas within and outside of Natura 2000 sites (Figure 13). The assumption that grasslands which are protected after the Natura 2000 framework are extensively used, was only partly confirmed. Grasslands within Natura 2000 boundaries show an overall lower number of mowing events compared to grasslands outside of these protected areas (Figure 13C). However, intensively used grasslands (more than three mowing events) also occur within the protected areas. This is also visible in the mean mowing frequency values for all German Natura 2000 sites as shown in Figure 13A. Regarding the timing of the first mowing event, the peak of very early mowing activities is less pronounced for Natura 2000 grasslands, but they are also mown relatively early at times (Figure 13C).
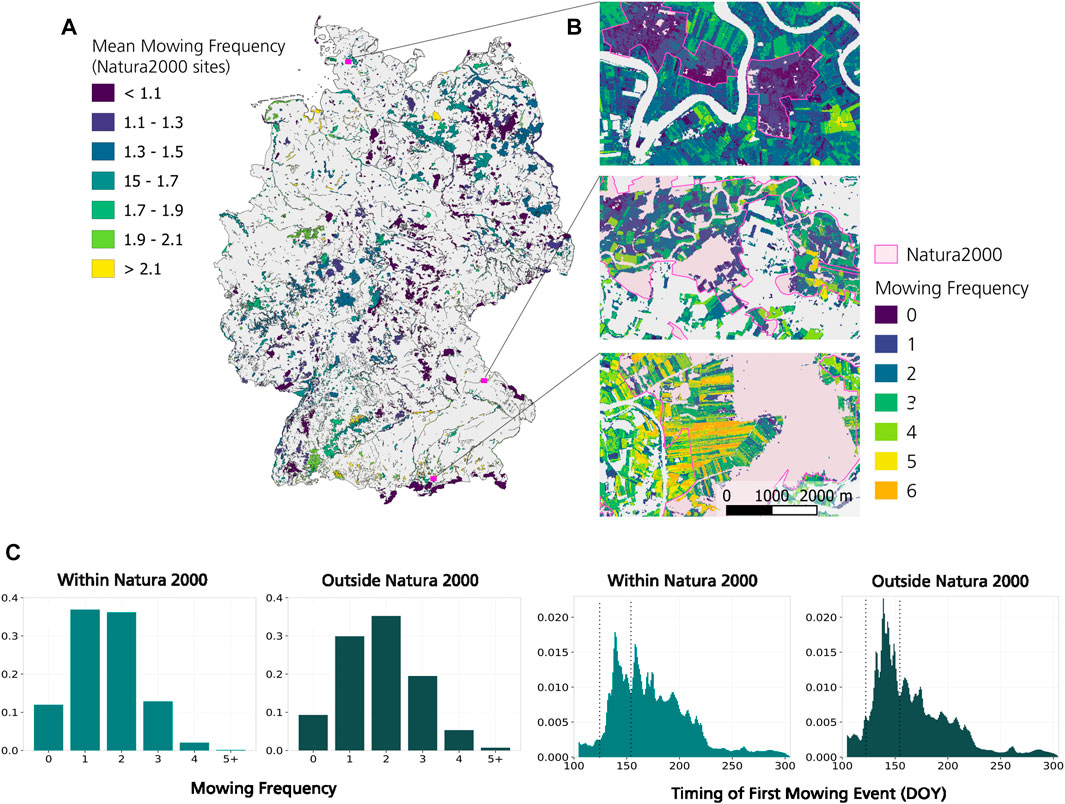
FIGURE 13. Mean mowing frequency in 2020 for the Natura 2000 protected areas of Germany (A), pixel-based mowing frequencies for three zoom regions with Natura 2000 sites (B), and the distribution of mowing frequency and timing of first mowing event for all Natura 2000 areas and all other areas (C). 1st of May and 1st of June are marked as vertical lines in (C).
The overall mowing dynamics–mowing frequency and timing of the first mowing event–in Germany were relatively constant among the investigated years 2018–2021. Obviously, farmers generally retain their management routines and the mowing activities stay more or less the same. This was expected, since extensively used grasslands with a maximum of one harvest per year cannot be easily used intensively in the following year, and vice versa, as the given abiotic conditions and especially the species composition in most cases would not allow it. Intensively used grasslands are typically composed of fast-growing species, which loose fodder quality when they are not mown early enough as their woody parts increase. In contrast, species which can be found on extensive grassland sites do not show such high biomass growth rates, and hence do not allow for frequent mowing (Le Clec’h et al., 2019). Future research could elaborate on this by comparing the relationship between plant species richness and mowing dynamics for grassland areas beyond plot-scale.
The detected spatial patterns of grassland mowing intensity in Germany are in line with the results of Schwieder et al. (2021) with an overall potential range from zero to six mowing events per year and highest numbers of mowing events in southern/south-eastern Germany. Lange et a. (2022) who investigated mowing events as part of an analysis of grassland use intensity, found mostly only one to three mowing events per year and could not detect areas with high mowing intensities within Germany. The validation of our results however confirms that grasslands with mowing frequencies of up to six times per year are present in the Alpine Foreland and other regions in Germany.
Considering all investigated years, some variabilities between the years were found, in particular on smaller scales. In 2018, for large parts of Germany the first mowing was conducted earlier compared to the following years (2019–2021). The year 2018 was extraordinary hot and dry in Germany (DWD, 2020). However, January 2018 was rich in precipitation, followed by a relatively warm April and May (DWD, 2020). These conditions led to fast vegetation growth in spring (Bastos et al., 2020) which resulted in earlier mowing activities. This is in accordance with findings from a study on EVI deviances from 2000 to 2018 based on MODIS data in which April and May 2018 show positive anomalies of grassland vegetation condition, and only the summer months had negative anomalies (Reinermann et al., 2019). The overall mowing frequency in Germany, however, was not as strongly reduced in 2018 as might be expected from these relatively high temperatures and low rainfall rates, in particular, as grasslands were found to be more vulnerable against and affected by drought stress (Buras et al., 2020; Bastos et al., 2021; Chen et al., 2022) and yields were reduced (Emadodin et al., 2021; Rakovec et al., 2022). It might be possible that soil moisture was sufficient for plant growth and the weather conditions were buffered as many grasslands occur on rather moist sites (as shown in Section 4.2.2). In addition, the areas showing the highest mowing intensity in southern and south-eastern Germany were not as severely affected by the drought as areas in northern and north-western Germany (Bastos et al., 2020). In contrast to croplands, grasslands are constantly covered by vegetation which reduces the risk of top soil layers drying up. This is in accordance with Kowalski et al. (2022) who found less severe drought effects on grasslands in moist sites compared to other grasslands in a study site in the north-east of Germany. In addition, here, we investigate mowing dynamics instead of grassland yields. It is plausible that farmers still mowed their grasslands even though plant growth and, consequently, yields were reduced due to the dry and hot weather conditions. It was shown that climate extremes and management have an impact on the role of grasslands acting as a carbon sink or source, highlighting that management information needs to be considered when modelling grassland carbon balance (Myrgiotis et al., 2022).
In 2021, mowing dynamics reveal the least intensive grassland management when compared with the three preceding years. In addition, within this study relatively late first mowing events for large parts of Germany were detected for this year. This is in accordance with weather conditions, as April and May were extraordinarily cold in Germany in 2021 (DWD, 2022). As a consequence, spring plant growth was probably rather late which resulted in later mowing activities.
Schwieder et al. (2021) investigated mowing events in Germany for the years 2017–2020 with S2 and Landsat 8 (L8) data and found relatively constant patterns of mowing frequencies among the years, which is in line with our results. However, they found a smaller number of mowing events in 2018 compared to the other years even though only by a small degree. Similarly to our results, they found higher numbers of mowing events in 2020. The year 2020 was probably favorable regarding vegetation growth and, therefore, grasslands were mown more often. However, as our validation shows, there were also more mowing events detected by the algorithm as the data availability was good in 2020, at least compared to 2018 and 2021 (Figure 4).
Grassland mowing events were detected for the years 2018–2021 by applying an approach by Reinermann et al. (2022) developed for 2019. The resulting F1-Scores between 0.50 and 0.64 are in a similar range compared to previous studies (De Vroey et al., 2021; Schwieder et al., 2021; De Vroey et al., 2022). The accuracy assessment varies between studies and is dependent on the validation dataset and the allowed time period between detected and observed mowing date. Here, the validation dataset was relatively large and exhaustive in that regard that a variety of grasslands distributed among Germany with mowing frequencies between one to six times were included. Further, the validation dataset was based on webcam images and not on satellite data as in previous studies (Kolecka et al., 2018). Validation data independent from satellite imagery has the advantage that it is not influenced by cloud cover and, therefore, not biased towards cloud-free images. In addition, the time period of 7 days between detected and observed mowing date allowed in the presented study is rather strict compared to other studies.
The years 2019 and 2020 showed higher accuracy levels than the years 2018 and 2021. For the year 2018, the validation dataset was much smaller than for the other years (about one fourth in the number of mowing events) which could influence the accuracy assessment. However, the mowing detection in 2018 showed particularly high false positive rates. This could be related to the extremely dry weather conditions which were present in large parts of Germany (Reinermann et al., 2019; DWD, 2020). Stressed vegetation (brown, lower photosynthetic activity) results in lower EVI values and was maybe falsely identified as mown vegetation or the algorithm didn’t work as expected as the vegetation growth after mowing events might have been slower and smaller during these dry conditions. Within 2021, the rate of successfully detected mowing events was comparably small. This is probably related to the smaller amount of available cloud-free data in 2021 compared to the other years (Figure 4). The precision was highest for 2019, which is probably caused as the mowing detection approach was calibrated with data from that year. However, the year 2020 also showed high accuracy rates underlining the transferability of the method to other years which show similar climatic conditions and data availability.
The investigation of the relationship between the mowing frequency and the timing of the first mowing event to climate and topographic variables revealed significant relationships in all cases. However, the number of data points for the regression is relatively high and this potentially influences the level of significance (Rouder et al., 2009). In addition. the correlation is mostly rather low, indicating that although there is a relationship between mowing dynamics and precipitation, temperature, slope or elevation, these parameters are not explaining the mowing dynamics by a large part. The sum of rainfall in 2020 has the highest correlation to the mowing frequency among the investigated parameters, however the slope of the regression line is almost zero. The reason why there were no strong correlations and no linear relationship found between precipitation and mowing dynamics might be that more precipitation favors more intensive grassland use (Smit et al., 2008), but only to a certain point of saturation. The same applies for the other variables, however precipitation seems to be the most important one. The relationships between mowing dynamics and influencing factors might not be linear and probably influence each other. Hence, future research should look into multi-variate relationships of climatic and topographic conditions and mowing dynamics. In addition, grasslands are probably mown when the amount of biomass is considered enough by the farmers. This aspect was not studied so far as we investigated the influence of abiotic conditions on mowing intensity, which, however, essentially influence vegetation growth. Future studies could look into that and analyze the relationship between vegetation growth or quantities of biomass and mowing dynamics.
It can be assumed that for intensive grassland use a general framework of climatic and topographic conditions has to be given. Within the value ranges of this framework, intensive, intermediate and extensive use are possible and the farmer’s decision for one or the other probably depends on other factors (e.g., personal decision, scope of action). An approach to map the environmental conditions which have to be fulfilled for intensive use (Figure 11) looks plausible and reveals areas which fall into the favorable conditions and areas which are probably too cold, too hot, too dry, too wet, too steep or too elevated for intensive grassland use. Grassland biomass usually increases with rising temperature and precipitation levels (Bernhardt-Römermann et al., 2011) and grass growth is probably not sufficient if conditions are rather cold and dry. In addition, intensive grassland use requires the usage of heavy machinery which is not possible when soils are too wet. Steep slopes are unfavorable for intensive grassland use as their treatment using heavy machines is limited. In addition, the organic soil content is probably smaller on steep slopes (Kühnel et al., 2019). High altitudes above sea level might be a disadvantage for intensive grassland use as they are usually more difficult to reach and undergo a shorter vegetation period. Regarding the timing of the first mowing event a clear border is visible as grasslands which are mown before 1st of June occur in regions with an annual mean temperature of at least 8°C in 2020 (Figure 10C). This pattern is probably related to the fact that vegetation onset and growth in spring depends strongly on the temperature (Huang et al., 2020).
Regarding the analysis of mowing intensity on various soil classes, also the availability of water seems to play an important role. Rather wet soils, which are defined by their constant influence of water, like Histosols and Gleysols, show the highest mowing frequency rates in Germany. In contrast, Leptosols show the least intensive grassland usage. These soils are characterized by low permeability rates for roots and therefore might aggravate the availability of water for grassland species. However, very wet soils are unfavorable for intensive grassland use as the usage of heavy machinery needed for mowing activities might be hindered. Therefore, many soils which are characterized by water influence are probably drained for intensive grassland usage. In addition to water availability, the amount of nutrients is determining for grassland growth and, consequently, use intensity. In Germany, grasslands typically occur on areas which are unfavorable for other agricultural crops (Schoof et al., 2020a; 2020b). As a consequence, they are usually not present on highly productive soils. From the soil types which remain for grassland use, in particular Histosols usually contain relatively high rates of soil organic carbon (Eswaran et al., 1993). These conditions are advantageous for plant growth and might be the reason for higher mowing frequencies on these soils. To investigate, whether the availability of water or of soil organic matter are more important, spatially explicit data on drainage and soil SOC (Zepp et al., 2021) for grasslands would be needed.
While topographic and climatic conditions and soil properties seem to shape the framework of potential intensive grassland management, the motivation for farmers to extensively use their grasslands seems to be unrelated to these site conditions. One potential incentive for extensive grassland management might be conservation schemes which result in payments for farmers to compensate potential yield losses. Grasslands which are within Natura 2000 sites show tendencies of more extensive use than grasslands outside of this scheme, regarding the mowing frequency and the timing of the first mowing event. The timing of the first mowing event is ecologically critical as it has a strong impact on plant species composition and on breeding birds. Grasslands for which the first mowing event takes place very early (before 1st of May) are considered as intensively used. For many species a first mowing event after 1st of June is critical–either for reproduction or as feeding source for insect –, therefore, mowing after this date if often coupled to a compensatory payment for the farmer. The conservation scheme of Natura 2000 aims at sustaining habitats. This is not necessarily connected with extensive grassland management, but just implies that the condition of the ecosystem remains qualitatively stable over time. The grassland ecosystem might remain stable even though or particularly because of intermediate (or even intensive) grassland management. In addition, the laws and enforcements are defined by the countries and in the case of Germany, by the single Federal States. Furthermore, every Natura 2000 site has (or should have) an individual management plan which is specifically developed for this ecosystem. A nationwide comparison of restraints and guidelines is therefore difficult (Fischer-Hüftle and Gellermann, 2018).
Despite their large value in providing multiple ecosystem services, extensively used grasslands with high nature value are under threat in Germany as they are intensified or converted to cropland (Bundesamt für Naturschutz, 2020). As the intensification of grasslands aims at increasing yields, grassland ecosystems are often changed to improve plant growth by drainage, (increased) fertilization or irrigation, for example,. As a result, grassland ecosystems might change completely, leading to species loss, increased nitrogen input and potentially irreversible destruction of fens and mires (Kreyling et al., 2021), which are often covered by grasslands (Middleton et al., 2006). According to our findings a certain abiotic framework is needed for intensive grassland use in Germany, which is present in large parts of the country. Well-directed protection mechanisms are needed to guarantee the conservation of extensively used high nature value grasslands in Germany. Otherwise, in the near future many more will be intensified as the pressure on farmers rises due to high demands in meat and dairy products, low profits and negative effects of climate change (Hocquette et al., 2018).
Information on the timing and frequency of mowing events, as generated within this study, is a useful component in the assessment of grassland ecosystem functions. These datasets serve as inputs for ecological, ecosystem service, nutrient flux and yield models, among others. For instance, the incorporation of mowing dates potentially improves carbon, nitrogen and yield modelling within the LandscapeDNDC model (Petersen et al., 2021).
Information on mowing dynamics (timing and frequency of mowing events) is crucial to investigate grassland ecosystem services but mowing dynamics are usually unknown beyond farm-scale in Germany and can be very heterogeneous. Remote sensing enables the multi-annual continuous investigation of grassland characteristics, resulting in estimates of mowing frequency and timing of mowing events. By detecting mowing events with S2 time series we mapped and investigated mowing dynamics for the years 2018–2021 in Germany on 10 m resolution with accuracies (F1-Score) of 0.52 (2018), 0.64 (2019), 0.63 (2020) and 0.50 (2021) with an allowed time difference of 7 days. We found that most grasslands of Germany show extensive or intermediate use (up to three mowing events) with proportions of 45%–56% (extensive) and 42%–51% (intermediate) of the entire grassland area, as detected within the years. Extensively used grasslands are distributed over the entire country and highly intensively used grasslands (up to six mowing events) can be found mostly in southern/south-eastern Germany. These patterns remain relatively the same between the investigated years (2018–2021), but variabilities on smaller scales are visible. Topographic (elevation, slope) and climatic (precipitation, temperature) parameters are not linearly related to mowing dynamics but these parameters provide the environmental framework. According to our findings, in particular the availability of water plays a role for intensive grassland use as regions with high rainfall rates and areas with soil types which are characterized by the influence of water, show higher numbers of mowing events. However, the abiotic conditions only explain the basic conditions. The incentives for farmers to use their grassland extensively or intensively are probably more complex and difficult to measure. Protection mechanisms have probably a large influence on mowing dynamics. However, Natura 2000 sites are not exclusively characterized by extensive grassland use as their goal is to sustain ecosystems and this could also be related to more mowing events per year. In addition to that, personal farmers’ choices, which might be related to tradition, personal preferences or the scope of action, are probably more important than expected and are therefore an important factor in investigating grassland mowing dynamics in Germany.
The original contributions presented in the study are included in the article/Supplementary Material, further inquiries can be directed to the corresponding author.
SR, SA, and CK conceptualized the research; SR did the methodological analysis, prepared and wrote the original draft; SA, UG, TU, and CK reviewed the draft and SR revised and finalized the manuscript. All authors contributed to the article and approved the submitted version.
This research was conducted within the SUSALPS project (phase two and three) funded by the German Federal Ministry for Education and Research (BMBF), Grant Numbers 031B0516F and 031B1067F. This publication was supported by the Open Access Publication Fund of the University of Wuerzburg.
We would like to thank the reviewers for their valuable remarks to improve the paper.
The authors declare that the research was conducted in the absence of any commercial or financial relationships that could be construed as a potential conflict of interest.
All claims expressed in this article are solely those of the authors and do not necessarily represent those of their affiliated organizations, or those of the publisher, the editors and the reviewers. Any product that may be evaluated in this article, or claim that may be made by its manufacturer, is not guaranteed or endorsed by the publisher.
Ali, I., Barrett, B., Cawkwell, F., Green, S., Dwyer, E., and Neumann, M. (2017). Application of repeat-pass TerraSAR-X staring spotlight interferometric coherence to monitor pasture biophysical parameters: Limitations and sensitivity analysis. IEEE J. Sel. Top. Appl. Earth Observations Remote Sens. 10 (7), 3225–3231. doi:10.1109/jstars.2017.2679761
Asam, S., Klein, D., and Dech, S. (2015). Estimation of grassland use intensities based on high spatial resolution LAI time series. ISPRS - Int. Archives Photogrammetry, Remote Sens. Spatial Inf. Sci. XL-7/W3, 285–291. doi:10.5194/isprsarchives-XL-7-W3-285-2015
Barrett, B., Nitze, I., Green, S., and Cawkwell, F. (2014). Assessment of multi-temporal, multi-sensor radar and ancillary spatial data for grasslands monitoring in Ireland using machine learning approaches. Remote Sens. Environ. 152, 109–124. doi:10.1016/j.rse.2014.05.018
Bastos, A., Ciais, P., Friedlingstein, P., Sitch, S., Pongratz, J., Fan, L., et al. (2020). Direct and seasonal legacy effects of the 2018 heat wave and drought on European ecosystem productivity. Sci. Adv. 6 (24), eaba2724. doi:10.1126/sciadv.aba2724
Bastos, A., Orth, R., Reichstein, M., Ciais, P., Viovy, N., Zaehle, S., et al. (2021). Vulnerability of European ecosystems to two compound dry and hot summers in 2018 and 2019. Earth Syst. Dyn. 12, 1015–1035. doi:10.5194/esd-12-1015-2021
Beierkuhnlein, C., Thiel, D., Jentsch, A., Willner, E., and Kreyling, J. (2011). Ecotypes of European grass species respond differently to warming and extreme drought. J. Ecol. 99, 703–713. doi:10.1111/j.1365-2745.2011.01809.x
Bengtsson, J., Bullock, J. M., Egoh, B., Everson, C., Everson, T., O’Connor, T., et al. (2019). Grasslands-more important for ecosystem services than you might think. Ecosphere 10, e02582. doi:10.1002/ecs2.2582
Bernhardt-Römermann, M., Römermann, C., Sperlich, S., and Schmidt, W. (2011). Explaining grassland biomass–the contribution of climate, species and functional diversity depends on fertilization and mowing frequency. J. Appl. Ecol. 48, 1088–1097. doi:10.1111/j.1365-2664.2011.01968.x
Bruns, D., Ipsen, D., and Bohnet, I. (2000). Landscape dynamics in Germany. Landsc. Urban Plan. 47, 143–158. doi:10.1016/S0169-2046(99)00083-3
Bundesamt für Naturschutz (2020). Die Lage der Natur in Deutschland: Ergebnisse von EU-Vogelschutz und FFH-Bericht. Available at: https://www.bfn.de/publikationen/broschuere/lage-der-natur-deutschland (Accessed September 5, 2022).
Bundesanstalt für Geowissenschaften und Rohstoffe (BGR) (2018). Soil map of Germany 1:250,000 (BUEK250).
Buras, A., Rammig, A., and Zang, C. S. (2020). Quantifying impacts of the 2018 drought on European ecosystems in comparison to 2003. Biogeosciences 17 (6), 1655–1672. doi:10.5194/bg-17-1655-2020
Carvalhais, N., Forkel, M., Khomik, M., Bellarby, J., Jung, M., Migliavacca, M., et al. (2014). Global covariation of carbon turnover times with climate in terrestrial ecosystems. Nature 514, 213–217. doi:10.1038/nature13731
Chen, Q., Timmermans, J., Wen, W., and van Bodegom, P. M. (2022). A multi-metric assessment of drought vulnerability across different vegetation types using high resolution remote sensing. Sci. Total Environ. 832, 154970. doi:10.1016/j.scitotenv.2022.154970
Chisté, M. N., Mody, K., Gossner, M. M., Simons, N. K., Köhler, G., Weisser, W. W., et al. (2016). Losers, winners, and opportunists: How grassland land–use intensity affects orthopteran communities. Ecosphere 7, 372. doi:10.1002/ecs2.1545
Copernicus (2016). EU-DEM: v1.1. Available at: http://land.copernicus.eu/pan-european/satellite-derived-products/eu-dem/eu-dem-v1.1/view.
Copernicus (2018). High resolution layer - grassland. Available at: https://land.copernicus.eu/pan-european/high-resolution-layers/grassland/status-maps/grassland-2018.
De Vroey, M., Radoux, J., and Defourny, P. (2021). Grassland mowing detection using sentinel-1 time series: Potential and limitations. Remote Sens. 13, 348. doi:10.3390/rs13030348
De Vroey, M., Vendictis, L., Zavagli, M., Bontemps, S., Heymans, D., Radoux, J., et al. (2022). Mowing detection using Sentinel-1 and Sentinel-2 time series for large scale grassland monitoring. Remote Sens. Environ. 280, 113145. doi:10.1016/j.rse.2022.113145
Dengler, J., Biurrun, I., Boch, S., Dembicz, I., and Török, P. (2020). “Grasslands of the palaearctic biogeographic realm: Introduction and synthesis,” in Encyclopedia of the world’s biomes (Amsterdam: Elsevier), 617–637. doi:10.1016/B978-0-12-409548-9.12432-7
Destatis (2021). Statistisches Bundesamt. Land-und Forstwirtschaft, Fischerei - bodennutzung der Betriebe. Fachserie 3 Reihe 3.1.2.
Drusch, M., Del Bello, U., Carlier, S., Colin, O., Fernandez, V., Gascon, F., et al. (2012). Sentinel-2: ESA’s optical high-resolution mission for GMES operational services. Remote Sens. Environ. 120, 25–36. doi:10.1016/j.rse.2011.11.026
Dusseux, P., Vertès, F., Corpetti, T., Corgne, S., and Hubert-Moy, L. (2014). Agricultural practices in grasslands detected by spatial remote sensing. Environ. Monit. Assess. 186, 8249–8265. doi:10.1007/s10661-014-4001-5
DWD Climate Data Center (CDC) (2018a). Annual grids of monthly averaged daily air temperature (2m) over Germany, v1.0.
DWD Climate Data Center (CDC) (2018b). Annual sum of monthly precipitation grids over Germany, v1.0.
DWD Climate Data Center (CDC) (2023). Multi-annual grids of the begin of the vegetation period in Germany, v0.x.
DWD (2023). DWD Products of the current state of vegetation development. Available at: https://www.dwd.de/DE/klimaumwelt/klimaueberwachung/phaenologie/produkte/produkte_node.html (accessed January 27, 2023).
DWD (2020). Klimastatusbericht deutschland jahr 2018. Available at: https://www.dwd.de/DE/leistungen/klimastatusbericht/publikationen/ksb_2018.
DWD (2022). Klimastatusbericht deutschland jahr 2021. Available at: https://www.dwd.de/DE/leistungen/klimastatusbericht/publikationen/ksb_2021.
Edirisinghe, A., Clark, D., and Waugh, D. (2012). Spatio-temporal modelling of biomass of intensively grazed perennial dairy pastures using multispectral remote sensing. Int. J. Appl. Earth Observation Geoinformation 16, 5–16. doi:10.1016/j.jag.2011.11.006
Edirisinghe, A., Hill, M. J., Donald, G. E., and Hyder, M. (2011). Quantitative mapping of pasture biomass using satellite imagery. Int. J. Remote Sens. 32, 2699–2724. doi:10.1080/01431161003743181
Emadodin, I., Corral, D. E. F., Reinsch, T., Kluß, C., and Taube, F. (2021). Climate change effects on temperate grassland and its implication for forage production: A case study from northern Germany. Agriculture 11 (3), 232. doi:10.3390/agriculture11030232
Eswaran, H., Berg, E., and Reich, P. (1993). Organic carbon in soils of the World. Soil Sci. Soc. Am. J. 57, 192–194. doi:10.2136/sssaj1993.03615995005700010034x
European Environmental Agency (EEA) (2021). Natura 2000 dataset. Available at: https://www.eea.europa.eu/data-and-maps/data/natura-13.
Fischer-Hüftle, P., and Gellermann, M. (2018). Landwirtschaft in Natura 2000-gebieten. Nat. Recht 40, 602–607. doi:10.1007/s10357-018-3398-y
Franke, J., Keuck, V., and Siegert, F. (2012). Assessment of grassland use intensity by remote sensing to support conservation schemes. J. Nat. Conservation 20, 125–134. doi:10.1016/j.jnc.2012.02.001
Gomez-Gimenez, M., Jong, R., Peruta, R. D., Keller, A., and Schaepman, M. E. (2017). Determination of grassland use intensity based on multi-temporal remote sensing data and ecological indicators. Remote Sens. Environ. 198, 126–139. doi:10.1016/j.rse.2017.06.003
Gossner, M. M., Lewinsohn, T. M., Kahl, T., Grassein, F., Boch, S., Prati, D., et al. (2016). Land-use intensification causes multitrophic homogenization of grassland communities. Nature 540, 266–269. doi:10.1038/nature20575
Griffiths, P., Nendel, C., Pickert, J., and Hostert, P. (2020). Towards national-scale characterization of grassland use intensity from integrated Sentinel-2 and Landsat time series. Remote Sens. Environ. 238, 111124. doi:10.1016/j.rse.2019.03.017
Hagolle, O., Huc, M., Desjardins, C., Auer, S., and Richter, R. (2017). Maja algorithm theoretical basis document. doi:10.5281/zenodo.1209633
Hocquette, J.-F., Ellies-Oury, M.-P., Lherm, M., Pineau, C., Deblitz, C., and Farmer, L. (2018). Current situation and future prospects for beef production in Europe - a review. Asian-Australasian J. animal Sci. 31, 1017–1035. doi:10.5713/ajas.18.0196
Holtgrave, A.-K., Röder, N., Ackermann, A., Erasmi, S., and Kleinschmit, B. (2020). Comparing sentinel-1 and -2 data and indices for agricultural land use monitoring. Remote Sens. 12, 2919. doi:10.3390/rs12182919
Huang, Y., Jiang, N., Shen, M., and Guo, L. (2020). Effect of preseason diurnal temperature range on the start of vegetation growing season in the Northern Hemisphere. Ecol. Indic. 112, 106161. doi:10.1016/j.ecolind.2020.106161
Huete, A., Didan, K., Miura, T., Rodriguez, E., Gao, X., and Ferreira, L. (2002). Overview of the radiometric and biophysical performance of the MODIS vegetation indices. Remote Sens. Environ. 83, 195–213. doi:10.1016/S0034-4257(02)00096-2
Imbery, F., Kaspar, F., Friedrich, K., and Plueckhahn, B. (2021). Klimatologischer Rückblick auf 2020: Eines der wärmsten Jahre in Deutschland und Ende des bisher wärmsten Jahrzehnts. Offenbach: Deutscher Wetterdienst - Abteilungen für Klimaüberwachungund Agrarmeteorologie.
Ingrisch, J., Karlowsky, S., Anadon-Rosell, A., Hasibeder, R., König, A., Augusti, A., et al. (2018). Land use alters the drought responses of productivity and CO2 fluxes in mountain grassland. Ecosystems 21, 689–703. doi:10.1007/s10021-017-0178-0
Isbell, F., Craven, D., Connolly, J., Loreau, M., Schmid, B., Beierkuhnlein, C., et al. (2015). Biodiversity increases the resistance of ecosystem productivity to climate extremes. Nature 526, 574–577. doi:10.1038/nature15374
Jungandreas, A., Roilo, S., Strauch, M., Václavík, T., Volk, M., and Cord, A. F. (2022). Response of endangered bird species to land-use changes in an agricultural landscape in Germany. Reg. Environ. Change 22, 19. doi:10.1007/s10113-022-01878-3
Koeppen, W. (1936). “Das geographische system der Klimate,” in Handbuch der Klimatologie. Editors W. Koeppen, and R. Geiger (Berlin: Gebrueder Borntraeger), 1–44.
Kolecka, N., Ginzler, C., Pazur, R., Price, B., and Verburg, P. H. (2018). Regional scale mapping of grassland mowing frequency with sentinel-2 time series. Remote Sens. 10, 1221. doi:10.3390/rs10081221
Kowalski, K., Okujeni, A., Brell, M., and Hostert, P. (2022). Quantifying drought effects in Central European grasslands through regression-based unmixing of intra-annual Sentinel-2 time series. Remote Sens. Environ. 268, 112781. doi:10.1016/j.rse.2021.112781
Kreyling, J., Tanneberger, F., Jansen, F., Linden, S., Aggenbach, C., Blüml, V., et al. (2021). Rewetting does not return drained fen peatlands to their old selves. Nat. Commun. 12, 5693. doi:10.1038/s41467-021-25619-y
Kreyling, J., Wenigmann, M., Beierkuhnlein, C., and Jentsch, A. (2008). Effects of extreme weather events on plant productivity and tissue die-back are modified by community composition. Ecosystems 11, 752–763. doi:10.1007/s10021-008-9157-9
Kühnel, A., Garcia-Franco, N., Wiesmeier, M., Burmeister, J., Hobley, E., Kiese, R., et al. (2019). Controlling factors of carbon dynamics in grassland soils of Bavaria between 1989 and 2016. Agric. Ecosyst. Environ. 280, 118–128. doi:10.1016/j.agee.2019.04.036
Lange, M., Feilhauer, H., Kühn, I., and Doktor, D. (2022). Mapping land-use intensity of grasslands in Germany with machine learning and Sentinel-2 time series. Remote Sens. Environ. 277, 112888. doi:10.1016/j.rse.2022.112888
Le Clec’h, S., Finger, R., Buchmann, N., Gosal, A. S., Hörtnagl, L., Huguenin-Elie, O., et al. (2019). Assessment of spatial variability of multiple ecosystem services in grasslands of different intensities. J. Environ. Manag. 251, 109372. doi:10.1016/j.jenvman.2019.109372
Levers, C., Müller, D., Erb, K., Haberl, H., Jepsen, M. R., Metzger, M. J., et al. (2018). Archetypical patterns and trajectories of land systems in Europe. Reg. Environ. Change 18, 715–732. doi:10.1007/s10113-015-0907-x
Liu, L., Sayer, E. J., Deng, M., Li, P., Liu, W., Wang, X., et al. (2022). The grassland carbon cycle: Mechanisms, responses to global changes, and potential contribution to carbon neutrality. Fundam. Res. 3, 209–218. doi:10.1016/j.fmre.2022.09.028
Lobert, F., Holtgrave, A.-K., Schwieder, M., Pause, M., Vogt, J., Gocht, A., et al. (2021). Mowing event detection in permanent grasslands: Systematic evaluation of input features from Sentinel-1, Sentinel-2, and Landsat 8 time series. Remote Sens. Environ. 267, 112751. doi:10.1016/j.rse.2021.112751
Magiera, A., Feilhauer, H., Waldhardt, R., Wiesmair, M., and Otte, A. (2017). Modelling biomass of mountainous grasslands by including a species composition map. Ecol. Indic. 78, 8–18. doi:10.1016/j.ecolind.2017.02.039
Meyer, H., Reudenbach, C., Hengl, T., Katurji, M., and Nauss, T. (2018). Improving performance of spatio-temporal machine learning models using forward feature selection and target-oriented validation. Environ. Model. Softw. 101, 1–9. doi:10.1016/j.envsoft.2017.12.001
Meynen, E., Schmithüsen, J., Gellert, J., Neef, E., Müller-Miny, H., and Schultze, J. H. (1962). Handbuch der naturräumlichen Gliederung Deutschlands. Bd. 2, 1953–1962. Bad Godesberg: Bundesanst. für Landeskunde u. Raumforschung.
Middleton, B., Grootjans, A., Jensen, K., Venterink, H. O., and Margóczi, K. (2006). “Fen management and research perspectives: An overview,” in Wetlands: Functioning, biodiversity conservation, and restoration ecological studies. M. M Caldwell, G Heldmaier, R. B Jackson, O. L Lange, H. A Mooney, and E.-D Schulze. Editors (Berlin, Heidelberg: Springer Berlin Heidelberg), 247–268. doi:10.1007/978-3-540-33189-6_11
Myrgiotis, V., Smallman, T. L., and Williams, M. (2022). The carbon budget of the managed grasslands of Great Britain – informed by Earth observations. Biogeosciences 19, 4147–4170. doi:10.5194/bg-19-4147-2022
Neyret, M., Fischer, M., Allan, E., Hölzel, N., Klaus, V. H., Kleinebecker, T., et al. (2021). Assessing the impact of grassland management on landscape multifunctionality. Ecosyst. Serv. 52, 101366. doi:10.1016/j.ecoser.2021.101366
Petersen, K., Kraus, D., Calanca, P., Semenov, M. A., Butterbach-Bahl, K., and Kiese, R. (2021). Dynamic simulation of management events for assessing impacts of climate change on pre-alpine grassland productivity. Eur. J. Agron. 128, 126306. doi:10.1016/j.eja.2021.126306
Ploton, P., Mortier, F., Réjou-Méchain, M., Barbier, N., Picard, N., Rossi, V., et al. (2020). Spatial validation reveals poor predictive performance of large-scale ecological mapping models. Nat. Commun. 11, 4540. doi:10.1038/s41467-020-18321-y
Quan, X., He, B., Yebra, M., Yin, C., Liao, Z., Zhang, X., et al. (2017). A radiative transfer model-based method for the estimation of grassland aboveground biomass. Int. J. Appl. Earth Observation Geoinformation 54, 159–168. doi:10.1016/j.jag.2016.10.002
Rakovec, O., Samaniego, L., Hari, V., Markonis, Y., Moravec, V., Thober, S., et al. (2022). The 2018–2020 Multi-year drought sets a new benchmark in Europe. Earth's Future 10 (3), e2021EF002394. doi:10.1029/2021ef002394
Reinermann, S., Asam, S., and Kuenzer, C. (2020). Remote sensing of grassland production and management—a review. Remote Sens. 12, 1949. doi:10.3390/rs12121949
Reinermann, S., Gessner, U., Asam, S., Kuenzer, C., and Dech, S. (2019). The effect of droughts on vegetation condition in Germany: An analysis based on two decades of satellite earth observation time series and crop yield statistics. Remote Sens. 11, 1783. doi:10.3390/rs11151783
Reinermann, S., Gessner, U., Asam, S., Ullmann, T., Schucknecht, A., and Kuenzer, C. (2022). Detection of grassland mowing events for Germany by combining sentinel-1 and sentinel-2 time series. Remote Sens. 14, 1647. doi:10.3390/rs14071647
Rouder, J. N., Speckman, P. L., Sun, D., Morey, R. D., and Iverson, G. (2009). Bayesian t tests for accepting and rejecting the null hypothesis. Psychonomic Bull. Rev. 16, 225–237. doi:10.3758/PBR.16.2.225
Savitzky, A., and Golay, M. J. E. (1964). Smoothing and differentiation of data by simplified least squares procedures. Anal. Chem. 36, 1627–1639. doi:10.1021/ac60214a047
Schwieder, M., Wesemeyer, M., Frantz, D., Pfoch, K., Erasmi, S., Pickert, J., et al. (2021). Mapping grassland mowing events across Germany based on combined Sentinel-2 and Landsat 8 time series. Remote Sens. Environ. 9, 112795. doi:10.1016/j.rse.2021.112795
N. Schoof, R. Luick, A. Ackermann, S. Baum, H. Böhner, and N. Röder Editors (2020a). Auswirkungen der neuen Rahmenbedingungen der Gemeinsamen Agrarpolitik auf die Grünland-bezogene Biodiversität. 2. Auflage (Bonn - Bad Godesberg: Bundesamt für Naturschutz).
N. Schoof, R. Luick, G. Beaufoy, G. Jones, P. Einarsson, and J. Ruiz Editors (2020b). Grünlandschutz in Deutschland: Treiber der Biodiversität, Einfluss von Agrarumwelt-und Klimamaßnahmen, Ordnungsrecht, Molkereiwirtschaft und Auswirkungen der Klima-und Energiepolitik. 2. Auflage (Bonn - Bad Godesberg: Bundesamt für Naturschutz).
Smit, H. J., Metzger, M. J., and Ewert, F. (2008). Spatial distribution of grassland productivity and land use in Europe. Agric. Syst. 98, 208–219. doi:10.1016/j.agsy.2008.07.004
Socher, S. A., Prati, D., Boch, S., Müller, J., Klaus, V. H., Hölzel, N., et al. (2012). Direct and productivity-mediated indirect effects of fertilization, mowing and grazing on grassland species richness. J. Ecol. 100, 1391–1399. doi:10.1111/j.1365-2745.2012.02020.x
Tamm, T., Zalite, K., Voormansik, K., and Talgre, L. (2016). Relating Sentinel-1 interferometric coherence to mowing events on grasslands. Remote Sens. 8, 802. doi:10.3390/rs8100802
Taravat, A., Wagner, M. P., and Oppelt, N. (2019). Automatic grassland cutting status detection in the context of spatiotemporal sentinel-1 imagery analysis and artificial neural networks. Remote Sens. 11, 711. doi:10.3390/rs11060711
Voormansik, K., Jagdhuber, T., Olesk, A., Hajnsek, I., and Papathanassiou, K. P. (2013). Towards a detection of grassland cutting practices with dual polarimetric TerraSAR-X data. Int. J. Remote Sens. 34, 8081–8103. doi:10.1080/01431161.2013.829593
Voormansik, K., Zalite, K., Sünter, I., Tamm, T., Koppel, K., Verro, T., et al. (2020). Separability of mowing and ploughing events on short temporal baseline sentinel-1 coherence time series. Remote Sens. 12, 3784. doi:10.3390/rs12223784
Wang, Y., Wu, G., Deng, L., Tang, Z., Wang, K., Sun, W., et al. (2017). Prediction of aboveground grassland biomass on the Loess Plateau, China, using a random forest algorithm. Sci. Rep. 7, 6940. doi:10.1038/s41598-017-07197-6
Ward, S. E., Smart, S. M., Quirk, H., Tallowin, J. R. B., Mortimer, S. R., Shiel, R. S., et al. (2016). Legacy effects of grassland management on soil carbon to depth. Glob. Change Biol. 22, 2929–2938. doi:10.1111/gcb.13246
White, R. P., Murray, S., and Rohweder, M. (2000). Pilot analysis of global ecosystems - grassland ecosystems. Washington DC: World Resources Institute.
Wolff, S., Hüttel, S., Nendel, C., and Lakes, T. (2021). Agricultural landscapes in Brandenburg, Germany: An analysis of characteristics and spatial patterns. Int. J. Environ. Res. 15, 487–507. doi:10.1007/s41742-021-00328-y
Yin, G., Li, A., Wu, C., Wang, J., Xie, Q., Zhang, Z., et al. (2018). Seamless upscaling of the field-measured grassland aboveground biomass based on Gaussian process regression and gap-filled Landsat 8 OLI reflectance. Int. J. Geo-Information 7, 242. doi:10.3390/ijgi7070242
Zeng, N., Ren, X., He, H., Zhang, L., Zhao, D., Ge, R., et al. (2019). Estimating grassland aboveground biomass on the Tibetan Plateau using a random forest algorithm. Ecol. Indic. 102, 479–487. doi:10.1016/j.ecolind.2019.02.023
Keywords: remote sensing, Sentinel-2, time series, cutting, management, pasture, meadow, Earth observation
Citation: Reinermann S, Asam S, Gessner U, Ullmann T and Kuenzer C (2023) Multi-annual grassland mowing dynamics in Germany: spatio-temporal patterns and the influence of climate, topographic and socio-political conditions. Front. Environ. Sci. 11:1040551. doi: 10.3389/fenvs.2023.1040551
Received: 12 September 2022; Accepted: 07 June 2023;
Published: 20 June 2023.
Edited by:
Jie Wang, China Agricultural University, ChinaReviewed by:
Ning Chen, Lanzhou University, ChinaCopyright © 2023 Reinermann, Asam, Gessner, Ullmann and Kuenzer. This is an open-access article distributed under the terms of the Creative Commons Attribution License (CC BY). The use, distribution or reproduction in other forums is permitted, provided the original author(s) and the copyright owner(s) are credited and that the original publication in this journal is cited, in accordance with accepted academic practice. No use, distribution or reproduction is permitted which does not comply with these terms.
*Correspondence: Sophie Reinermann, c29waGllLnJlaW5lcm1hbm5AZGxyLmRl
Disclaimer: All claims expressed in this article are solely those of the authors and do not necessarily represent those of their affiliated organizations, or those of the publisher, the editors and the reviewers. Any product that may be evaluated in this article or claim that may be made by its manufacturer is not guaranteed or endorsed by the publisher.
Research integrity at Frontiers
Learn more about the work of our research integrity team to safeguard the quality of each article we publish.