 Matthew D. Sweitzer
 Thushara Gunda
 Jonathan M. Gilligan
- 1Sandia National Laboratories, Albuquerque, NM, United States
- 2Department of Earth and Environmental Sciences, Vanderbilt University, Nashville, TN, United States
Sustainable use of water resources continues to be a challenge across the globe. This is in part due to the complex set of physical and social behaviors that interact to influence water management from local to global scales. Analyses of water resources have been conducted using a variety of techniques, including qualitative evaluations of media narratives. This study aims to augment these methods by leveraging computational and quantitative techniques from the social sciences focused on text analyses. Specifically, we use natural language processing methods to investigate a large corpus (approx. 1.8M) of newspaper articles spanning approximately 35 years (1982–2017) for insights into human-nature interactions with water. Focusing on local and regional United States publications, our analysis demonstrates important dynamics in water-related dialogue about drinking water and pollution to other critical infrastructures, such as energy, across different parts of the country. Our assessment, which looks at water as a system, also highlights key actors and sentiments surrounding water. Extending these analytical methods could help us further improve our understanding of the complex roles of water in current society that should be considered in emerging activities to mitigate and respond to resource conflicts and climate change.
1 Introduction
Sustainable use of water resources is a global challenge. Various regions across the world are currently experiencing water scarcity, including parts of Asia, Africa, the Americas, and Australia (Mekonnen and Hoekstra, 2016). Technological solutions focused on desalination and water reuse have been proposed as one way to address global needs (Gude, 2017). However, water resources are governed by a complex set of interactions, necessitating a coupled natural and human (CNH) systems approach to ensure water security (Srinivasan et al., 2017). CNH approaches will become increasingly critical for future solutions as we face unprecedented stresses from shifting climate patterns, population growth, and urbanization (Doeffinger and Hall, 2020).
Social sciences research has provided invaluable insights into some of the dynamics between the social and physical aspects of the CNH system of water. For example, case studies have identified that water use is not only a function of water availability, but also of economic development, land use, governance, and societal preferences of certain technologies (Carey et al., 2014). Researchers have also identified that the economic impacts of water extend beyond a traditional valuation of water as a material substance to the consideration of values and non-market exchanges (Beresford, 2020). Studies have also highlighted how social dynamics can vary significantly between regions and at different scales. For example, regional differences have been observed for a range of individual behaviors, from acceptance of recycled water for drinking purposes in certain countries (Wester et al., 2016) to water conservation within cities (Hess et al., 2017). Geographic differences in water-related behaviors have been attributed to the relative “visibility” of water issues within communities, wherein visibility can be gained through either physical proximity to bodies of water or the prevalence of discourse among public officials and within media sources (Brown, 2017; Quesnel and Ajami, 2017).
This study focuses on evaluation of media narratives, which have been widely recognized as important sources for generating insights into societal values because news coverage not only reflects public opinion, but also influences beliefs and behaviors (Quesnel and Ajami, 2017). This is known as the “agenda setting” function of news media (Dearing et al., 1996; McCombs, 2005; McCombs and Funk, 2011). Accordingly, analyses of media coverage on water resources have been undertaken by numerous researchers aiming to improve our understanding of the frequency and nature of water discourses within newspaper articles. For example, a longitudinal evaluation of the Three Gorges Dam Project in China identified that social and environmental concerns dominated in national newspapers, with a generally negative tone present throughout the discourse (Wu et al., 2018). Researchers have also mined newspapers dating back multiple decades for information about impacts from historical droughts in Ireland (Murphy et al., 2017) as well as to understand the evolution of narrative frames from development-driven to sustainability-oriented in Australia (Wei et al., 2015). Additionally, researchers have compared narrative frames across news sources, identifying that economic frames appear more frequently in agricultural publications, whereas policy frames were more prevalent in mainstream publications (Dobelbower, 2018). Newspaper coverage has also been evaluated as a proxy for understanding political exposure, which can serve as a driver for water management transitions (e.g., in urban regions, Treuer et al., 2017). Although these media studies have increased our understanding of some human-nature interactions, they have predominantly utilized manual evaluation of content and either tend to focus on a particular region or specific aspects of water resources (Murphy et al., 2014; Wei et al., 2015; Treuer et al., 2017; Tunney, 2017). Some of the authors have started to introduce more computational methods, such as named entity recognition (NER) and network-based methods to characterize variations between water management structures across regions (Murphy et al., 2014). This study extends these approaches to consider the broader discourse surrounding water resources using computational social science methods.
Specifically, we leverage recent advancements in natural language processing (NLP) to characterize the diverse ways (i.e., themes) that water resources are discussed within approximately 1.8 million articles sourced from local and regional newspapers across the United States. We focus on newspapers for two reasons: 1) they serve as a key source of information and 2) demonstrated correlations to actions stemming from newspaper narratives. Despite the increasingly prevalent role of social media as a source of news, a majority of Americans still obtain scientific news from media outlets, like their local newspapers (Funk et al., 2017). Further, when compared to other sources, newspapers—particularly those that are distributed to a small, local audience—demonstrate a strong correlation between coverage and public action when it comes to water issues (Quesnel and Ajami, 2017). In addition to general themes, we also consider important patterns across regions and time, key actors (i.e., persons, government entities, or organizations), and sentiments that appear within the published articles for select themes. The findings from this work increase our understanding of the salience of water issues that should be considered when developing solutions for water stress that will be sustainable into the future.
2 Methods
This study uses a large (∼1.8 million articles) text dataset, or corpus, of newspaper articles that we downloaded from LexisNexis©. We derived our methods from a class of social scientific methods called NLP, which leverage computational tools and linguistic features of text data, such as word co-occurrence, parts of speech, and comparisons against pre-assembled dictionaries of words to make sense of large corpora. Specifically, we utilized topic modeling, NER, and sentiment analysis methods to filter and analyze the water newspaper corpus. All analyses were conducted using R, Python, and Linguistic Inquiry and Word Count (LIWC) software. Details about how this corpus was processed and analyzed are captured in the following subsections.
2.1 Data collection and processing
We constructed the initial corpus of articles (containing 1,819,490 articles) by mining the LexisNexis© database of local and regional United States newspapers for any article that contained the word “water” in the text. At the time of the data collection (December 2017), the database contained 37 news sources across 34 states in the United States (Table 1). The collected articles were published between 1 July 1982 and 15 December 2017, with the number of articles for each newspaper varying due to the different coverage periods within LexisNexis (see Table 1 for specific coverage periods of each source; Supplementary Figure S1 illustrates the variation in publication date frequency across the corpus). This initial dataset was converted from the original xml files into R data frames with relevant information—headline, byline, content, date, source, and section—extracted into separate columns; minor processing steps such as cleaning up text formatting (e.g., removing html tags) and removing duplicate entries were also conducted on the data.
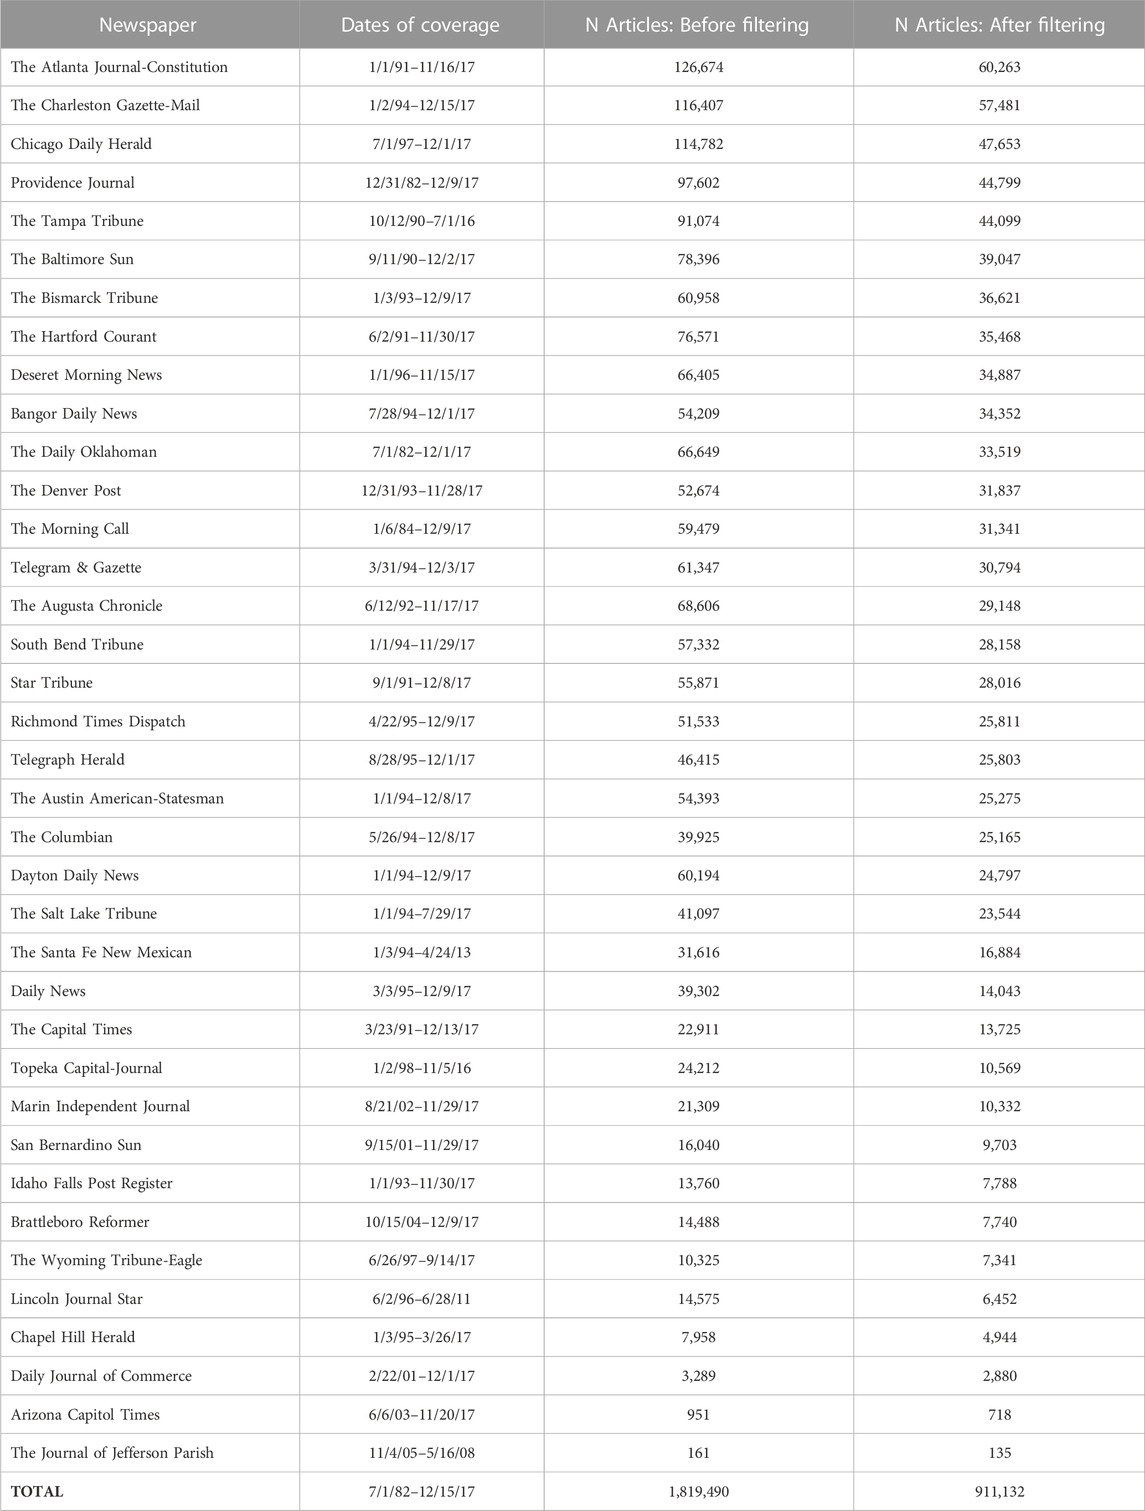
TABLE 1. Summary of coverage dates and article counts (N) of newspapers analyzed for this study.
2.2 Structural topic modeling
The word “water” can be used in various contexts, from discussing droughts and hurricanes to water quality issues and transportation. Likewise, “water” is often used in a way that does not refer to the natural resource. For example, a manual review of sampled articles revealed that there were metaphorical uses of the term “water” (e.g., “troubled water of Congress”) or “water” was used in the description of crimes (“body found near the water”). One NLP method that can assist with the identification of an article’s subject matter, both for determining relevance to the study and for identifying subtopics within relevant material, is topic modeling. Broadly, this class of methods uses the co-occurrence of words across documents to group them together on similar subject matter. Topic models have been used to understand text patterns in diverse fields, from sociology (DiMaggio et al., 2013) to law (Ruhl et al., 2018) as well as other environmental domains (Benites-Lazaro et al., 2018).
Multiple algorithms can be used for topic modeling. For example, latent Dirichlet allocation (LDA) is a commonly-used unsupervised method that performs clustering analysis over a document-term matrix to assign each document to a specific topic. For this study, we elected to use structural topic modeling (STM), which offers a similar approach to LDA, but allows for documents to be composed of multiple topics (i.e., mixture model). Furthermore, STM allows for the specification of topic covariates in the form of document metadata (Roberts et al., 2014; Roberts et al., 2018). That is, if the analyst expects that the topics may covary with the author of a document (as an example), STMs can treat this information as an additional weak signal of that document’s topic(s) alongside the co-occurrence of words with other documents. In this way, STMs can be considered a semi-supervised machine learning approach to topic modeling. We expected the topics in our corpus of ∼1.8 M articles to systematically vary between different sources (newspapers) and over time, reflecting, for example, changes in the framing of priorities around climate change-related issues. So we used both the source (i.e., newspaper name) and the date of publication of the article as covariates in the STM executions to account for the underlying topic structure across articles.
When estimating STMs, researcher(s) must specify the number of topics k) to be used for grouping documents by the model. The stm package in R includes two methods to help researchers identify an appropriate number of topics for the model (Roberts et al., 2018). The first, called searchk, runs a series of “mini” models over each value in a range and reports back a number of descriptive statistics, such as semantic coherence and exclusivity. Semantic coherence refers to the likelihood that each topic contains words that occur together in a document (Mimno et al., 2011; Roberts et al., 2014), while exclusivity refers to the likelihood that the words in one topic are unlikely to occur as words in a different topic (Roberts et al., 2014). To the extent that a certain k-value produces a model wherein each topic has high semantic coherence and exclusivity, that model more clearly delineates differences between topics, and the results are therefore more interpretable by the researcher. Differences in these statistics can be plotted against all evaluated values of k and interpreted (in a similar manner to a scree plot in principle component analysis) to identify the best fitting k-value. Another method provided by the stm package is to use a non-deterministic algorithm to identify that appropriate value (see Mimno et al., 2011 for more information). However, both of these tools quickly become computationally intractable with large sample sizes, and so in cases with sufficiently large corpora that need to be filtered first, it may be advantageous to simply specify a large enough k number (e.g., 100) to identify specific topics at the filtering stage.
Once an STM is estimated, the output of the model identifies the proportion of each document which corresponds to each of the modeled topics. Because STMs are mixture models, each document may pertain to one or multiple topics—the proportions (or topic scores) sum to one across all topics for each document. Each topic is also associated with a set of words, called FREX words, which are words ordered by both their frequency within the group of documents pertaining to that topic and relative exclusivity to that group. Specifically, a word’s FREX score within the topic is given by the following equation:
where F is the word’s frequency score from the empirical cumulative density function of the word within its topic distribution; E represents the word’s exclusivity score found by column-normalizing the beta matrix, or the matrix of word-by-topic probabilities; and w is a weight used to favor a word’s frequency score (closer to 1) or exclusivity score (closer to 0) in the calculation. Because we had no a priori reason to favor frequency or exclusivity, we opted to set this weight at 0.5 when interpreting the output of both STMs. For a given topic, the FREX words can then be interpreted by the researcher to identify the subject matter of the topics, and thereby the content of groups of documents associated with those topics. In this study, two of the authors independently coded each topic to generate labels and then conferred on a final label. In instances where the two authors disagreed or failed to determine a label for the topic, we read through some of the highest scoring articles (i.e., the highest topic scores) to further evaluate that topic’s subject matter. These topic scores are found in the theta θ) matrix of the STM output, or the matrix of document (rows) by topic (columns) in which cell values equate to the proportion of the document which pertains to the topic (rows sum to 1).
We leverage STMs to both: 1) filter the initial corpus of 1.8 M articles down to those articles which refer to water as a natural resource (for examples of this approach, see also Gao et al., 2013; Roberts et al., 2016) and 2) to identify subject matter and trends within the filtered corpus. The first STM used k = 100 to elucidate specific topics while avoiding the computational complexity of the aforementioned topic number identification methods. Water-related topics were identified by analyzing the FREX words as well as correlations between topics, specifically using dendrograms and spinglass community detection methods (more information in Section 2.3). We generated a list of water-relevant topics and retained those articles that included any of these topics among their top three topic scores. Specifically, if any of the water-relevant listed topics appeared among an article’s top three scores across the corresponding row in the θ matrix, that article was retained for further analysis. Once the corpus was filtered for water-related topics, the STM was executed a second time to generate coherent topics of interest. For the second STM implementation, the number of topics was identified using the searchk procedure. Akin to scree plots for principal component analysis, a plot of semantic coherence for different topic numbers was used to inform the optimal number of topics for categorizing the corpus content (Roberts et al., 2018). Prior to running either STM, we converted all text to lower-case and removed so-called “stop words,” or words such as “the” or “of” which convey little meaning within the text and would produce a greater degree of similarity between two otherwise disparate texts. The execution of the STM algorithm took approximately 1 week of computational time, on a computer running an Intel i7-7820 × 16-thread CPU with 64 gigabytes of random access memory (RAM).
2.3 Topic evaluations
We analyzed the topics from the second STM using multiple methods, including patterns across geographical space and time, topic correlations, named entities, and sentiment analysis. Patterns across space and time were evaluated using the built-in function estimateEffects in the stm package (Roberts et al., 2018). This function allows researchers to plot changes in a topic’s prevalence, or relative frequency, over various values of the specified covariates. Since we used source (which is tied geographically to the city in which the newspaper is published) and publication dates as topic covariates in our STMs, we can evaluate how each topic becomes more or less common among all articles over changes in these same article metadata. Further, because estimateEffects leverages the proportion of the corpus, rather than the raw number of articles, this method both addresses multi-topicality of articles and variations in the frequency of publication dates over time in our corpus (see Supplementary Figure S1).
We analyzed topic correlations, or the co-occurrence of topics across documents, using two methods: dendrograms and community detection methods. These methods allow researchers to identify “metatopics”, or higher-order topics formed by grouping together STM topics by similar subjective or objective content similarity. Both methods leverage the θ matrix of the STM output, described above. The dendrogram approach converts the θ matrix to a topic-topic correlation matrix that serves as the basis for a single Euclidean distance measure between each pair of topics representing the degree of similarity with which they correlate with all other topics. These distances can then be plotted using a dendrogram visualization, which depicts hierarchical relationships among items using a tree-like structure of “limbs” and “branches.” Used often in phylogenics, this graph structure plots topics that co-occur together closer to one another in the structure. We also looked at the relationships between topics using network analysis; specifically, the topic-topic correlation matrix described above was converted into a network structure where vertices represent topics and the edges between them are weighed by the correlation coefficient of those two topics across all documents in the corpus. Using community detection algorithms, clusters of topics can then be identified wherein edge weights are stronger between intra-cluster topics compared to inter-cluster edge weights (De Arruda et al., 2016; Farrell, 2016; Bayer et al., 2022).
We further evaluated content within topics to understand key entities within them using NER, which has been used to understand actors in newspaper articles (e.g., Newman et al., 2006) as well as water management in general (e.g., Murphy et al., 2014). This NLP method identifies entities, such as persons, organizations, or geo-political institutions, using a parts-of-speech parsing of the text. In particular, pre-trained machine learning models are used to separate and distinguish many different types of proper nouns from the rest of the text. For this analysis, we utilized the built-in model called “en_core_web_lg,” within the spacyr package in R, and its corresponding Python library spaCy, to recognize named entities. The “en_core_web_lg” model was trained on an English-language corpus of newspapers, blogs, and other similar media (ver. 3.4.0) and is among the best performing pre-trained models available from the software package for NER (precision: 0.86; recall: 0.85; F-score: 0.86). For the NER (and sentiment) analysis, only articles that contained the highest fit score in the θ matrix for topics of interest were evaluated.
Finally, we performed sentiment analysis to understand the use of affective language to describe each of the topics. Sentiment analysis methods commonly leverage dictionaries of affective terms (e.g., “like”, “hate”, “useless”, “advantageous”, etc.), which have been validated in social-psychological studies of affective communication. The specific calculation of a sentiment score differs between software, dictionaries, and methods, but in general there are two approaches: document-level proportions, which estimate the proportion of a document associated with a certain sentiment (e.g., “anxiety” or “elation”, or more generally “positive” and “negative”), and sentence-level analyses, which attempt to analyze the sentiment expressed in each sentence of a document; sentence-level analyses may be later aggregated to the document-level. For this analysis, we leveraged the LIWC software to apply document-level proportion analyses. Sentiment analyses can be sensitive to the specific dictionaries used, therefore using multiple dictionaries to calculate document-level proportions of both positive and negative affective words helps increase the confidence of our findings. We leveraged both generally positive and generally negative emotions sourced from four dictionaries: LIWC’s commonly-used base dictionaries (one positive and one negative) and Loughran and McDonald’s 2011 lexicon (one positive and one negative).
3 Results
3.1 First topic model for filtering
We chose k = 100 for our first STM implementation. Upon completion of the model estimation, the top five scoring FREX words were evaluated (see Eq. 1) to assign a single label for each topic. We created an initial list of water-related topics that were further evaluated for clusters using dengrogram (Supplementary Figure S2) and network-based community detection (Supplementary Figure S3). We used clustering-based approaches, which identify combinations of topics that occur more frequently together, to verify selected topics as well as identify additional topics that may be related to water resources. In total, we identified 23 of the 100 topics as being relevant to water resources in the first STM—21 topics were part of the initial list and two topics were added after the clustering analysis.
These 23 topics generally captured content related to natural disasters, weather, energy, food, and related legislation and regulations. Additional details, including the FREX and highest probability words, are provided in Supplementary Table S1. Although certain topics were closely correlated to those noted above, they were excluded because they were too broad in scope compared to other water-relevant issues. For example, topic 2 is closely related to topics 52, 68, and others in the dendrogram (Supplementary Figure S2), but this topic was characterized by FREX words that were general in nature (e.g., “beautiful” and “views”). While it is possible that water resources could be contained in such articles, our review indicated that other topics relating to indigenous communities and natural resources are much more likely to cover ecological and sustainability issues pertaining to water resources. The 23 selected topics occurred in the top 3 topic scores for N = 911, 132 articles, or 50.08% of the original dataset; the number of articles from each source for this filtered corpus appear in the right-most column of Table 1.
3.2 Second topic model for water resources
The second STM allowed for the identification of subthemes within water resource news articles. For the smaller, filtered corpus of
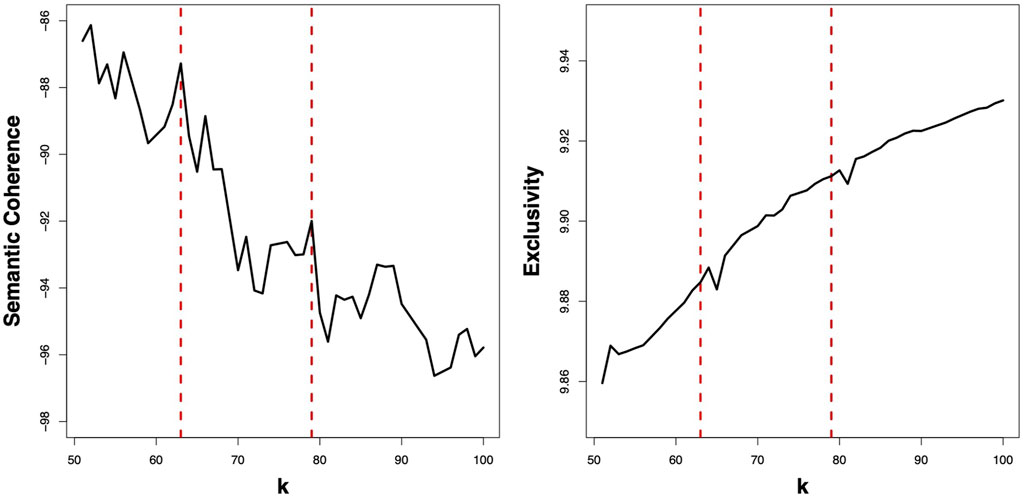
FIGURE 1. Diagnostic statistics from the searchK procedure (k = 51:100). Similar to a scree plot in principal component analysis, “elbows” in the trend lines indicate good-fitting k values. Dashed red lines indicate the two models that were further evaluated. The authors chose k =79 due to higher interpretability.
Figure 2 shows each of the 79 topics in order of their prevalence (i.e., column means of the θ matrix) in the filtered water resources corpus. In evaluating the FREX words of each topic, we assigned a topic label in a similar manner to the first STM. Unsurprisingly, some of the most frequent topics capture general English terms (e.g., topic 54) or business activities (e.g., topics 75 and 52). However, a number of topics pertained to specific subtopics related to water resources, ranging from natural disasters (e.g., fires) to sewers and beaches. We selected a few topics of interest to delve deeper into; these focused on drinking water (topic 19), contaminants (topic 29), water-borne diseases such as e-coli and legionnaires disease (topic 48), oil and gas (topic 49), and renewables (topic 69). Because of the close relationship between contaminants and diseases, these two topics are referred together as “pollutants”. Similarly, topics 49 and 69 will be referred together as “energy production.”
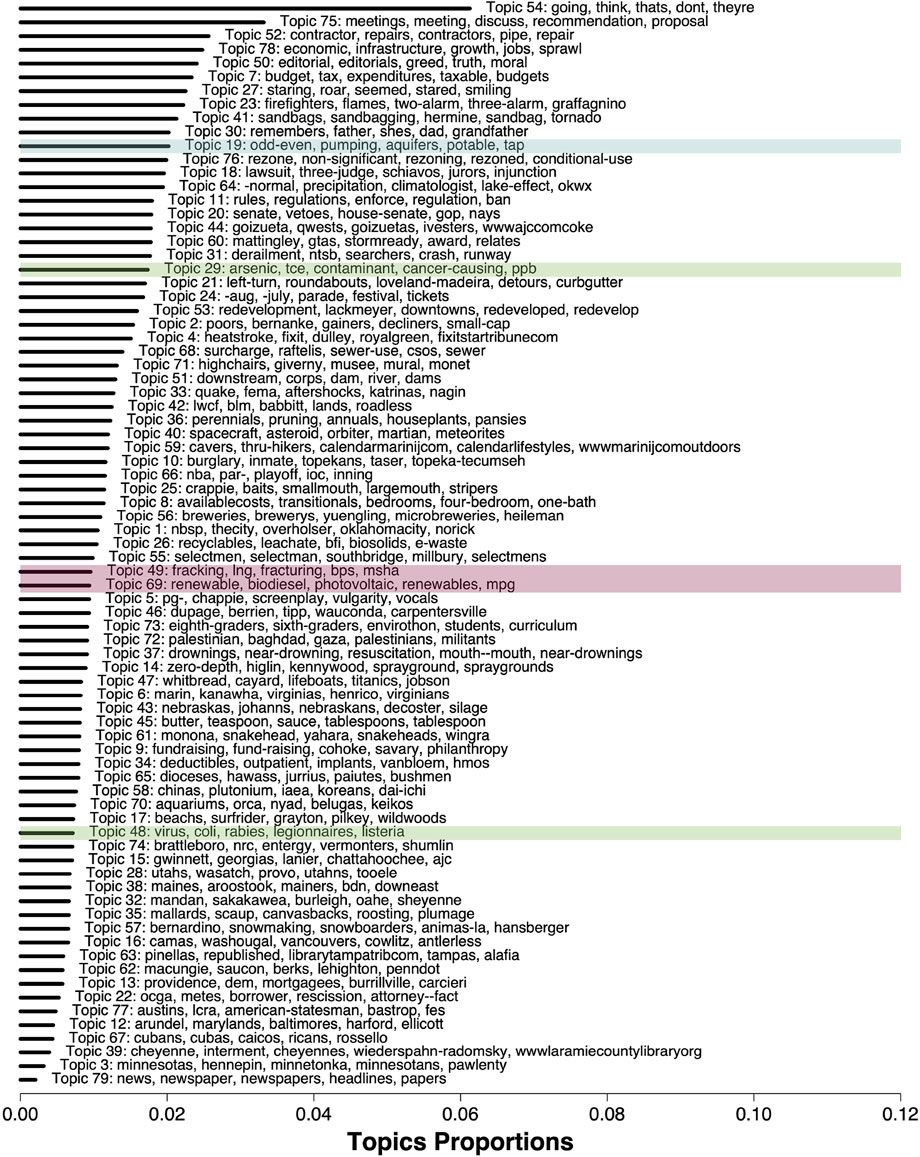
FIGURE 2. Topics from second STM implementation (k =79 topics) ordered by prevalence. Length of the line indicates topic proportions within the filtered corpus. Each topic is labeled by the topic number and associated top 5 FREX words shown. Topics of interest in this study are highlighted in blue (drinking water), green (pollutants), and red (energy production).
As shown in Figure 2, drinking water is the 11th most common topic among the 79 water resource topics, representing
3.3 Topic evaluations
This section delves more deeply into geospatial and temporal variability in the prevalence of drinking water, pollutants, and energy production topics. The named entities and sentiments expressed in the articles pertaining to these topics are also summarized.
3.3.1 Topic co-occurrence
Figure 3 shows the dengrogram of topic co-occurence relationships in the water-related corpus. As the figure indicates, topics 19, 29, 49, and 69 all appear within the same “branch” of the dendrogram, indicating that they are closely related in the corpus. This could occur both when two or more topics appear frequently together in the same articles, or when two topics use similar words to describe the different issues at play. Notably, the two energy production topics and the chemical contaminants topic all appear right next to each other in the dendrogram, along with topic 74—a topic about nuclear energy that contains the FREX words “nrc” (short for Nuclear Regulatory Commission) and “entergy”, a power company that also operates four nuclear power facilities. Other topics in this branch include “waste leaching into groundwater” (26), “regulation” (11), and “judicial proceedings” (18). Taken together, these relationships suggest that four of our topics of interest—drinking water, contaminants, and both energy production topics—are often discussed in tandem with harmful environmental effects, regulations that are intended to mitigate such effects, and lawsuits brought when those regulations are violated. Topic 48 (water-borne diseases), on the other hand, appears to be quite distant in the dendrogram from the other four topics of interest. Neighboring topics near topic 48 pertain to space travel (40), heat stroke (4), and household activities such as planting (36) and cooking (45). This indicates that newspaper articles about water-borne diseases are likely more scientific in nature compared to topic 29 regarding contaminants.
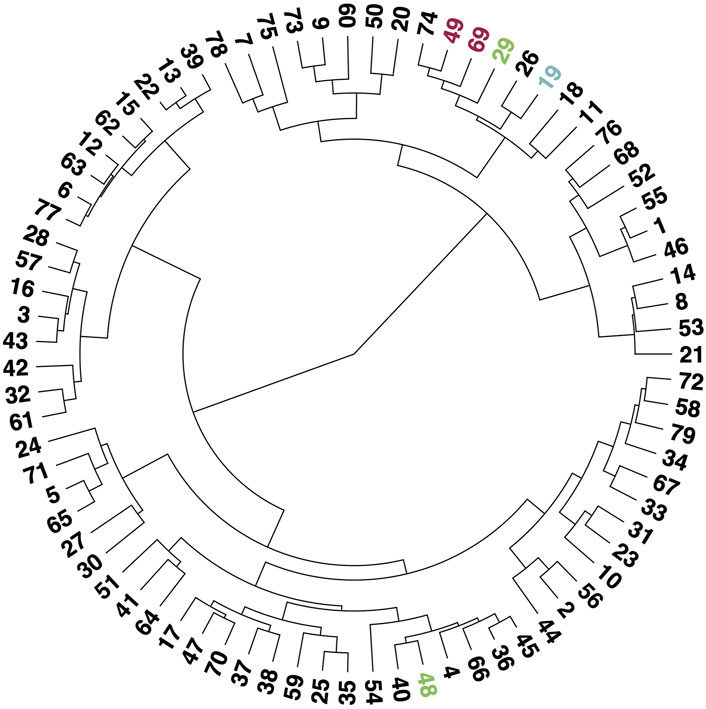
FIGURE 3. Dendrogram of topic correlations for the filtered corpus. Numbers indicate associated topic numbers from the second STM implementation for k =79. Topic of interest that are analyzed further in this study are colored in blue (drinking water), green (pollutants), and red (energy production).
3.3.2 Geospatial variation in prevalence
We then used the estimateEffects function to assess differences between sources (i.e., newspaper publications) in the frequency with which their articles cover the different topics of interest. Figure 4 shows each of the metatopic coverages mapped across the United States; sources indicated in orange cover that metatopic frequently, while sources indicated in purple cover that metatopic infrequently, relative to other sources in the dataset.
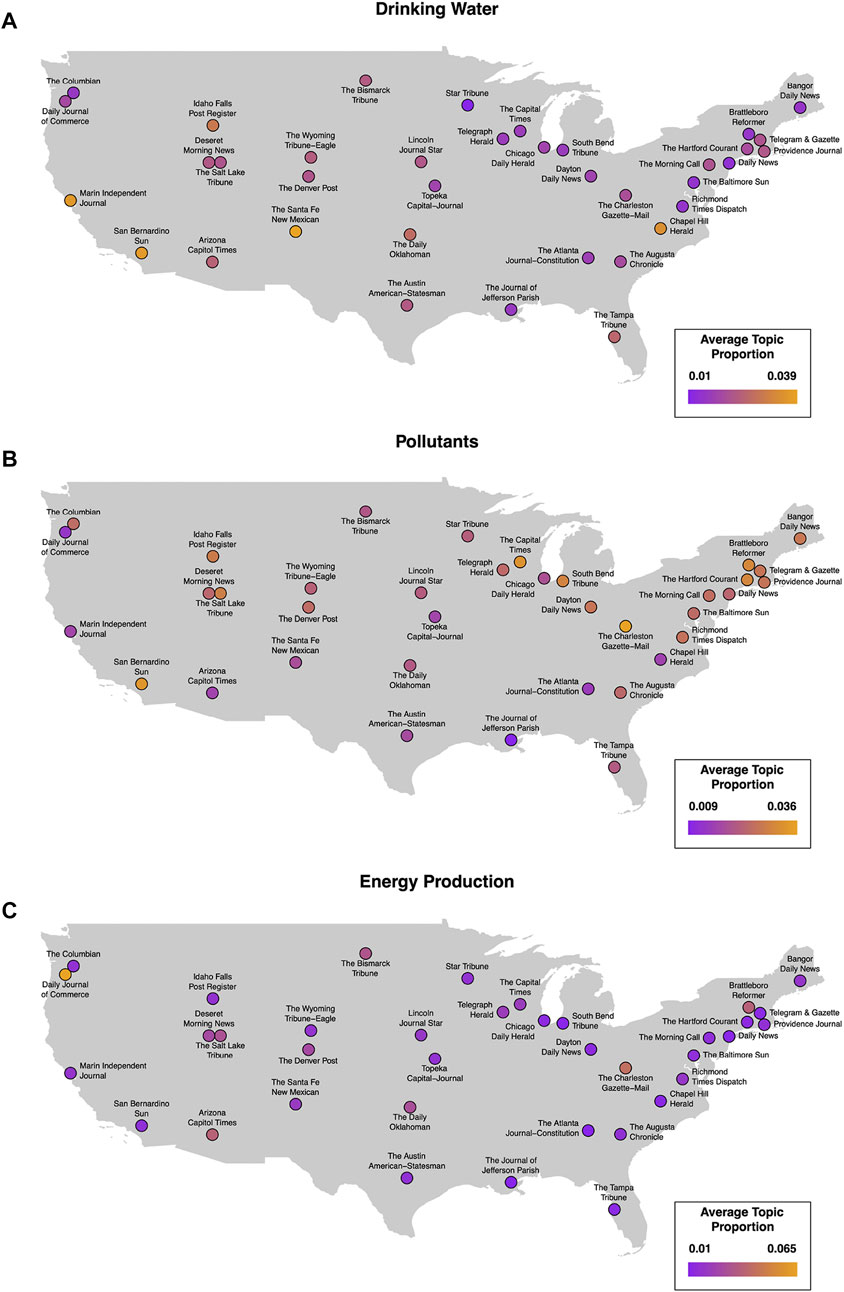
FIGURE 4. Geographic distribution of coverage for topics of interest. Points on the maps represent the location of each publication’s headquarters. The colors of the points represent the proportion of all water resources-related text (i.e., filtered corpus) corresponding to drinking water (A), pollutants (B), and energy production (C).
Drinking water, the most prevalent of our topics of interest, appears more frequently in newspaper articles across the western part of the country compared to newspapers published in the midwest or along the Atlantic Coast. A couple of notable exceptions are the Pacific Northwest region, which had relatively little coverage in the west, and the Chapel Hill Herald in North Carolina, which published articles on drinking water at nearly the same rate as the California- and New Mexico-based sources.
Pollutants, both chemical contaminants and water-borne diseases, appear in newspaper articles throughout the United States, excluding the southeast, central, and far western regions of the country. In contrast, energy production appears to be a more highly-concentrated metatopic, appearing most frequently in articles published by the Daily Journal of Commerce in Portland, Oregon. Additionally, the Charleston Gazette-Mail in West Virginia and the Daily Oklahoman in Oklahoma City, OK both write more frequently on water’s use in energy production than the average source in our sample.
3.3.3 Temporal variation in prevalence
Figure 5 shows how coverage of each of our topics of interest varies in frequency over our period of data collection from 1982 to 2017. These graphs depict a rolling average and confidence interval for each topic; the large confidence interval on the left-hand side of every plot is likely attributable to sparse data rather than greater availability in topic coverage amounts (see Supplementary Figure S1).
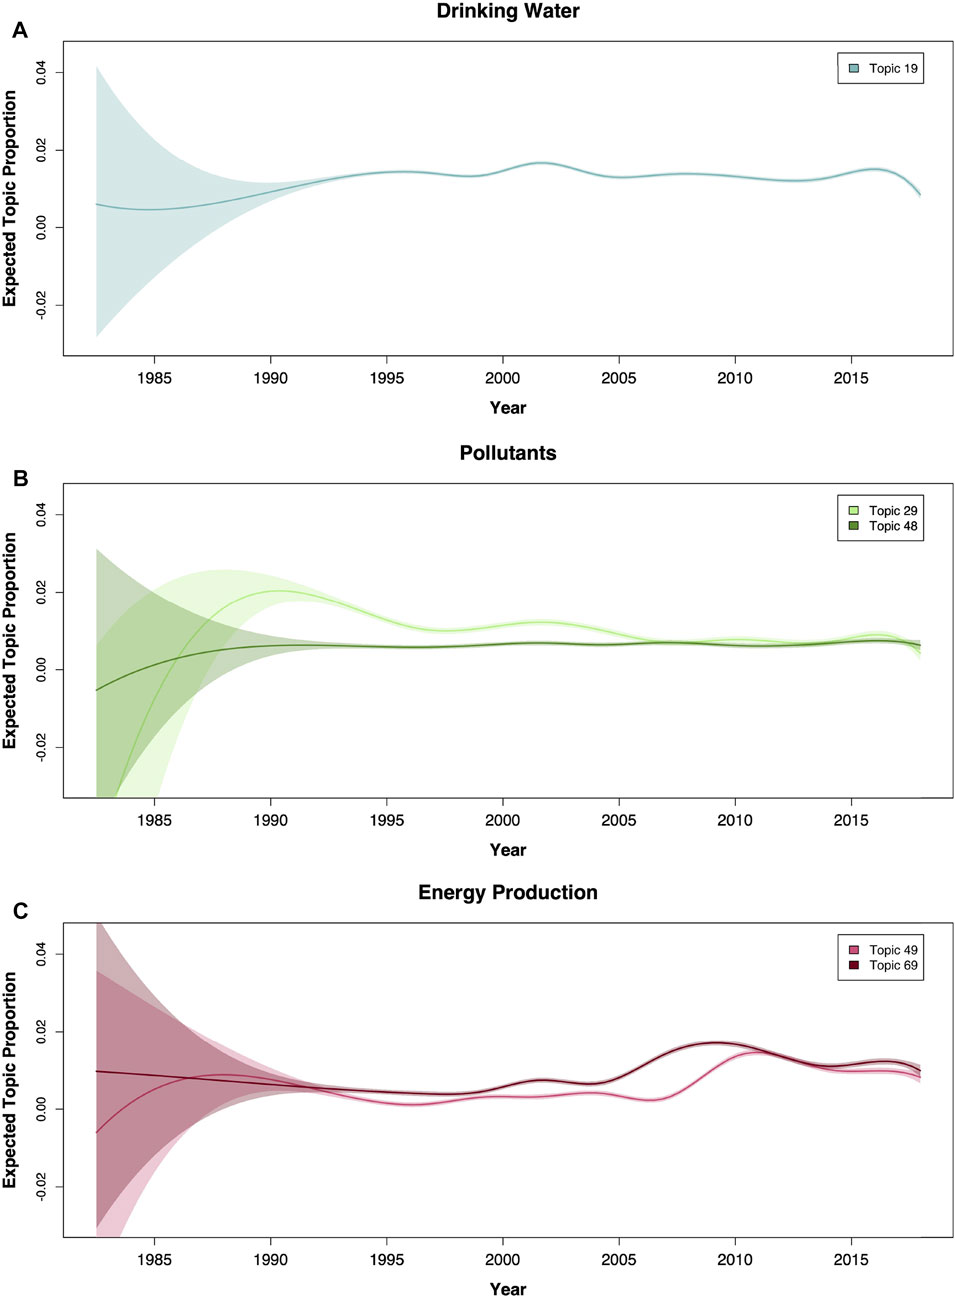
FIGURE 5. Temporal variation in the prevalence of topics of interest. Solid lines represent rolling average point estimates of the topics prevalence: drinking water (A), pollutants (B), and energy production (C). Shaded areas represent 95% confidence intervals of the estimates. Wide intervals at earlier date ranges are likely a result of sparser data.
Coverage of the drinking water topic appears relatively stable over time with two peaks observed during the early 2000s and around 2014. Among the two pollutant topics, water-borne diseases appears consistently less frequently in news articles compared to chemical contaminants. Although newspaper narratives about contaminants are more common, their prevalence has waned steadily since reaching a peak near 1990. On the other hand, both of the energy production topics, have observed increases in coverage over time and appear to track fairly close to one another. However, it is interesting that the two topics experienced that increase in prevalence at different points in time. Renewable energy sources (69) becomes more common around 2006 while the frequency of water in the context of oil and natural gas sources of energy increased slightly later, around 2009.
3.3.4 Named entity recognition
Figure 6 shows the twenty most frequently mentioned named entities within each of the topics of interest (also summarized in Supplementary Table S2). Across all topics of interest, geo-political entities such as the United States, states, and cities are among the most commonly occurring entity types in the news. This is likely because these entities serve dual purposes as both the location of water resources as well as the legislative and regulatory entities governing water resources, such as water rights, industrial practices, and clean drinking water standards.
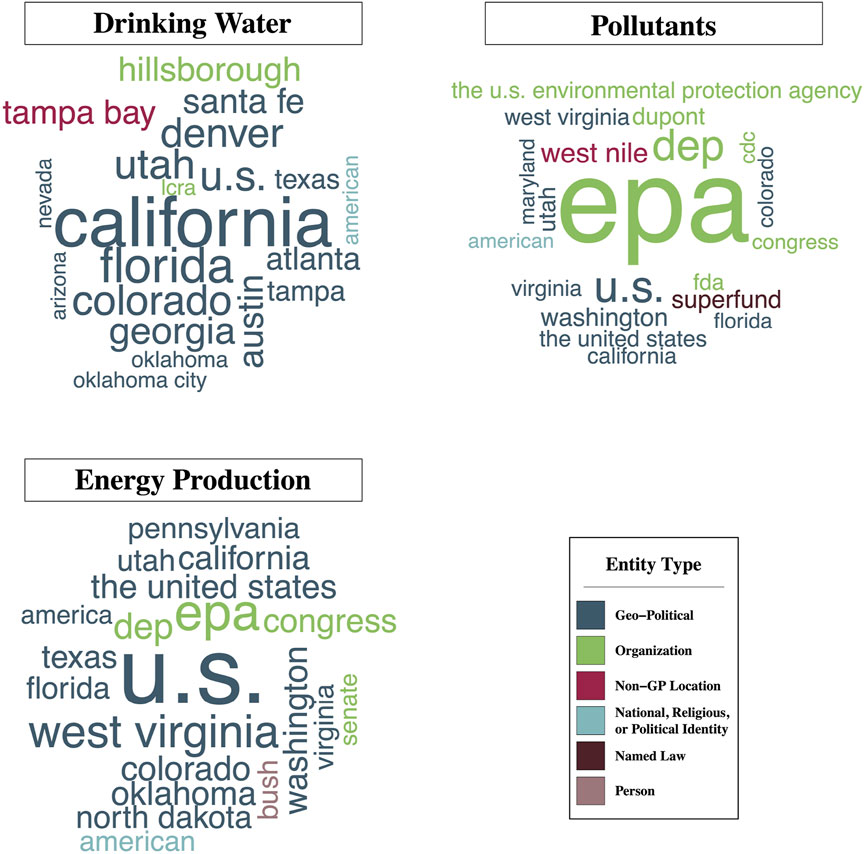
FIGURE 6. Word clouds of the 20 most frequently occurring named entities within articles associated with each of the topics of interest. The color of the words reflect associated entity type as denoted by spacyr whereas the size of the word correlates with its frequency within that group of documents. Words that are larger occur more frequently within the corpus.
Among articles in the drinking water topic, populous states such as California, Florida, and Texas appear frequently, but so do some of the less populous Western states that are subject to frequent droughts, such as Utah, Nevada, and Arizona. Likewise, the organization LCRA (short for “Lower Colorado River Authority”) also appears among the most common entities in this topic. This organization manages a 600-mile stretch of the Colorado River in Texas, including both drinking water supplies and the operation of six hydroelectric dams along the watershed (Lower Colorado River Authority, 2022).
Common entities appearing in news articles about pollutants and about energy production show a lot of overlap. In particular, regulatory agencies such as the United States Environmental Protection Agency (EPA) and state-level Departments of Environmental Protection (DEP) are mentioned often in both of these areas. Beyond the most common entities, the two groups of articles differ slightly in terms of other common entity types mentioned: energy production articles appear to mention other regions more frequently, while the pollutant articles mentions other regulatory agencies, the Dupont company, and superfunds.
3.3.5 Sentiment analysis
Finally, we conducted sentiment analysis to understand affective language use across the topics of interest. Figure 7A, shows positive and negative word usage variations across each of our topics of interest. Loughran and McDonald’s 2011 positive and negative sentiment dictionaries demonstrated substantively similar topic-specific results relative to the overall corpus as their LIWC base dictionary counterparts (Figure 7B). The averages for the overall filtered water resources corpus are included in the left-most bar for comparison purposes.
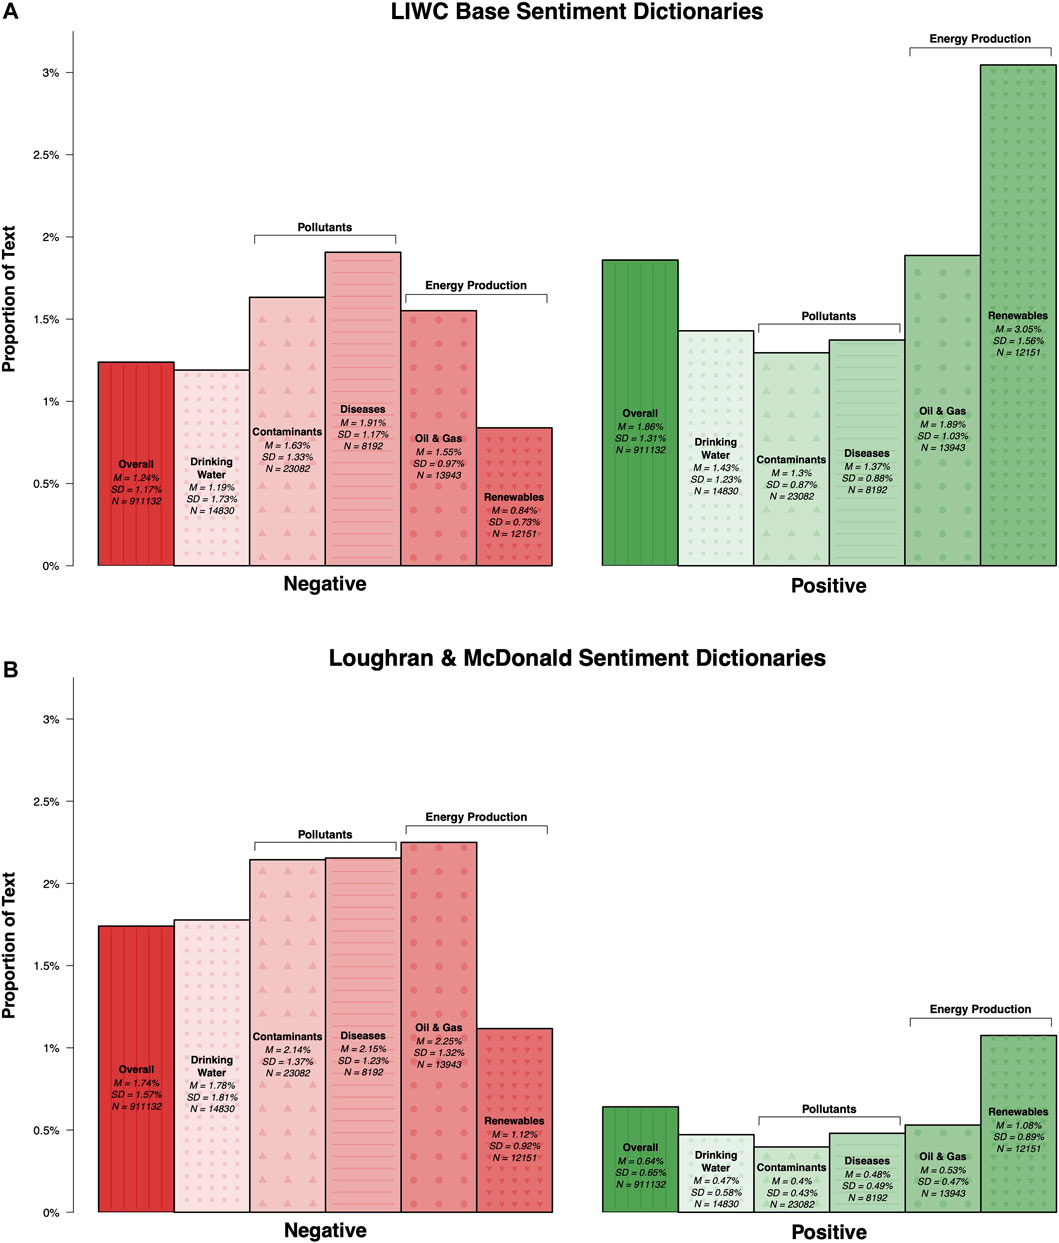
FIGURE 7. Bar plots and summary statistics of sentiment analysis results using both positive and negative dictionaries for each topic of interest; dictionaries were sourced both from: Linguistic Inquiry and Word Count (LIWC) (A) and Loughran and McDonald 2011 (B).
Compared to the broader filtered corpus, drinking water, contaminants, and diseases each used substantially fewer positive words. The oil and gas articles used fewer positive words than the average article according to the Loughran and McDonald dictionary, but nearly the same amount of positive words were used according to the LIWC dictionary. Renewable energy production, on the other hand, saw considerably more frequent use of positive terms than the average article.
Looking at negative dictionary results, we see again that renewable energy articles use considerably less negatively-valenced terms. In contrast, articles describing contaminants, diseases, and oil and gas use negatively-valenced words more frequently. Drinking water-related articles use comparable amounts of negative terms relative to the overall filtered corpus.
4 Discussion
Our findings captured the various ways in which water resources is discussed within the media as well as important spatial and temporal trends. For example, water plays a central role in household activities (e.g., for drinking, cooking, and gardening) and other critical infrastructures (e.g., food and energy; Figure 2). Discussions about the management structures and entities associated with water (e.g., legislations and regulations) are also reflected in the newspapers, which is consistent with findings in other national analyses (Hori, 2015). The general sentiments expressed in these articles also skewed more toward negative terms than positive ones, likely reflecting concerns of water availability and quality (Figure 7). These insights extend the findings of Murphy et al. (2014), Sanchez et al. (2021), Wei et al. (2015), and Wu et al. (2018) to systematically evaluate negative tones and narrative frames for water.
It is probably not surprising that drinking water is one of the more common topics in the filtered corpus (Figure 2). In particular, the southwest regions of the country had relatively high coverage of this topic (Figure 4A), with many entities from these areas (e.g., LCRA) emerging within NER as well (Figure 6). This coverage, which is consistent with physical analyses highlighting the increasing concern of drought in these areas (Cayan et al., 2010), signals to the public that resource scarcity and other related concerns are important issues that affect this region relative to the rest of the country. There were also two peaks (early 2000s and 2014) identified in drinking water coverage (Figure 5). These peaks likely reflect important events surrounding the discovery of lead leachate from service lines into drinking water—one in Washington D.C. (Nakamura, 2004). and from improper source water treatment in Flint, Michigan (Hyde, 2015). It is worth noting that “lead” did not appear in any of the top FREX words for this topic (see Figure 2), so this is either a subtopic within the broader drinking water news topic, or the second STM was able to distinguish the parts of these articles concerning drinking water from other subjects such as contaminants. Given that the drinking water and contaminants topics appear so close to one another in the dendrogram (Figure 3), the former is likely true.
Discussions about contaminants are more concentrated in the upper Midwest and Northeastern parts of the country, indicating that these areas are particularly sensitive to these concerns (Figure 4, panel B). In contrast, discussions about the second pollutants topic regarding water-borne illnesses (48) had alternate framing and received relatively little coverage. For example, water-borne illnesses was not closely connected to the other topics of interest, which are more closely connected to rules and regulations (11) and lawsuits (18). Rather, water-borne illnesses appear more closely connected to space travel (topic 40), indicating that perhaps these diseases are most likely discussed in a scientific context within the news (Figure 3). Consistently less coverage of water-borne diseases potentially indicates that these diseases are likely a small, but persistent background concern, at least among our United States sample of news media. In other parts of the world where water-borne illnesses are more common than in the United States, however, we would expect to find greater prevalence and variability of this topic in the news.
The close clustering between the drinking water topic (19) and contaminants (29) is not surprising given that provisions of safe drinking water have certain contaminant requirements for meeting water quality standards (Weinmeyer et al., 2017). However, decreasing coverage of contaminants over time (Figure 5) is concerning given the persistent issues associated with safe drinking water within the United States (Mueller and Gasteyer, 2021). One might expect, for example, that given North Carolina’s recent history with chemical run-off affecting drinking water supplies (Greenfield, 2021), that the prevalence of drinking water narratives in journalism would be matched with a large number of articles on the subject of pollution. However, that is not borne out in the geographic map of pollutants (Figure 4B). Unfortunately, the limited coverage of health-related risks within newspaper articles is consistent with findings in other studies (Mayeda et al., 2019).
Connections between water and energy-related topics also highlighted some interesting dynamics between different types of energy sectors. Both oil and gas (49) and renewable (69) sectors had similar topic prevalence suggesting equal weighing of both sustainable and traditional sources of energy as they pertain to water resources (Figure 2). However, important geographical and sentiment differences did emerge. For example, energy prevalence in the Portland, Oregon area may be tied to the Pacific Northwest Region’s use of hydroelectric generation for the majority of their energy production, whereas energy production discussions in West Virginia and Oklahoma is most likely attributable to both regions’ recent influx of the use of water for hydraulic fracturing of natural gas and crude oil ((U.S. Energy Information Administration, 2022); Figure 4, panel C). Furthermore, the sentiments expressed in renewable energy were much more positive compared to oil and gas, indicating that the news media and the public view them as an important step toward a more environmentally-friendly and sustainable energy future, particularly with regard to water resources (Figure 7). That both topics have since remained prevalent in the news suggests an increasing focus on how water shapes our energy future.
This study opens up a number of areas that can be explored for future work ranging from revisiting implemented methods to further exploration of identified topics. For example, for the initial STM, we elected to use a k of 100 since the running diagnostic procedures with searchK on 1.8 million full-length articles with two metadata covariates (categorical source and continuous date of publication) was computationally intractable. We assumed that 100 topics is a sufficiently large enough number to identify general differences between water-related and non-water-related topics. Further analyses, however, may provide a more elegant and accurate solution. Relatedly, another STM-related methodology that can be revisited relates to the identification of relevant articles for a given topic. As noted above, STMs are mixture models that allow for the possibility that articles may pertain to more than one topic. For this analysis, articles were either identified by looking at their top three topic scores (first STM) or highest scoring topic (topics of interest within second STM). Trade-offs in these decisions could be evaluated in future studies.
The analysis methods for identified topics could also be expanded to consider different algorithms. Currently, the publication dates of articles were included in the STM specification as a covariate to the modeled topics, so any temporal differences in the phrasing or framing of specific issues was likely captured in the final topic scores assigned to each article. This approach could be extended to consider ‘surprise’ or deviations in topic patterns observed to date, using Kullback-Leibler Divergence (Barron et al., 2018). The network-based methods implemented for topic clustering could also be repurposed to understand why entities co-occur together (Murphy et al., 2014). Sentiment analysis methods could also consider aspect-based approaches that connect sentiments to specific nouns to better understand the specific features that are being described by affective language (Nazir et al., 2020). These methods could be implemented on the five topics of interest or extended to all other topics (n = 74) and articles (n = 838, 934) in the second STM. Also, multi-language evaluations and human coding can be considered to evaluate alternate narratives that may be present in regions (e.g., between English and Spanish in New Mexico) that may not be immediately obvious through automated text methods. Finally, these methods can be extended to consider different types of media, from corporate reports (Kleinman et al., 2017) to social media (Day et al., 2019), and other regions of the world as well.
Integration of these areas into the larger CNH of water is also needed to assess how variations in coverage manifest in public behavior. Future research can consider the relationship between physical drivers (e.g., precipitation; Tian et al., 2019) and political leanings (Gilligan et al., 2018) among others in coverage variations. Finding instances where water coverage is closely linked (or inspires little action) to public awareness or changes in behavior (including policies and legislation) can help drive further discovery. For example, one such extended analysis may involve collecting and analyzing spatial or temporal coverage of lawsuit filing documents or drafted legislation with related newspaper article frequencies. We would expect that such a study would help elucidate whether lawsuits or legislation are filed in response to (i.e., there is a lag in topic prevalence) growing public concerns about, for example, water contamination or availability. Examining public behavior in this context and as a function of time will give us insight into the dynamic relationship between awareness and action.
Further analyses can consider time lags between news coverage and different types of real-world events and connect how negatively-charged language affects associated behaviors (Cote et al., 2017). For example, Sanchez et al. (2021) conducted spatial and bi-gram analyses on a subset of the dataset used in this paper that focused specifically on two natural disaster-related topics: fires and hurricanes. They integrated this newspaper data with temporal data about the magnitude and proximity of those events and determined that, while hurricane-related coverage was positively associated with event magnitude (e.g., disaster declarations, event-related deaths, etc.), fire-related coverage had mixed associations with the magnitude of those real-world events, depending on how event magnitude was operationalized. This case study further illustrates the growing need to understand media narratives as they relate to climate change-related events, as coverage rates (Dearing et al., 1996; McCombs, 2005; McCombs and Funk, 2011) and framing effects (Chong and Druckman, 2007) influence the public’s perceptions and attitudes. Further extensions of this work could emphasize other relevant events such as drought, or the contamination topics identified here. It should be noted that studies have also started to document environmental justice concerns associated with newspaper coverage (Tunney, 2017; Caballero et al., 2022). For example, indigenous communities have generally received less media coverage, with limited coverage containing little information about preventative measures (Lam et al., 2017). Thus, future research should further evaluate how underserved groups and their concerns about water resources are being reflected within the media to better capture their differential impacts and increase the diversity and inclusion of current coverage (Wei et al., 2015; Hadjimichael et al., 2020).
Although water is central to most of our activities, the diverse roles that it plays has challenged our ability to manage this resource sustainably. Addressing these issues becomes critical as the role of water continues to evolve in support of carbon-neutral transitions (Gunda et al., 2022). One sector that can help achieve sustainable water management objectives is mass media, which plays a critical role not only in framing issues, but also telling people what issues to think about in the first place (McCombs, 2005). Newspapers, in particular, may be representative of the public’s general awareness of water issues since they effectively “set the agenda” for the public and other media sources, such as social media (Treuer et al., 2017). As such, our study is one of the first big data evaluations that leverage NLP to gain insights into the diverse narratives associated with water in local United States newspaper publications across different topics and regions. The volume, scope, and type of news coverage has been shown to be linked to public behavior in other environmental domains (e.g., climate change; Quesnel and Ajami, 2017). Thus, continuing to increase our understanding of media coverage is going to be increasingly important to inform sustainable management of water in the future as we face unprecedented water scarcity across the globe.
Data availability statement
The raw data will not be made available because the licensing agreements between our data source and the corresponding publishers do not allow for reproduction of the content. However, the processed datasets generated for this study can be found in the Open Science Foundation repository: https://doi.org/10.17605/OSF.IO/R4ZEC. Any further inquiries can be directed to the corresponding author.
Author contributions
MS and TG contributed to the conception and design of the study. MS contributed to the data cleaning and analyses. TG served as the subject matter expert with regards to water resources. JG contributed to the data collection procedures. All authors contributed to manuscript revision, read, and approved the submitted version.
Funding
This work was funded by the Laboratory Directed Research and Development program at Sandia National Laboratories and by National Science Foundation under grant EAR-1416964.
Conflict of interest
The authors declare that the research was conducted in the absence of any commercial or financial relationships that could be construed as a potential conflict of interest.
Publisher’s note
All claims expressed in this article are solely those of the authors and do not necessarily represent those of their affiliated organizations, or those of the publisher, the editors and the reviewers. Any product that may be evaluated in this article, or claim that may be made by its manufacturer, is not guaranteed or endorsed by the publisher.
Supplementary material
The Supplementary Material for this article can be found online at: https://www.frontiersin.org/articles/10.3389/fenvs.2023.1038904/full#supplementary-material
References
Barron, A. T., Huang, J., Spang, R. L., and DeDeo, S. (2018). Individuals, institutions, and innovation in the debates of the French revolution. Proc. Natl. Acad. Sci. 115, 4607–4612. doi:10.1073/pnas.1717729115
Bayer, J. B., Sweitzer, M. D., Xiang, H., Mohan, S., and Meyers, E. (2022). Reimagining the personal network: The case of Path. Soc. Media & Soc. 8, 1–17. doi:10.1177/20563051221119475
Benites-Lazaro, L., Giatti, L., and Giarolla, A. (2018). Topic modeling method for analyzing social actor discourses on climate change, energy and food security. Energy Res. Soc. Sci. 45, 318–330. doi:10.1016/j.erss.2018.07.031
Beresford, M. (2020). The embedded economics of water: Insights from economic anthropology. Wiley Interdiscip. Rev. Water 7, e1443. doi:10.1002/wat2.1443
Brown, K. P. (2017). Water, water everywhere (or, seeing is believing): The visibility of water supply and the public will for conservation. Nat. Cult. 12, 219–245. doi:10.3167/nc.2017.120302
Caballero, M. D., Gunda, T., and McDonald, Y. J. (2022). Pollution in the press: Employing text analytics to understand regional water quality narratives. Front. Environ. Sci. 348. doi:10.3389/fenvs.2022.770812
Carey, M., Baraer, M., Mark, B. G., French, A., Bury, J., Young, K. R., et al. (2014). Toward hydro-social modeling: Merging human variables and the social sciences with climate-glacier runoff models (santa river, Peru). J. Hydrology 518, 60–70. doi:10.1016/j.jhydrol.2013.11.006
Cayan, D. R., Das, T., Pierce, D. W., Barnett, T. P., Tyree, M., and Gershunov, A. (2010). Future dryness in the southwest us and the hydrology of the early 21st century drought. Proc. Natl. Acad. Sci. 107, 21271–21276. doi:10.1073/pnas.0912391107
Chong, D., and Druckman, J. N. (2007). Framing theory. Annu. Rev. political Sci. 10, 103–126. doi:10.1146/annurev.polisci.10.072805.103054
Cote, S. A., Ross, H., David, K., and Wolfe, S. E. (2017). Walkerton revisited: How our psychological defenses may influence responses to water crises. Ecol. Soc. 22, art32. doi:10.5751/es-09616-220332
Day, A. M., O’Shay-Wallace, S., Seeger, M. W., and McElmurry, S. P. (2019). Informational sources, social media use, and race in the flint, Michigan, water crisis. Commun. Stud. 70, 352–376. doi:10.1080/10510974.2019.1567566
De Arruda, H. F., Costa, L. d. F., and Amancio, D. R. (2016). Using complex networks for text classification: Discriminating informative and imaginative documents. EPL Europhys. Lett. 113, 28007. doi:10.1209/0295-5075/113/28007
Dearing, J. W., Rogers, E. M., and Rogers, E. (1996). Agenda-setting. Thousand Oaks, CA: Sage. vol. 6.
DiMaggio, P., Nag, M., and Blei, D. (2013). Exploiting affinities between topic modeling and the sociological perspective on culture: Application to newspaper coverage of us government arts funding. Poetics 41, 570–606. doi:10.1016/j.poetic.2013.08.004
Dobelbower, S. E. (2018). Framing the future of the ogallala: A comparative content analysis of agricultural and mainstream media publications. Lubbock, TX: Texas Tech University.
Doeffinger, T., and Hall, J. W. (2020). Water stress and productivity: An empirical analysis of trends and drivers. Water Resour. Res. 56, e2019WR025925. doi:10.1029/2019wr025925
Farrell, J. (2016). Corporate funding and ideological polarization about climate change. Proc. Natl. Acad. Sci. 113, 92–97. doi:10.1073/pnas.1509433112
Funk, C., Gottfried, J., and Mitchell, A. (2017). science news and information today: A majority of americans rely on general outlets for science news but more say specialty sources get the facts right about science. Washington, DC: Pew Research Center, 1–90.
Gao, Y., Xu, Y., and Li, Y. (2013). “Pattern-based topic models for information filtering,” in Data mining workshops (ICDMW), 2013 IEEE 13th international conference on (IEEE), 921–928.
Gilligan, J. M., Wold, C. A., Worland, S. C., Nay, J. J., Hess, D. J., and Hornberger, G. M. (2018). Urban water conservation policies in the United States. Earth’s Future 6, 955–967. doi:10.1029/2017ef000797
Greenfield, N. (2021). The drinking water crisis that North Carolina ignored. Available at: https://www.nrdc.org/stories/drinking-water-crisis-north-carolina-ignored.
Gude, V. G. (2017). Desalination and water reuse to address global water scarcity. Rev. Environ. Sci. Bio/Technology 16, 591–609. doi:10.1007/s11157-017-9449-7
Gunda, T., Ferencz, S., Hora, P., Kuzio, S., and Wulfert, K. (2022). What is water? s role in a carbon neutral future? A summary of findings from a webinar series. Albuquerque, NM (United States): Sandia National Lab.SNL-NM. Tech. rep.
Hadjimichael, A., Quinn, J., Wilson, E., Reed, P., Basdekas, L., Yates, D., et al. (2020). Defining robustness, vulnerabilities, and consequential scenarios for diverse stakeholder interests in institutionally complex river basins. Earth’s Future 8, e2020EF001503. doi:10.1029/2020ef001503
Hess, D. J., Wold, C. A., Worland, S. C., and Hornberger, G. M. (2017). Measuring urban water conservation policies: Toward a comprehensive index. JAWRA J. Am. Water Resour. Assoc. 53, 442–455. doi:10.1111/1752-1688.12506
Hori, S. (2015). An exploratory analysis of the text mining of news articles about “water and society”. WIT Trans. Built Environ. 168, 501–508.
Hyde, T. G. (2015). High lead levels in flint, Michigan. Available at: https://www.epa.gov/sites/default/files/2015-11/documents/transmittal_of_final_redacted_report_to_mdeq.pdf.
Kleinman, G., Kuei, C.-h., and Lee, P. (2017). Using formal concept analysis to examine water disclosure in corporate social responsibility reports. Corp. Soc. Responsib. Environ. Manag. 24, 341–356. doi:10.1002/csr.1427
Lam, S., Cunsolo, A., Sawatzky, A., Ford, J., and Harper, S. L. (2017). How does the media portray drinking water security in indigenous communities in Canada? An analysis of canadian newspaper coverage from 2000-2015. BMC Public Health 17, 282–314. doi:10.1186/s12889-017-4164-4
Loughran, T., and McDonald, B. (2011). When is a liability not a liability? Textual analysis, dictionaries, and 10-ks. J. finance 66, 35–65. doi:10.1111/j.1540-6261.2010.01625.x
Lower Colorado River Authority (2022). About LCRA. available at: https://www.lcra.org/about/.
Mayeda, A. M., Boyd, A. D., Paveglio, T. B., and Flint, C. G. (2019). Media representations of water issues as health risks. Environ. Commun. 13, 926–942. doi:10.1080/17524032.2018.1513054
McCombs, M. (2005). A look at agenda-setting: Past, present and future. Journal. Stud. 6, 543–557. doi:10.1080/14616700500250438
McCombs, M., and Funk, M. (2011). Shaping the agenda of local daily newspapers: A methodology merging the agenda setting and community structure perspectives. Mass Commun. Soc. 14, 905–919. doi:10.1080/15205436.2011.615447
Mekonnen, M. M., and Hoekstra, A. Y. (2016). Four billion people facing severe water scarcity. Sci. Adv. 2, e1500323. doi:10.1126/sciadv.1500323
Mimno, D., Wallach, H., Talley, E., Leenders, M., and McCallum, A. (2011). “Optimizing semantic coherence in topic models,” in Proceedings of the 2011 conference on empirical methods in natural language processing, 262–272.
Mueller, J. T., and Gasteyer, S. (2021). The widespread and unjust drinking water and clean water crisis in the United States. Nat. Commun. 12, 3544–3548. doi:10.1038/s41467-021-23898-z
Murphy, C., Noone, S., Duffy, C., Broderick, C., Matthews, T., and Wilby, R. L. (2017). Irish droughts in newspaper archives: Rediscovering forgotten hazards? Weather 72, 151–155. doi:10.1002/wea.2904
Murphy, J. T., Ozik, J., Collier, N. T., Altaweel, M., Lammers, R. B., Kliskey, A., et al. (2014). Water relationships in the us southwest: Characterizing water management networks using natural language processing. Water 6, 1601–1641. doi:10.3390/w6061601
Nakamura, D. (2004). Water in d.c. exceeds epa lead limit. available at: https://www.washingtonpost.com/archive/politics/2004/01/31/water-in-dc-exceeds-epa-lead-limit/1e54ff9b-a393-4f0a-a2dd-7e8ceedd1e91/.
Nazir, A., Rao, Y., Wu, L., and Sun, L. (2020). Issues and challenges of aspect-based sentiment analysis: A comprehensive survey. IEEE Trans. Affect. Comput. 13, 845–863. doi:10.1109/taffc.2020.2970399
Newman, D., Chemudugunta, C., Smyth, P., and Steyvers, M. (2006). “Analyzing entities and topics in news articles using statistical topic models,” in International conference on intelligence and security informatics (Springer), 93–104.
Quesnel, K. J., and Ajami, N. K. (2017). Changes in water consumption linked to heavy news media coverage of extreme climatic events. Sci. Adv. 3, e1700784. doi:10.1126/sciadv.1700784
Roberts, M. E., Stewart, B. M., and Airoldi, E. M. (2016). A model of text for experimentation in the social sciences. J. Am. Stat. Assoc. 111, 988–1003. doi:10.1080/01621459.2016.1141684
Roberts, M. E., Stewart, B. M., Tingley, D., Lucas, C., Leder-Luis, J., Gadarian, S. K., et al. (2014). Structural topic models for open-ended survey responses. Am. J. Political Sci. 58, 1064–1082. doi:10.1111/ajps.12103
Roberts, M., Stewart, B., and Tingley, D. (2018). stm: R package for structural topic models. Available at: https://cran.r-project.org/web/packages/stm/index.html.
Ruhl, J., Nay, J., and Gilligan, J. (2018). Topic modeling the president: Conventional and computational methods. Geo. Wash. L. Rev. 86, 1243.
Sanchez, D., Eagleston, H., Anker, B., Jenkins, L. T., and Gunda, T. (2021). Not all disasters are created equal: An evaluation of water issues in fire and hurricane media coverage in the United States. Water 13, 3655. doi:10.3390/w13243655
Srinivasan, V., Konar, M., and Sivapalan, M. (2017). A dynamic framework for water security. Water Secur. 1, 12–20. doi:10.1016/j.wasec.2017.03.001
Tian, F., Lu, Y., Hu, H., Kinzelbach, W., and Sivapalan, M. (2019). Dynamics and driving mechanisms of asymmetric human water consumption during alternating wet and dry periods. Hydrological Sci. J. 64, 507–524. doi:10.1080/02626667.2019.1588972
Treuer, G., Koebele, E., Deslatte, A., Ernst, K., Garcia, M., and Manago, K. (2017). A narrative method for analyzing transitions in urban water management: The case of the m iami-d ade w ater and s ewer d epartment. Water Resour. Res. 53, 891–908. doi:10.1002/2016wr019658
Tunney, C. (2017). Newspaper coverage of the flint water crisis: An empirical analysis to support a new model for latent environmental disasters. East Lansing, MI: Michigan State University.
U.S. Energy Information Administration (2022). Regional dashboards & data. available at: https://www.eia.gov/regional/.
Wei, J., Wei, Y., Western, A., Skinner, D., and Lyle, C. (2015). Evolution of newspaper coverage of water issues in Australia during 1843–2011. Ambio 44, 319–331. doi:10.1007/s13280-014-0571-2
Weinmeyer, R., Norling, A., Kawarski, M., and Higgins, E. (2017). The safe drinking water act of 1974 and its role in providing access to safe drinking water in the United States. AMA J. Ethics 19, 1018–1026. doi:10.1001/journalofethics.2017.19.10.hlaw1-1710
Wester, J., Timpano, K. R., Çek, D., and Broad, K. (2016). The psychology of recycled water: Factors predicting disgust and willingness to use. Water Resour. Res. 52, 3212–3226. doi:10.1002/2015wr018340
Keywords: water, newspapers, big data, natural language processing, structural topic modeling, named entity recognition, sentiment analyis
Citation: Sweitzer MD, Gunda T and Gilligan JM (2023) Water narratives in local newspapers within the United States. Front. Environ. Sci. 11:1038904. doi: 10.3389/fenvs.2023.1038904
Received: 07 September 2022; Accepted: 17 February 2023;
Published: 01 March 2023.
Edited by:
Srijan Aggarwal, University of Alaska Fairbanks, United StatesCopyright © 2023 Sweitzer, Gunda and Gilligan. This is an open-access article distributed under the terms of the Creative Commons Attribution License (CC BY). The use, distribution or reproduction in other forums is permitted, provided the original author(s) and the copyright owner(s) are credited and that the original publication in this journal is cited, in accordance with accepted academic practice. No use, distribution or reproduction is permitted which does not comply with these terms.
*Correspondence: Thushara Gunda, dGd1bmRhQHNhbmRpYS5nb3Y=