 Beilun Zhao
 Peter M. van Bodegom
 Krijn Baptist Trimbos
95% of researchers rate our articles as excellent or good
Learn more about the work of our research integrity team to safeguard the quality of each article we publish.
Find out more
ORIGINAL RESEARCH article
Front. Environ. Sci. , 07 August 2023
Sec. Freshwater Science
Volume 11 - 2023 | https://doi.org/10.3389/fenvs.2023.1025105
This article is part of the Research Topic Freshwater Biodiversity Crisis: Multidisciplinary Approaches as Tools for Conservation Volume II View all 10 articles
Environmental DNA (eDNA) has been widely used in biomonitoring and has major advantages compared to traditional methods such as counting observations. However, the persistence of eDNA within an ecosystem can lead to false-positive results on the presence of organisms. To improve the accuracy of the interpretation of eDNA results, the present study aimed to enhance the understanding of the connection between environmental factors and eDNA persistence. Here, we set up tank experiments using freshwater from 16 field locations involving four ecosystem types and Milli-Q water as control to cultivate zebrafish, and monitor eDNA degradation over time after removing the organisms. Bacterial abundance, nitrate, phosphate, dissolved oxygen and pH were analyzed to evaluate their impacts on eDNA degradation. We found that bacterial abundance and pH were positively related to eDNA degradation. The eDNA at the size range of 1.2–5 μm (extracellular but intro-mitochondrial) decreased faster than at the >5 μm (intracellular) size range, leading to changes in the eDNA particle size proportion (PSP) with degradation. eDNA particle size proportion in the field water was different from in Milli-Q water. In conclusion, our findings help understand how eDNA persistence is connected with both abiotic and biotic environmental factors, and thereby will improve the accuracy of eDNA methods in aquatic biomonitoring.
Analyzing environmental DNA (eDNA), i.e., DNA extracted from environmental samples such as soil, water and air (Taberlet et al., 2012), has developed into an efficient non-invasive method for biomonitoring ever since it first emerged about 2 decades ago (Willerslev et al., 2003; Ficetola et al., 2008; Thomsen and Willerslev, 2015; Salter et al., 2019; Murchie et al., 2022). In aquatic systems, macroorganisms release their eDNA through the continuous shedding of skin cells and metabolic products (Maruyama et al., 2014; Fremier et al., 2019; Wood et al., 2020). This released eDNA enables detection of species presence around the sampling site from water samples, using well-developed molecular techniques such as PCR (Taberlet et al., 2012). Owing to the ease of field sampling, its non-invasiveness and blind detection of species, eDNA methods have been demonstrated to be superior in terms of efficiency and species detection, where eDNA often detects more species compared to traditional methods, such as trawl surveys (Salter et al., 2019) and counting observations (Katano et al., 2017). It has been successfully applied in analyzing community composition (Deiner et al., 2016; Djurhuus et al., 2018; Beentjes et al., 2021), investigating rare and invasive species (Alzaylaee et al., 2020; Brys et al., 2021), and surveying biodiversity (Carraro et al., 2020; Loewen et al., 2022).
Despite the benefits and increasing applications, interpretation of eDNA data is often hampered by uncertainties in eDNA persistence and its fate within environments. After eDNA is being shed off from the host organism, it can persist in aquatic systems from hours to years depending on the conditions (Joseph et al., 2022). Long persistence is usually caused by slow degradation due to adverse biotic (bacterial abundance and activity) and abiotic environmental factors, such as low temperature and pH (Andruszkiewicz et al., 2017; Mächler et al., 2018; Allan et al., 2021). For instance, eDNA persisted for over 2 weeks at low temperatures (≤10°C) but for a week or less at ≥20°C in one study (McCartin et al., 2022). Non-neutral pH (both acidic and alkaline) has been proven to accelerate eDNA degradation (Strickler et al., 2015; Jo et al., 2020). The effect of some other factors such as UV has shown contradictory effects on eDNA degradation. Mächler et al. declared that UV radiation does not affect eDNA-based detection rates (Mächler et al., 2018), yet Strickler et al. inferred that moderately high UV-B contributes to favorable environments for microbial growth which is associated with a higher eDNA degradation (Strickler et al., 2015). A long period in which eDNA persists in the environment could lead to false-positive results of species presence; while eDNA may be detected at a site the organism may have already left, or the organism was never there in the first place and this exogenous eDNA was transferred to the sample location from somewhere else (Mauvisseau et al., 2022). In biomonitoring studies, this situation can further culminate into incorrect inferences about aquatic biodiversity and corresponding water management measures (Deutschmann et al., 2019; Bedwell and Goldberg, 2020; Mauvisseau et al., 2022). Therefore, a deeper understanding of eDNA degradation in the environment is important to optimize eDNA methods to be reliable and accurate for biomonitoring. Specifically, we need to understand the influences of environmental factors and eDNA size (1.2–5 μm for intro-mitochondrial and >5 μm for intracellular particles) on eDNA degradation, and thereby on the persistence of eDNA.
eDNA degradation is most likely a biotic process, driven by the microbial composition, abundance (as actors) and their activity (Mentzer et al., 2006; Delita et al., 2007; van Bochove et al., 2020). Enzymes or other active products released by microorganisms, such as nucleases and hydrolases, can decompose extracellular DNA and organic particles containing eDNA in the environment. The impacts of abiotic factors on eDNA degradation most likely play out through microorganisms and their enzyme production (Fabian et al., 2016; Joseph et al., 2022). Therefore, microbial indicators might be seen as a proxy for the amount of eDNA degradation (Strickler et al., 2015; Salter, 2018). Few studies have directly linked bacterial abundance to eDNA degradation in aquatic systems. One study (Tsuji et al., 2017) indicated that bacterial abundance did not have a significant effect on extracellular DNA degradation, but this was very likely caused by the laboratory culturing water which contained insufficient amounts of nutrients for bacterial growth and activity. Another study confirmed that temperature and bacterial abundance had significant positive effects on extracted DNA degradation in sediments under laboratory conditions (Zulkefli et al., 2019). Yet it is still uncertain how degradation of naturally released eDNA is related to bacterial abundance under field conditions in natural aquatic systems. Subsequently, it is still largely unclear how varying abiotic conditions in the field might affect the degradation of eDNA directly or indirectly by impacting bacterial abundance and activity.
The microbial degradation of eDNA is also likely affected by the eDNA particle size (Jo and Minamoto, 2021; Zhao et al., 2021). eDNA obtained from environmental samples is usually a mix of eDNA at various sizes reflecting the multiple sources of eDNA, varying from extracellular but intro-organellar to intracellular, and up to tissue particles consisting of multiple cells (Turner et al., 2014; Sassoubre et al., 2016; Jo et al., 2019a). The particle size range of each eDNA state depends on the cell size of the target species and the size of organelles containing the target DNA fragment, which can influence the sensitivity of eDNA to enzymatic and chemical degradation of eDNA in the environment. For example, eDNA protected by cell membranes or organelle barriers might persist for a longer period. Increased eDNA persistence might be even more pronounced in tissue particles, where eDNA is additionally protected by an outer barrier of cells. Subsequently, microorganisms may need different eDNA degradation strategies depending on the eDNA particle size (e.g., release different enzymes on cell or organelle membranes), thereby potentially leading to different eDNA decay rates and therefore persistence (Jo et al., 2019a). Additionally, eDNA particle size distribution (PSD) or PSP has been found to be different between species (Zhao et al., 2021). Therefore, studying the connection between eDNA particle size and eDNA degradation might also be important to increase our understanding of eDNA persistence differences between species (Zhao et al., 2021).
We hypothesize that bacterial abundance and abiotic factors synergistically impact the degradation of both extracellular and intracellular eDNA. Additionally, abiotic factors might also indirectly affect eDNA degradation by impacting bacteria abundance and activity (Figure 1). Resulting changes in eDNA persistence affect the likelihood of getting false-positive results on species presence. To test this hypothesis, freshwater from four ecosystems was collected as culturing water, while using Milli-Q water as control to see how eDNA decays in a situation without bacteria. Phosphate, nitrate, pH and Dissolved Oxygen (DO) were quantified to represent abiotic factors. Using zebrafish (Danio rerio) as model species, eDNA concentrations at both 1.2–5 (extracellular but intro-mitochondrial) and >5 μm (intracellular) size ranges were monitored by droplet digital PCR (ddPCR) detection within 84 h after removing the zebrafish. The decay rate of different sizes and for different ecosystems was determined and the impact of bacterial abundance and each abiotic factor on the estimated eDNA decay rate was analyzed.
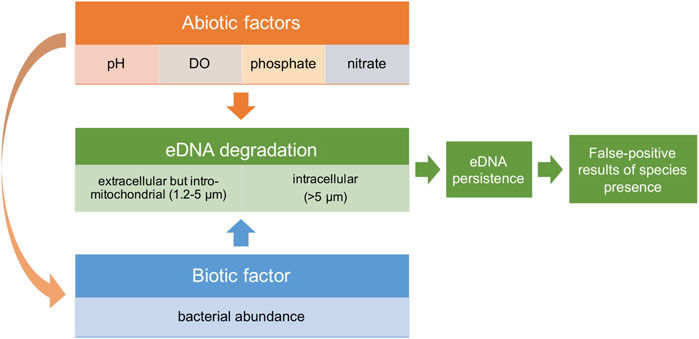
FIGURE 1. Conceptual framework figure showing the hypothesis that abiotic factors and bacterial abundance synergistically impact eDNA degradation, and therefore eDNA persistence. These factors potentially affect the chance of false-positive results of species presence using eDNA-based methods.
A total of 16 field locations (Supplementary Figure S1) in the Netherlands were chosen as freshwater sources in this study to create a field realistic range of both bacterial abundance and abiotic factors. Four different ecosystem types were involved, farmland ditch, river in the forest, lake and river in the city, each including four locations. 5 L water was taken from each location, put in a separate tank and translocated to a climate room of Leiden University, the Netherlands, between October 26th and 2 November 2020. Another tank with 5 L Milli-Q water was set as a control with low bacterial abundance (possibly from zebrafish larvae), leading to a total of 17 tanks (Figure 2). The temperature setpoint of this climate room was 22°C to obtain a normal living situation for zebrafish larvae, with light between 7 a.m. and 11 p.m. every day. Around 100 zebrafish larvae (∼3 mm) of 3 days old were put into each tank to let them release their DNA into the water. The zebrafish larvae originated from a standard zebrafish culturing system in the same building as the climate room and were cultured according to standard protocols (http://ZFIN.org).
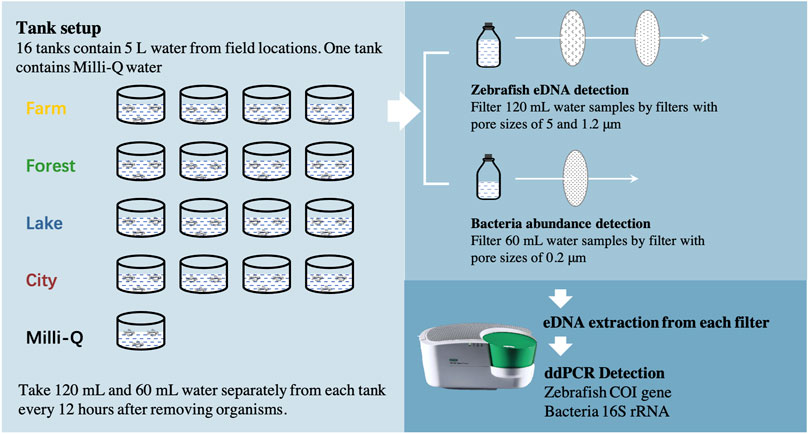
FIGURE 2. Flow chart of the experiment. The whole experiment included three steps; eDNA release, sampling and detecting. First, 16 tanks each containing 5 L water from one field location (Four locations of each ecosystem) and another tank containing Milli-Q water were set up. Around 100 zebrafish (D. rerio) larvae were added to each tank to let them release eDNA. No larvae died during the whole set-up. Second, between 0 and 84 h after removing the organisms, 120 mL and 60 mL water samples were taken from each tank separately after gently mixing the water every 12 h. The 120 ml water sample was filtered using two polyethersulfone (PES) membrane filters with different pore sizes (5, 1.2 μm) sequentially for zebrafish eDNA detection. The 60 ml water sample was filtered using PES membrane filters with pore sizes of 0.2 μm for bacteria abundance detection. Last, DNA was extracted from every filter separately to evaluate the copy concentration of zebrafish Cytochrome c Oxidase subunit 1 (COI) gene region or the copy number of 16S rRNA gene region through ddPCR species-special detection, using corresponding primers and probes.
For each tank, the water was screened through a sterilized mesh with pore size around 1 mm to another sterilized tank to remove the zebrafish larvae after about 27 h. No zebrafish larvae died in any of the tanks. Immediately afterwards, all tanks were transferred to another climate room (time point 0) with a lower temperature (18°C) and no light to extend eDNA persistence and to allow for the inclusion of more sampling time points before all eDNA had decayed. The light was kept off during the eDNA monitoring period to avoid its potential impacts on eDNA degradation. Water samples were taken from each tank separately at times 0, 12, 24, 36, 48, 60, 72 and 84 h. At each point in time, 120 mL water was taken after gently mixing the water and sequentially filtered with a plastic syringe (BD Plastipak™) using a polyethersulfone (PES) membrane filter with pore size of 5 μm, followed by filtration of another filter with pore size of 1.2 μm. Our previous study showed that over 80% of zebrafish eDNA is at > 1.2 μm size ranges (Zhao et al., 2021). Therefore, this set-up allowed us to obtain most zebrafish eDNA of extracellular but intra-mitochondrial DNA (1.2–5 μm) and intracellular DNA (>5 μm) origin. Two size ranges at eight sampling times of each for the 17 tanks resulted in 272 eDNA samples for further zebrafish eDNA concentration detection. An additional 60 mL of water was filtered by a plastic syringe (BD Plastipak™) using a 0.2 μm pore size PES membrane providing an additional 136 samples to catch bacterial DNA. After filtering, each filter was immediately put into a 2 mL tube together with 700 μL CTAB Lysis buffer (AppliChem GmbH, DE) and stored at 4°C. Before every sampling round, all injectors, membrane containers, and glass wear had been soaked in 10% bleach over 10 min, subsequently being washed by deionized water and then air-dried on clean paper towels, to decontaminate the reusables of any DNA residues (Goodyear, 2012; Beentjes et al., 2021).
Simultaneous to taking the 5 L water from each of the 16 field locations, four additional tubes of 50 mL water were taken from the same location at the same time using 50 mL sterilized centrifuge tubes from SARSTEDT (https://www.sarstedt.com/). This total of 64 tubes of water was immediately taken to a lab where phosphate and nitrate were quantified. Phosphate concentrations were determined using the MERCK Phosphate Test kit (product No. 114848, Supelco) following the manufacturer’s protocol. Likewise, nitrate concentrations were determined using the MERCK Nitrate Test kit (product No. 109713, Supelco) following the manufacturer’s protocol. All glass wells and cells were cleaned with acetone first, then with demineralized water before use. DO and pH of each location were determined in the field utilizing HANNA-EDGE instruments with a DO probe (HI764080) and pH probe (HI-11310). For each abiotic factor (phosphate, nitrate, pH and DO), the average value of the four replicate quantifications was used in further analysis.
At the next day following each sampling, DNA was extracted from each filter following a CTAB protocol used in previous eDNA studies (Barnes et al., 2014; Turner et al., 2014) and eluted in 50 μL Tris-EDTA buffer solution (Sigma-Aldrich, US). All extracted DNA samples were quantified using Thermo Scientific™ NanoDrop™ 2000 and then stored at -20°C awaiting further analysis.
Quantification of zebrafish eDNA concentrations was performed using the QX200 ddPCR system (Bio-Rad) through measuring the copy concentration of cytochrome c oxidase I (COI) gene region, utilizing an assay specific to zebrafish designed in one of our previous studies (Zhao et al., 2021). Bacteria concentration was quantified by measuring the copy concentration of the 16S rRNA gene region, utilizing an assay designed by a previous study (Rothrock et al., 2013). Primer sets and probes were ordered from Sigma-Aldrich (https://www.sigmaaldrich.com/), and the sequences of the primers and probes are shown in Table 1.
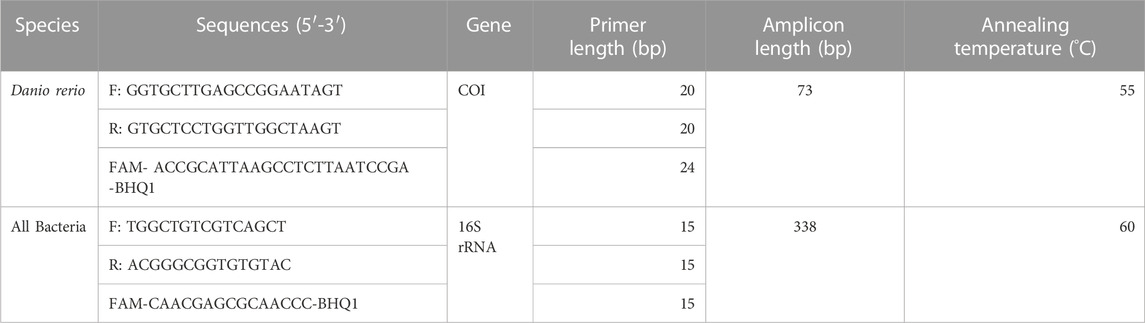
TABLE 1. Species-specific primers and probe information, including sequence, length and annealing temperature, that were used for amplification of zebrafish Cytochrome c Oxidase subunit 1 (COI) gene and the bacterial 16S rRNA gene during ddPCR analysis.
The ddPCR reaction mix was prepared following the ddPCR protocol (Droplet Digital™ PCR Applications Guide-Bio-Rad, https://www.bio-rad.com/), each 22 μL reaction included 4.4 μL DNA template, 900 nM of each forward and reverse primer, 250 nM of TaqMan probe, 11 μL ddPCR™ Supermix for Probes (No dUTP) and nuclease-free water. Due to the high concentration, each bacteria DNA template except those from the control tank was diluted 103 times. 20 μL of each reaction was subsequently transferred to the middle line of a DG8™ Cartridge, and 70 μL of Droplet Generation Oil for Probes was added to every oil hole on the cartridge to generate droplets using the QX200 Droplet Generator after being covered by DG8™ Gaskets. Around 3 min later, 40 μL generated droplets of each sample were transferred to a ddPCR™ 96-Well Semi Skirted PCR Plate (Bio-Rad). Each PCR plate was used either for zebrafish eDNA or 16S rRNA gene region quantification and contained two negative controls using Tris-EDTA buffer solution as a template. Plates for zebrafish quantification also contained one positive control of the PCR reaction using zebrafish tissue DNA as a template. Thermal reactions were carried out as follows: 10 min at 95°C, 40 cycles of 30 s at 94°C, and 1 min at the annealing temperature of corresponding primers (Table 1), then 10 min at 98°C before 4°C conservation. Every sample was tested in duplicate, allowing for more accurate quantification of low eDNA concentrations as indicated by previous studies (Jerde et al., 2016; Mauvisseau et al., 2019). The high precision among technical replicates and the nature of the ddPCR analysis make two technical replicates was sufficient, and complies to procedures of other ddPCR studies (Nathan et al., 2014; Doi et al., 2015). Using QX200 Droplet Reader and QuantaSoft (V.1.7.4, Bio-Rad), the fluorescence of each droplet was detected and assigned as positive or negative based on the positive and negative controls following the Quantasoft manual as described before (Zhao et al., 2021). Subsequently, the concentration in copies/μL of each template of both zebrafish eDNA and the 16S rRNA gene region was calculated following the Quantasoft manual through merging the two duplicate measurements, employing the ratio between positive and negative droplets assuming a Poisson distribution (Miotke et al., 2014). The ddPCR results were converted into DNA concentrations (copies/mL) of the water sample based on the various dilutions involved in the analysis process.
Six eDNA samples were excluded as an exceptionally low concentration of extracted DNA (<0.1 ng/μL, NanoDrop results) indicated the failure of the CTAB DNA extraction. All eDNA concentrations including zeros were log10 (X + 1)-transformed before analysis to meet the assumption of normality. To explore the change in eDNA concentration with time, between size ranges and in water sources from different ecosystems (excluding the control treatment) and their interactions, a three-way ANOVA test was performed followed by a Tukey HSD post-hoc test using the multcomp package (V.1.4-17, https://CRAN.R-project.org/package=multcomp) for significant main factors. After that, to better understand the significant interactions between time and size range, a follow-up analysis was run using a one-way ANOVA followed by a Tukey HSD post-hoc test to evaluate differences in the eDNA concentration between sampling times for each size range without consideration of ecosystem type.
To better understand how differential decay of size classes affects size proportions, the particle size percentage was calculated for both size classes. Next, a Kruskal–Wallis test was used to evaluate the PSP changes with eDNA degradation by time and between ecosystems followed by a posthoc Dunn’s test using the Holm method to adjust the p-values. To further examine the percentage differences between size ranges and between ecosystems, a Wilcoxon signed-rank test was used to evaluate the percentage difference between 1.2– 5 μm and >5 μm size ranges, and between the control tank with Milli-Q water and each of the other tanks.
The concentration of 16S rRNA gene region (copies/mL) was used to represent bacterial abundance in this study. An ANOVA was used to examine how bacterial abundance changed over time for each type of water source. No discernible changes were found (p ≥ 0.05, Supplementary Figure S2). Therefore, the average bacterial abundance across all time points in each tank was used in further analyses.
To further analyze eDNA degradation under influence of environmental factors, the eDNA decay rate constants of both size classes were obtained using the easynls package (V.5.0, https://rdrr.io/cran/easynls/) in R software, through fitting eDNA concentration data (N) to an exponential decay model N(t) = N0e−λt. This model has been shown to fit eDNA decay well (Eichmiller et al., 2016; Collins et al., 2018). The decay rate constants λ were log10 (X + 1)-transformed before further analysis to meet the assumption of normality. The impact and interaction of ecosystem type and size range on eDNA decay rate constants were first explored using a two-way ANOVA test, followed by a Tukey HSD post-hoc test. This was followed by an Akaike information criterion (AIC) analysis to find out the best-fit model for eDNA decay rate for both size classes separately, using bacteria abundance, phosphate, nitrate concentration, pH and DO as variables (thus replacing the possible effects of ecosystem types). After that, another two-way ANOVA was used to evaluate the effect and interaction between bacteria abundance and pH on the decay rate constant. The effect of each environmental factor and bacteria abundance on the eDNA decay rate was also tested separately by one-way ANOVAs. R software (V.4.0.2, https://www.r-project.org/) was used for all analyses.
The zebrafish eDNA concentrations from 0 to 84 h after removing the organisms in water from all 16 field locations and the control tank containing Milli-Q water are shown in Figure 3, for the 1.2–5 and >5 μm size ranges separately (Data in Supplementary Table S1). The eDNA concentration showed a significant decrease after removing the zebrafish from the water for all field locations, and was significantly different between 1.2–5 and >5 μm size ranges and between water from different ecosystems, as indicated by the three-way ANOVA (Table 2). The eDNA concentration at 1.2–5 μm size ranges decreased faster than at >5 μm size ranges and the difference in eDNA concentrations increased over time as shown by the significant interaction between time and size range. The post-hoc test following the three-way ANOVA indicated that the eDNA concentration in water from the forest ecosystem was different from the other three ecosystems (p < 0.05). It was slightly higher than in other ecosystems after 48 h (Figure 3). eDNA concentrations in the control tank decreased much slower than in tanks with field freshwater, and was barely different between 1.2–5 and >5 μm size ranges.
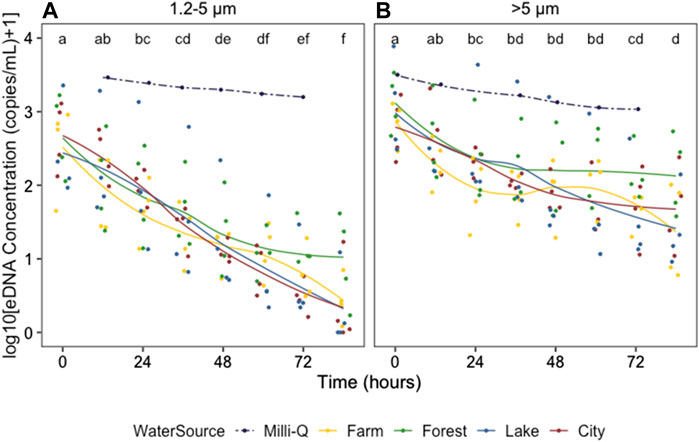
FIGURE 3. Zebrafish eDNA concentration (log10 (X + 1)-transformed) from 0 to 84 h after removing the organisms from field water (solid lines) and Milli-Q water (dotted lines) at 1.2–5 (A) and >5 μm size ranges (B) Colors indicate the ecosystem type of the water source. Different letters identify significant differences between sampling times according to the Tukey HSD posthoc tests on a one-way ANOVA for all water sources combined (excluding those in Milli-Q water). To indicate the changing trends, smooth lines were added using geom_smooth (method = loess) in R.
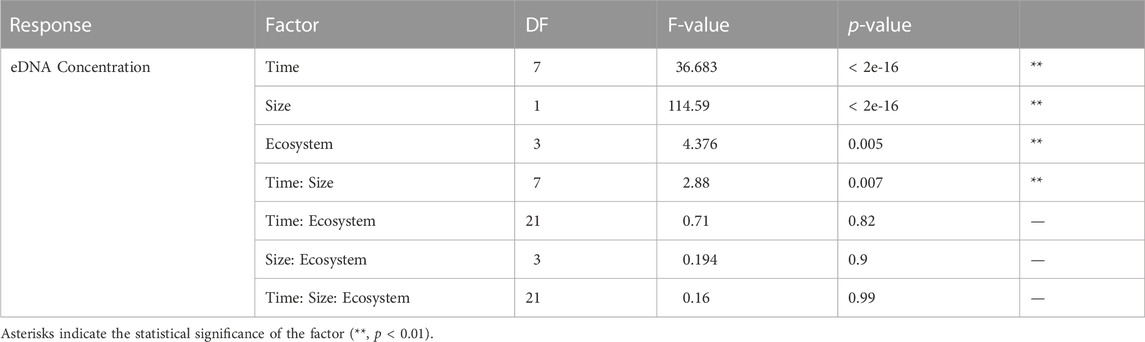
TABLE 2. The result of the three-way ANOVA test for the effects of time, eDNA particle size, and ecosystem of water source on eDNA concentration, including degrees of freedom (DF), F-values and p-values.
The eDNA concentration percentage changed strongly with time (p < 0.01) for both 1.2-5 and >5 μm size ranges (Figure 4; Supplementary Table S1). The percentage of 1.2–5 μm size range decreased with time with a concomitant increase in the >5 μm size range, and the percentage was significantly different between size ranges (p < 0.01). The percentage changes tended to be significant after 36–48 h (Figure 4; Supplementary Table S2). No significant differences in eDNA percentage were found between the field water from different ecosystems (p = 0.55) at neither 1.2–5 nor >5 μm size ranges (Supplementary Figure S3). Interestingly, eDNA PSP in the control tank with Milli-Q water was dissimilar from those in all other tanks containing field water (Supplementary Figure S1), with the percentages of 1.2–5 and >5 μm size ranges being similar and barely changing over time.
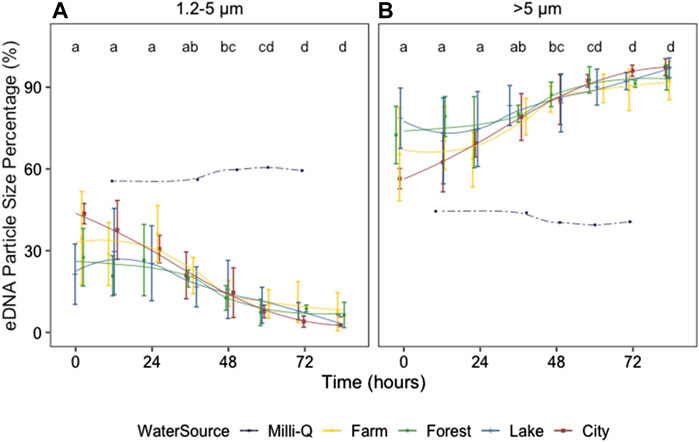
FIGURE 4. Zebrafish eDNA particle size percentages after removing the organisms at 1.2–5 (A) and >5 μm size range (B) from 0 to 84 h after removing the organisms. Colors indicate the ecosystem type of the water source. Different letters identify significant differences between sampling times according to the Dunn’s test on a Kruskal–Wallis test for all ecosystem types combined (excluding those in Milli-Q water). Error bars show the standard errors (SE). To indicate the changing trends, smooth lines were added using geom_smooth (method = loess) in R.
The two-way ANOVA indicated that the zebrafish eDNA decay rate constant demonstrated a trend towards being impacted by ecosystem type (p = 0.07, F-value = 2.7, DF = 3) which could be mainly appointed to the difference between farm and city as indicated by the post-hoc test (Supplementary Table S3), but not by the eDNA size range (p = 0.49, F-value = 0.5, DF = 1), and there was no interaction between these two factors (p = 0.8, F-value = 0.3, DF = 3). The eDNA decay rate constant decreased in the order of farm, forest, lake to city. Correspondingly, the estimated retention time showed a slight increase following the same order (Figure 5; Supplementary Table S4). The estimated decay rates of eDNA at both 1.2–5 and >5 μm size ranges in the control tank were extremely low (<0.02), consequently causing longer estimated retention times than in the field water, and was 183 and 291 h for the >5 μm and 1.2–5 μm size range, respectively.
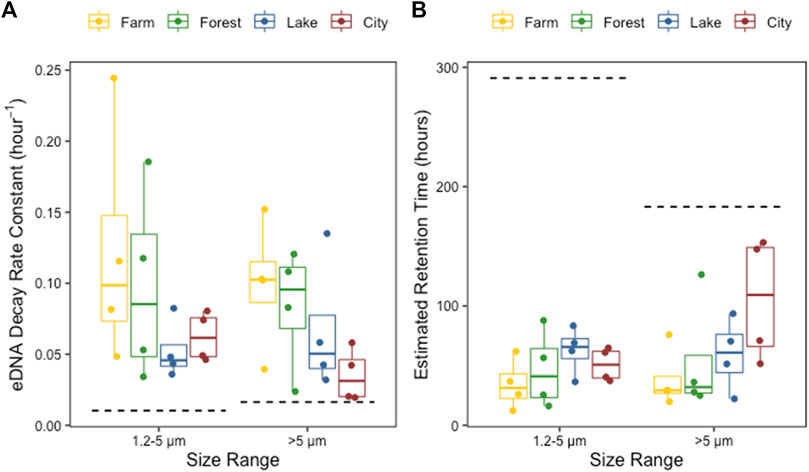
FIGURE 5. The eDNA decay rate constants (A) and the estimated retention time of eDNA (B) in the field water from farmland ditches (yellow), forest rivers (green), lakes (blue) and city rivers (red) ecosystem types, at 1.2–5 and >5 μm size range separately. The dashed lines indicate the eDNA decay rate constants (A) and the retention times of eDNA (B) in the control tank containing Milli-Q water.
The values of the four abiotic factors of each tank are shown in Supplementary Table S1. The range of pH, DO, nitrate and phosphate concentration of the field water was 7.62–8.34, 3.86–6.19 mg/L, 0.71–3.05 mg/L and 0–1.83 mg/L. Model selection on the effects of bacterial abundance (copy concentration of the 16S rRNA gene), phosphate, nitrate concentration, pH and DO on the eDNA decay constant showed that only bacterial abundance together with pH influenced eDNA decay rate (Supplementary Tables S4, S5; Figure 6). The two-way ANOVA expressing the best model suggests that, differences in pH (p < 0.01, F-value = 13.2, DF = 1) were stronger than that of bacteria concentration (p = 0.02, F-value = 5.9, DF = 1) while no interactions were found. This was supported by the one-way ANOVA tests of each variable in which only bacteria concentration and pH showed obvious impacts (p < 0.05) on the eDNA decay rate constant, rather than phosphate, nitrate concentration, or DO (Supplementary Figure S4).
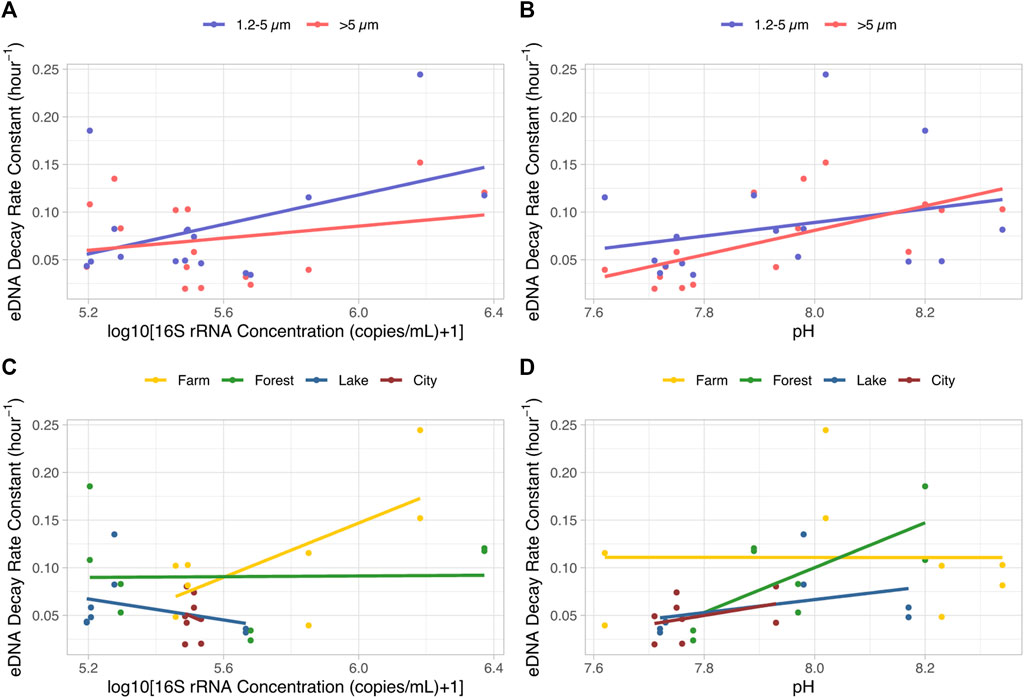
FIGURE 6. eDNA decay rate constants as affected by bacteria abundance ((A, C), log10(16S rRNA gene concentration+1)) and pH (B, D), clustered by eDNA particle size ranges (A, B) and the ecosystem types providing the source of water (C, D) The lines indicate linear regression lines for each data set.
While many studies on aquatic eDNA persistence hypothesize that eDNA degradation is strongly affected by the abundance and activity of microorganisms (Strickler et al., 2015; Salter, 2018), there is no direct evidence to support this premise so far for eDNA in natural conditions. To test this hypothesis and improve the knowledge on how bacteria influence eDNA degradation and how abiotic factors are involved in this process, we studied zebrafish eDNA decay rates of two particle size ranges in freshwater from four ecosystem types varying in bacterial abundance, phosphate, nitrate, pH and DO. This setup allowed assessing the main factors that promote eDNA degradation individually and in concert. Our findings indicate that bacterial abundance together with pH enforces aquatic eDNA degradation in water from various ecosystem types, whereas eDNA barely decays in Milli-Q water containing only a few bacteria. eDNA concentration decreases were demonstrated to be different between small and large size ranges. Consequently, the eDNA PSP of the same species was shown to change with eDNA degradation.
The effect that environmental factors have on eDNA degradation has been demonstrated to strongly impact eDNA applications in an increasing number of studies (Tsuji et al., 2017; Mächler et al., 2018; Jo et al., 2020; Jo and Minamoto, 2021; Mauvisseau et al., 2022). Previous studies indicated that pH is related to eDNA degradation (Strickler et al., 2015; Seymour et al., 2018). In our study, the pH of all tanks was greater than seven, and the eDNA decay rate showed an increase with increasing pH, which corresponds to previous studies (Strickler et al., 2015; Lance et al., 2017). While bacterial abundance was found not to affect eDNA degradation in a previous study (Tsuji et al., 2017), we observed that bacterial abundance strongly boosted the eDNA decay rate. Correspondingly, the decay rate constant in the Milli-Q water containing only a few bacteria was extremely low. It seems that bacteria promoting eDNA degradation need a certain level of nutrients to nurse their activity. Yet phosphate, nitrate, or DO show no impacts on the eDNA decay rate in the field water in this study. This may be due to the limited ranges of physical and chemical concentrations across the ecosystem types in the present study (with a possible exception for phosphate which showed more variation). Moreover, the relatively high phosphate, nitrate concentrations and relatively stable DO concentrations may have been sufficient to generally support microbial activity, thereby not limiting eDNA degradation. A final potential explanation may be that none of these individual factors may consistently limit bacterial abundance, while the combination of factors does have an effect on bacterial abundance (and through bacterial abundance on the eDNA degradation). In that light, the extremely low decay rate in the Milli-Q water in this study may be explained by the accompanying low, phosphate, nitrate, and DO values in this medium. Consequently, these environmental factors might have to be considered as contributors to a favorable environment for microbial abundance and activity, thereby supporting eDNA degradation as proposed by one previous study (Strickler et al., 2015).
In combination, these findings suggest that there was a direct effect of pH on the microbial activity which may influence the production of enzymes related to eDNA degradation, or directly affect the activity of these enzymes. eDNA present in aquatic ecosystems occurs mostly in the form of organic matters since eDNA is primarily intracellular and in organelles (Turner et al., 2014; Jo et al., 2019a; Zhao et al., 2021). Microorganisms release ecto-hydrolases, e.g., aminopeptidase and alkaline phosphatase, to decompose organic materials into small molecules which in turn can be consumed by microorganisms as nutrition (Grossart and Simon, 1998; Logue et al., 2015; Fabian et al., 2016). It is highly probable the way in which microorganisms cause eDNA degradation as in aquatic ecosystems eDNA is mostly encapsulated by organics such as cell membranes. Additionally, the microbial activity was affected by bacterial abundance (which in turn was possibly affected by the combination of local environmental conditions without one clearly limiting driver). Further studies are encouraged to monitor eDNA degradation as well as bacterial abundance, bacterial activity and where possible the associated enzymes. Once these relationships are established, eDNA persistence may be estimated and quantitatively predicted by bacterial data and measurements of environmental conditions.
Ecosystem type and accompanying abiotic factors displayed no significant influence on eDNA degradation and eDNA persistence in the current study. The stronger variation in pH, DO and nutrient levels within ecosystem types than between (with the exception of nitrate concentrations in cities) could explain this general lack of effect of ecosystem type and accompanying abiotic factors. Consequently, no eDNA degradation differences between ecosystem types were found except for a slight difference between farm and city, which may be caused by the limited number of replications. However, the significant differences in eDNA persistence between lentic, lotic and marine ecosystems reported by Harrison et al. (2019) support that ecosystems with different levels and combinations of environmental factors, could differentially affect eDNA degradation and eDNA persistence. A comprehensive understanding of eDNA degradation variation within and between ecosystems will help predict eDNA persistence thereby contributing to reducing the workload of eDNA approaches in biomonitoring.
eDNA PSD (or PSP) influences the eDNA degradation, thereby affecting eDNA persistence (Wilcox et al., 2015; Moushomi et al., 2019; Jo and Minamoto, 2021). Therefore, knowledge of potential decay rate differences between size ranges is important to explore in order to understand eDNA persistence. In the current study, both size ranges of eDNA degraded over time, resulting in a significant decrease in eDNA concentration for both size ranges. Importantly, the concentration changes at 1.2–5 μm were faster than those of the >5 μm size range. These findings were further supported by the significant interaction between time and size range. This translated into a reduction of the eDNA percentage at the 1.2–5 μm size range and a concomitant increase for the >5 μm size range. Interestingly, the zebrafish eDNA PSP in the Milli-Q water where eDNA barely decayed was largely different to those in field water, while the zebrafish eDNA PSP in our previous study was somewhere in between (Zhao et al., 2021). This indicates that eDNA PSP (or PSD) of the same species could be different depending on the abiotic and biotic (bacterial abundance) conditions, which in turn impact eDNA degradation.
The change in eDNA PSD (or PSP) with degradation may also be affected by biotic and abiotic conditions as, contrary to the present results, a decrease in the percentage of larger eDNA particle size (>10 μm refers intracellular eDNA) has been reported elsewhere (Jo et al., 2019a; Jo et al., 2019b). In these studies, faster decay rates of smaller sizes (0.8–10 μm refers to extracellular but intra-mitochondrial eDNA) may have been compensated by an influx of these smaller sizes through the degradation of larger particles, maintaining a higher PSP of the smaller sizes (Jo et al., 2019a; Jo et al., 2019b). Environmental factors (both biotic and abiotic) may explain this eDNA degradation differences between size ranges between different studies. Thus, before using eDNA PSD (or PSP) to evaluate the eDNA degradation in field studies, the relationship between eDNA degradation and eDNA PSD (or PSP) has to be established for a range of biotic and abiotic conditions.
In our study, the effects of particle size and environmental factors were independent of each other. Another study, however, showed that temperature had an impact on eDNA decay rate while interacting with eDNA particle sizes (Jo and Minamoto, 2021). In that case, the temperature may not have only impacted the activities of bacteria and enzymes, but also specific enzymes—as related to the degradation of specific size classes—more than others. This leads to the hypothesis that the structure of the eDNA particles determines what enzymes it is sensitive to, and how fast it decays under a certain temperature. Yet, what enzymes digest large or small eDNA particles and how temperature influences its activity in the field remains unknown, and might be quite essential to explore in order to improve the accuracy of eDNA methods for biomonitoring in the field.
In conclusion, we have demonstrated that bacteria abundance and pH impact aquatic eDNA decay rate in water from different ecosystems. Phosphate, nitrate, and DO did not directly influence the eDNA decay rates, suggesting that none of these factors was consistently limiting bacterial abundance or activity. The concentration of small sized eDNA (1.2–5 μm) decreased faster than of large sizes (>5 μm) in the field water, resulting in a change in eDNA PSP with degradation. This supports the ability of eDNA PSP in assessing the degree of eDNA degradation. Overall, aquatic eDNA persistence relies on the environmental conditions (mostly bacterial activity) and eDNA PSP (or PSD). The present results contribute to understanding aquatic eDNA degradation, thereby help improve the accuracy of eDNA methods by evaluating the mechanisms leading to eDNA persistence, and ultimately lead to few false-positive outcomes of species occurrences in eDNA biomonitoring. In conclusion, this improvement could benefit biomonitoring and tracing migrations, especially for rare species.
The original contributions presented in the study are included in the article/Supplementary Material, further inquiries can be directed to the corresponding author.
PB, KT, and BZ designed the experiments, analysed the data and wrote the draft of the manuscript. BZ performed the experiments. All authors contributed to the article and approved the submitted version.
The China Scholarship Council (CSC) is gratefully acknowledged for its financial support to BZ (201808310084).
We thank Guus van der Velden (IBL, Leiden University) for providing the zebrafish larva, Deyi Wang and Yusheng Jia (Naturalis, Leiden), and Chenguang Gao (CML, Leiden University) for their contribution in the water sampling, Emilie Didaskalou (CML, Leiden University) for her valuable assistance in the laboratory.
The authors declare that the research was conducted in the absence of any commercial or financial relationships that could be construed as a potential conflict of interest.
All claims expressed in this article are solely those of the authors and do not necessarily represent those of their affiliated organizations, or those of the publisher, the editors and the reviewers. Any product that may be evaluated in this article, or claim that may be made by its manufacturer, is not guaranteed or endorsed by the publisher.
The Supplementary Material for this article can be found online at: https://www.frontiersin.org/articles/10.3389/fenvs.2023.1025105/full#supplementary-material
Allan, E. A., Zhang, W. G., Lavery, A. C., and Govindarajan, A. F. (2021). Environmental DNA shedding and decay rates from diverse animal forms and thermal regimes. Environ. DNA 3, 492–514. doi:10.1002/EDN3.141
Alzaylaee, H., Collins, R. A., Shechonge, A., Ngatunga, B. P., Morgan, E. R., and Genner, M. J. (2020). Environmental DNA-based xenomonitoring for determining Schistosoma presence in tropical freshwaters. Parasit. Vectors 13, 63–11. doi:10.1186/s13071-020-3941-6
Andruszkiewicz, E. A., Sassoubre, L. M., and Boehm, A. B. (2017). Persistence of marine fish environmental DNA and the influence of sunlight. PLoS One 12, e0185043. doi:10.1371/JOURNAL.PONE.0185043
Barnes, M. A., Turner, C. R., Jerde, C. L., Renshaw, M. A., Lindsay Chadderton, W., and Lodge, D. M. (2014). Environmental conditions influence eDNA persistence in aquatic systems. Environ. Sci. Technol. 48, 1819–1827. doi:10.1021/es404734p
Bedwell, M. E., and Goldberg, C. S. (2020). Spatial and temporal patterns of environmental DNA detection to inform sampling protocols in lentic and lotic systems. Ecol. Evol. 10, 1602–1612. doi:10.1002/ece3.6014
Beentjes, K. K., Barmentlo, S. H., Cieraad, E., Schilthuizen, M., van der Hoorn, B. B., Speksnijder, A. G. C. L., et al. (2021). Environmental DNA metabarcoding reveals comparable responses to agricultural stressors on different trophic levels of a freshwater community. Mol. Ecol. 31, 1430–1443. doi:10.1111/MEC.16326
Brys, R., Halfmaerten, D., Neyrinck, S., Mauvisseau, Q., Auwerx, J., Sweet, M., et al. (2021). Reliable eDNA detection and quantification of the European weather loach (Misgurnus fossilis). J. Fish. Biol. 98, 399–414. doi:10.1111/jfb.14315
Carraro, L., Mächler, E., Wüthrich, R., and Altermatt, F. (2020). Environmental DNA allows upscaling spatial patterns of biodiversity in freshwater ecosystems. Nat. Commun. 11, 3585. doi:10.1038/S41467-020-17337-8
Collins, R. A., Wangensteen, O. S., O’Gorman, E. J., Mariani, S., Sims, D. W., and Genner, M. J. (2018). Persistence of environmental DNA in marine systems. Commun. Biol. 1, 185. doi:10.1038/s42003-018-0192-6
Deiner, K., Fronhofer, E. A., Mächler, E., Walser, J. C., and Altermatt, F. (2016). Environmental DNA reveals that rivers are conveyer belts of biodiversity information. Nat. Commun. 7, 12544–12549. doi:10.1038/ncomms12544
Delita, Z., Sabine, D., Andrea, K., and Jörg, O. (2007). Effects of plant biomass, plant diversity, and water content on bacterial communities in soil lysimeters: Implications for the determinants of bacterial diversity. Appl. Environ. Microbiol. 73, 6916–6929. doi:10.1128/AEM.01533-07
Deutschmann, B., Müller, A. K., Hollert, H., and Brinkmann, M. (2019). Assessing the fate of brown trout (Salmo trutta) environmental DNA in a natural stream using a sensitive and specific dual-labelled probe. Sci. Total Environ. 655, 321–327. doi:10.1016/j.scitotenv.2018.11.247
Djurhuus, A., Pitz, K., Sawaya, N. A., Rojas-Márquez, J., Michaud, B., Montes, E., et al. (2018). Evaluation of marine zooplankton community structure through environmental DNA metabarcoding. Limnol. Oceanogr. Methods 16, 209–221. doi:10.1002/lom3.10237
Doi, H., Takahara, T., Minamoto, T., Matsuhashi, S., Uchii, K., and Yamanaka, H. (2015). Droplet digital polymerase chain reaction (PCR) outperforms real-time PCR in the detection of environmental DNA from an invasive fish species. Environ. Sci. Technol. 49, 5601–5608. doi:10.1021/acs.est.5b00253
Eichmiller, J. J., Best, S. E., and Sorensen, P. W. (2016). Effects of temperature and trophic state on degradation of environmental DNA in lake water. Environ. Sci. Technol. 50, 1859–1867. doi:10.1021/acs.est.5b05672
Fabian, J., Zlatanovic, S., Mutz, M., and Premke, K. (2016). Fungal–bacterial dynamics and their contribution to terrigenous carbon turnover in relation to organic matter quality. ISME J. 11, 415–425. doi:10.1038/ismej.2016.131
Ficetola, G. F., Miaud, C., Pompanon, F., and Taberlet, P. (2008). Species detection using environmental DNA from water samples. Biol. Lett. 4, 423–425. doi:10.1098/RSBL.2008.0118
Fremier, A. K., Strickler, K. M., Parzych, J., Powers, S., and Goldberg, C. S. (2019). Stream transport and retention of environmental DNA pulse releases in relation to hydrogeomorphic scaling factors. Environ. Sci. Technol. 53, 6640–6649. doi:10.1021/acs.est.8b06829
Goodyear, N. (2012). Effectiveness of five-day-old 10% bleach in a student microbiology laboratory setting. Clin. Lab. Sci., 25(4):219–223. Available at: http://hwmaint.clsjournal.ascls.org/.
Grossart, H. P., and Simon, M. (1998). Bacterial colonization and microbial decomposition of limnetic organic aggregates (lake snow). Aquat. Microb. Ecol. 15, 127–140. doi:10.3354/AME015127
Harrison, J. B., Sunday, J. M., and Rogers, S. M. (2019). Predicting the fate of eDNA in the environment and implications for studying biodiversity. Proc. R. Soc. B Biol. Sci. 286, 20191409. doi:10.1098/RSPB.2019.1409
Jerde, C. L., Olds, B. P., Shogren, A. J., Andruszkiewicz, E. A., Mahon, A. R., Bolster, D., et al. (2016). Influence of stream bottom substrate on retention and transport of vertebrate environmental DNA. Environ. Sci. Technol. 50, 8770–8779. doi:10.1021/acs.est.6b01761
Jo, T., Arimoto, M., Murakami, H., Masuda, R., and Minamoto, T. (2020). Estimating shedding and decay rates of environmental nuclear DNA with relation to water temperature and biomass. Environ. DNA 2, 140–151. doi:10.1002/EDN3.51
Jo, T., Arimoto, M., Murakami, H., Masuda, R., and Minamoto, T. (2019a). Particle size distribution of environmental DNA from the nuclei of marine fish. Environ. Sci. Technol. 53, 9947–9956. doi:10.1021/acs.est.9b02833
Jo, T., and Minamoto, T. (2021). Complex interactions between environmental DNA (eDNA) state and water chemistries on eDNA persistence suggested by meta-analyses. Mol. Ecol. Resour. 21, 1490–1503. doi:10.1111/1755-0998.13354
Jo, T., Murakami, H., Yamamoto, S., Masuda, R., and Minamoto, T. (2019b). Effect of water temperature and fish biomass on environmental DNA shedding, degradation, and size distribution. Ecol. Evol. 9, 1135–1146. doi:10.1002/ece3.4802
Joseph, C., Faiq, M. E., Li, Z., and Chen, G. (2022). Persistence and degradation dynamics of eDNA affected by environmental factors in aquatic ecosystems. Hydrobiologia 849, 4119–4133. doi:10.1007/s10750-022-04959-w
Katano, I., Harada, K., Doi, H., Souma, R., and Minamoto, T. (2017). Environmental DNA method for estimating salamander distribution in headwater streams, and a comparison of water sampling methods. PLoS One 12, e0176541. doi:10.1371/journal.pone.0176541
Lance, R. F., Klymus, K. E., Richter, C. A., Guan, X., Farrington, H. L., Carr, M. R., et al. (2017). Experimental observations on the decay of environmental DNA from bighead and silver carps. Manag. Biol. Invasions 8, 343–359. doi:10.3391/mbi.2017.8.3.08
Loewen, C. J. G., Jackson, D. A., and Gilbert, B. (2022). Biodiversity patterns diverge along geographic temperature gradients. Glob. Chang. Biol. 29, 603–617. doi:10.1111/GCB.16457
Logue, J. B., Stedmon, C. A., Kellerman, A. M., Nielsen, N. J., Andersson, A. F., Laudon, H., et al. (2015). Experimental insights into the importance of aquatic bacterial community composition to the degradation of dissolved organic matter. ISME J. 10, 533–545. doi:10.1038/ismej.2015.131
Mächler, E., Osathanunkul, M., and Altermatt, F. (2018). Shedding light on eDNA: Neither natural levels of UV radiation nor the presence of a filter feeder affect eDNA-based detection of aquatic organisms. PLoS One 13, e0195529. doi:10.1371/JOURNAL.PONE.0195529
Maruyama, A., Nakamura, K., Yamanaka, H., Kondoh, M., and Minamoto, T. (2014). The release rate of environmental DNA from juvenile and adult fish. PLoS One 9, e114639. doi:10.1371/journal.pone.0114639
Mauvisseau, Q., Davy-Bowker, J., Bulling, M., Brys, R., Neyrinck, S., Troth, C., et al. (2019). Combining ddPCR and environmental DNA to improve detection capabilities of a critically endangered freshwater invertebrate. Sci. Rep. 9, 14064. doi:10.1038/s41598-019-50571-9
Mauvisseau, Q., Harper, L. R., Sander, M., Hanner, R. H., Kleyer, H., and Deiner, K. (2022). The multiple states of environmental DNA and what is known about their persistence in aquatic environments. Environ. Sci. Technol. 56, 5322–5333. doi:10.1021/acs.est.1c07638
McCartin, L. J., Vohsen, S. A., Ambrose, S. W., Layden, M., McFadden, C. S., Cordes, E. E., et al. (2022). Temperature controls eDNA persistence across physicochemical conditions in seawater. Environ. Sci. Technol. 56, 8629–8639. doi:10.1021/acs.est.2c01672
Mentzer, J. L., Goodman, R. M., and Balser, T. C. (2006). Microbial response over time to hydrologic and fertilization treatments in a simulated wet prairie. Plant Soil 284, 85–100. doi:10.1007/s11104-006-0032-1
Miotke, L., Lau, B. T., Rumma, R. T., and Ji, H. P. (2014). High sensitivity detection and quantitation of DNA copy number and single nucleotide variants with single color droplet digital PCR. Anal. Chem. 86, 2618–2624. doi:10.1021/ac403843j
Moushomi, R., Wilgar, G., Carvalho, G., Creer, S., and Seymour, M. (2019). Environmental DNA size sorting and degradation experiment indicates the state of Daphnia magna mitochondrial and nuclear eDNA is subcellular. Sci. Rep. 9, 12500. doi:10.1038/s41598-019-48984-7
Murchie, T. J., Karpinski, E., Eaton, K., Duggan, A. T., Baleka, S., Zazula, G., et al. (2022). Pleistocene mitogenomes reconstructed from the environmental DNA of permafrost sediments. Curr. Biol. 0, 851–860.e7. doi:10.1016/j.cub.2021.12.023
Nathan, L. M., Simmons, M., Wegleitner, B. J., Jerde, C. L., and Mahon, A. R. (2014). Quantifying environmental DNA signals for aquatic invasive species across multiple detection platforms. Environ. Sci. Technol. 48, 12800–12806. doi:10.1021/es5034052
Rothrock, M. J., Hiett, K. L., Kiepper, B. H., Ingram, K., and Hinton, A. (2013). Quantification of zoonotic bacterial pathogens within commercial poultry processing water samples using droplet digital PCR. Adv. Microbiol. 03, 403–411. doi:10.4236/aim.2013.35055
Salter, I., Joensen, M., Kristiansen, R., Steingrund, P., and Vestergaard, P. (2019). Environmental DNA concentrations are correlated with regional biomass of Atlantic cod in oceanic waters. Commun. Biol. 2, 461. doi:10.1038/s42003-019-0696-8
Salter, I. (2018). Seasonal variability in the persistence of dissolved environmental DNA (eDNA) in a marine system: The role of microbial nutrient limitation. PLoS One 13, e0192409. doi:10.1371/journal.pone.0192409
Sassoubre, L. M., Yamahara, K. M., Gardner, L. D., Block, B. A., and Boehm, A. B. (2016). Quantification of environmental DNA (eDNA) shedding and decay rates for three marine fish. Environ. Sci. Technol. 50, 10456–10464. doi:10.1021/acs.est.6b03114
Seymour, M., Durance, I., Cosby, B. J., Ransom-Jones, E., Deiner, K., Ormerod, S. J., et al. (2018). Acidity promotes degradation of multi-species environmental DNA in lotic mesocosms. Commun. Biol. 1, 4. doi:10.1038/S42003-017-0005-3
Strickler, K. M., Fremier, A. K., and Goldberg, C. S. (2015). Quantifying effects of UV-B, temperature, and pH on eDNA degradation in aquatic microcosms. Biol. Conserv. 183, 85–92. doi:10.1016/j.biocon.2014.11.038
Taberlet, P., Coissac, E., Hajibabaei, M., and Rieseberg, L. H. (2012). Environmental DNA. Mol. Ecol. 21, 1789–1793. doi:10.1111/J.1365-294X.2012.05542.X
Thomsen, P. F., and Willerslev, E. (2015). Environmental DNA – an emerging tool in conservation for monitoring past and present biodiversity. Biol. Conserv. 183, 4–18. doi:10.1016/J.BIOCON.2014.11.019
Tsuji, S., Ushio, M., Sakurai, S., Minamoto, T., and Yamanaka, H. (2017). Water temperature-dependent degradation of environmental DNA and its relation to bacterial abundance. PLoS One 12, e0176608. doi:10.1371/journal.pone.0176608
Turner, C. R., Barnes, M. A., Xu, C. C. Y., Jones, S. E., Jerde, C. L., and Lodge, D. M. (2014). Particle size distribution and optimal capture of aqueous macrobial eDNA. Methods Ecol. Evol. 5, 676–684. doi:10.1111/2041-210X.12206
van Bochove, K., Bakker, F. T., Beentjes, K. K., Hemerik, L., Vos, R. A., and Gravendeel, B. (2020). Organic matter reduces the amount of detectable environmental DNA in freshwater. Ecol. Evol. 10, 3647–3654. doi:10.1002/ECE3.6123
Wilcox, T. M., McKelvey, K. S., Young, M. K., Lowe, W. H., and Schwartz, M. K. (2015). Environmental DNA particle size distribution from Brook Trout (Salvelinus fontinalis). Conserv. Genet. Resour. 7, 639–641. doi:10.1007/s12686-015-0465-z
Willerslev, E., Hansen, A. J., Binladen, J., Brand, T. B., Gilbert, M. T. P., Shapiro, B., et al. (2003). Diverse plant and animal genetic records from holocene and pleistocene sediments. Science 300, 791–795. doi:10.1126/science.1084114
Wood, S. A., Biessy, L., Latchford, J. L., Zaiko, A., von Ammon, U., Audrezet, F., et al. (2020). Release and degradation of environmental DNA and RNA in a marine system. Sci. Total Environ. 704, 135314. doi:10.1016/j.scitotenv.2019.135314
Zhao, B., van Bodegom, P. M., and Trimbos, K. (2021). The particle size distribution of environmental DNA varies with species and degradation. Sci. Total Environ. 797, 149175. doi:10.1016/J.SCITOTENV.2021.149175
Keywords: ddPCR, dissolved oxygen, nitrate, particle size proportion, phosphate
Citation: Zhao B, van Bodegom PM and Trimbos KB (2023) Bacterial abundance and pH associate with eDNA degradation in water from various aquatic ecosystems in a laboratory setting. Front. Environ. Sci. 11:1025105. doi: 10.3389/fenvs.2023.1025105
Received: 22 August 2022; Accepted: 28 July 2023;
Published: 07 August 2023.
Edited by:
Felipe Polivanov Ottoni, Federal University of Maranhão, BrazilReviewed by:
Francesco Pomati, Swiss Federal Institute of Aquatic Science and Technology, SwitzerlandCopyright © 2023 Zhao, van Bodegom and Trimbos. This is an open-access article distributed under the terms of the Creative Commons Attribution License (CC BY). The use, distribution or reproduction in other forums is permitted, provided the original author(s) and the copyright owner(s) are credited and that the original publication in this journal is cited, in accordance with accepted academic practice. No use, distribution or reproduction is permitted which does not comply with these terms.
*Correspondence: Beilun Zhao, Yi56aGFvQGNtbC5sZWlkZW51bml2Lm5s
Disclaimer: All claims expressed in this article are solely those of the authors and do not necessarily represent those of their affiliated organizations, or those of the publisher, the editors and the reviewers. Any product that may be evaluated in this article or claim that may be made by its manufacturer is not guaranteed or endorsed by the publisher.
Research integrity at Frontiers
Learn more about the work of our research integrity team to safeguard the quality of each article we publish.