
95% of researchers rate our articles as excellent or good
Learn more about the work of our research integrity team to safeguard the quality of each article we publish.
Find out more
ORIGINAL RESEARCH article
Front. Environ. Sci. , 15 March 2023
Sec. Freshwater Science
Volume 11 - 2023 | https://doi.org/10.3389/fenvs.2023.1015623
This article is part of the Research Topic Freshwater Science in Africa View all 10 articles
 Frank O. Masese1,2*
 Elizabeth W. Wanderi1,3
 Kobingi Nyakeya4
 Alfred O. Achieng1
 Kelly Fouchy5
 Michael E. McClain5,6
Many streams and rivers outside conservation areas across the Afrotropics face multiple stressors from land use change, urbanization, and excessive water withdrawals. Thus, there is a need to develop cost-effective tools for assessing and monitoring ecological changes to inform management decisions. Studies utilizing macroinvertebrate communities as indicators of the ecological condition of streams and rivers in the Afrotropics use diverse methods, including diversity, richness, biotic and multimetric indices. However, some of these indices are region- or country-specific, which limits their general use across multiple regions or countries. In this study, we address this challenge by testing and comparing the performance of diversity and richness indices (e.g., Shannon-Wiener and Simpson), regional biotic indices (the African Scoring System Version 5 [SASS5], Tanzanian River Scoring System [TARISS] and a biotic index developed for the Ethiopian highlands [ETHbios]), and a macroinvertebrate-based index of biotic integrity (M-IBI) in assessing the ecological condition of Afrotropical rivers with the transboundary Mara River, Kenya and Tanzania, as a case study. In this study, we analyzed water and habitat quality degradation caused by multiple stressors such as land use change, organic pollution and flow alteration and the corresponding responses in macroinvertebrate communities. We utilized macroinvertebrates data collected from 143 sites covering the entire gradient of the river and its major tributaries in Kenya and Tanzania. To develop the M-IBI, we used 12 metrics that describe macroinvertebrate community richness, composition, tolerance to disturbances (indicator taxa), and the composition of functional feeding groups. Although all the biotic indices were sensitive to poor water quality and human disturbance of the river, the M-IBI performed better than biotic indices (SASS5, Tanzanian River Scoring System, and Ethiopian highlands), diversity and richness indices by having a higher discriminatory ability of site categories according to different levels and types of disturbance. Diversity and richness indices performed poorly and failed to discriminate between stressor gradients in the river. This study demonstrates a need for testing and evaluating indices or protocols before adoption and use in biomonitoring streams and rivers in other countries and regions. There is an even greater need to assess the tolerance of macroinvertebrate taxa before inclusion in biotic indices for improved performance as discriminators of multiple stressors.
As frontiers and enablers of human civilization and development, freshwater ecosystems bear the most visible imprints of the Anthropocene (Dudgeon et al., 2006; Strayer and Dudgeon, 2010; Vörösmarty et al., 2010; Reid et al., 2019). Although inland waters in the Afrotropics are rich in biodiversity and endemism, they are some of the most threatened freshwater ecosystems in the world (Darwall and Freyhof, 2016; Barlow et al., 2018; Sayer et al., 2018). Streams and rivers are increasingly threatened by deforestation, habitat fragmentation, sedimentation, flow regulation (dam construction), urbanization, excessive water withdrawals, water pollution and biological invasions (Getahun and Stiassny, 1998; McClain et al., 2014; Fugère et al., 2016; Grill et al., 2019; Seeteram et al., 2019).
Identifying the major anthropogenic threats in aquatic ecosystems and understanding how biological communities respond to the changes is essential in developing bioassessment protocols for streams and rivers. Monitoring programs prefer biological indicators because they integrate both spatial (small- and large-scale) and temporal (short- and long-term) human disturbances (Karr and Dudley, 1981; Davies and Jackson, 2006; Hughes, 2019). Development of bioassessment or biomonitoring protocols involves determining the effects of pollution and other disturbances, whether natural or human-induced, on the presence or absence of species from a site or changes in species composition following disturbance (Barbour et al., 1999). The presence or absence data are used to assign tolerance scores or sensitivity weightings to the various species or taxa, with highly sensitive taxa assigned a high weighting. In contrast, highly tolerant taxa are assigned a low weighting. Biomonitoring assists in identifying regional biotic attributes and patterns, as well as potential sources and causes of degradation. It can also be used to detect and assess cumulative impacts and evaluate the effectiveness of pollution control and remediation activities (Barbour et al., 1999; Hering et al., 2006). Biomonitoring protocols and programs form part of the regular monitoring and managing of water quality and river health in riverine ecosystems worldwide (Buss et al., 2015). Compared to biological indicators, assessments of water chemistry, physical habitat structure, and landscape or riverscape condition usually explain less than half the variability in biological conditions and are extremely sensitive to sampling efforts and natural variability (USEPA, 2016; Hughes, 2019).
Biological communities have been used to assess the ecological status of many ecosystem types globally (Mangadze et al., 2016; Vadas et al., 2022; Ofogh et al., 2023). Although limited in comparison to other continents (e.g., Herman and Nejadhashemi, 2015; Ruaro et al., 2020; Feio et al., 2021; Vadas et al., 2022), several studies have used biological communities to study the condition of streams and rivers in Africa. These studies use heterogeneity (richness) and diversity indices (Odume and Muller, 2011; Olawusi-Peters and Ajibare, 2014; Soko and Gyedu-Ababio, 2015; Arimoro and Keke, 2017; Masese et al., 2020), regional or country-specific biotic indices (Dickens and Graham, 2002; Aschalew and Moog, 2015; Kaaya et al., 2015; Dallas et al., 2018; Musonge et al., 2020) and multimetric indices (Odume et al., 2012; Mereta et al., 2013; Lakew and Moog, 2015; Edegbene 2021; Edegbene et al., 2019; Tampo et al., 2020; Edegbene et al., 2022; Kaboré et al., 2022). Diversity indices provide a numerical measure of species diversity in a community based on composition and structure other than the number of species, while richness or heterogeneity indices are an indicator of the relative diversity of species in a community (Mouchet et al., 2010; Magurran, 2013). The use of diversity and richness indices as a measure of ecological condition assumes that their values decrease with environmental degradation and can reveal community compositional differences among sites or over time in response to disturbances (Lake, 2000; Ives and Carpenter, 2007; Sundstrom et al., 2017). In contrast, biotic indices employ the sensitivity values of different taxa in a community to develop an overall score of the ecological condition depending on the level of disturbance (Washington, 1984; Chessman and McEvoy, 1997; Dallas, 2021). The basis of biotic indices is the presence or absence of taxa (species, genus, family) in response to the severity of a particular stressor (Junior et al., 2015). Examples of macroinvertebrate-based biotic indices in Africa include the South African Scoring System Version 5 (SASS5; Dickens and Graham, 2002), the Tanzania River Scoring System (TARISS; Kaaya et al., 2015) and the biotic score (ETHbios) developed for the Ethiopian highlands (Aschalew and Moog, 2015).
Compared to species diversity, richness, and biotic indices, multimeric indices (MMIs) integrate a community’s biological attributes or metrics into a single index that is responsive to different forms of disturbance (Karr, 1981; Hughes et al., 1998; USEPA, 2016). In this regard, a community attribute or metric is defined as a calculated term or enumeration representing some aspect of biological assemblage structure, function or other measurable characteristics that changes predictably with human influence (Barbour et al., 1995). MMIs are effective for biomonitoring because they are better at identifying and discriminating the effects of different stressors on ecological conditions (Hering et al., 2006; Lunde and Resh, 2012). They are considered one of the best cost-effective methods for biomonitoring aquatic ecosystems (Bonada et al., 2006; Ruaro and Gubiani, 2013). Because of their popularity, published literature reviews have shown that MMIs have been used to evaluate water quality and the overall ecological integrity of aquatic ecosystems globally (Resh and Jackson, 1993; Buss et al., 2015; Herman and Nejadhashemi, 2015; Ruaro et al., 2020; Eriksen et al., 2021). In Africa, macroinvertebrate- and fish-based MMIs have been developed and used in different regions, including eastern Africa (e.g., Masese et al., 2009a; Aura et al., 2010; Raburu and Masese, 2012; Achieng et al., 2021), southern Africa (e.g., Hocutt et al., 1994; Kleynhans, 1999; Odume et al., 2012) and western Africa (e.g., Hugueny et al., 1996; Thorne and Williams, 1997; Toham and Teugels, 1999; Tampo et al., 2020; Kaboré et al., 2022).
Despite the broad use of diversity, richness, biotic and multimetric indices in the African continent, studies that compare the efficacy and applicability of these different indices in assessing water quality and the overall ecological condition of streams and rivers are limited. Specifically, most biotic and multimeric indices have not been standardized or tested for evaluating aquatic ecosystems beyond regions or countries where they were first developed (Masese et al., 2013; Mangadze et al., 2019; Dallas, 2021). Additionally, most countries in Africa lack a legal provision for the use of biological criteria as a basis for assessing the condition of surface waters at the national level, which would require defining and standardizing biomonitoring protocols or tools used for this purpose (Dallas, 2021; Masese et al., 2022). Nevertheless, biotic indices and MMIs based on benthic macroinvertebrates are growing across the continent, with some being used without testing and validation. For instance, while SASS was developed for assessing water quality and the ecological condition of South African rivers (Dallas, 1997; Chutter, 1998; Dickens and Graham, 2002), version five of SASS (SASS5) has been applied without modification in other countries in southern and eastern Africa, including Zimbabwe (Bere and Nyamupingidza, 2014; Mwedzi et al., 2016), Swaziland (Mthimkhulu et al., 2004) and Kenya (Oigara and Masese, 2017; Mbaka et al., 2014; M’Erimba et al., 2014). Similarly, TARISS, which is a modified version of SASS5 developed for assessing streams and rivers in Tanzania, has recently been applied in Rwanda (Dusabe et al., 2019) and Uganda (Tumusiime et al., 2019; Turibamwe and Wangalwa, 2020; Ochieng et al., 2021) without modifications. Similarly, while some MMIs have been tested and validated for monitoring of some of the African aquatic ecosystems (e.g., Raburu and Masese, 2012; Moges et al., 2016; Tampo et al., 2020; Achieng et al., 2021; Kaboré et al., 2022), some have been used without validation, including Toham and Teugels (1999), Masese et al. (2009a), Aura et al. (2010), Alemu et al. (2018) and Aura et al. (2021). This means that these biotic indices and MMIs must be tested for performance and validated before being used widely to assess the ecological conditions of streams and rivers across the African continent (e.g., Bere and Nyamupingidza, 2014; Musonge et al., 2020).
By offering various responses to multiple stressors, macroinvertebrates are among the most widely used bioindicator organisms in streams and rivers (Barbour et al., 1999; Raburu, 2003; Birk et al., 2012; Carter et al., 2017; Ruaro et al., 2020). In addition, macroinvertebrates have many practical advantages for bioassessments, including a wide distribution in most streams and rivers, ease of sampling and identification at the family level, and the sampling equipment is relatively inexpensive (Rosenberg and Resh, 1993; Barbour et al., 1999; Bonada et al., 2006). However, in the Afrotropics, high-elevation, low-order streams have a very low diversity of fishes (Kleynhans, 1999; Mangadze et al., 2016; Raburu et al., 2022), which is the alternative bioindicator group for use in river ecosystems (Barbour et al., 1999). This low diversity of fishes makes macroinvertebrates the only best alternative available biotic group for biomonitoring headwater or high-elevation streams.
In this study, we tested the applicability and performance of diversity and richness indices, regional biotic indices, and a macroinvertebrates-based index of biotic integrity (M-IBI) to assess the influence of multiple stressors on the ecological condition of the Afromontane-savanna Mara River in Kenya/Tanzania. We focused on the Mara River as a case study because it is transboundary between Kenya and Tanzania. The river also experiences multiple stressors arising from land use change, soil erosion and nutrient runoff from farmlands and grazing areas, excessive water withdrawals, organic matter and nutrient input by livestock and large wildlife, human waste from urban settlements and tourism establishments, and mercury from artisanal gold mining in the lower basin. The specific objectives were to; 1) determine structural responses in macroinvertebrates to changes in water quality across different land uses and stressors in the river, 2) use regional indices (ETHbios, SASS5 and TARISS) and macroinvertebrate index of biotic integrity (M-IBI) to assess the ecological condition of different sites in the river, and 3) compare the sensitivity of the different groups of indices (diversity and richness indices, biotic indices and the M-IBI or MMI) as indicators of water quality and ecological condition of the river.
This study was conducted in the Mara River basin (Figure 1). The river originates from the Mau Escarpment and Loita Hills in Kenya and drains into Lake Victoria in Tanzania. In the headwater, the Mara River drain remnants of tropical broadleaf forests interspersed with plantations of tea and mixed agriculture (crop farming and livestock rearing). Until the middle of the past century, the river basin was covered by extensive Afromontane forests in its headwaters and a mixture of shrublands and grasslands throughout its middle and lower reaches (Mati et al., 2008). However, extensive loss of the native forests, grasslands and shrublands to human settlements, agricultural and grazing lands has occurred over the years resulting in reduced coverage of natural vegetation in the basin (Serneels et al., 2001; Mati et al., 2008; Mango et al., 2011). The land use changes have resulted in 27% reduction in grasslands and shrublands, 32% reduction in forest cover, and 203% increase in agriculture (Mati et al., 2008).
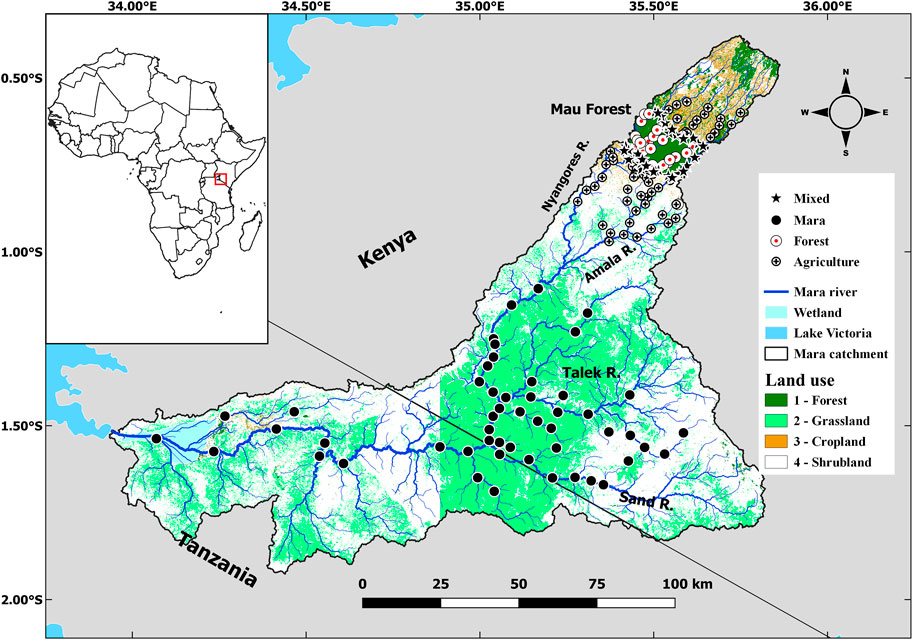
FIGURE 1. Map of the Mara River catchment showing the position of the sampling sites.
The Mara River basin transcends varying climatic conditions that range from the humid uplands, and the sub-humid upper middle reaches on the slopes and base of the Mau Escarpment, and the semi-arid middle and lower reaches in Kenya and Tanzania. Two perennial tributaries, the Nyangores and Amala, drain the humid and sub-humid uplands and join to form the Mara River mainstem (Figure 1). In the middle and lower reaches, all tributaries draining the grasslands and shrublands are ephemeral, including the Talek and Sand Rivers, despite their extensive drainage basins. The Talek and Sand Rivers drain the Kenyan part before the Mara River crosses into Tanzania. In Tanzania, most tributaries draining the Serengeti grasslands and adjoining areas are seasonal, including the Gurubi, Nyarwera, Nyarusondobiro, Tobora, Somoche and Tigithe. The Tigithe River is the last of the major tributaries in the lower reaches that join the Mara River before entering the extensive rivermouth wetland and is one of the most impacted by gold mining activities.
On the Mau Escarpment, the climate is cooler and seasonal due to the high altitude, characterized by two dry and wet seasons. The amount of rainfall varies across the basin depending on altitude, with the highlands receiving around 2,000 mm of rain per annum (pa) while the lowlands receive around 1,000 mm pa (Camberlin et al., 2009). Dry conditions are experienced during January-March and wet conditions during March-July and October-November, which are periods for the “long rains” and “short rains,” respectively. However, variations sometimes occur at the onset and end of the rainy and dry periods. Potential evapotranspiration varies between 1,400 mm in the highlands to 1,800 mm in the lowlands (Jackson and McCarter, 1994).
The Mara River is one of the most important rivers in east Africa as the only permanent water source for large wildlife in the Serengeti - Mara Ecosystem in northern Tanzania and southern Kenya. It acts as a signpost for wildebeests that cross the river multiple times during their annual migrations (Gereta et al., 2009; Holdo et al., 2009). The Mara River basin also supports over one million people, with over 60% directly reliant on the river for watering their livestock and domestic water supply (Hoffman et al., 2011). The basin is also ecologically diverse, with the wetter upper reaches supporting Afromontane forests and mixed but intensive agriculture of both livestock and subsistence crops. In contrast, the drier middle reaches outside conservation areas support both small- and large-scale cultivation of subsistence and cash crops and livestock grazing. However, pressures on the conservation areas both in the headwater and middle reaches are high, and there is evidence that the changing land use has had significant effects on water quality and the natural flow regime of the river and its tributaries (Melesse et al., 2008; Kilonzo, 2014; McClain et al., 2014).
A total of 143 sites were sampled in this study. The sites cover the Mara River and its tributaries in Kenya and Tanzania. Most of the sites have been sampled before for other ecological studies, and these provided some of the historical data used in this study (Minaya et al., 2013; Masese et al., 2014a; Masese et al., 2014b; Kilonzo, 2014; McClain et al., 2014). Additional sites were selected along the Talek and Sand Rivers in Kenya, and other tributaries in Tanzania for sampling to represent the basin’s highly hydrologically variable and modified streams and river reaches.
Sites were grouped into four site categories depending on the percentages of the forest, and agricultural land uses and levels of stressors they were experiencing. The percentages of forest, grasslands, and agricultural land use in the entire catchment upstream of the sampling sites were calculated based on the Digital Elevation Model of Kenya (90 m by 90 m), obtained from the Shuttle Radar Topography Mission (Masese et al., 2017; Wanderi et al., 2022). Sub-catchments were delineated, and the area of each major land use category upstream of each sampling site was calculated. Forest (FOR) and agriculture (AGR) sites drained catchments with the proportion of catchment land use under forestry and agriculture >60%, respectively. Mixed (MIX) sites did not meet the catchment land use criteria for GRAS and AGR sites and had an intermediate mixture of two or three major land use types. The sites were grouped into four site categories that were; 1) Forested sites (FOR), which represented minimally disturbed sites in forested areas that acted as a reference for the rest of the sites, 2) Agricultural sites (AGR) that were located in agricultural areas, 3) Mixed sites (MIX) were located in catchments draining forested and agricultural land uses, and 4) Mara sites (MARA) were located in the Mara River mainstem and tributaries where the stressors were flow variation, loading of organic matter and nutrients and trampling by livestock and large wildlife (mainly hippopotami). FOR sites in the Mau Forest Complex in the headwaters of the Amala and Nyangores rivers were used as reference sites. Along FOR streams, the riparian corridor was largely intact, with a mixture of indigenous vegetation throughout the catchment. Compared to AGR sites, water quality in FOR streams was less turbid even immediately after storm events.
We sampled sites during the dry season in January-March and July-August and the wet season in April-June and October-December from 2012 to 2018. During the dry season, water flow levels were significantly low, with low turbidity, and there was more excellent bed stability. Sampling habitats were also more distinguishable and accessible, and macroinvertebrates were most abundant but not necessarily in terms of taxa richness (Melo and Froehlich, 2001; Hughes and Peck, 2008). As opposed to the dry season, the wet season flows were fast and deep, and the water was more turbid. The deep water and fast flows made it challenging to access some of the permanent habitats in the middle of the large rivers for macroinvertebrates sampling. This meant that in some cases, the biotopes sampled were recently inundated, resulting in low abundances of macroinvertebrates.
The water chemistry and physical variables measured included physical measures, nutrients, and major ions. The data on physical measures had river width, depth, discharge, pH, dissolved oxygen (DO), temperature, electrical conductivity, turbidity, and total suspended solids (TSS). In situ, water quality physico-chemical parameters were measured using portable probes (YSI multi-probe water quality meter (556 MPS, Yellow Springs Instruments, Ohio, United States). They include pH, dissolved oxygen (DO) concentration, temperature, and electrical conductivity. Turbidity was measured using a portable Hach turbidity meter (Hach Company, 2100P ISO Turbidimeter, United States). Water samples were collected from the thalweg using acid-washed HDP bottles to analyse nutrients, dissolved organic carbon (DOC), and major ions. For total suspended solids (TSS), water samples were filtered immediately through pre-weighed and pre-combusted glass-fibre filters (Whatman GF/F, pre-combusted at 450°C, 4 h). GF/F filters holding suspended matter were carefully folded and wrapped in aluminium foils before transport in a cooler box at 4°C to the laboratory. The filtered and unfiltered water samples were stored and transported in a cooler box and kept frozen until analysis.
The nutrients measured in the laboratory included TSS, DOC, ammonium (NH4+), nitrates (
Within each sampling site, representative river reaches were selected for macroinvertebrates sampling. Each sampling site provided a range of biotopes (riffles, pools, marginal vegetation) with varying velocities, depths and substrate types that ranged from gravel, sand, and mud (GSM) to boulders and bedrock. Sampled biotopes ranged from GSM, stones-in-current and stones-out-of-current (STONES) and aquatic and marginal vegetation (VEG) (Dickens and Graham, 2002; Dallas, 2007).
We used sampling methods in the South African Scoring System Version 5 (SASS5; Dickens and Graham, 2002) and Tanzanian River Scoring System (TARISS; Kaaya et al., 2015). The sampling methods in these two biotic indices are similar and use the SASS net, a modified kick net measuring 300 mm by 300 mm with a mesh size of 1,000 μm. Several biotopes were sampled within a prescribed time limit and/or areal coverage. The stones-inside-current (SIC) and bedrock were searched (“kicked”) for 2–5 min. Similarly, stones-out-of-current (SOOC) and bedrock were searched for 1 min. The SIC and SOOC samples were combined into a “Stones” (STONES) sample. Suitable stretches covering 2 m2 of marginal vegetation (SIC and OOC) were swept as well as aquatic vegetation covering 1 m2. This represented the VEG sample. Gravel, sand, and mud (GSM sample) were stirred and swept for 1 min and checked for macroinvertebrates. Hand-picking and visual observation was also employed for 1 min, and biotopes with macroinvertebrates were recorded. Scoring was done for 15 min per biotope but stopped when no new taxa were seen after 5 min. As a modification to the SASS procedure, all samples from the three habitats, Stones, GSM and Vegetation, were preserved in formalin in separate containers and taken to the laboratory for further processing and enumeration of individuals of the various taxa. These data were needed for statistical analyses of the macroinvertebrate samples.
In the laboratory, macroinvertebrate samples were sorted, enumerated, and identified to the lowest taxon level possible, mainly family level. Many taxonomic keys were used, such as Gerber and Gabriel (2002), Day and de Moor (2002a), Day and de Moor (2002b), de Moor et al. (2003a), de Moor et al. (2003b) and Merritt and Cummins (2008).
Data on macroinvertebrates samples collected were pooled for each sampling site per season to analyze various indices. Community composition was summarized for each sampling site using the number of species (S), the total number of individuals (N), richness and diversity indices, and the relative abundance of each taxon. Several site-level diversity and richness indices were calculated by separately summing species-specific abundances across biotopes for each season. The Shannon index (H′) was used as a measure of diversity (Shannon, 1948), and an associated H′/H′max index (Pielou, 1975) was used for evenness. The reciprocal form of the Simpson Index (1/Ds) (Simpson, 1949) was used as a measure of community richness. We used Hill’s number (i.e., gamma diversity; Hill, 1973) and Fisher’s alpha (Fisher et al., 1943) as extra measures of community diversity. Hill’s number was calculated as the ratio between H′ and 1/Ds. Other diversity indices calculated included Brillouin’s (Brillouin, 1956), Menhinick’s (Menhinick, 1964), Margalef’s (Margalef, 1958), Equitability (Lloyd and Ghelardi, 1964), Berger-Parker (Berger and Parker, 1970), and Chao-1 (Chao, 1984).
These indices were used to measure different aspects of macroinvertebrate diversity in the river. The first group of indices consists of dominance and evenness indices, which are sensitive to the abundance of the most common species rather than species richness (Simpson, Berger-Parker, Chao1, evenness and equitability). The second group consists of diversity and richness indices, focusing on the number of species in relation to the number of individuals (Fisher, Hill, Margalef and Menhinick); and lastly, indices based on information theory, which takes into consideration evenness and species richness components of diversity (Shannon and Brillouin).
We used SASS5 (Dickens and Graham, 2002), TARISS (Kaaya et al., 2015) and the ETHbios biotic index, which was developed to assess ecological conditions in the highlands of Ethiopia (Aschalew and Moog, 2015), to evaluate the ecological conditions of the sampled study sites. For SASS5 and TARISS, we identified macroinvertebrate specimens in the field to the family or higher levels per the protocols. Taxa that were identified in the field and recorded in the SASS5 Score sheet, and the total abundances estimated for each taxa (Dickens and Graham, 2002; Kaaya et al., 2015). The SASS5 and TARISS Score and their associated average score per taxon (ASPT) were used to characterize macroinvertebrates at each site (Dickens and Graham, 2002). For ETHbios, the list of taxa encountered at each site was subjected to the sensitivity scores developed for Ethiopian highlands to obtain the total ETHbios score and its related ASPT.
Community composition data at the site level were also used to develop a macroinvertebrate index of biotic integrity (M-IBI) for the Mara River. Metrics for the index were selected following the performance on range, responses to changes in water quality, redundancy with other metrics, signal-to-noise ratio (repeatability), seasonal stability and ecological significance (Kurtz et al., 2001; Klemm et al., 2003). We eliminated candidate metrics that failed a test from additional consideration and testing. In the range test, we required that the difference between the value of a metric was >10 for percentage or proportion metrics and >5 for taxa richness or diversity metrics. Regarding the response to water quality changes, metrics were required to correlate with at least one of the water quality physico-chemical variables. Redundancy in the remaining metrics was evaluated using Spearman correlation coefficients and visual inspection of scatter plots. Metrics with a correlation coefficient r ≥ 0.85 were considered redundant, and only one was selected for inclusion in the final M-IBI (Hughes et al., 1998).
We used the signal-to-noise ratio (S/N) to assess the reproducibility of metrics, i.e., to ensure that between-site differences in metrics are caused by differences in site conditions rather than by sampling variation within a site (Stoddard et al., 2008). The S/N is the ratio of variance among sites (signal) to the variance of repeated visits at the same site (noise; repeated seasonal sampling of the same site in our case) (Kaufmann et al., 1999; Stoddard et al., 2008; Stevenson et al., 2013). To represent the S/N ratio, we used the F-ratios in an analysis of variance to evaluate a metric’s ability to discriminate differences among sampling sites over the “noise” of measurement variation (Kaufmann et al., 1999). We used one-way ANOVA to calculate F-ratio and to calculate S/N as follows:
Where F is the ratio between the F in one-way ANOVA among sites and F in one-way ANOVA within sites, and C1 is a constant varying between one and r, the number of times the repeat-sample sites are visited (Neter and Wasserman, 1974). Metrics with higher S/N have greater reproducibility and serve as reliable indicators of differences in condition among sites (Esselman et al., 2013). Metrics with S/N higher than two (2) were retained for further consideration (Stoddard et al., 2008). A low S/N ratio indicated that a metric didn’t distinguish well among sites.
Seasonal stability in metrics was evaluated by box-and-whisker plots, whereby those metrics that failed to discriminate the reference and disturbed site categories during both the dry and wet seasons in different years were eliminated from further consideration. Metrics were also included in the final M-IBI following their proven utility in previous multimetric indices developed in the region (e.g., Masese et al., 2009a; Raburu et al., 2009a; Aura et al., 2010). The metrics fall into five categories that describe taxa richness, community composition, tolerance of the various taxa to disturbances (indicator individuals or taxa), and functional feeding groups. Metrics sensitive to changes in substrate type or quality, channel stability and flow variation were also selected for inclusion in the M-IBI for the Mara River.
Differences in water quality physico-chemical variables among the four condition categories were explored separately for each season using One-way Kruskal-Wallis ANOVA. The ability of the different macroinvertebrate indices (diversity, richness, biotic and multimetric) to discriminate among the four site or condition categories was explored using box-and-whisker (box) plots. We defined separation power as the degree of overlap between boxes (i.e., 25th and 75th quartiles) in box plots of the values of the indices for all condition categories (Barbour et al., 1996; Barbour et al., 1999). The derivatives of the biotic indices tested included the total number of taxa, total site scores (SASS5, TARISS and ETHbios) and their associated average score per taxon (SASS5-ASPT, TARISS-ASPT, and ETHbios-ASPT).
We used Spearman correlations to test for relationships among diversity and biotic indices and the M-IBI. Before analyses, macroinvertebrates abundance (count) data and water quality physico-chemistry data were log (x + 1) and square-root transformed, respectively. Metrics calculated as proportions were normalized by Arcsine-square-root transformations before analysis. Analyses were performed using SigmaPlot Version 12. Statistical tests were considered significant at p < 0.05.
We used the continuous method to score individual metrics. Positive scoring metrics (which declined with increasing water quality degradation or disturbance) were scored 0–10 points: 0 points for values less than the 5th percentile of impacted sites and 10 points for values greater than the 50th percentile of high-quality reference sites. Negative scoring metrics (which increased with increasing water degradation or disturbance) were scored 0–10 points: 0 points for values greater than the 90th percentile of impacted sites and 10 points for values less than the 50th percentile of reference sites. These percentiles were chosen to maximize the discrimination among sites for each metric. Metric scores were linearly interpolated between 0 and 10. We felt continuous scoring over the individual metric ranges of 0–10 led to a more precise index than traditional methods (Hughes et al., 1998). To scale the index from 0 to 100 points, we summed the M-IBI score of the individual metric scores for each of the twelve metrics times 0.83.
Four condition categories of excellent, good, fair, and poor, using percentiles of frequency distributions of M-IBI scores at reference and impaired sites, were established to distinguish the different environmental conditions of the sampling sites (Table 8). The M-IBI scores exceeding the 75th percentile for reference sites (M-IBI >81) were classified as having ‘‘excellent’’ biotic integrity, and scores between the 75th and 25th percentiles (66 < M-IBI ≤81) were identified as having ‘‘good’’ biotic integrity. M-IBI scores between the 5th and 25th percentile for reference sites (M-IBI = 52–66) were identified as being in a “‘fair” condition, and scores below the 5th percentile for reference sites (M-IBI <2) were defined as in a “poor” condition.
There were seasonal and spatial variations in water quality variables and solutes in the study area (Table 1). For most site categories, levels of in situ physico-chemical variables (DO, electrical conductivity and temperature) and major solutes (Al, Ca, Mg, K, Na, F, Cl, SO4, and DSi) were higher during the dry season compared with the wet season (Table 1). In contrast, variables related to water clarity (turbidity and TSS) had elevated levels during the wet season compared to the dry season. Non-significant differences were found in nutrient concentration temporally.
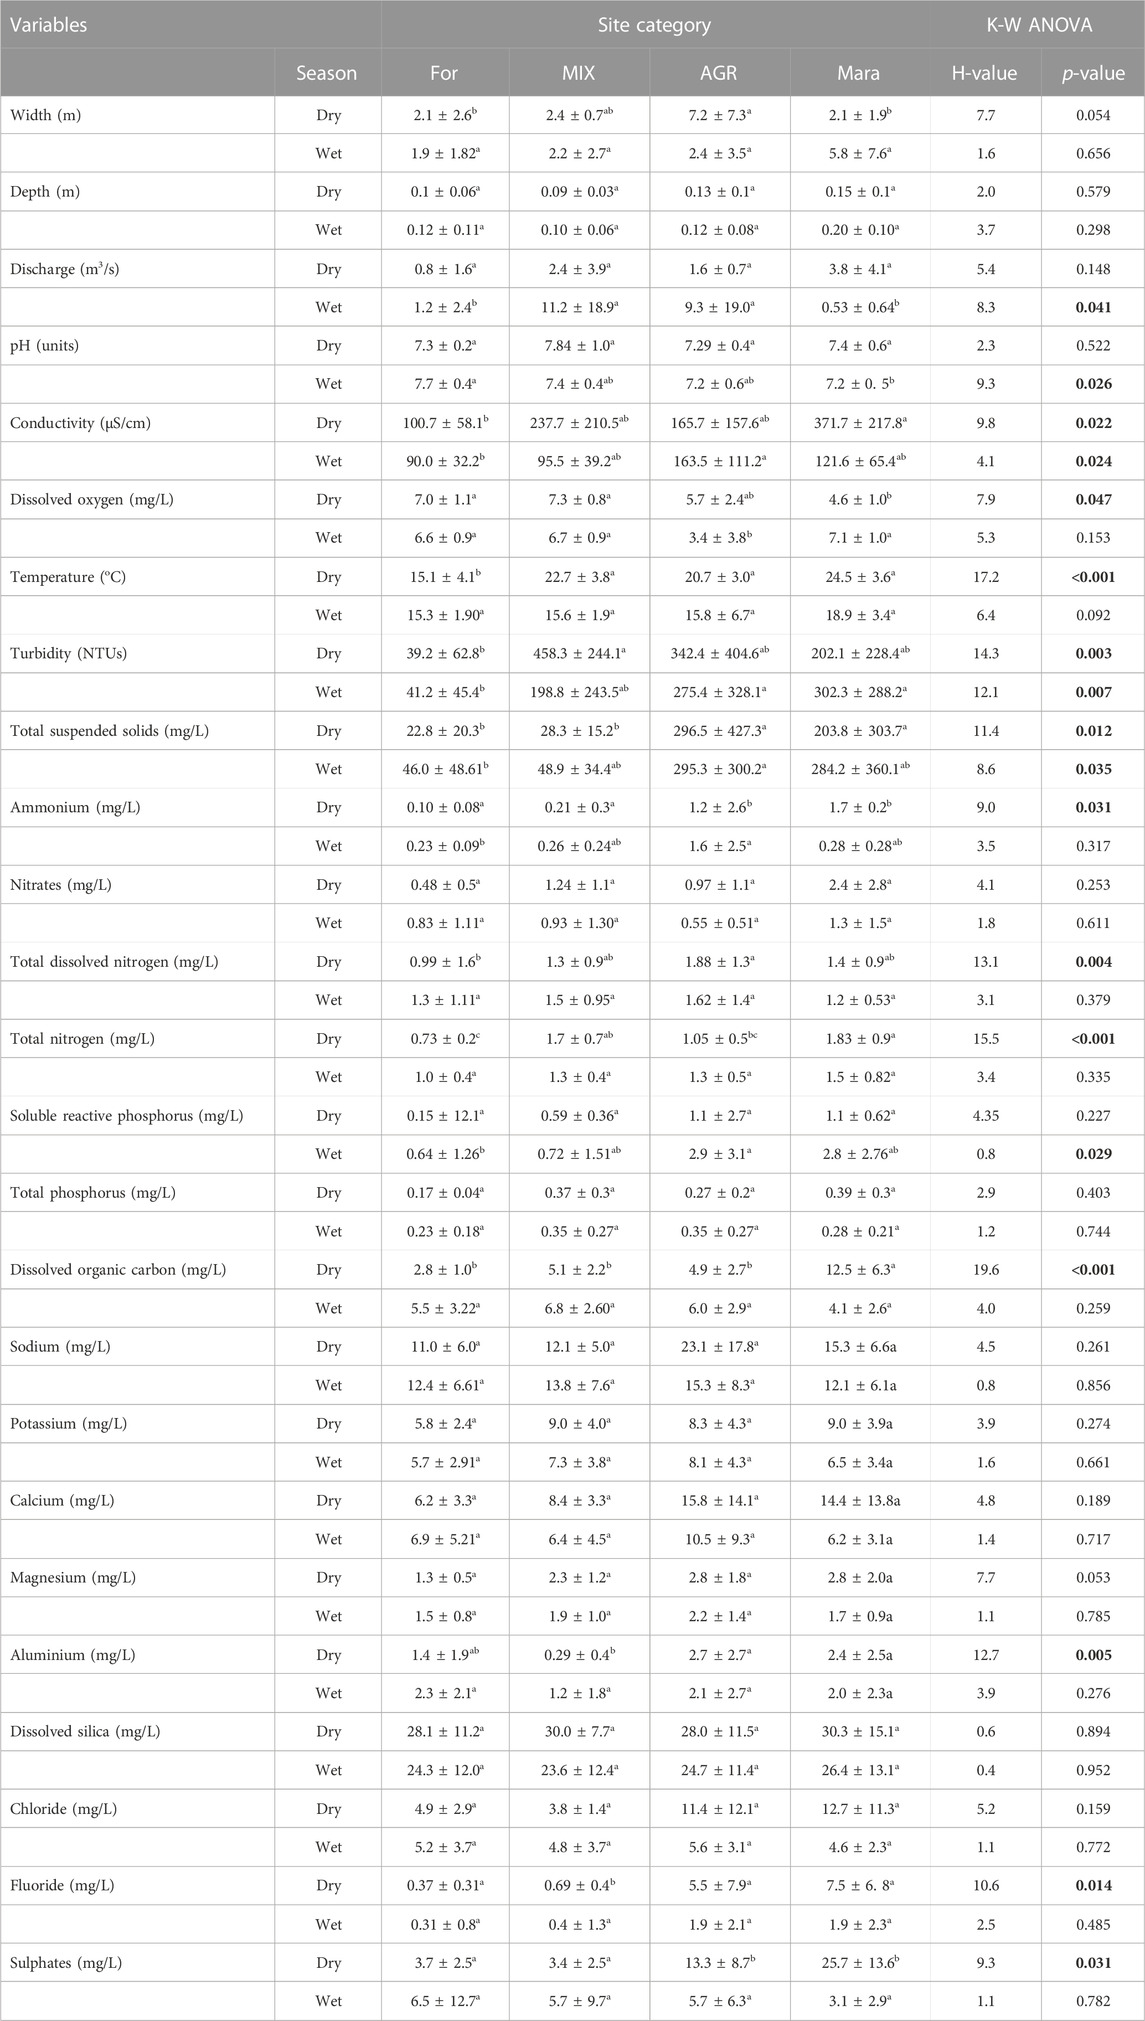
TABLE 1. Variability in mean (±SD) water quality physico-chemical variables across site categories in the Mara River Basin during the dry and wet seasons. p-values in boldface are significant at p < 0.05.
There were no significant differences in stream/river width and depth between the site categories (Table 1). Discharge only differed between the sites during the wet season, with sites in the Mara River mainstem recording significantly higher discharge. Apparent differences in water physico-chemistry were observed between the site categories (Table 1). While forest (FOR) and Mara sites (MARA) showed differences in most physico-chemical variables, for some variables, differences with agricultural (AGR) and mixed (MIX) sites were not clearcut, and levels lay between the FOR and MARA sites. For nutrients, the lowest levels were recorded in FOR sites, while AGR and MARA sites had the highest concentrations of ammonium, SRP, TN, and TDN. Similarly, AGR and MARA sites recorded the highest concentration of dissolved organic carbon (DOC), and FOR sited recorded the lowest concentration.
There were significant correlations between water quality variables and the total number of taxa (S), total number of individuals (N) and diversity indices (Table 2). The total number of species and abundance displayed the largest number of correlations, 9 and 11, respectively, out of the 22 water quality variables tested in this study. Among the diversity indices, Menhinick’s index had the highest discriminant ability by having strong correlations with nine (9) water quality variables. Evenness and equitability indices had the second-highest discriminant ability with eight (7) correlations. In contrast, Simpson’s, Shannon’s, Hill’s, Brillouin’s, Margalef’s, and Berger-Parker’s indices had six (6) correlations with water quality variables each. Finally, Fisher’s diversity index had the lowest number of correlations (4) with water quality variables (Table 2).
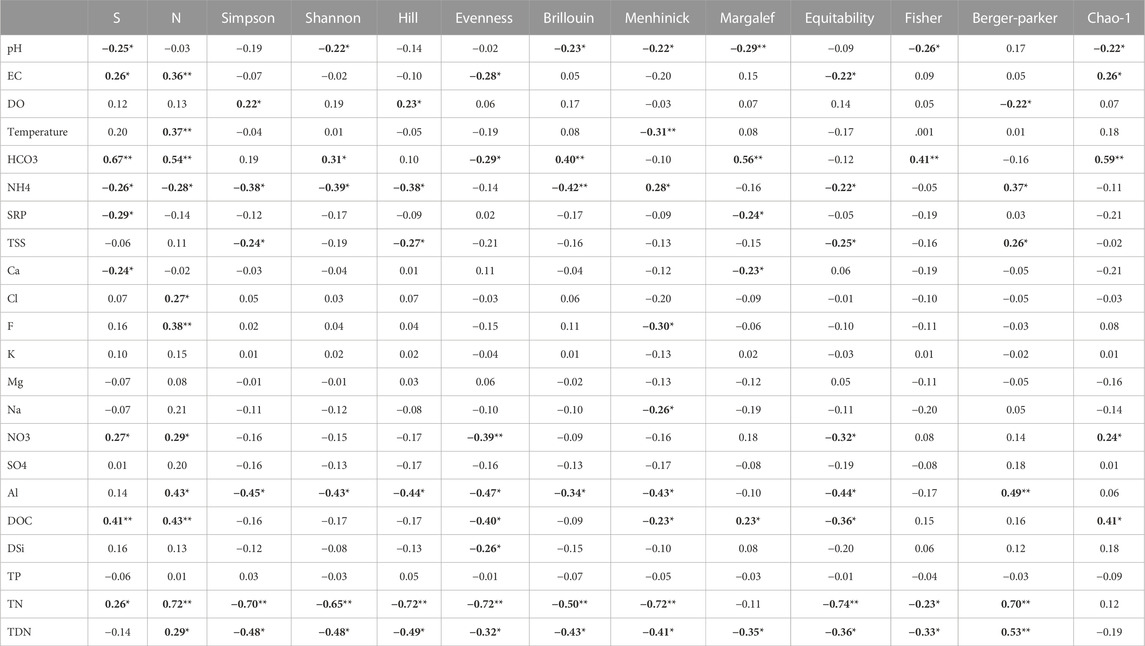
TABLE 2. Spearman correlations between macroinvertebrate indices and physico-chemical variables. (S, total number of species/taxa; N, total number of individuals; Simpson, Simpson’s index (1/Dominance); Shannon, Shannon’s index; Hill, Hill’s index; Evenness, Evenness index; Brillouin, Brillouin’s index; Menhinick, Menhinick’s index; Margalef, Margalef’s index; Equitability, Equitability index; Fisher, Fisher’s index; Berger-Parker, Berger-Parker’s index; Chao-1, Chao’s index; EC, Electrical conductivity; DO, dissolved oxygen; HCO3, Bicarbonate; NH4, Ammonium; SRP, Soluble reactive phosphorus; TSS, Total suspended solids; Ca, Calcium; Cl, Chloride; F, fluoride; K, Potassium; Mg, Magnesium; Na, Sodium; NO3, nitrates; SO4, Sulphate; Al, Aluminium; DOC, Dissolved organic carbon; DSi, Dissolved silica; TN, Total nitrogen; TDN, Total dissolved nitrogen. Spearman correlation coefficients in boldface are significant at p < 0.05.
The ability of the diversity indices and the total number of taxa and families to discriminate the different levels of disturbance among the four site categories were explored using box-and-whisker plots (Figures 2, 3). During the dry season, the number of taxa and the number of families were highest in MARA sites, but this was not different from the FOR sites (Figure 2). However, the FOR sites weren’t separated from the MIX and AGR sites. Although most diversity indices showed a decline from FOR sites which had the highest values, to MIX and AGR sites, which recorded the lowest values, they weren’t able to discriminate between FOR and MARA sites. Only Menhinick’s index separated FOR, MIX, and AGR sites, but MIX and MARA sites were inseparable (Figure 2). During the wet season, the performance and separation power of all diversity indices was much reduced as none separated the different site categories (Figure 3). Overall, FOR sites recorded the highest number of taxa and families and the highest diversity compared to other site categories.
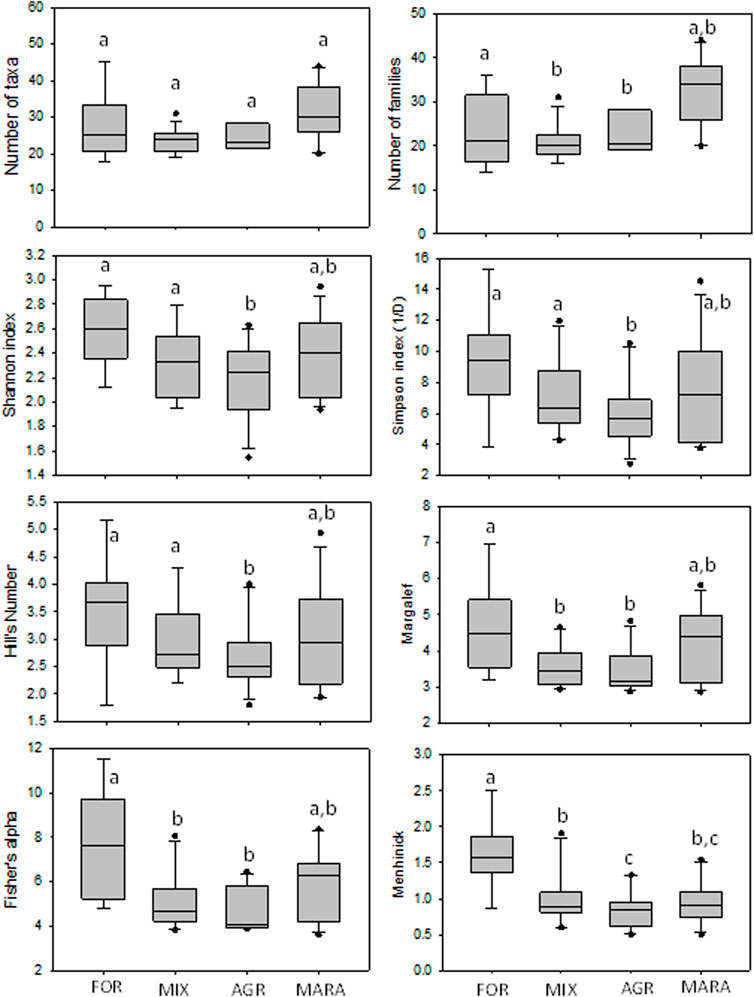
FIGURE 2. Performance of taxa richness and diversity indices across site categories in the Mara River Basin during the dry season. Similar letters on boxes indicate no significant difference in metric values among the four condition categories after One-Way ANOVA.
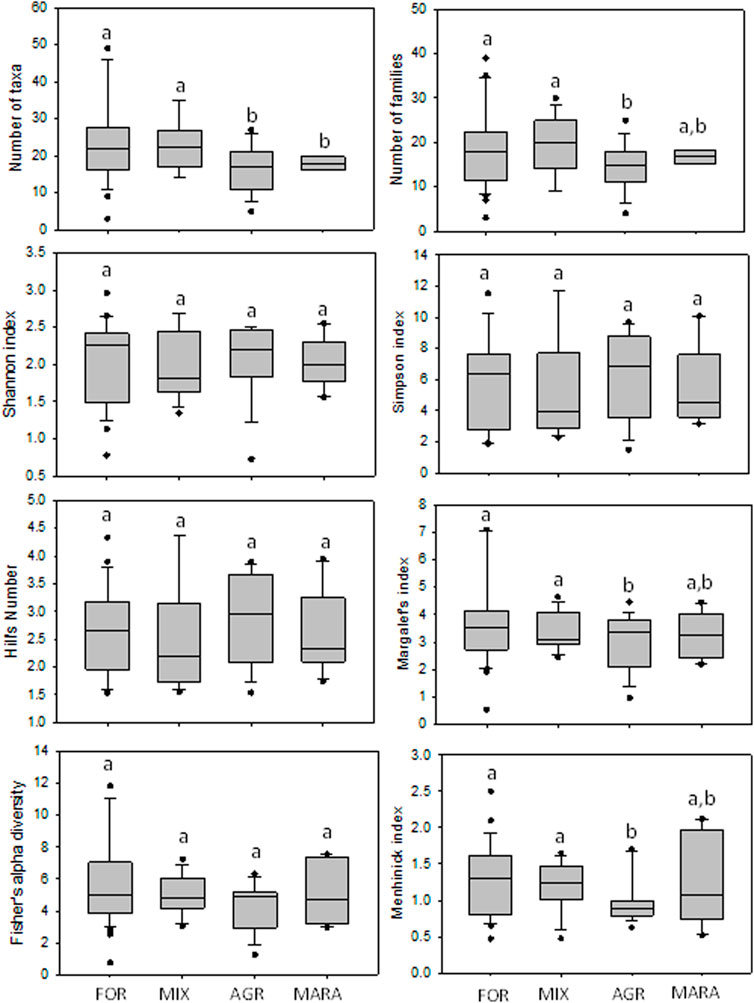
FIGURE 3. Performance of taxa richness and diversity indices across site categories in the Mara River Basin during the wet season. Similar letters on boxes indicate no significant difference in metric values among the four condition categories after One-Way ANOVA.
In total, 96 macroinvertebrate taxa were collected in the Mara River, belonging to 19 major taxonomic groups identified to order level or higher (Table 3). Although some taxa were identified at a lower than the family level, we used sensitivity weightings or scores at the family level, which is the level used in most of the biotic indices currently used in the region (Table 3). Of the 96 taxa, the SASS5 score had the highest taxa represented in the Mara River (78), closely followed by TARISS (77). ETHbios had the lowest number of taxa (40) represented in the Mara River.
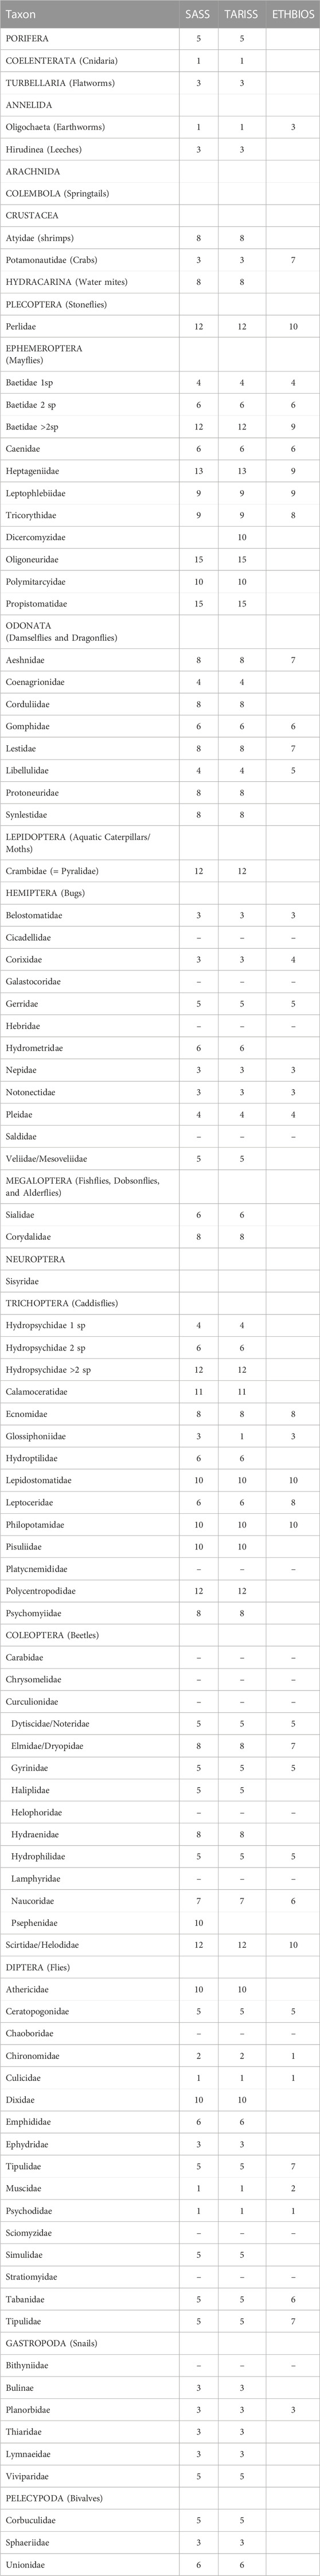
TABLE 3. List of taxa collected in the study area and their sensitivity weightings for rapid bioassessment protocols (RBPs) used in Africa, including the South African Scoring System (SASS, Dickens, and Graham, 2002), Tanzania River Scoring System (TARISS, Kaaya et al., 2015) and ETHbios (Aschalew and Moog, 2015). (−) indicate that sensitivity weights don’t exist in the three RBPs for the taxon.
A total of 16 taxa identified mainly to the family level did not occur or have sensitivity weightings in any of the three biotic indices (Table 3, Table A1). SASS5 and TARISS had a similar number of taxa (16) missing from the Mara River list, while ETHbios had 40. The taxa in the Mara River included the most intolerant to poor water quality or pollution, having a sensitive weighting of 15 in the SASS5 and TARISS scores (Propistomatidae and Oligoneuridae). Other sensitive taxa collected in the river included Heptageniidae (13), Perlidae, Crambidae (Pylaridae), Baetidae (>2 spp.), Hydropsychidae (>2 spp.), Polycentropodidae and Scirtidae/Helodidae (12). The most tolerant taxa to pollution encountered in the river included Coelenterata (Cnidaria), Oligochaeta, Culicidae, Psychodidae and Muscidae (1), and Chironomidae (2).
The sensitivity of the biotic indices to discriminate between levels of disturbance of the four site categories was evaluated using whisker-and-box plots (Figure 4). The total score derivatives of the three biotic indices (SASS5, TARISS and ETHbios) had poor discriminatory ability among disturbance categories during the dry and wet seasons. However, the ASPT derivatives of the indices had a better discriminatory power among site categories during the dry season. During the wet season, the ASPT derivatives, like the total scores, did poorly in discriminating the levels of disturbance among the sites.
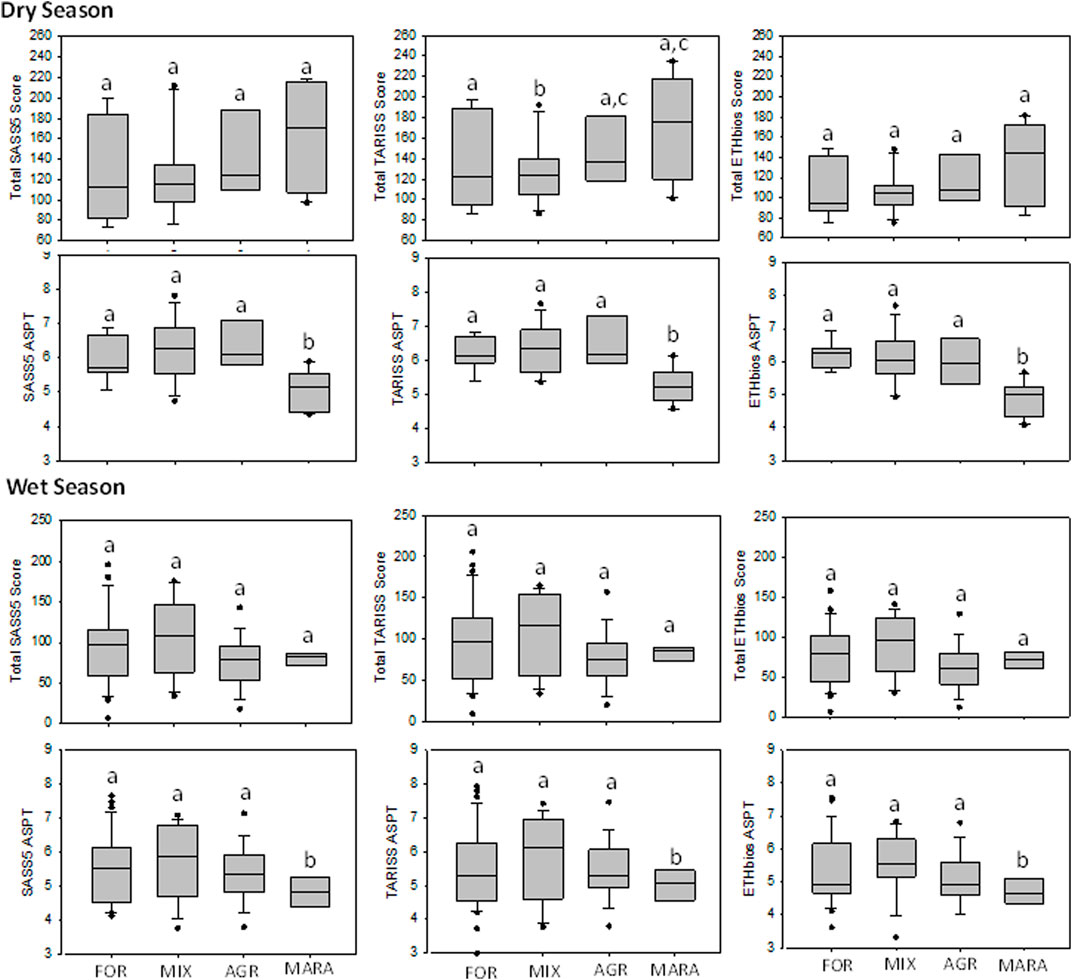
FIGURE 4. Box-and-whisker plots comparing the ability of SASS5, TARISS, and ETHbios total index scores and average score per taxon (ASPT) to discriminate levels of disturbance among the four site categories (FOR, MIX, AGR, and MARA) in the Mara River Basin during the dry and wet seasons. Boxes show interquartile ranges (25th and 75th percentiles, and middle lines are medians. FOR, forested; MIX, mixed; AGR, Agricultural, and MARA, Mara River mainstem and seasonal tributaries. Similar letters on boxes indicate no significant difference in metric values among the four condition categories after One-Way ANOVA.
There was discordance between the number of taxa and sensitivity scores. The MARA sites recorded the highest number of taxa but the lowest ASPT scores for both SASS5 and TARISS during the dry and wet seasons (Figure 4). Similarly, there was close agreement in the performance of SASS5 and TARISS by showing similar trends in both total and ASPT scores. ETHbios showed little variability among the site categories, except for a drop in ETHbios-ASPT score in the MARA sites during the dry season.
In total, 12 metrics falling into five categories that describe richness, composition, tolerance to disturbances (indicator individuals or taxa), functional feeding groups and effects of channel stability and flow variation were selected for inclusion in the M-IBI for the Mara River (Table 4). The final metrics in the Mara M-IBI had sufficient variability in data values among sites (data range), were reproducible (temporal stability), and were independent of other metrics by having low correlation relationships (r < 0.70). Some metrics that are sensitive to the cessation of flows and river sedimentation were included in the M-IBI to capture the effects of land use change and excessive water withdrawals that have modified the flow regime of the river. These metrics include the percentage of rheophilic individuals, the percentage of non-insect individuals and the percentage of burrowing individuals (Table 4). In addition, the percentage of vegetation-associated taxa was included as a metric to capture the loss of riparian and instream vegetation caused by flash-flooding, disturbance by livestock and wildlife and human over-use of streams and rivers.
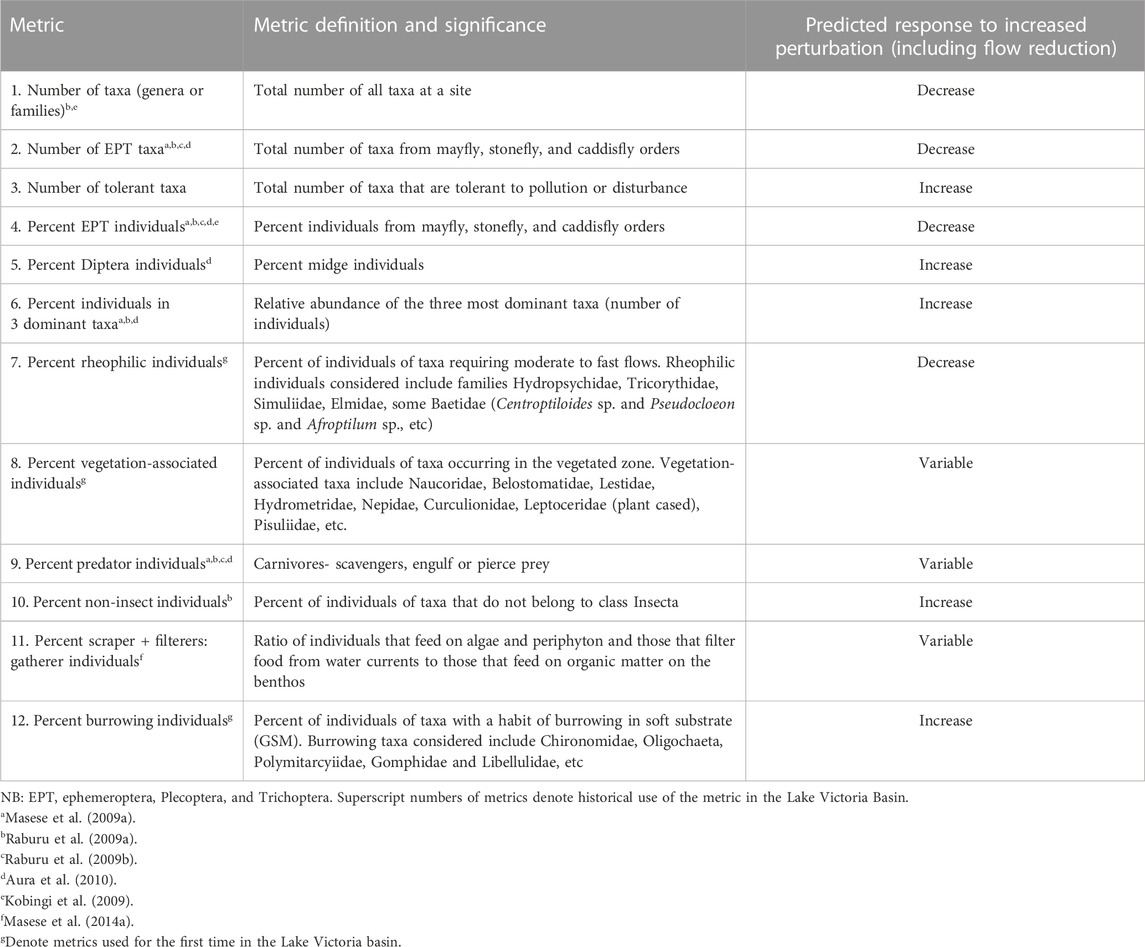
TABLE 4. Final metrics selected for inclusion in the Mara River M-IBI for assessment of the present ecological condition of the river. Details on definition and rationale or significance for inclusion, their historical use in Lake Victoria basin and predicted responses to perturbations and reduced flows are provided.
Metrics were also assessed for responsiveness to changes in water quality among the different sites. All macroinvertebrate metrics displayed significant Spearman correlations with various physico-chemical parameters (Table 5). SRP, F, K, and NO3-N returned only one significant relationship with M-IBI metrics. Significant correlations were among most water quality physico-chemical variables and M-IBI metrics (Table 5). The number of EPT taxa, number of tolerant taxa and percent Diptera individuals were the most responsive metrics, showing correlations with more than half of the 19 variables. The number of taxa and the number of predator individuals metrics were the least responsive metrics by having significant correlations with only three of the 19 physico-chemical variables.
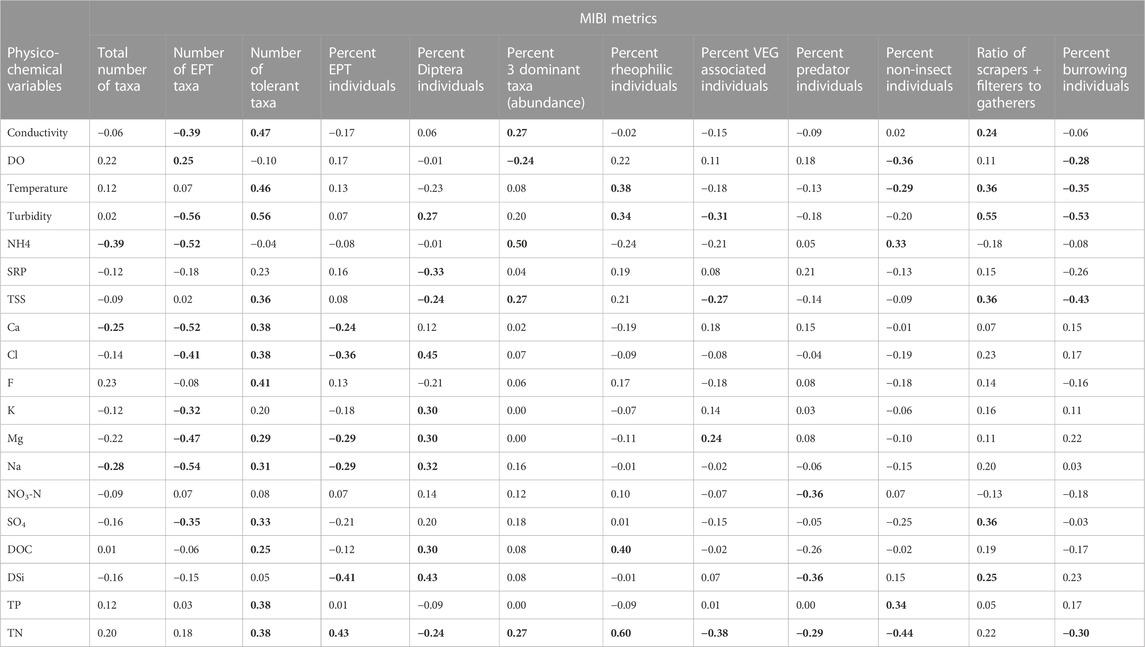
TABLE 5. Spearman correlations among water quality variables and component metrics of the Mara River M-IBI. Values in bold are significant at p < 0.05.
Metric scoring for the M-IBI was based on distributions of reference FOR sites and the most impacted (AGR and MARA) sites (Table 6). The scoring criteria were based on dry season samples because metric values are more stable and representative of environmental conditions as compared with wet season conditions. Consequently, metrics were scored separately for the dry and wet seasons.
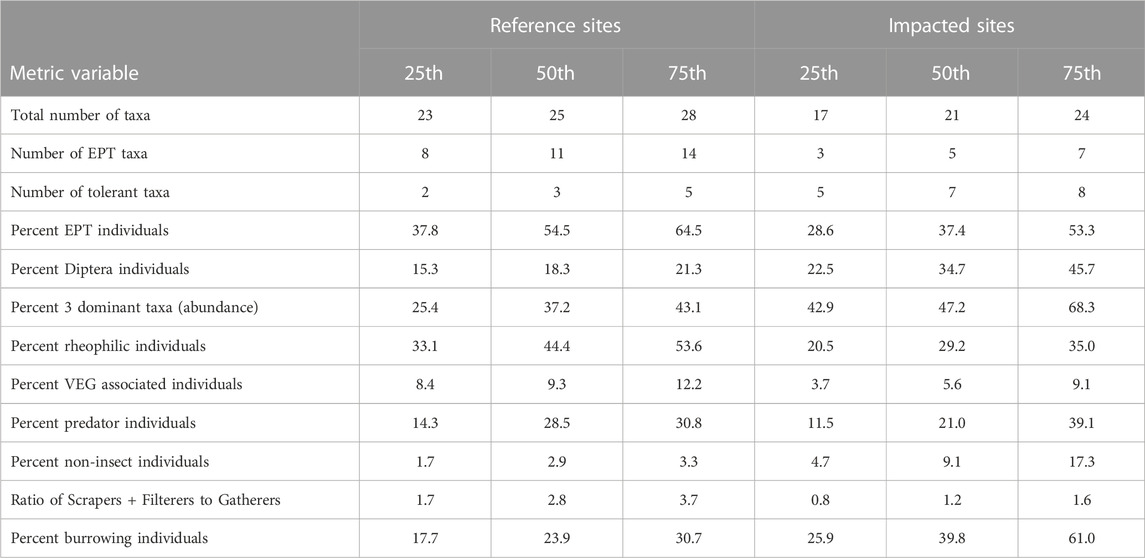
TABLE 6. Metric percentiles (25th, 50th, and 75th) for reference (FOR) sites and impacted sites (AGR and MARA) used for metric calibration.
The ability of the M-IBI to discriminate between the four levels of disturbance or site categories was evaluated using whisker-and-box plots (Figure 5). During the dry (Figure 5A) season, the performance of the M-IBI was able to discriminate between FOR and MIX sites, which were least disturbed, and AGR and MARA, which were the most disturbed human activities. However, during the wet season, the discriminatory ability of the M-IBI was much reduced as the four categories of sites were essentially inseparable (Figure 5B). The FOR and MIX sites scored higher values than the AGR and MARA sites, where water quality was much reduced. Overall, the M-IBI effectively assessed perturbations, including water quality and habitat disturbance, throughout the Mara River basin.
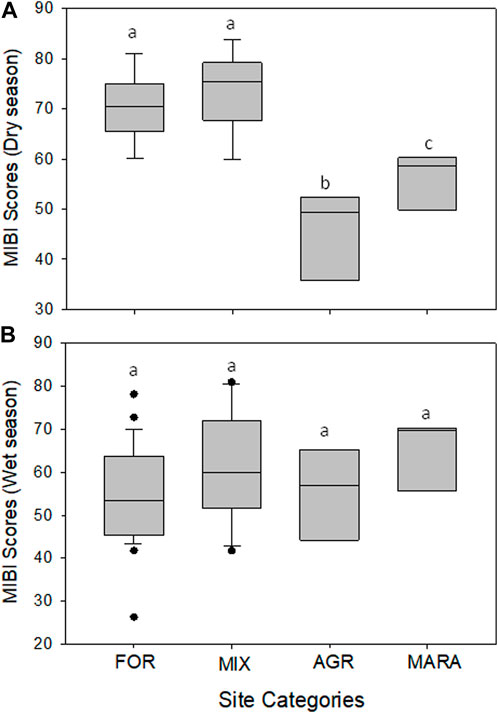
FIGURE 5. Box-and-whisker plots comparing the ability of the M-IBI to discriminate between the four levels of disturbance or site categories (FOR, MIX, AGR and MARA) in the Mara River Basin during the dry (A) and wet (B) seasons. Boxes show interquartile ranges (25th and 75th percentiles), and the middle lines are medians. FOR, forested; MIX, mixed; AGR, Agricultural, and MARA, Mara River mainstem and seasonal tributaries. Similar letters on boxes indicate no significant difference in metric values among the four condition categories after One-Way ANOVA.
Significant correlations existed among the total number of taxa, number of families, regional biotic indices, and the Mara River M-IBI (Table 7). During the dry season, the number of taxa had a significant positive correlation with the number of families, SASS5 score, TARISS score, and ETHbios score. The number of EPT taxa displayed a similar response as the total number of taxa. The SASS5 score had a highly significant positive relationship with the TARISS score. Both the SASS5 score and TARISS score had highly significant relationships with the number of taxa, the number of families and ETHbios score. The M-IBI index showed significant positive relationships with the SASS5 score and ASPT, TARISS score and ASPT, and ETHbios Score. However, the M-IBI didn’t display any significant relationship with the number of taxa and families, nor ETHbios ASPT.
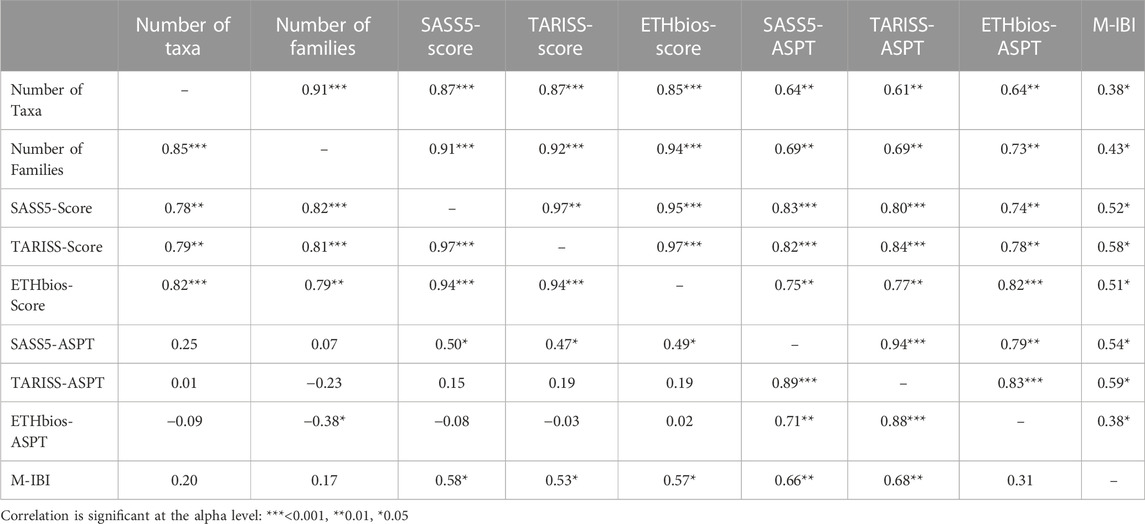
TABLE 7. Pair-wise Spearman correlations among regional biotic indices and the macroinvertebrate Index of Biotic Integrity (M-IBI) for the Mara River. The top-right half represents the wet season, while the bottom-left half is for the dry season.
Notably, all Spearman correlations among the total number of taxa, number of families, regional biotic indices, and the Mara River M-IBI were positive and significant (Table 7). This implies that the discriminatory ability of all the indices was reduced and could not display variability among sites.
Four condition categories of excellent, good, fair, and poor were established to distinguish the different environmental conditions of the sampling sites (Table 8). The ecological condition and integrity classes were interpreted relative to the levels of human disturbance at the different groups of sampling sites. Narrative descriptions were established for different categories or classes of sites using physico-chemical data, individual metrics, final M-IBI scores, habitat conditions and flow conditions for each site (Table 8). A notable response was the association of stable substrate and clear water quality with high diversity and abundances of the EPT and rheophilic taxa in the river. However, habitat modifications caused by trampling and input of organic matter and nutrients by large mammalian herbivores (livestock and hippos), and increased erosion causing turbidity from agricultural areas, were associated with low numbers of intolerant EPT taxa and high numbers and dominance of tolerant taxa such some species among Diptera Hemiptera, Coleoptera, and Oligochaeta.
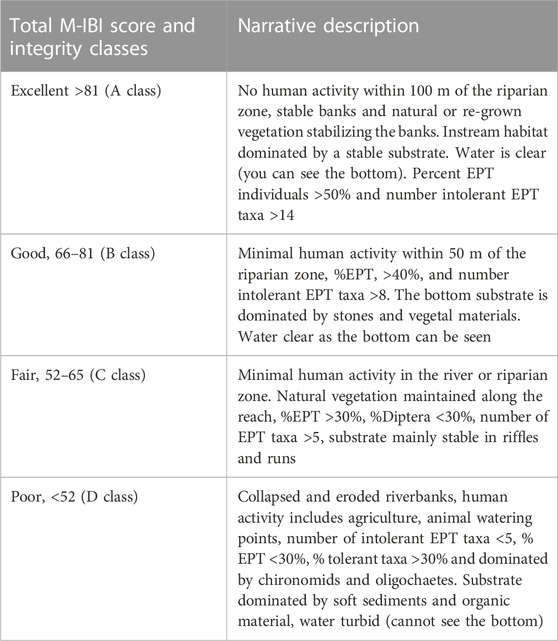
TABLE 8. Classification categories of total Mara River M-IBI scores, their integrity classes and narrative description based on the riverine habitats and flow conditions in the study area.
We sought to compare the performance of macroinvertebrate-based diversity (including richness) indices, regional biotic indices, and an index of biotic integrity (M-IBI) to assess the ecological condition of the Mara River, Kenya/Tanzania. The river is influenced by multiple stressors arising from agriculture and animal grazing, organic matter and nutrient loading, and excessive water withdrawals. Significant differences in water quality variables among the site categories influenced the structure of macroinvertebrates communities. Overall, the M-IBI performed better than biotic and diversity indices by having a higher discriminatory ability of site categories according to different levels and types of disturbance. Diversity indices performed poorly and failed to discriminate between stressor gradients in the river. All the indices were very sensitive to seasonality. During the dry season, the indices were more stable and could distinguish between different levels of disturbances in the river. However, during the wet season, the indices performed poorly and largely failed to differentiate between the different disturbance levels among the site categories.
Most physico-chemical variables differed among the site categories (Table 1), with turbidity, conductivity, TSS, nutrients and some major ions recording the lowest values in FOR and MIX sites and highest values in AGR and MARA sites. Turbidity, TSS and nutrients are good indicators of disturbances at the local scale, such as human activity and the loading of organic matter and nutrients by livestock and large wildlife through defecation and excretion (Masese et al., 2017; Dutton et al., 2018; Iteba et al., 2021). In contrast, electrical conductivity and major ions are surrogates for land use impacts or changes in geology on water physico-chemistry at the catchment scale (Gaillardet et al., 1999; Ibarra et al., 2016).
The negative impact of agriculture on water quality and ecological condition of Afrotropical streams and rivers through sediments and nutrient inputs from farmlands have been well-documented (Minaya et al., 2013; Masese et al., 2014a; Masese et al., 2014b; Masese et al., 2017; Fugère et al., 2018; Dalu et al., 2019; Kroese et al., 2020). Other stressors that negatively affect water quality and ecological integrity include the loading of organic matter from human settlements and livestock grazing areas (Dutton et al., 2018; Iteba et al., 2021). Excessive water withdrawal and changes in the natural flow regimes of streams and rivers are also emerging as significant stressors of river ecosystems. Extreme cases of flow alteration that lead to cessation of flows or supra-reduced flow levels during the dry season have been reported in the Mara River and other rivers in eastern Africa (Dutton et al., 2018; Stears et al., 2018). Reduced flows lead to the accumulation of organic matter and ammonia, increased concentration of solutes and an overall decline in DO concentration (Dutton and Subalusky, 2021; Wanderi et al., 2022).
Seasonality played a significant role in influencing water quality variables in the river through its influence on runoff, erosion and leaching of solutes, as also shown in a previous study (Wanderi et al., 2022). Solute concentrations and electrical conductivity were much higher during the dry season, probably because of increased evaporation and water temperatures. Studies show that inter-site differences can increase during the dry season as reach-scale influences (e.g., daily animal and human disturbance) increase during this period (Mathooko, 2001; Yillia et al., 2008; Minaya et al., 2013). In contrast, runoff and leaching during the wet season can increase the delivery of sediments, nutrients, and DOC into streams and rivers (Elsenbeer, 2001; Saunders et al., 2006). However, during the wet season, dilution and increased longitudinal connectivity can homogenize conditions in rivers, leading to reduced inter-site differences in water quality and ecological conditions (Leung et al., 2012; Masese et al., 2014b).
Since there are many diversity indices, it is difficult to decide a priori which one is best for a given region or study objective. By comparing the performance of eleven indices that are rarely or never used, we found that most of the indices performed poorly as discriminators of human disturbance in the river. This poor performance is probably due to taxa replacements with increasing levels of disturbance and not necessarily a loss or decline in taxa richness or diversity. For instance, the Mara River mainstem recorded the highest taxa richness, but most often, these were either tolerant or moderately tolerant to poor water quality. This is a weakness of most diversity indices as they don’t consider the tolerance of individual taxa or species to different levels of disturbance but the composition of the community in terms of the number of species and their abundances.
Although the diversity indices performed poorly, most were essentially in agreement regarding differences in macroinvertebrate diversity among the four site categories (Figures 2, 3). Low values of the Shannon index (<2.5) in MIX, AGR and MARA sites indicate widespread degradation affecting macroinvertebrate communities in the river. The same trend of declining richness and diversity of macroinvertebrates in MIX and AGR sites was captured by Simpson’s, Hill’s, Margalef’s, Fisher’s, and Menhinick’s indices (Figure 2). Agricultural streams had the lowest diversity indices, while MARA sites had slightly higher values, although there was a lot of variability within this site category. The lack of variation in most diversity indices across the site categories indicates the similarity of macroinvertebrate communities (Jost, 2007), especially regarding the abundance of common taxa. Menhinick’s diversity index had better differentiation among the site categories, suggesting that it was less sensitive to the numerical dominance of macroinvertebrate communities by a few common taxa. Hence, the index (Menhinick) is better suited for assessing anthropogenic influences on the diversity of macroinvertebrates in Afromontane-savanna rivers where the relative abundance of a few taxa (3–5) can be very high. In the Mara River, the relative abundance of the three most common taxa ranged from 30% to 93%. Shannon’s, Simpson’s (the reciprocal form), Hill’s, and Fisher’s indices could not capture declining water quality conditions when the diversity of macroinvertebrates was high. Hence, they are better suited to assessing disturbance that causes taxa richness and composition variation.
Like diversity indices, the number of taxa and families did not perform any better in discriminating different river disturbance forms. For instance, MARA sites recorded the highest number of taxa and families, but water quality was the most degraded. The MARA sites also experienced extreme flow variation, with seasonal tributaries ceasing flowing during the dry season. Given that this is the nature of savanna rivers—seasonal flows, high levels of organic matter, turbidity, water temperatures, and electrical conductivity (dissolved solutes) and low dissolved oxygen concentration (Wanderi et al., 2022), these taxa may be adapted to live in these conditions while maintaining high diversity and abundances. Indeed, some of the most sensitive taxa to poor water quality, such as Ephemeroptera and Trichoptera, recorded high taxa richness and abundance in organically polluted sites downstream of hippo pools and livestock watering points (Masese and Raburu, 2017). Similarly, Coleoptera, Hemiptera and Odonata had high taxa richness and abundance in MARA sites, suggesting that these orders are essential for monitoring extreme cases of flow reduction (including flow cessation), organic matter and nutrient loading in streams and rivers (Masese et al., 2018; Masese et al., 2021).
The three biotic indices (SASS5, TARISS and ETHbios) performed similarly in assessing the ecological status of different site categories in the Mara River (Figure 4). However, the indices’ total score and ASPT derivatives provided contrasting results. While the total scores indicated improved ecological conditions from the FOR to MARA sites, the ASPT derivative showed that the MARA sites had the poorest ecological condition. Thus, the ASPT derivatives captured the true conditions of the sites according to water quality variables. Higher ASPT scores indicate a high number of taxa that are sensitive to pollution or disturbance (Chutter, 1972; Chutter, 1998; Dickens and Graham, 2002). Overall, the results of the biotic indices indicate a general deterioration in water quality and habitat diversity in the Mara River mainstem and the seasonal tributaries. On the contrary, sites in the upper reaches of the Amala and Nyangores tributaries had natural water quality and high habitat diversity.
Despite having the lowest number of taxa represented in the Mara River—only 40 out of 96- ETHbios performed better than expected in comparison to both SASS5 and TARISS, which had 78 and 77 taxa, respectively, represented in the river (Table 3). The good performance of ETHbios shows that even with a subset of the taxa, sites can be assessed to determine their ecological status. However, this can be difficult when the sensitivities of native taxa are unknown, and values from elsewhere are assigned to native taxa. TARISS, which borrows heavily from SASS5, was expected to perform better than the other two indices (SASS5 and ETHbios) because it is the only biotic index empirically developed in East Africa, and macroinvertebrates in Tanzania and Kenya share similar characteristics. For instance, Dicercomyzidae in TARISS, which is missing in both SASS5 and ETHbios, is represented in the Mara River.
Similar to diversity indices, the biotic indices also showed dependence on seasonality and flow conditions for performance. The three biotic indices performed better during the dry season by distinguishing between the extremes of ecological conditions (FOR and MARA) in the river. In contrast, there were declines in the discriminatory ability of the indices from the dry to the wet season. Poor performance of the biotic indices is likely due to improvements in environmental conditions or water quality caused by the dilution and flushing of the streams and rivers during the rainy season. Improvement of water quality in the MARA sites during the wet season was captured by the presence of sensitive taxa such as Perlidae, Heptageniidae and Philopotamidae, which did not occur during the dry season. Similar findings have been reported in other rivers, whereby replenishing of water and removal of fine sediments in the benthos by river flows leads to the recolonization of streams and rivers with sensitive taxa that cannot withstand sedimentation and poor water quality during the dry season (Shivoga, 2001; Masese et al., 2009b).
The performance of the SASS5 and TARISS biotic indices was very similar. This can be explained by the fact that TARISS was derived from SASS5, with all the sensitivity weightings in the two indices being similar except for three taxa (Dicercomyzidae, Ephemerythidae and Neridae) missing in SASS5 but included in TARISS. Dicercomydidae occur in the Mara River, implying that the distribution of taxa in regions sampled for the development of TARISS, including northern Tanzania, is like that in the Mara River basin. This isn’t surprising because the Mara River is transboundary between Kenya and Tanzania. In contrast, ETHbio’s poor performance was largely due to many taxa (40) in the Mara River that are missing in the index, as opposed to only 16 taxa in the Mara that aren’t in either SASS5 or TARISS (Table A1).
The M-IBI developed for the Mara River performed better than diversity and biotic indices in discriminating the different levels and types of stressors among the four site categories. IBIs are more rigorous in their assessment of ecological conditions because they incorporate metrics whose utility or sensitivity to different forms of disturbance is already tested and assured. Although most of the 12 metrics included in the M-IBI have previously been used to develop macroinvertebrate IBIs in the Lake Victoria basin (Masese et al., 2009a; Raburu et al., 2009a; Raburu et al., 2009b; Kobingi et al., 2009; Aura et al., 2010; Masese et al., 2014a), and other river systems in Africa (Thorne and Williams, 1997; Lakew and Moog, 2015; Alemneh et al., 2019; Tampo et al., 2020; Kaboré et al., 2022), three new metrics were incorporated to capture specific stressors that are unique to Afrotropical savanna rivers as indicated above. The first new metric included in the M-IBI was the percentage of individuals of rheophilic taxa. Rheophilic taxa require a stable substrate and moderate to fast flows to meet their ecological requirements, mainly attachment for feeding, dissolved oxygen uptake and osmoregulation. Rheophilic taxa in the Mara River include Hydropsychidae, Tricorythidae, Simuliidae, Elmidae, and some Baetidae (Centroptiloides sp. and Pseudocloeon sp. and Afroptilum sp.), among others (Masese et al., 2021). Simuliidae, Hydropsychidae, Tricorythidae, and some Baetidae have been identified to be sensitive to flow alteration in African rivers (O’Keeffe and de Moor, 1988; Dallas, 2007; Rivers-Moore et al., 2007; Thirion, 2016; Masese et al., 2021). When water levels and flow velocities drop, they cannot feed and obtain enough dissolved oxygen, and consequently, they are eliminated. Incorporating rheophilic species in multimetric indices is crucial for monitoring changes in natural flow regimes of rivers caused by land use change and excessive water withdrawals. These taxa are also important for setting environmental flow requirements for streams and rivers.
The second new metric included in the M-IBI was the percent of individuals in vegetation-associated taxa, which is the number of individuals in taxa occurring in or preferring vegetated zones. Vegetation-associated taxa included Naucoridae, Belostomatidae, Lestidae, Hydrometridae, Nepidae, Notonectidae, Naucoridae, Lepidostomatidae, Leptoceridae (plant cased), Pisuliidae, among others. Most of these taxa belong mainly to Coleoptera, Hemiptera and Odonata, and some Trichoptera, especially detritivores. The sensitivity of Trichoptera to different forms of disturbance in streams and rivers is undisputed (Barbour et al., 1999). Taxa among Odonata, Coleoptera, and Hemiptera are fast colonizers tolerant to water flow reduction or cessation and poor water quality (Velasco and Millan, 1998; Boulton and Lake, 2008; Raburu et al., 2017) but very sensitive to the loss of instream or riparian vegetation that they use for attachment. Odonata was particularly abundant in seasonal streams and river sections with emergent and submerged macrophytes. In other savanna rivers, marginal vegetation supports abundant odonate larvae and adults (Samways and Steytler, 1996), and, as a result, Odonata and other taxa that prefer marginal vegetations are good indicators of riparian deforestation or clearance of instream vegetation (macrophytes) by floods or other disturbances (da Silva Monteiro et al., 2013).
The third new metric included in the M-IBI was the percentage of individuals in burrowing taxa. Taxa that burrow in a soft substrate (gravel, sand, or mud) prefer slow-flowing sections of rivers (backwaters and pools) and are soft-bodied. Burrowing taxa include some Chironomidae, Oligochaeta, Polymitarcyiidae, Gomphidae, Libellulidae, Leptophlebiidae, Tubificidae, Gyrinidae, and Corixidae, among others. The abundance of burrowing taxa is negatively related to discharge and flow velocities in streams and rivers (Masese et al., 2021). In the Njoro River, drying of the river resulted in a tremendous increase in oligochaetes while other sensitive taxa among the EPT were eliminated (Shivoga, 2001; Mathooko et al., 2005). In the Moiben River, the peak of the dry season coincided with a significant decline in sensitive taxa and a proliferation of burrowing and pool-associated taxa, such as Belostomatidae, Corixidae, Gomphidae, and oligochaetes (Masese et al., 2009a; Masese et al., 2009b). Similar findings have been reported in other river systems suggesting that burrowing or pool-associated taxa are good indicators of flow reduction, sedimentation or organic pollution in streams and rivers.
The discriminatory ability of the different indices was in the order M-IBI > biotic indices > diversity indices. Incorporating various metrics that responded differently to various forms and levels of disturbance gave the M-IBI an edge over diversity and biotic indices in the Mara River. Despite the notable better performance of the M-IBI, the three classes of indices were insensitive to low and moderate levels of disturbance in the river, specifically among FOR and MIX sites, MIX and AGR sites and AGR and MARA sites. Only the extreme ecological conditions in FOR and MARA sites were distinguishable, and even so, most diversity and biotic indices couldn’t differentiate FOR and MARA site categories. Failure of diversity and biotic indices to identify MARA sites as disturbed shows that the indices are biased in assessing disturbed sites with high taxa richness. It has been noted that diversity measures describe community structure but not the pollution level of water bodies (Washington, 1984). Thus, when community structure remains unchanged, for instance, by replacing sensitive taxa with tolerant taxa when water quality degrades or the level of disturbance increases, most diversity indices cannot capture this change. Similarly, biotic indices are insensitive to the number of taxa but to the sensitivity ratings or scores of individual taxa. However, most derivatives of the biotic indices were positively correlated with the number of taxa, not the number of families.
Although the diversity and biotic indices have a long history of use as discriminators of different levels of pollution and other forms of disturbance in streams and rivers, the findings of this study show that they can be limited when distinguishing low to moderate levels of disturbance. Diversity indices were particularly ineffective in identifying changes in macroinvertebrate community composition caused by the replacement of taxa, and not loss of taxa. On the other hand, biotic indices were insensitive to the number of taxa and instead relied more on individual taxa’s sensitivity ratings or scores. This made it challenging to detect moderate forms of disturbance that maintain or increase taxa richness. These shortcomings of diversity and biotic indices are addressed in multimetric indices that incorporate various metrics of macroinvertebrates whose utility is individually evaluated before inclusion in the final index.
There is growing interest in developing biotic indices for the assessment of surface waters in Africa (Dallas, 2021; Masese et al., 2022). Thus, the performance of existing indices should be evaluated to inform the development of new ones. Most importantly, it is vital to determine the situations and conditions under which their use is most appropriate. There is also a need to improve the performance of biotic indices by empirically establishing the sensitivity ratings or scores of native taxa instead of relying on values in the literature. Although TARISS and SASS5 could assess the ecological condition of the different sites in the Mara River, their performance in terms of discriminating different levels of disturbance in the river was inadequate. Thus, if any one of the indices is to be used for regular biomonitoring of the river, several improvements must be made. First, all the taxa in the Mara River which could not be scored because of missing sensitivity weights or ratings in the two indices must be assigned sensitivity scores. This can be done using water quality and distribution data or by comparing the distribution with taxa already scored in other indices. Secondly, the sampling methods need to be tested for representativeness, and data on abundance incorporated as part of the bioassessment protocols. Although abundance data is estimated in SASS5 (Dickens and Graham, 2002), it isn’t clear how these data are incorporated into the categorization of sites into different ecological classes. Thirdly, the sensitivity scores of the existing taxa should be re-assessed to ensure that they are congruent with the displayed responses in water quality and the overall condition of the sampled sites.
Concerns have been raised over the possibility of regional differences in the sensitivity of similar or related taxa to the same forms of disturbance (Kaaya et al., 2015; Masese et al., 2017; Dallas, 2021). Lastly, the issue of seasonality should be addressed to determine the optimum conditions for sampling. This is necessary because water resources are dwindling, and increasing demand has led to excessive withdrawals that convert once permeant streams and rivers into seasonal ones. In semi-arid and sub-humid savanna grasslands, streams and rivers experience hydrological extremes characterized by flooding during spates and cessation of flows during the dry season or droughts. This makes it difficult to develop an index suitable for all flow conditions. For instance, the SASS5 protocol is not recommended for high-flow (wet) conditions (Chutter, 1972; Dickens and Graham, 2002) because it is too variable and unreliable. However, it is very good for assessing the effects of low flow on ecological conditions and establishing minimum flow requirements (environmental flows) for sustaining the functioning of rivers (Dickens and Graham, 2002; O'Keeffe and Dickens, 2008).
Even with the development of regional indices such as TARISS and ETHbios in Eastern Africa, there is still a need to develop a biotic index for river systems in Kenya and other African countries. However, this doesn’t need to start from scratch as existing regional indices such as SASS or TARISS can be used as foundations. Most importantly, these indices must be validated and tested using native taxa and environmental conditions. Differences in climate, geology, altitude, longitude, and latitude among regions and African countries may contribute to differences in physico-chemical characteristics of rivers, resulting in differences in macroinvertebrate assemblages and sensitivities to disturbance gradients and general impairment of ecosystem functioning.
The findings of this study show that while diversity and richness indices that measure the structure of macroinvertebrate communities are widely used in determining the level of anthropogenic disturbance in streams and rivers, their performance in the Afromontane-savanna rivers isn’t adequate. Most diversity and richness indices tested performed poorly and failed to discriminate among different levels of human disturbance. Overall, the M-IBI performed better than biotic and diversity indices by having a higher discriminatory ability among site categories. The poor performance of regional biotic indices in assessing the river’s ecological condition provides more evidence for the need to test and validate indices developed elsewhere before their use in bioassessment programs and decision-making.
The raw data supporting the conclusions of this article will be made available by the authors, without undue reservation.
FM, EW, KF, and MM: Conceptualization, experimental design; FM, EW, KF, and MM: Data collection; FM, EW, AA, and KN: Data analysis; FM and EW: Drafting of the manuscript; All authors commented on the manuscript and approved it for publication.
We are grateful to many people who contributed to the generation and compilation of the dataset used in this study. Lubanga Lunaligo and David Namwaya (University of Eldoret) assisted during lab work, and Robertson Marindany and Mutai Kitur for assistance during fieldwork. This study was partly funded by National Research Fund (NRF) Kenya, and the Dutch Ministry of Foreign Affairs through UNESCO-IHE Partnership Research Fund under the MaraFlows Project. In addition, we appreciate the technical assistance offered by Fred Kruis, Ferdi Battes, Lyzette Robbemont, Frank Weigman and Berrend Lolkema during sample analyses at the IHE-Delft laboratory.
The authors declare that the research was conducted in the absence of any commercial or financial relationships that could be construed as a potential conflict of interest.
All claims expressed in this article are solely those of the authors and do not necessarily represent those of their affiliated organizations, or those of the publisher, the editors and the reviewers. Any product that may be evaluated in this article, or claim that may be made by its manufacturer, is not guaranteed or endorsed by the publisher.
Achieng, A. O., Masese, F. O., Coffey, T. J., Raburu, P. O., Agembe, S. W., Febria, C. M., et al. (2021). Assessment of the ecological health of afrotropical rivers using fish assemblages: A case study of selected rivers in the Lake Victoria basin, Kenya. Front. water 2, 620704. doi:10.3389/frwa.2020.620704
Alemneh, T., Ambelu, A., Zaitchik, B. F., Bahrndorff, S., Mereta, S. T., and Pertoldi, C. (2019). A macroinvertebrate multi-metric index for Ethiopian highland streams. Hydrobiologia 843 (1), 125–141. doi:10.1007/s10750-019-04042-x
Alemu, T., Bahrndorff, S., Pertoldi, C., Hundera, K., Alemayehu, E., and Ambelu, A. (2018). Development of a plant based riparian index of biotic integrity (RIBI) for assessing the ecological condition of highland streams in East Africa. Ecol. Indic. 87, 77–85. doi:10.1016/j.ecolind.2017.12.032
APHA (American Public Health Association) (1998). Standard methods for the examination of water and wastewater. 20th edition. Washington, DC: American Public Health Association, American Water Works Association, Water Environment Federation.
Arimoro, F. O., and Keke, U. N. (2017). The intensity of human-induced impacts on the distribution and diversity of macroinvertebrates and water quality of Gbako River, North Central, Nigeria. Energy Ecol. Environ. 2 (2), 143–154. doi:10.1007/s40974-016-0025-8
Aschalew, L., and Moog, O. (2015). Benthic macroinvertebrates based new biotic score “ETHbios” for assessing ecological conditions of highland streams and rivers in Ethiopia. Limnologica 52, 11–19. doi:10.1016/j.limno.2015.02.002
Aura, C. M., Raburu, P. O., and Herman, J. (2010). A preliminary macroinvertebrate index of biotic integrity for bioassessment of the kipkaren and sosiani rivers, nzoia River basin, Kenya. Lakes Reservoirs Res. Manag. 15, 119–128. doi:10.1111/j.1440-1770.2010.00432.x
Aura, M. C., Nyamweya, C. S., Njiru, J. M., Omondi, R., Manyala, J., Musa, S., et al. (2021). Using the Multi-metric Index of Biotic Integrity methodological approach to determine the major river catchment that most pollutes a lake. Aquat. Ecosyst. Health Manag. 24 (1), 12–20. doi:10.14321/aehm.024.01.04
Barbour, M. T., Gerritsen, J., Griffith, G. E., Frydenborg, R., McCarron, E., White, J. S., et al. (1996). A framework for biological criteria for Florida streams using benthic macroinvertebrates. J. North Am. Benthol. Soc. 15, 185–211. doi:10.2307/1467948
Barbour, M. T., Gerritsen, J., Snyder, B. D., and Stribling, J. B. (1999). Rapid bioassessment protocols for use in wadeable streams and rivers. Periphyton, benthic macroinvertebrates and fish. 2nd edn. Washington DC: U.S. Environmental Protection Agency, Office of Water. EPA 841-B-99-002.
Barbour, M. T., Stribling, J. B., and Karr, J. R. (1995). “Multimetric approach for establishing biocriteria and measuring biological condition,” in Biological assessment and criteria. Tools for water resource planning and decision making. Editors W. S. Davis, and T. P. Simon (Boca Raton, Florida: Lewis Publishers), 63–77.
Barlow, J., França, F., Gardner, T. A., Hicks, C. C., Lennox, G. D., Berenguer, E., et al. (2018). The future of hyperdiverse tropical ecosystems. Nature 559, 517–526. doi:10.1038/s41586-018-0301-1
Bere, T., and Nyamupingidza, B. B. (2014). Use of biological monitoring tools beyond their country of origin: A case study of the South African scoring system version 5 (SASS5). Hydrobiologia 722, 223–232. doi:10.1007/s10750-013-1702-7
Berger, W. H., and Parker, F. L. (1970). Diversity of planktonic foraminifera in deep sea sediments. Science 168 (3937), 1345–1347. doi:10.1126/science.168.3937.1345
Birk, S., Bonne, W., Borja, A., Brucet, S., Courrat, A., Poikane, S., et al. (2012). Three hundred ways to assess Europe's surface waters: An almost complete overview of biological methods to implement the Water Framework Directive. Ecol. Ind. 18, 31–41. doi:10.1016/j.ecolind.2011.10.009
Bonada, N., Prat, N., Resh, V. H., and Statzner, B. (2006). Developments in aquatic insect biomonitoring: A comparative analysis of recent approaches. Annu. Rev. Entomol. 51, 495–523. doi:10.1146/annurev.ento.51.110104.151124
Boulton, A. J., and Lake, P. S. (2008). “Effects of drought on stream insects and its ecological consequences,” in Aquatic insects: Challenges to populations (Wallingford: CABI Publishing), 81–102. doi:10.1079/9781845933968.0081
Buss, D. F., Carlisle, D. M., Chon, T. S., Culp, J., Harding, J. S., KeizerVlek, H. E., et al. (2015). Stream biomonitoring using macroinvertebrates around the globe: A comparison of large-scale programs. Environ. Monit. Assess. 187, 4132. doi:10.1007/s10661-014-4132-8
Camberlin, P., Moron, V., Okoola, R., Philippon, N., and Gitau, W. (2009). Components of rainy seasons' variability in equatorial east Africa: Onset, cessation, rainfall frequency and intensity. Theor. Appl. Climatol. 98 (3-4), 237–249. doi:10.1007/s00704-009-0113-1
Carter, J. L., Resh, V. H., and Morgan, J. H. (2017). “Macroinvertebrates as biotic indicators of environmental quality,” in Methods in stream ecology. Editors G. A. Lamberti, and F. R. Hauer Third Edition (Academic Press), 293–318. doi:10.1016/B978-0-12-813047-6.00016-4
Chao, A. (1984). Nonparametric estimation of the number of classes in a population. Scand. Stat. Theory Appl. 11 (4), 265–270.
Chessman, B. C., and McEvoy, P. K. (1997). Towards diagnostic biotic indices for river macroinvertebrates. Hydrobiologia 364 (2), 169–182. doi:10.1023/A:1003142819625
Chutter, F. M. (1972). An empirical biotic index of the quality of water in South African streams and rivers. Water Res. 6 (1), 19–30. doi:10.1016/0043-1354(72)90170-4
Chutter, F. M. (1998). Research on the rapid biological assessment of water quality impacts in streams and rivers. WRC report No. 422/1/98. Pretoria, South Africa: Water Research Commission.
da Silva Monteiro, C., Couceiro, S. R. M., Hamada, N., and Juen, L. (2013). Effect of vegetation removal for road building on richness and composition of Odonata communities in Amazonia, Brazil. Int. J. Odonatol. 17, 135–144. doi:10.1080/13887890.2013.764798
Dallas, H. F. (1997). A preliminary evaluation of aspects of SASS (South African Scoring System) for the rapid bioassessment of water quality in rivers, with particular reference to the incorporation of SASS in a national biomonitoring programme. South Afr. J. Aquat. Sci. 23, 79–94. doi:10.1080/10183469.1997.9631389
Dallas, H. F., Lowe, S., Kennedy, M. P., Saili, K., and Murphy, K. J. (2018). Zambian invertebrate scoring system (ziss): A macroinvertebrate-based biotic index for rapid bioassessment of southern tropical african river systems. Afr. J. Aquat. 43 (4), 325–344. doi:10.2989/16085914.2018.1517081
Dallas, H. F. (2021). Rapid bioassessment protocols using aquatic macroinvertebrates in africa–considerations for regional adaptation of existing biotic indices. Front. water 3, 628227. doi:10.3389/frwa.2021.628227
Dallas, H. F. (2007). The influence of biotope availability on macroinvertebrate assemblages in South African rivers: Implications for aquatic bioassessment. Freshw. Biol. 52 (2), 370–380. doi:10.1111/j.1365-2427.2006.01684.x
Dalu, T., Wasserman, R. J., Magoro, M. L., Froneman, P. W., and Weyl, O. L. (2019). River nutrient water and sediment measurements inform on nutrient retention, with implications for eutrophication. Sci. Total Environ. 684, 296–302. doi:10.1016/j.scitotenv.2019.05.167
Darwall, W. R., and Freyhof, J. Ö. R. G. (2016). Lost fishes, who is counting? The extent of the threat to freshwater fish biodiversity. Ecol. Freshw. Fish., 1–36. doi:10.1017/CBO9781139627085.002
Davies, S. P., and Jackson, S. K. (2006). The biological condition gradient: A descriptive model for interpreting change in aquatic ecosystems. Ecol. Appl. 16, 1251–1266. doi:10.1890/1051-0761(2006)016[1251:TBCGAD]2.0.CO;2
Day, J. A., and de Moor, I. J. (2002a). Guides to the freshwater invertebrates of southern Africa volume 5: Non-arthropods (the protozoans, Porifera, Cnidaria, Platyhelminthes, nemertea, rotifera, nematoda, nematomorpha, gastrotrichia, bryozoa, tardigrada, polychaeta, Oligochaeta and Hirudinea). Pretoria, South Africa: Water Research Commission. WRC Report No. TT 167/02. doi:10.2989/16085914.2010.466645
Day, J. A., and de Moor, I. J. (2002b). Guides to the freshwater invertebrates of southern Africa. Volume 6: Arachnida and Mollusca (araneae, water mites and Mollusca). Pretoria, South Africa: Water Research Commission. WRC Report No. TT 182/02.
de Moor, I. J., Day, J. A., and de Moor, F. C. (2003a). Guides to the freshwater invertebrates of southern Africa volume 7: Insecta I: Ephemeroptera, Odonata and Plecoptera. Pretoria, South Africa: Water Research Commission. WRC Report No. TT 207/03. doi:10.2989/AJAS.2009.34.2.12.899
de Moor, I. J., Day, J. A., and de Moor, F. C. (2003b). Guides to the freshwater invertebrates of southern Africa. Volume 8: Insecta II: Hemiptera, megaloptera, neuroptera, Trichoptera and Lepidoptera. Pretoria, South Africa: Water Research Commission. WRC Report No. TT 214/03. doi:10.2989/AJAS.2009.34.2.13.900
Dickens, C. W., and Graham, P. M. (2002). The South African Scoring System (SASS) version 5 rapid bioassessment method for rivers. Afr. J. Aquat. 27 (1), 1–10. doi:10.2989/16085914.2002.9626569
Dudgeon, D., Arthington, A. H., Gessner, M. O., Kawabata, Z. I., Knowler, D. J., Lévêque, C., et al. (2006). Freshwater biodiversity: Importance, threats, status and conservation challenges. Biol. Rev. 81 (2), 163–182. doi:10.1017/S1464793105006950
Dusabe, M. C., Wronski, T., Gomes-Silva, G., Plath, M., Albrecht, C., and Apio, A. (2019). Biological water quality assessment in the degraded Mutara rangelands, northeastern Rwanda. Environ. Monit. Assess. 191 (3), 139. doi:10.1007/s10661-019-7226-5
Dutton, C. L., Subalusky, A. L., Hamilton, S. K., Bayer, E. C., Njoroge, L., Rosi, E. J., et al. (2021). Alternative biogeochemical states of river pools mediated by hippo use and flow variability. Ecosystems 24, 284–300. doi:10.1007/s10021-020-00518-3
Dutton, C. L., Subalusky, A. L., Hamilton, S. K., Rosi, E. J., and Post, D. M. (2018). Organic matter loading by hippopotami causes subsidy overload resulting in downstream hypoxia and fish kills. Nat. Commun. 9 (1), 1951. doi:10.1038/s41467-018-04391-6
Edegbene, A. O., Akamagwuna, F. C., Odume, O. N., Arimoro, F. O., Edegbene Ovie, T. T., Akumabor, E. C., et al. (2022). A macroinvertebrate-based multimetric index for assessing ecological condition of forested stream sites draining Nigerian urbanizing landscapes. Sustainability 14 (18), 11289. doi:10.3390/su141811289
Edegbene, A. O. (2021). Assessing the health of forested riverine systems in the Niger delta area of Nigeria: A macroinvertebrate-based multimetric index approach. Environ. Sci. Pollut. Res. 29, 15068–15080. doi:10.1007/s11356-021-16748-4
Edegbene, A. O., Elakhame, L. A., Arimoro, F. O., Osimen, E. C., and Odume, O. N. (2019). Development of macroinvertebrate multimetric index for ecological evaluation of a river in North Central Nigeria. Environ. Monit. Assess. 191, 274. doi:10.1007/s10661-019-7438-8
Elsenbeer, H. (2001). Hydrologic flowpaths in tropical rainforest soilscapes—A review. Hydrol. Process 15 (10), 1751–1759. doi:10.1002/hyp.237
Eriksen, T. E., Brittain, J. E., Søli, G., Jacobsen, D., Goethals, P., and Friberg, N. (2021). A global perspective on the application of riverine macroinvertebrates as biological indicators in Africa, South-Central America, Mexico and Southern Asia. Ecol. Indic. 126, 107609. doi:10.1016/j.ecolind.2021.107609
Esselman, P. C., Infante, D. M., Wang, L., Cooper, A. R., Wieferich, D., Tsang, Y. P., et al. (2013). Regional fish community indicators of landscape disturbance to catchments of the conterminous United States. Ecol. Indic. 26, 163–173. doi:10.1016/j.ecolind.2012.10.028
Feio, M. J., Hughes, R. M., Callisto, M., Nichols, S. J., Odume, O. N., Quintella, B. R., et al. (2021). The biological assessment and rehabilitation of the world’s rivers: An overview. Water 13 (3), 371. doi:10.3390/w13030371
Fisher, R. A., Corbet, A. S., and Williams, C. B. (1943). The relation between the number of species and the number of individuals in a random sample of an animal population. J. Anim. Ecol. 12, 42–58. doi:10.2307/1411
Fugère, V., Jacobsen, D., Finestone, E. H., and Chapman, L. J. (2018). Ecosystem structure and function of Afrotropical streams with contrasting land use. Freshw. Biol. 63 (12), 1498–1513. doi:10.1111/FWB.13178
Fugère, V., Kasangaki, A., and Chapman, L. J. (2016). Land use changes in an Afrotropical biodiversity hotspot affect stream alpha and beta diversity. Ecosphere 7 (6), e01355. doi:10.1002/ecs2.1355
Gaillardet, J., Dupré, B., Louvat, P., and Allegre, C. J. (1999). Global silicate weathering and CO2 consumption rates deduced from the chemistry of large rivers. Chem. Geol. 159 (1-4), 3–30. doi:10.1016/S0009-2541(99)00031-5
Gerber, A., and Gabriel, M. J. M. (2002). Aquatic invertebrates of South African rivers. Field Guide. Resource quality services. Pretoria: Department of Water Affairs and Forestry.
Gereta, E., Mwangomo, E., and Wolanski, E. (2009). Ecohydrology as a tool for the survival of the threatened Serengeti ecosystem. Ecohydrol. Hydrobiol. 9 (1), 115–124. doi:10.2478/v10104-009-0035-7
Getahun, A., and Stiassny, M. L. (1998). The freshwater biodiversity crisis: The case of the Ethiopian fish fauna. SINET Ethiop. J. Health Sci. 21 (2), 207–230. doi:10.4314/sinet.v21i2.18121
Grill, G., Lehner, B., Thieme, M., Geenen, B., Tickner, D., Antonelli, F., et al. (2019). Mapping the world’s free-flowing rivers. Nature 569 (7755), 215–221. doi:10.1038/s41586-019-1111-9
Hering, D., Feld, C. K., Moog, O., and Ofenböck, T. (2006). Cook book for the development of a multimetric index for biological condition of aquatic ecosystems: Experiences from the European AQEM and STAR projects and related initiatives. Hydrobiologia 566, 311–324. doi:10.1007/s10750-006-0087-2
Herman, M. R., and Nejadhashemi, A. P. (2015). A review of macroinvertebrate-and fish-based stream health indices. Ecohydrol. Hydrobiol. 15 (2), 53–67. doi:10.1016/j.ecohyd.2015.04.001
Hill, M. O. (1973). Diversity and evenness: A unifying notation and its consequences. Ecology 54 (2), 427–432. doi:10.2307/1934352
Hocutt, C. H. P. T., Johnson, C., Hay, C. J., and van Zyl, B. J. (1994). Biological basis of water quality assessment: The okavango river, Namibia. Rev. d’Hydrobiologie Trop. 27, 361–384.
Hoffman, C. M., Melesse, A. M., and McClain, M. E. (2011). “Geospatial mapping and analysis of water availability-demand-use within the Mara River Basin,” in Nile River basin: Hydrology, climate and water use. Editor A. M. Melesse (Dordrecht. New York: Springer), 359–382.
Holdo, R. M., Holt, R. D., and Fryxell, J. M. (2009). Opposing rainfall and plant nutritional gradients best explain the wildebeest migration in the Serengeti. Am. Nat. 173 (4), 431–445. doi:10.1086/597229
Hughes, R. M. (2019). “Ecological integrity: Conceptual foundations and applications,” in Oxford bibliographies in environmental science. Editor E. Wohl (New York: Oxford University Press). doi:10.1093/OBO/9780199363445-0113
Hughes, R. M., Kaufmann, P. R., Herlihy, A. T., Kincaid, T. M., Reynolds, L., and Larsen, D. P. (1998). A process for developing and evaluating indices of fish assemblage integrity. Can. J. Fish. Aquat. 55, 1618–1631. doi:10.1139/f98-060
Hughes, R. M., and Peck, D. V. (2008). Acquiring data for large aquatic resource surveys: The art of compromise among science, logistics, and reality. J. North Am. Benthol. Soc. 27 (4), 837–859. doi:10.1899/08-028.1
Hugueny, B., Camara, S., Samoura, B., and Magassouba, M. (1996). Applying an index of biotic integrity based on fish assemblages in a West African river. Hydrobiologia 331, 71–78. doi:10.1007/BF00025409
Ibarra, D. E., Caves, J. K., Moon, S., Thomas, D. L., Hartmann, J., Chamberlain, C. P., et al. (2016). Differential weathering of basaltic and granitic catchments from concentration–discharge relationships. Geochimica Cosmochimica Acta 190, 265–293. doi:10.1016/j.gca.2016.07.006
Iteba, J. O., Hein, T., Singer, G. A., and Masese, F. O. (2021). Livestock as vectors of organic matter and nutrient loading in aquatic ecosystems in African savannas. PLOS One 16 (9), e0257076. doi:10.1371/journal.pone.0257076
Ives, A. R., and Carpenter, S. R. (2007). Stability and diversity of ecosystems. Science 317, 58–62. doi:10.1126/science.1133258
Jost, L. (2007). Partitioning diversity into independent alpha and beta components. Ecology 88, 2427–2439. doi:10.1890/06-1736.1
Junior, R. F. V., Varandas, S. G., Pacheco, F. A., Pereira, V. R., Santos, C. F., Cortes, R. M., et al. (2015). Impacts of land use conflicts on riverine ecosystems. Land Use Policy 43, 48–62. doi:10.1016/j.landusepol.2014.10.015
Kaaya, L. T., Day, J. A., and Dallas, H. F. (2015). Tanzania River Scoring system (TARISS): A macroinvertebrate-based biotic index for rapid bioassessment of rivers. Afr. J. Aquat. Sci. 40 (2), 109–117. doi:10.2989/16085914.2015.1051941
Kaboré, I., Ouéda, A., Moog, O., Meulenbroek, P., Tampo, L., Bancé, V., et al. (2022). A benthic invertebrates-based biotic index to assess the ecological status of West African Sahel Rivers, Burkina Faso. J. Environ. Manage. 307, 114503. doi:10.1016/j.jenvman.2022.114503
Karr, J. R. (1981). Assessment of biotic integrity using fish communities. Fisheries 6, 21–27. doi:10.1577/1548-8446(1981)006<0021:AOBIUF>2.0.CO;2
Karr, J. R., and Dudley, D. R. (1981). Ecological perspective on water quality goals. Environ. Manage 5, 55–68. doi:10.1007/BF01866609
Kaufmann, P. R., Levine, P., Peck, D. V., Robison, E. G., and Seeliger, C. (1999). Quantifying physical habitat in wadeable streams. Washington, DC, USA: United States Environmental Protection Agency.
Kilonzo, F. N. (2014). Assessing the impacts of environmental changes on the water resources of the upper Mara, Lake Victoria basin. Delft: Vrije Universiteit Brussel and UNESCO-IHE Institute for Water Education. PhD thesis.
Klemm, D. J., Blocksom, K. A., Fulk, F. A., Herlihy, A. T., Hughes, R. M., Kaufmann, P. R., et al. (2003). Development and evaluation of a Macroinvertebrate Biotic Integrity Index (MBII) for regionally assessing mid-Atlantic highlands streams. Environ. Manage 31, 656–669. doi:10.1007/s00267-002-2945-7
Kleynhans, C. J. (1999). The development of a fish index to assess the biological integrity of South Africa rivers. Water sa. 25 (3), 265–278.
Kobingi, N., Raburu, P. O., Masese, F. O., and Gichuki, J. (2009). Assessment of pollution impacts on the ecological integrity of the Kisian and Kisat rivers in Lake Victoria drainage basin, Kenya. Afr. J. Environ. Sci. Technol. 3 (4), 097–107.
Kroese, J. S., Jacobs, S. R., Tych, W., Breuer, L., Quinton, J. N., and Rufino, M. C. (2020). Tropical montane forest conversion is a critical driver for sediment supply in East African catchments. Water Resour. Res. 56, e2020WR027495. doi:10.1029/2020WR027495
Kurtz, J. C., Jackson, L. E., and Fisher, W. S. (2001). Strategies for evaluating indicators based on guidelines from the environmental protection agency's office of research and development. Ecol. Indic. 1, 49–60. doi:10.1016/s1470-160x(01)00004-8
Lake, P. S. (2000). Disturbance, patchiness, and diversity in streams. J. North Am. Benthol. Soc. 19, 573–592. doi:10.2307/1468118
Lakew, A., and Moog, O. (2015). A multimetric index based on benthic macroinvertebrates for assessing the ecological status of streams and rivers in central and southeast highlands of Ethiopia. Hydrobiologia 751 (1), 229–242. doi:10.1007/s10750-015-2189-1
Leung, A. S., Li, A. O., and Dudgeon, D. (2012). Scales of spatiotemporal variation in macroinvertebrate assemblage structure in monsoonal streams: The importance of season. Freshw. Biol. 57 (1), 218–231. doi:10.1111/j.1365-2427.2011.02707.x
Lloyd, M., and Ghelardi, R. J. (1964). A table for calculating the "equitability" component of species diversity. J. Anim. Ecol. 33, 217–225. doi:10.2307/2628
Lunde, K. B., and Resh, V. H. (2012). Development and validation of a macroinvertebrate index of biotic integrity (IBI) for assessing urban impacts to Northern California freshwater wetlands. Environ. Monit. Assess. 184, 3653–3674. doi:10.1007/s10661-011-2214-4
Mangadze, T., Bere, T., and Mwedzi, T. (2016). Choice of biota in stream assessment and monitoring programs in tropical streams: A comparison of diatoms, macroinvertebrates and fish. Ecol. Indic. 63, 128–143. doi:10.1016/j.ecolind.2015.11.029
Mangadze, T., Dalu, T., and Froneman, P. W. (2019). Biological monitoring in southern Africa: A review of the current status, challenges and future prospects. Sci. Total Environ. 648, 1492–1499. doi:10.1016/j.scitotenv.2018.08.252
Mango, L. M., Melesse, A. M., McClain, M. E., Gann, D., and Setegn, S. (2011). Land use and climate change impacts on the hydrology of the upper Mara River Basin, Kenya: Results of a modeling study to support better resource management. Hydrol. Earth Syst. Sci. 15 (7), 2245–2258. doi:10.5194/hess-15-2245-2011
Masese, F. O., Kitaka, N., Kipkemboi, J., Gettel, G. M., Irvine, K., and McClain, M. E. (2014a). Litter processing and shredder distribution as indicators of riparian and catchment influences on ecological health of tropical streams. Ecol. Indic. 46, 23–37. doi:10.1016/j.ecolind.2014.05.032
Masese, F. O., Kitaka, N., Kipkemboi, J., Gettel, G. M., Irvine, K., and McClain, M. E. (2014b). Macroinvertebrate functional feeding groups in Kenyan highland streams: Evidence for a diverse shredder guild. Freshw. Sci. 33, 435–450. doi:10.1086/675681
Masese, F. O., Muchiri, M., and Raburu, P. O. (2009b). Macroinvertebrate assemblages as biological indicators of water quality in the Moiben River, Kenya. Afr. J. Aquatic Sci. 34, 15–26. doi:10.2989/AJAS.2009.34.1.2.727
Masese, F. O., Raburu, P. O., and Muchiri, M. (2009a). A preliminary benthic macroinvertebrate index of biotic integrity (B-IBI) for monitoring the Moiben River, Lake Victoria Basin, Kenya. Afr. J. Aquat. 34, 1–14. doi:10.2989/AJAS.2009.34.1.1.726
Masese, F. O., Abrantes, K. G., Gettel, G. M., Irvine, K., Bouillon, S., and McClain, M. E. (2018). Trophic structure of an african savanna river and organic matter inputs by large terrestrial herbivores: A stable isotope approach. Freshw. Biol. 63 (11), 1365–1380. doi:10.1111/fwb.13163
Masese, F. O., Achieng, A. O., O’Brien, G. C., and McClain, M. E. (2021). Macroinvertebrate taxa display increased fidelity to preferred biotopes among disturbed sites in a hydrologically variable tropical river. Hydrobiologia 848 (2), 321–343. doi:10.1007/s10750-020-04437-1
Masese, F. O., Achieng’, A. O., Raburu, P. O., Lawrence, T., Ives, J. T., Nyamweya, C., et al. (2020). Distribution patterns and diversity of riverine fishes of the Lake Victoria Basin, Kenya. Int. Rev. Hydrobiol. 105 (5-6), 171–184. doi:10.1002/iroh.202002039
Masese, F. O., Arimoro, F. O., and O’Brien, G. (2022). Advances in biomonitoring for the sustainability of vulnerable african riverine ecosystems. Lausanne: Frontiers Media SA. doi:10.3389/978-2-88974-223-3
Masese, F. O., Omukoto, J. O., and Nyakeya, K. (2013). Biomonitoring as a prerequisite for sustainable water resources: A review of current status, opportunities and challenges to scaling up in East Africa. Ecohydrol. Hydrobiol. 13 (3), 173–191. doi:10.1016/j.ecohyd.2013.06.004
Masese, F. O., and Raburu, P. O. (2017). Improving the performance of the EPT Index to accommodate multiple stressors in Afrotropical streams. Afr. J. Aquat. Sci. 42 (3), 219–233. doi:10.2989/16085914.2017.1392282
Masese, F. O., Salcedo-Borda, J. S., Gettel, G. M., Irvine, K., and McClain, M. E. (2017). Influence of catchment land use and seasonality on dissolved organic matter composition and ecosystem metabolism in headwater streams of a Kenyan river. Biogeochemistry 132 (1), 1–22. doi:10.1007/s10533-016-0269-6
Mathooko, J. M. (2001). Disturbance of a Kenya Rift Valley stream by the daily activities of local people and their livestock. Hydrobiologia 458 (1), 131–200. doi:10.1023/A:1013160918203
Mathooko, J. M., Mpawenayo, B., Kipkemboi, J. K., and M’Erimba, C. M. (2005). Distributional patterns of diatoms and Limnodrilus Oligochaetes in a Kenyan dry streambed following the 1999–2000 drought conditions. Int. Rev. Hydrobiology 90, 185–200. doi:10.1002/iroh.200310708
Mati, B. M., Mutie, S., Gadain, H., Home, P., and Mtalo, F. (2008). Impacts of land-use/cover changes on the hydrology of the transboundary Mara River, Kenya/Tanzania. Lake Reserv. Manag. 13 (2), 169–177. doi:10.1111/j.1440-1770.2008.00367.x
Mbaka, J. G., M'Erimba, C. M., Thiongo, H. K., and Mathooko, J. M. (2014). Water and habitat quality assessment in the Honi and Naro Moru rivers, Kenya, using benthic macroinvertebrate assemblages and qualitative habitat scores. Afr. J. Aquat. 39, 361–368. doi:10.2989/16085914.2014.976168
McClain, M. E., Subalusky, A. L., Anderson, E. P., Dessu, S. B., Melesse, A. M., Ndomba, P. M., et al. (2014). Comparing flow regime, channel hydraulics, and biological communities to infer flow–ecology relationships in the Mara River of Kenya and Tanzania. Hydrol. Sci. J. 59 (3-4), 801–819. doi:10.1080/02626667.2013.853121
Melesse, A., McClain, M., Abira, M., Mutayoba, W., and Wang, X. M. (2008). Modeling the impact of land-cover and rainfall regime change scenarios on the flow of Mara River, Kenya. World Environ. Water Resour. Congr. doi:10.1061/40976(316)558
Melo, A. S., and Froehlich, C. G. (2001). Macroinvertebrates in neotropical streams: Richness patterns along a catchment and assemblage structure between 2 seasons. J. North Am. Benthol. Soc. 20 (1), 1–16. doi:10.2307/1468184
Menhinick, E. F. (1964). A comparison of some species-individuals diversity indices applied to samples of field insects. Ecology 45 (4), 859–861. doi:10.2307/1934933
Mereta, S. T., Boets, P., De Meester, L., and Goethals, P. L. (2013). Development of a multimetric index based on benthic macroinvertebrates for the assessment of natural wetlands in Southwest Ethiopia. Ecol. Indic. 29, 510–521. doi:10.1016/j.ecolind.2013.01.026
M’Erimba, C. M., Mathooko, J. M., Karanja, H. T., and Mbaka, J. G. (2014). Monitoring water and habitat quality in six rivers draining the Mt. Kenya and Aberdare Catchments using Macroinvertebrates and Qualitative Habitat Scoring. Egert. J. Sci. Technol. 14, 81–104.
Merritt, R. W., and Cummins, K. W. (2008). An introduction to the Aquatic insects of North America. Dubuque, Iowa: Kendall/Hunt Publishing Company.
Minaya, V., McClain, M. E., Moog, O., Omengo, F., and Singer, G. (2013). Scale-dependent effects of rural activities on benthic macroinvertebrates and physico-chemical characteristics in headwater streams of the Mara River, Kenya. Ecol. Indic. 32, 116–122. doi:10.1016/j.ecolind.2013.03.011
Moges, A., Beyene, A., Kelbessa, E., Mereta, S. T., and Ambelu, A. (2016). Development of a multimetric plant-based index of biotic integrity for assessing the ecological state of forested, urban and agricultural natural wetlands of Jimma Highlands, Ethiopia. Ecol. Indic. 71, 208–217. doi:10.1016/j.ecolind.2016.06.057
Mouchet, M. A., Villeger, S., Mason, N. W., and Mouillot, D. (2010). Functional diversity measures: An overview of their redundancy and their ability to discriminate community assembly rules. Funct. Ecol. 24, 867–876. doi:10.1111/j.1365-2435.2010.01695.x
Mthimkhulu, S., Dallas, H., Day, J., and Hoko, Z. (2004). “Biological assessment of the state of the water quality in the Mbuluzi River, Swaziland,” in Proceedings of the IWA specialist group conference on water and wastewater management for developing countries (Livingstone).
Musonge, P. L. S., Boets, P., Lock, K., Ambarita, M. N. D., Forio, M. A. E., and Goethals, P. L. (2020). Rwenzori score (RS): A benthic macroinvertebrate index for biomonitoring rivers and streams in the rwenzori region, Uganda. Sustainability 12 (24), 10473. doi:10.3390/su122410473
Mwedzi, T., Bere, T., and Mangadze, T. (2016). Macroinvertebrate assemblages in agricultural, mining, and urban tropical streams, implications for conservation, and management. Environ. Sci. Pollut. Res. 23, 11181–11192. doi:10.1007/s11356-016-6340-y
Neter, J., and Wasserman, W. (1974). Applied linear statistical models: Regression, analysis of variance, and experimental designs.CRC Press Homewood, Illinois.
O'keeffe, J. H., and De Moor, F. C. (1988). Changes in the physico-chemistry and benthic invertebrates of the Great Fish River, South Africa, following an interbasin transfer of water. Reg. Riv. Res. Manag. 2 (1), 39–55. doi:10.1002/rrr.3450020105
O'Keeffe, J. H., and Dickens, C. W. S. (2008). “Aquatic invertebrates Ch17, 231-244,” in Environmental flow assessments for rivers: Manual for the building block methodology. Editors J. M. King, R. E. Tharme, and M. S. de Villiers Updated Edition. WRC Report No: TT 131/00.
Ochieng, H., Gandhi, W. P., Magezi, G., Okot-Okumu, J., and Odong, R. (2021). Diversity of benthic macroinvertebrates in anthropogenically disturbed Aturukuku River, Eastern Uganda. Afr. Zool. 56 (2), 85–103. doi:10.1080/15627020.2021.1885309
Odume, O. N., Muller, W. J., Arimoro, F. O., and Palmer, C. G. (2012). The impact of water quality deterioration on macroinvertebrate communities in the swartkops river, South Africa: A multimetric approach. Afr. J. Aquat. 37 (2), 191–200. doi:10.2989/16085914.2012.670613
Odume, O. N., and Muller, W. J. (2011). Diversity and structure of Chironomidae communities in relation to water quality differences in the Swartkops River. Phys. Chem. Earth 36 (14-15), 929–938. doi:10.1016/j.pce.2011.07.063
Ofogh, A. R. E., Dorche, E. E., Birk, S., and Bruder, A. (2023). Effect of seasonal variability on the development and application of a novel Multimetric Index based on benthic macroinvertebrate communities – a case study from streams in the Karun river basin (Iran). Ecol. Indic. 146, 109843. doi:10.1016/j.ecolind.2022.109843
Oigara, D. K., and Masese, F. O. (2017). Evaluation of the South African Scoring System (SASS 5) biotic index for assessing the ecological condition of the Mara River, Kenya. Afr. J. Educ. Sci. Technol. 4, 41–51.
O’Keeffe, J. H., and de Moor, F. C. (1988). Changes in the physicochemistry and benthic invertebrates of the Great Fish River, South Africa, following an interbasin transfer of water. Reg. Riv. Res. Manage. 2, 39–55. doi:10.1002/rrr.3450020105
Olawusi-Peters, O. O., and Ajibare, A. O. (2014). Species richness, diversity and abundance of some Decapod Crustaceans in coastal waters of Ondo State, South West, Nigeria. Heavy metals Environ. 1 (5), 44–51.
Pielou, E. C. (1975). Ecological diversity. New York: John Wiley and Sons. No. 574.524018 P5). doi:10.4319/lo.1977.22.1.0174b
Raburu, P. O., Masese, F. O., and Tonderski, K. S. (2017). Use of macroinvertebrate assemblages for assessing performance of stabilization ponds treating effluents from sugarcane and molasses processing. Environ. Monit. Assess. 189, 79. doi:10.1007/s10661-017-5786-9
Raburu, P. O., and Masese, F. O. (2012). Development of a fish-based index of biotic integrity (FIBI) for monitoring riverine ecosystems in the Lake Victoria drainage Basin, Kenya. River Res. Appl. 28 (1), 23–38. doi:10.1002/rra.1428
Raburu, P. O., Masese, F. O., and Mulanda, C. A. (2009a). Macroinvertebrate index of biotic integrity (M-IBI) for monitoring rivers in the upper catchment of Lake Victoria basin, Kenya. Aquat. Ecosyst. Health Manag. 12, 197–205. doi:10.1080/14634980902907763
Raburu, P. O., Masese, F. O., and Okeyo-Owuor, J. B. (2009b). Macroinvertebrate-based index of biotic integrity (MIBI) for monitoring the nyando river, Lake Victoria basin, Kenya. Sci. Res. Essays 4, 1468–1477. doi:10.1080/14634980902907763
Raburu, P. O., Mwasi, B. N., and Masese, F. O. (2022). Low diversity of fishes in high elevation Afrotromontane streams renders them unsuitable for biomonitoring. J. Ecol. 60, 1029–1042. In press. doi:10.1111/aje.13056
Raburu, P. O. (2003). Water quality and the status of aquatic macroinvertebrates and ichthyofauna in River Nyando, Kenya (Kenya: Moi University). PhD thesis.
Reid, A. J., Carlson, A. K., Creed, I. F., Eliason, E. J., Gell, P. A., Johnson, P. T., et al. (2019). Emerging threats and persistent conservation challenges for freshwater biodiversity. Biol. Rev. 94 (3), 849–873. doi:10.1111/brv.12480
Resh, V. H., and Jackson, J. K. (1993). “Rapid assessment approaches to biomonitoring using benthic macroinvertebrates,” in Freshwater biomonitoring and benthic macroinvertebrates. Editors D. M. Rosenberg, and V. H. Resh (New York: Chapman and Hall), 195–233.
Rivers-Moore, N. A., De Moor, F. C., Morris, C., and O'keeffe, J. (2007). Effect of flow variability modification and hydraulics on invertebrate communities in the Great Fish River (Eastern Cape Province, South Africa), with particular reference to critical hydraulic thresholds limiting larval densities of Simulium chutteri Lewis (Diptera, Simuliidae). River Res. Appl. 23, 201–222. doi:10.1002/rra.976
Rosenberg, D. M., and Resh, V. H. (1993). Freshwater biomonitoring and benthic macroinvertebrates. New York: Chapman and Hall.
Ruaro, R., and Gubiani, É. A. (2013). A scientometric assessment of 30 years of the index of biotic integrity in aquatic ecosystems: Applications and main flaws. Ecol. Indic. 29, 105–110. doi:10.1016/j.ecolind.2012.12.016
Ruaro, R., Gubiani, E. A., Hughes, R. M., and Mormul, R. P. (2020). Global trends and challenges in multimetric indices of biological condition. Ecol. Indic. 110, 105862. doi:10.1016/j.ecolind.2019.105862
Samways, M. J., and Steytler, N. S. (1996). Dragonfly (Odonata) distribution patterns in urban and forest landscapes, and recommendations for riparian management. Biol. Conserv. 78, 279–288. doi:10.1016/S0006-3207(96)00032-8
Saunders, T. J., McClain, M. E., and Llerena, C. A. (2006). The biogeochemistry of dissolved nitrogen, phosphorus, and organic carbon along terrestrial-aquatic flowpaths of a montane headwater catchment in the Peruvian Amazon. Hydrol. Process. Int. J. 20 (12), 2549–2562. doi:10.1002/hyp.6215
Sayer, C. A., Máiz-Tomé, L., and Darwall, W. R. T. (2018). Freshwater biodiversity in the Lake Victoria Basin: Guidance for species conservation, site protection, climate resilience and sustainable livelihoods. Cambridge, UK and Gland, Switzerland: IUCN. xiv +226pp.
Seeteram, N. A., Hyera, P. T., Kaaya, L. T., Lalika, M. C., and Anderson, E. P. (2019). Conserving rivers and their biodiversity in Tanzania. Water 11 (12), 2612. doi:10.3390/w11122612
Serneels, S., Said, M. Y., and Lambin, E. F. (2001). Land cover changes around a major east african wildlife reserve: The Mara ecosystem (Kenya). Int. J. Remote Sens. 22 (17), 3397–3420. doi:10.1080/01431160152609236
Shannon, C. E. (1948). A mathematical theory of communication. Bell Syst. Tech. J. 27, 379–423. doi:10.1002/j.1538-7305.1948.tb01338.x
Shivoga, W. A. (2001). The influence of hydrology on the structure of invertebrate communities in two streams flowing into Lake Nakuru, Kenya. Hydrobiologia 458, 121–130. doi:10.1023/A:1013108917295
Soko, M. I., and Gyedu-Ababio, T. (2015). The spatial and temporal variations of ichythyofauna and water quality in the crocodile river (east), mpumalanga, South Africa. J. water Resour. Prot. 7 (03), 152. doi:10.4236/jwarp.2015.73013
Stears, K., McCauley, D. J., Finlay, J. C., Mpemba, J., Warrington, I. T., Mutayoba, B. M., et al. (2018). Effects of the hippopotamus on the chemistry and ecology of a changing watershed. Proc. Natl. Acad. Sci. 115 (22), E5028–E5037. doi:10.1073/pnas.1800407115
Stevenson, R. J., Zalack, J. T., and Wolin, J. (2013). A multimetric index of lake diatom condition based on surface-sediment assemblages. Freshw. Sci. 32 (3), 1005–1025. doi:10.1899/12-183.1
Stoddard, J. L., Herlihy, A. T., Peck, D. V., Hughes, R. M., Whittier, T. R., and Tarquinio, E. (2008). A process for creating multimetric indices for large-scale aquatic surveys. J. North Am. Benthol. Soc. 27, 878–891. doi:10.1899/08-053.1
Strayer, D. L., and Dudgeon, D. (2010). Freshwater biodiversity conservation: Recent progress and future challenges. J. North Am. Benthol. Soc. 29 (1), 344–358. doi:10.1899/08-171.1
Sundstrom, S. M., Eason, T., Nelson, R. J., Angeler, D. G., Barichievy, C., Garmestani, A. S., et al. (2017). Detecting spatial regimes in ecosystems. Ecol. Lett. 20, 19–32. doi:10.1111/ele.12709
Tampo, L., Lazar, I. M., Kaboré, I., Oueda, A., Akpataku, K. V., Djaneye-Boundjou, G., et al. (2020). A multimetric index for assessment of aquatic ecosystem health based on macroinvertebrates for the Zio river basin in Togo. Limnologica 83, 125783. doi:10.1016/j.limno.2020.125783
Thirion, C. (2016). The determination of flow and habitat requirements for selected riverine macroinvertebrates (South Africa: North-West University). Doctoral Thesis.
Thorne, R., and Williams, W. P. (1997). The response of benthic macroinvertebrates to pollution in developing countries: A multimetric system of bioassessment. Freshw. Biol. 37, 671–686. doi:10.1046/j.1365-2427.1997.00181.x
Toham, K. A., and Teugels, G. G. (1999). First data on an Index of Biotic Integrity (IBI) based on fish assemblages for the assessment of the impact of deforestation in a tropical West African river system. Hydrobiologia 397, 29–38. doi:10.1023/a:1003605801875
Tumusiime, J., Tolo, C. U., Dusabe, M. C., and Albrecht, C. (2019). Reliability of the Tanzania River Scoring system (TARISS) macroinvertebrate index of water quality: A case study of the river mpanga system, Uganda. J. Freshw. Ecol. 34 (1), 541–557. doi:10.1080/02705060.2019.1631895
Turibamwe, E., and Wangalwa, R. (2020). A comparative study of two biological monitoring systems in assessing water quality: A case of river birira, sheema district, Uganda. Water Conserv. Manag. 4, 07–14. doi:10.26480/wcm.01.2020.07.14
USEPA (2016). National rivers and streams 2008–2009: A collaborative survey. Washington, DC: Office of Water and Office of Research and Development. EPA/ 841/R-16/007.
Vadas, R. L., Hughes, R. M., Bae, Y. J., Baek, M. J., Gonzáles, O. C. B., Callisto, M., et al. (2022). Assemblage-based biomonitoring of freshwater ecosystem health via multimetric indices: A critical review and suggestions for improving their applicability. Water Biol. Secur. 1, 100054. doi:10.1016/j.watbs.2022.100054
Velasco, J., and Millan, A. (1998). Insect dispersal in a drying desert stream: Effects of temperature and water loss. Southwest. Nat 43 (1), 80–87.
Vörösmarty, C. J., McIntyre, P. B., Gessner, M. O., Dudgeon, D., Prusevich, A., Green, P., et al. (2010). Global threats to human water security and river biodiversity. Nature 467 (7315), 555–561. doi:10.1038/nature09440
Wanderi, E. W., Singer, G., Gettel, G. M., and Masese, F. O. (2022). Drivers of water quality in Afromontane-savanna rivers. Front. Environ. Sci. 1846. doi:10.3389/fenvs.2022.972153
Washington, H. (1984). Diversity, biotic and similarity indices: A review with special relevance to aquatic ecosystems. Water Res. 18, 653–694. doi:10.1016/0043-1354(84)90164-7
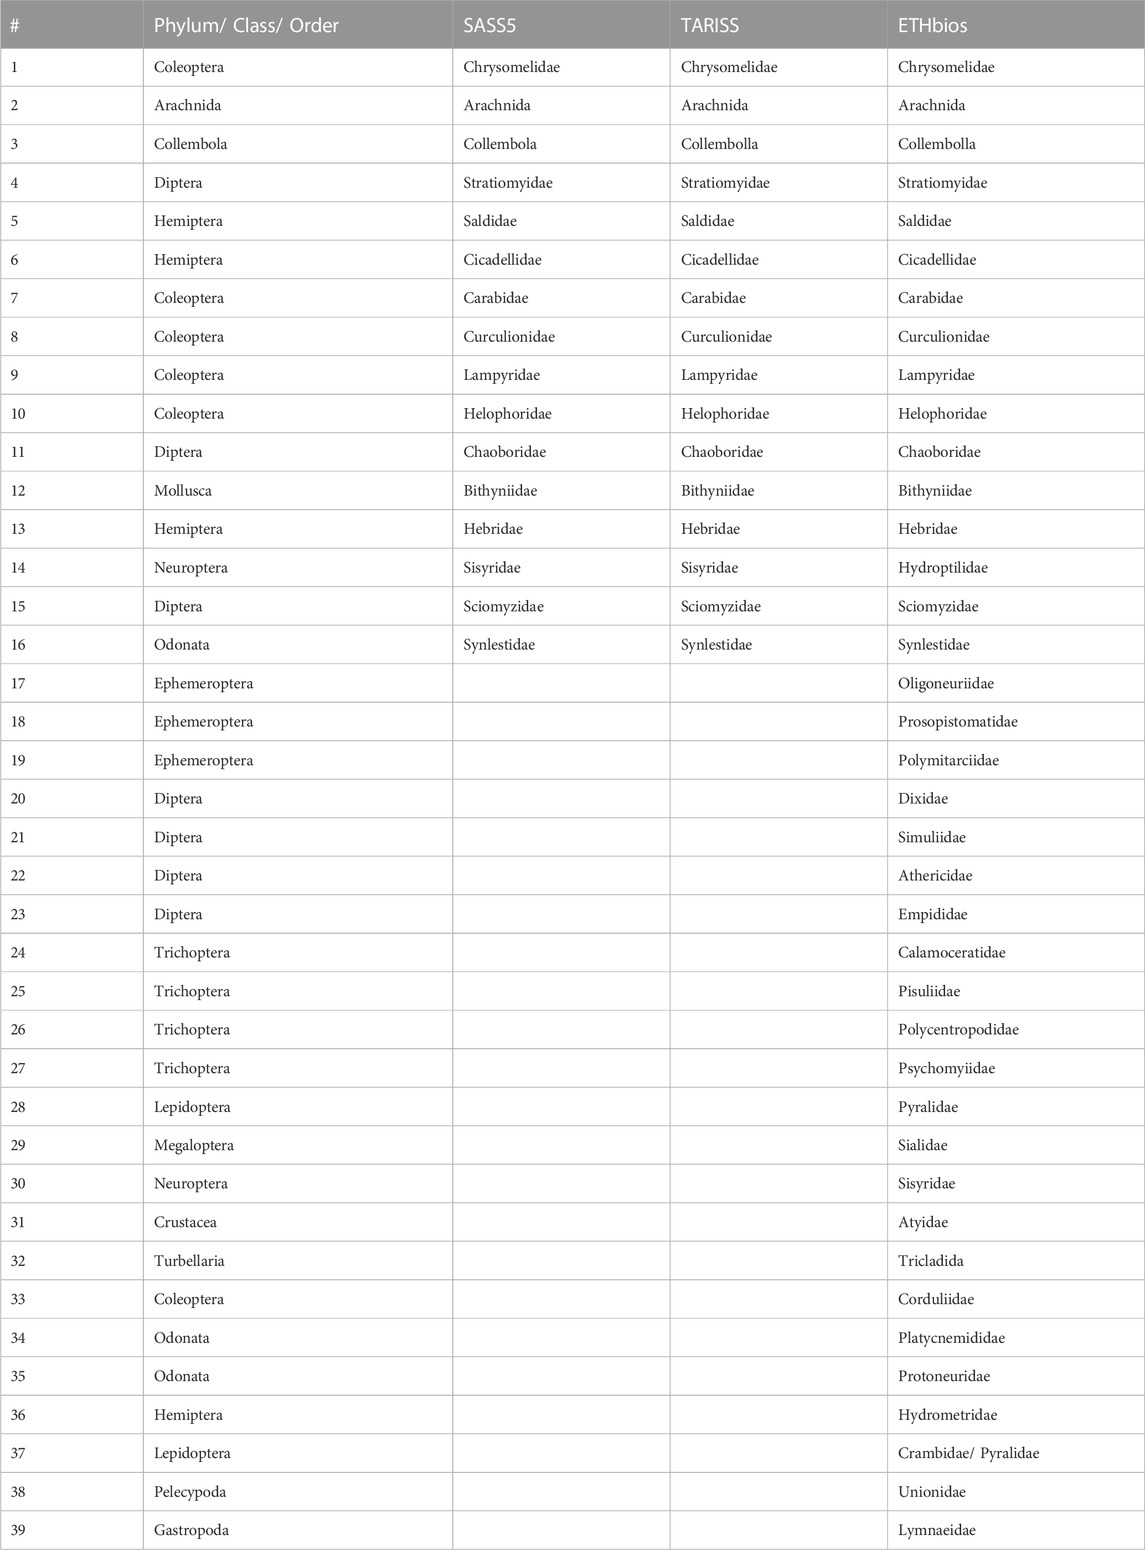
TABLE A1. List of taxa (families) in the Mara River basin that are missing sensitivity scores in the South African Scoring System version 5 (SASS5), Tanzanian River Scoring System (TARISS) and the biotic index for the Ethiopian highlands (ETHbios) biotic indices.
Keywords: Afrotropics, biomonitoring, diversity, flow alteration effects, land use change, savanna rivers, water quality
Citation: Masese FO, Wanderi EW, Nyakeya K, Achieng AO, Fouchy K and McClain ME (2023) Bioassessment of multiple stressors in Afrotropical rivers: Evaluating the performance of a macroinvertebrate-based index of biotic integrity, diversity, and regional biotic indices. Front. Environ. Sci. 11:1015623. doi: 10.3389/fenvs.2023.1015623
Received: 09 August 2022; Accepted: 23 February 2023;
Published: 15 March 2023.
Edited by:
Qinghua Cai, Institute of Hydrobiology (CAS), ChinaReviewed by:
Augustine Ovie Edegbene, Federal University of Health Sciences Otukpo, NigeriaCopyright © 2023 Masese, Wanderi, Nyakeya, Achieng, Fouchy and McClain. This is an open-access article distributed under the terms of the Creative Commons Attribution License (CC BY). The use, distribution or reproduction in other forums is permitted, provided the original author(s) and the copyright owner(s) are credited and that the original publication in this journal is cited, in accordance with accepted academic practice. No use, distribution or reproduction is permitted which does not comply with these terms.
*Correspondence: Frank O. Masese, Zi5tYXNlc2VAZ21haWwuY29t, Zm1hc2VzZUB1b2VsZC5hYy5rZQ==
Disclaimer: All claims expressed in this article are solely those of the authors and do not necessarily represent those of their affiliated organizations, or those of the publisher, the editors and the reviewers. Any product that may be evaluated in this article or claim that may be made by its manufacturer is not guaranteed or endorsed by the publisher.
Research integrity at Frontiers
Learn more about the work of our research integrity team to safeguard the quality of each article we publish.