- 1Department of Animal Science, Central University of Himachal Pradesh, Shahpur, India
- 2Aquatic Biology Lab, Department of Zoology, Panjab University, Chandigarh, India
- 3Centre for Computational Biology and Bioinformatics Central University of Himachal Pradesh, Himachal, India
The present study deals with an account of the primary productivity and trophic status of Rewalsar, Kuntbhyog, and Prashar lakes of Western Himalayas. Seasonal variations in gross primary productivity (GPP) (g C m–2 day–1), net primary productivity (NPP, respiration (R), and the NPP/R ratio have been studied and compared with hydrobiological factors. Among various factors, temperature, light, nutrients, and chlorophyll a were accountable for high productivity. Nygaard’s trophic state indices were calculated. GPP showed a positive relationship with water temperature, penetration of light, nitrate, and with phosphate. The extensive range of the compound index observed in Rewalsar (12.00–20.00) and Kuntbhyog lakes (12.50–18.00) confirmed their eutrophic nature. Based on the trophic classification of waters and on the basis of productivity, Nygaard’s trophic state indices, and richness of nutrients, Rewalsar and Kuntbhyog lakes could be categorized as eutrophic, whereas Prashar Lake, as oligo-eutrophic. Based on the presence, absence, frequency of appearance, and abundance of different organisms recorded during the present investigation, bioindicators of trophic status have been determined.
Introduction
Many shallow lakes in different regions of the world have been subjected to eutrophication in the last century (Scheffer, 1998). Studies made by several workers have shown marked differences in the biotic composition of oligotrophic and eutrophic waters, and various species of different groups of plankton have been identified as indicators of trophic status (Ganapati, 1960; Hutchinson, 1967; Palmer, 1969; Jindal and Thakur, 2009; Thakur et al., 2013). Every water body has a particular “trophic state,” which changes over a period of time. Eutrophication, the biological response to the excess input of nutrients into a water body, can arise rarely under natural conditions but is more commonly recognized as a consequence of human activities (Moss, 2009). Cunha et al. (2013) reported that ultraoligotrophic or oligotrophic lakes have low productivity. Changes in the aquatic environment accompanying anthropogenic pollution are a cause of growing concern and require monitoring of the surface waters and organisms inhabiting them (Vandysh, 2004). The mere presence of these plankton indicates the status of water bodies and can be used as a reliable tool for the assessment of the water quality of freshwater bodies. The influence of eutrophication is usually associated with a loss of structural diversity, and as a result, a diminution in biodiversity at the higher trophic levels takes place (Hanson and Butler, 1994; Gaur, 1997). Although oligotrophic lakes are generally clear, hypertrophic lakes are frequently turbid, and shallow lakes at intermediate nutrient concentrations may exhibit either clear water or turbid states (Scheffer et al., 1993).
For the last few decades, freshwater bodies like lakes facing the stress of pollution due to anthropogenic activities have become a serious problem all over the world (Jindal and Vatsal, 2005; Thakur et al., 2022). Because of global climate change, gross primary productivity (GPP) is often one of the most important components of aquatic food webs in lakes and reservoirs (Malik et al., 2021). Due to the rapid global climate change, lakes and reservoirs are gradually becoming warmer and receiving more terrestrial-colored dissolved organic carbon (Malik et al., 2021; Puts et al., 2022). The habitat ecological parameters of high-altitude water bodies have significantly contributed to altering the magnitude of biological dynamics and shown interrelationships, either positive or negative, in an existing ecosystem (Malik and Bharti, 2012). Plankton also play an important role in the productivity of freshwater bodies and thus act as primary producers in lake ecosystems (Patil, 2012). Based upon the aforementioned factors, the primary aim of the present research was to estimate the differentiation pattern with respect to the productivity and trophic nature of some selected lakes of Western Himalayas.
Materials and methods
Study area
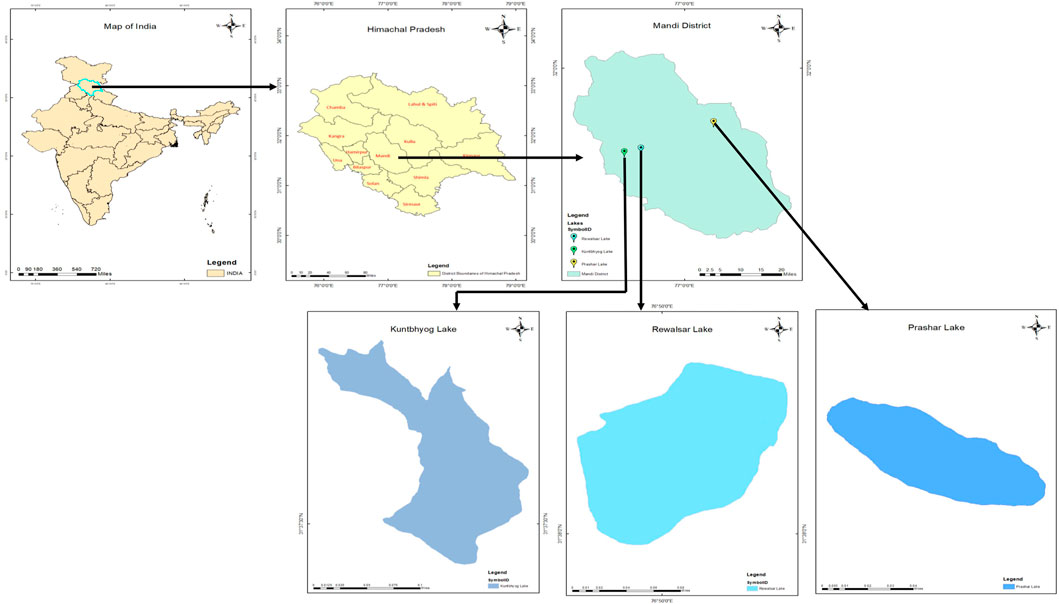
The present study has been conducted on three freshwater lakes viz., Rewalsar , Kuntbhyog , and Prashar lakes in the Mandi district (Long: 76o 37′ 20” - 77o 23′ 15″ E, Lat: 31o 13′ 50” - 32o 04′ 30″ N) of Himachal Pradesh (Figure 1). The topographic details of these lakes are as follows: Rewalsar Lake is situated at 1,360 m above MSL (76°49′E, 31°37′N). It is oval in shape, having a depth of 6 m and an area of 2.6 ha. There are two seasonal inlets and one perennial outlet with definite boundaries bordered by thick patches of macrophytic vegetation. Kuntbhyog Lake is situated at 1750 m above MSL (76°49′6″E, 31°37′N). It is crescent in shape, having a depth of 12–15 m and an area of 3 ha. The lake is surrounded by mountains and forests. It is spring and rain fed and is without any specific outlet. The water of the lake is used for drinking and irrigation. Prashar Lake is situated at 2,730 m above MSL (77° 06′ E, 31°45′30″N). It is oval in shape, having a depth of 4–5 m and an area of 2.3 ha. It is surrounded by mountains. The water of this lake is used for drinking and domestic purposes. In the winter, this lake is surrounded by snow.
Sampling and analysis
For the present studies, water samples were collected monthly from the selected lakes for a period of 2 years, from March 2007 to February 2009. The physicochemical parameters of the water were analyzed according to the standard methods (APHA, 2005). Identification of the plankton was performed following Smith (1950), Desikachary (1959), Edmondson (1959), Kudo (1986), and Pennak (1978). Parameters, like temperature, pH, dissolved oxygen, and electrical conductance, were measured with the help of a Multi 340i/set water analysis kit, penetration of light with a Secchi disc, free carbon dioxide by the titrimetric method, and TDS with a TDS meter on the spot. For the rest of the parameters, 2.5 L of the water sample was brought to the laboratory. It was filtered and analyzed for turbidity, total alkalinity, total hardness, chloride, nitrate, nitrite, phosphate, and silicate. The primary productivity of the ecosystems was determined by the “light and dark bottle method” (Wetzel and Likens, 2000). Dissolved oxygen values (mg L–1 h–1) of gross primary productivity (GPP), net primary productivity (NPP), and community respiration (CR) were converted in g C m–2 d–1. Primary productivity was estimated thrice a day, i.e., morning, midday, and evening, and the average value was taken. For the assessment of chlorophyll “a,” 200 mL of the water sample containing phytoplankton was centrifuged. The settled mass of phytoplankton was treated with 1% MgCO3 solution and 90% acetone. After that, this sample was kept at 4 °C in the dark for 24 h to extract the pigment. The extract was again centrifuged for 20 min at 2,500–3,000 rpm for clarification. The volume of the clear extract was made to a fixed volume. The optical density (OD) at wavelengths 750 nm, 630 nm, 647 nm, and 664 nm was noted spectrophotometrically. The OD at 750 nm is a correction for turbidity. Chlorophyll “a” was calculated by inserting observed optical densities in the following equation (APHA, 2005):
where
OD 664, OD 647, and OD 630 are corrected optical densities at respective wavelengths.
By knowing the pigment concentration, the chlorophyll value of the sample was calculated by the following formula:
Statistical analysis
Biodiversity indices and the trophic status index (Nygaard, 1949; Shannon and Wiener, 1949; Simpson, 1949; Margalef, 1958; Berger and Parker, 1970) were determined. Statistical analysis was carried out using the PASW 19 software package (SPSS Inc.). Logarithmic transformation was applied to phytoplankton and zooplankton abundance data. The TN/TP ratio was calculated and taken as one individual variable. Plankton population, with eight physicochemical parameters with a complete data set, were accessed with the Kaiser–Meyer–Olkin (KMO) measure of sample adequacy, and Bartlett’s test of sphericity (w2 with degrees of freedom = 1/2 [p(p - 1)]) was used to verify the applicability of PCA and t-stochastic neighbor embedding (t-SNE). A decision tree-based water sample classification system was developed on the basis of selected physico-chemical features with a significant Gini index. The parameters governing the lake productivity were also analyzed by PCA. Correlation analysis is only appropriate to explore the relationship between variables and not to infer a causal relationship. In descriptive statistics, a box plot or boxplot (also known as a box and whisker plot) is a type of chart often used in explanatory data analysis. Box plots visually show the distribution of numerical data and skewness by displaying the data quartiles (or percentiles) and averages. Box plots show the five-number summary of a set of data, including the minimum score, first (lower) quartile, median, third (upper) quartile, and maximum score.
Results
The physico-chemical factors in Rewalsar, Kuntbhyog, and Prashar lakes that ranged monthly are as follows: the temperature of water (°C) 10.00–27.20, 8.10–26.00, and 5.00–22.60, with lower values during winter and higher values during late summer; electrical conductivity (µS cm–1) 180.00–460.00, 135.00–385.00, and 114.00–285.00, with lower values during winter and higher values during late summer; pH 7.05–8.34, 7.90–8.64, and 7.22–8.24, with lower values during monsoon and higher values during winter; total dissolved solids (mg L–1) 115.00–294.00, 86.00–246.00, and 72.00–182.00, with lower values during winter and higher values during late summer; penetration of light (cm) 30.80–137.20, 72.50–230.20, and 22.80–178.30, with lower values during monsoon and higher values during winter; turbidity (NTU) 45.50–350.40, 3.50–65.40, and 3.30–74.20, with lower values during winter and higher values during monsoon; dissolved oxygen (mg L-1) 3.05–9.98, 6.92–12.32, and 5.45–13.21, with lower values during summer and higher values during winter; BOD (mg L-1) 0.00–8.20, 0.55–4.00, and 0.20–4.00, with lower values during winter and higher values during summer and monsoon; free carbon dioxide (mg L–1) 0.00–32.46, 0.00–20.05, and 1.55–25.20, with lower values during winter and higher values during summer and monsoon; carbonate (mg L–1) 0.00–6.80, 0.00–24.20, and 0.00–0.00, present only during winter and early summer; bicarbonate (mg L–1) 91.20–170.50, 68.80–150.00, and 60.40–95.05, with lower values during winter and higher values during monsoon; total hardness (mg L–1) 101.00–182.30, 52.05–123.22, and 20.04–75.25, with lower values during winter and higher values during late summer and monsoon; chloride (mg L–1) 23.18–58.20, 7.20–20.08, and 4.80–9.05, with lower values during winter and higher values during summer; ammonia (µg L–1) 8.20–36.40, 0.00–11.30, and 0.00–5.00, with lower values during winter and higher values during monsoon; nitrite (µg L–1) 0.00–62.40, 12.10–55.00, and 0.00–48.50, with lower values during winter and higher values during summer and monsoon; nitrate (µg L–1) 90.60–320.60, 70.80–210.20, and 30.40–130.30, with lower values during winter and higher values during monsoon; phosphate (µg L–1) 28.20–110.70, 14.20–61.40, and 5.00–24.50, with lower values during winter and higher values during late summer and monsoon; sulfate (mg L–1) 138.00–280.60, 30.15–140.20, and 16.35–80.07, with lower values during winter and higher values during summer; and silicate (mg L-1) 4.83–13.15, 3.45–13.15, and 7.10–17.52, with lower values during winter and higher values during monsoon and post-monsoon.
Plankton were composed of phytoplankton and zooplankton. Among these, phytoplankton constituted the dominant component, and zooplankton constituted the subdominant component. Amongst phytoplankton, Cyanophyceae (Anabaena sp. and Oscillatoria sp.) and Bacillariophyceae (Cosmarium sp. and Staurastrum sp.) constituted the dominant/subdominant component; Chlorophyceae (Ankistrodesmus sp., Pediastrum sp. and Scenedesmus sp.) was subdominant; and Euglenophyceae, Chrysophyceae (Dinobryon sp.), Cryptophyceae, and Dinophyceae were the minor components. Among zooplankton, Rotifera (Rotaria rotatoria, Brachionus angularis) formed the dominant component; Protozoa, Cladocera (Daphnia magna), and Copepoda (Cyclops brevicornis) formed the subdominant component, whereas Ostracoda formed the minor component.
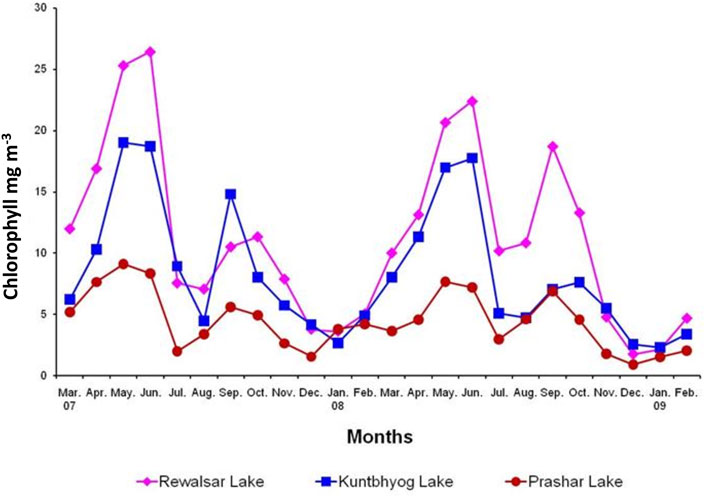
The monthly average value of chlorophyll ‘a’ (mg m-3) and its range were 11.440 ± 7.724 (3.608–26.429), 8.982 ± 5.640 (2.662–19.008), and 4.873 ± 2.457 (1.560–9.120) in 2007–08, and 11.037 ± 6.989 (1.738–22.386), 7.678 ± 5.186 (2.277–17.727), and 4.034 ± 2.313 (0.905–7.678) in 2008–09 in Rewalsar, Kuntbhyog, and Prashar lakes, respectively (Figure 2).
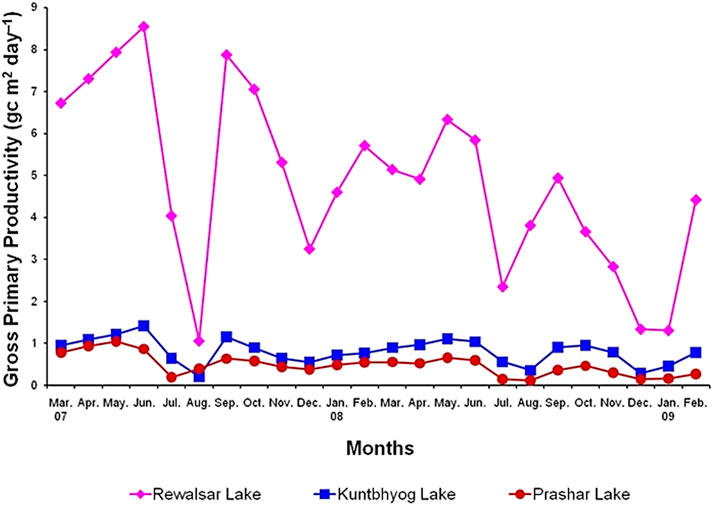
Monthly values of gross primary productivity (GPP), net primary productivity (NPP), and community respiration (CR) in the different lakes are depicted in Figure 3. The monthly average values of GPP (g C m–2 day–1) with its range were 5.782 ± 2.232 (1.055–8.540), 0.848 ± 0.333 (0.203–1.407), and 0.602 ± 0.252 (0.192–1.037) in 2007–08, and 3.906 ± 1.663 (1.305–6.329), 0.750 ± 0.275 (0.282–1.098), and 0.355 ± 0.195 (0.111–0.652) in 2008–09 in Rewalsar, Kuntbhyog, and Prashar lakes, respectively. The monthly average values of respiration (g C m–3 day–1) with its range were 3.732 ± 1.948 (0.695–7.072), 0.480 ± 0.245 (0.137–0.991), (0.316–0.798), and 0.192 ± 0.116 (0.060–0.375) in 2008–09 in Rewalsar, Kuntbhyog, and Prashar lakes, respectively (Figure 4).
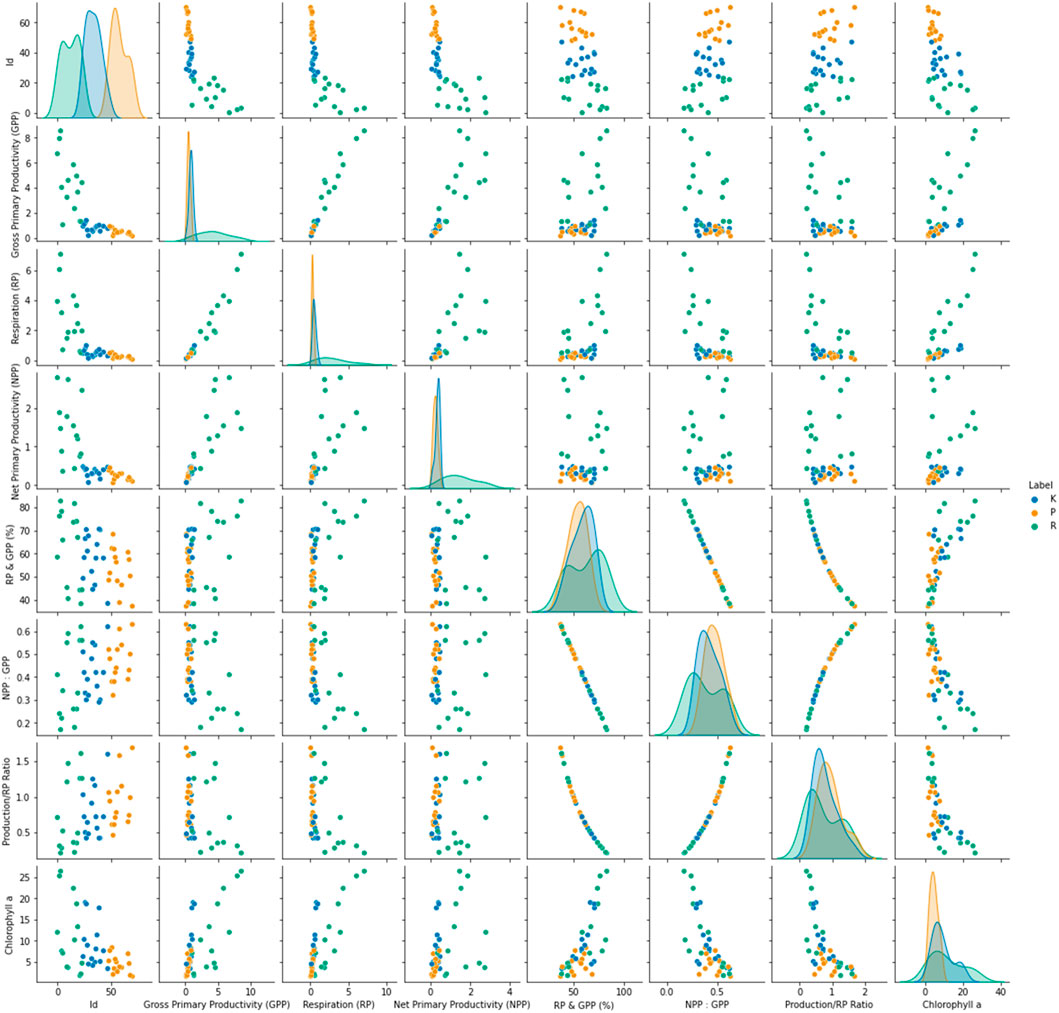
FIGURE 4. Productivity analysis of three lakes in the Western Himalayan region: Rewalsar (R-Green), Kuntbhyog (K-Orange), and Prashar (P-blue) lakes. The data on gross primary productivity (GPP), respiration (RP), net primary productivity (NPP), chlorophyll a, and their respective proportions were plotted for the three lakes. The parametric spread for the three lakes indicated the relative similarity in K and P lakes vis-à-vis R. The GPP of K and P was very low as compared to R. The GPP of R demonstrated a very wide variation. Inclusion of the respiration parameter makes this difference more pronounced.
Correlation analysis in the interval/ratio variable prerequisites confirms a linear relationship and no outlier in the data using scatterplots. This technique was applied to determine the highest correlating factors, as shown in Figure 5. The physico-chemical parameters of the three lakes were subjected to correlation analysis to identify the most significant contributors to the information content of the data. The penetration of light did not correlate with any other factor. The dissolved oxygen had a high degree of relationship with pH. Turbidity correlated with the nitrites, sulfates, phosphates, and other inorganic salts. Interestingly, free CO2 showed a high degree of correlation with the nitrites. One reason for this could be a bloom of microbes due to the increased nitrogen content, which led to the increased decay of organic matter, thereby increasing the free CO2 concentration.
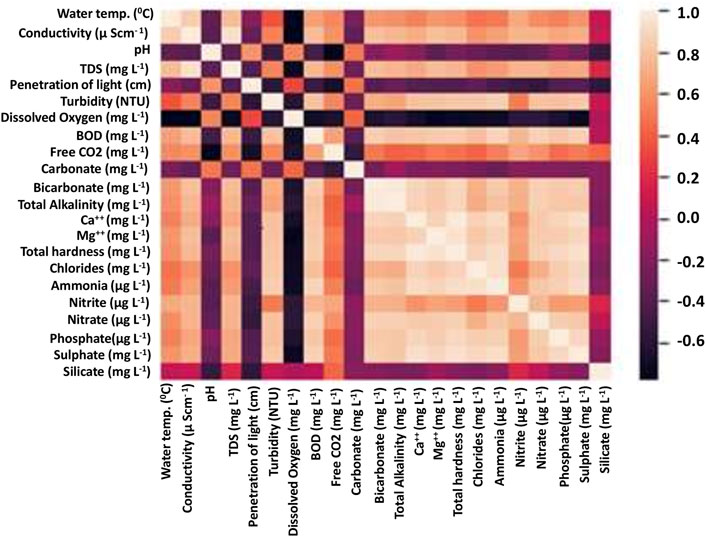
FIGURE 5. Correlation among various factors. The negative correlation depicts the inverse relationship (for instance, between dissolved oxygen and salt concentration).
The spread of some of the high-information content parameters was analyzed through box plots. The box plots were created for the five factors with the highest information-contributing potentials (Figure 6). This showed a clear correlation with the altitude of the lakes, for instance, the total alkalinity for Prashar Lake was the least, and that of Rewalsar was the highest. A similar trend was observed for the total hardness and TDS parameters. The penetration of light was inversely proportional to the dissolved solids, and this was also evident from the data on the three lakes. The penetration of light was the highest for Prashar Lake and the least for Rewalsar Lake. The penetration of light was inversely proportional to the concentration of silicates. This was supported by the strong negative correlation observed between the two parameters. The pH value and concentration of carbonate salts had an insignificant correlation with the penetration of light. One reason for this observation is perhaps the colorless nature of most of the carbonate salts. Another interesting pattern that emerged was a negative correlation between the concentration of CO2 and the concentration of carbonates. The concentration of dissolved oxygen exhibited a negative correlation with most of the parameters. This is a peculiar pattern as this factor alone could be a very high information parameter with respect to the pollution level in the water bodies. Silicate concentration was more of a neutral parameter as it showed almost no correlation with other parameters, except penetration of light (Figure 7).
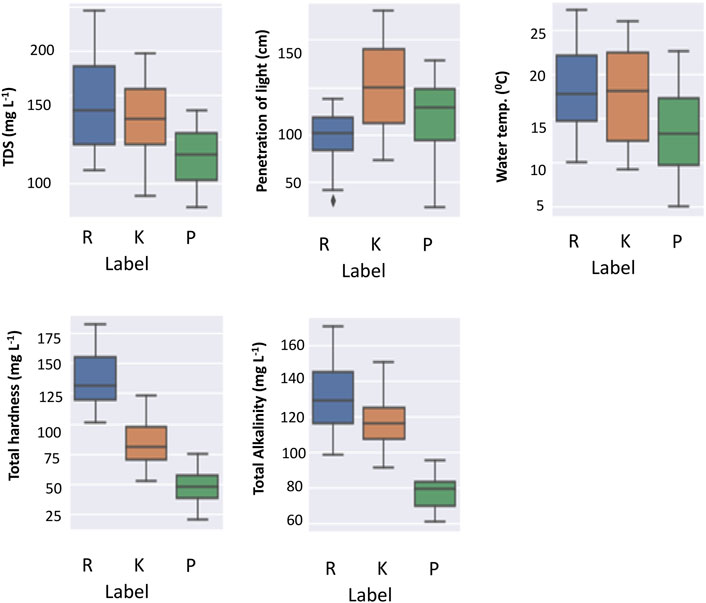
FIGURE 6. Top five parameters that contributed the information entropy were analyzed for the spread. Rewalsar (R-Blue), Kuntbhyog (K-Orange), and Prashar (P-green) lakes. The spread of the values of the three lakes is shown.
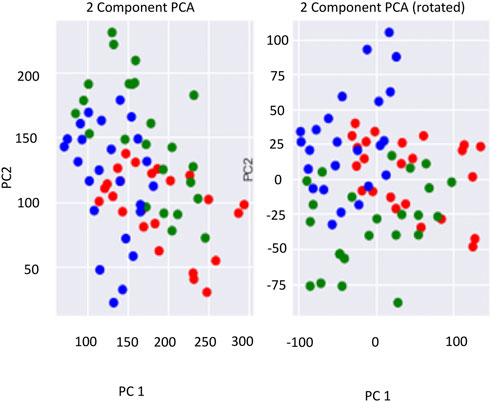
FIGURE 7. Two-component principal component analysis of the parameters for the three lakes. The green rounded circles represent Prashar Lake; the red rounded circles represent Kuntbhyog Lake, and the blue rounded circles represent Rewalsar Lake.
Principal component analysis (PCA) is an important technique to understand in the fields of statistics and data science, especially with respect to large datasets, which are often difficult to interpret. PCA is a technique for reducing the dimensionality of large datasets. It improves the interpretability of the factors while simultaneously minimizing information loss by maximizing variance. Finding such new variables, the principal components reduce to solve an eigenvalue/eigenvector problem, and the new variables are defined by the dataset at hand, not a priori, hence making PCA an adaptive data analysis technique. A two-component PCA was applied to the lake data to understand the differentiation pattern amongst the data regarding the lakes (Figure 7).
Discussion
A definite pattern in seasonal variations in GPP was observed. Irrespective of differences in the production capacities, all the lakes showed a bimodal pattern of rise and fall in productivity. Higher values of GPP were recorded during summer and post-monsoon, and least, during monsoon (July–August) and winter. High productivity during summer and post-monsoon could be attributed to higher values of temperature, alkalinity, hardness, nutrients and phytoplankton, and moderate values of water turbidity. Singh et al. (2016) reported higher productivity during winter and spring, whereas lower productivity in monsoon and in summer in Nachiketa Tal Lake, and also explained that higher productivity in winter and spring might be due to the abundance of plankton in these seasons. Scharfenberger et al., 2019 reported that GPP and NPP were significantly higher in eutrophic mesocosms than in mesotrophic mesocosms.
The maximum value of respiration was recorded during summer and post-monsoon, and the minimum, in winter. However, the respiration percentage of GPP was Rewalsar > Kuntbhyog > Prashar Lake and was maximum during monsoon and minimum in the winter. Higher values during monsoon were due to high temperatures enhancing the rate of respiration of organisms and the low ratio of producers to consumers.
The lowest value of GPP was recorded during monsoon, which was because of high turbidity, cloudy weather, and dilution in the concentration of some salts, whereas relatively less productivity during winter was mainly because of low values of temperature and nutrients. A similar pattern of seasonal fluctuations in productivity was reported by Zafar (1986) in his work on south Indian waters, Sen et al. (1992) on Ranchi lakes (Bihar), and Verma and Mohanty (1994) on Orissa lakes. The summer peak of GPP was also reported by Murugavel and Pandian (2000) in a Tamil Nadu reservoir and Wanganeo (1984) in a Kashmir lake. However, Durve and Rao (1987) registered higher values during July and November in Rajasthan Lake. According to Feresin et al. (2010), the Lower Mekong Basin (LMB) water bodies have an annual PP ranging from 40 to 302 g C/m2/y, which is lower than the PP previously reported for tropical reservoirs in Asia, Africa, and South America.
A direct relationship was recorded between water temperature and productivity (r = 0.491 in Rewalsar Lake, r = 0.483 in Kuntbhyog Lake, and r = 0.402 in Prashar Lake). This is in agreement with the findings of Khatri (1984), Durve and Rao (1987), Singh (1990), Verma and Mohanty (1994), and Jindal and Prajapat (2005). Conversely, during the present investigation during monsoon and on certain occasions during summer, a decline in productivity was recorded. This, as suggested by Oswald (1988), was because at higher temperatures, a greater fraction of daily organic production was consumed in respiration. The water qualities of hill streams have fundamentally contributed to altering the magnitude of biological dynamics and shown interrelationships, either positive or negative, in an existing environment (Malik and Bharti, 2012).
Verma and Mohanty (1994), in their work on Orissa lakes, observed an inverse correlation between alkalinity and primary productivity. However, present findings are in conformity with the findings of Sreenivasan (1964), Vijayaraghavan (1971a, b), and Singh (1986). However, Khatri (1984) reported a linear correlation between these factors only during the summer months.
The ebb and flow in the values of chlorophyll “a” were similar to those of gross primary productivity. Higher values were observed during summer and post-monsoon, and lower values during, winter and monsoon. A positive correlation (p ≤ 0.01) between primary productivity and chlorophyll “a” was observed in the present study. The results of the present findings are in concurrence with those of Durve and Rao (1987). However, Kalff (1967) and Bohra (1976), during their investigations, reported that primary production and chlorophyll ‘a’ were correlated in certain seasons only. Durve and Rao (1987) and Verma and Datta Munshi (1989) also observed a positive correlation with chlorophyll “a,” although it was not statistically significant.
During the present investigation in Rewalsar Lake, at certain times, the respiration was 98.80%, thereby depicting the insalubrious condition of the lake. A high rate of respiration could be endorsed to a higher microbial population dominant in the lake (Saha and Pandit, 1987). Rewalsar Lake showed unhealthy and polluted status. The Shannon–Wiener index of species diversity for the planktonic community was also found to decrease with the increase in eutrophication.
On comparing the productivity of the three lakes under investigation, it was found that the value of GPP was less in Prashar Lake, which could be because of the less number of phytoplankton, low values of chlorophyll “a,” and nutrients. The contemporary examination also proved that the members of Cyanophyceae and Chlorococcales were found commonly in the eutrophic waters of Rewalsar and Kuntbhyog lakes, while desmids were found to tolerate high nutrient levels, and these showed abundance in Prashar Lake with oligotrophic conditions (Rawson, 1956; Brook, 1965; Patrick, 1965; Palmer, 1969). Only 1 desmid species was collected in Rewalsar Lake, 5 species in Kuntbhyog Lake, and 11 species in Prashar Lake. It was also observed that GPP values were higher in tropical fresh waters than those in temperate fresh waters. This might be due to uniformly high temperatures, greater intensity of solar radiation, and absence of critical winter season in tropical conditions. Temperature and light were never a limiting factor under tropical conditions, and the addition of a small amount of nutrients greatly increased the productivity (Marshall and Falconer, 1973; Jindal and Thakur, 2009; Thakur et al., 2013; Jindal and Thakur, 2014). A similar observation was recorded by Jindal and Thakur (2014) while working on Kuntbhyog Lake, and it was observed that plankton diversity depends upon water quality and different habitat parameters. During the present investigation, it was observed that an increase in temperature enhanced the production. During summer, both temperature and production were at the peak, but during monsoon season (July–August), in spite of the higher temperature, productivity was lowest, which was due to high turbidity, resulting in less penetration of light and less phytoplankton.
During the present investigation, the monthly average values of the P/R ratio in different lakes were 0.679 ± 0.405 (0.208–1.467), 0.843 ± 0.310 (0.420–1.361), and 0.989 ± 0.435 (0.462–1.913) in 2007–08, and 0.657 ± 0.506 (0.012–1.610), 0.882 ± 0.547 (0.377–1.806), and 0.937 ± 0.363 (0.543–1.687) in 2008–09 in Rewalsar, Kuntbhyog, and Prashar lakes, respectively. These values were the lowest in the cloudburst (July–August) due to high temperature, low penetration of light, and a decline in the density of phytoplankton. The present findings are in concurrence with the findings of Oswald (1988), Jindal and Prajapat (2005), and Thakur et al. (2013).
Monthly fluctuations in the values of various Nygaard’s trophic status indices (Nygaard, 1949) and the resultant trophic status of the lakes under investigation have been given in Supplementary Tables S1–S4. Relatively, a wide range in the values of Myxophycean, Chlorophycean, and compound indices and a narrow range for Euglenophycean indices were observed. However, in Prashar Lake, the Chlorophycean index showed a wide range (1.50–1.75) and the Euglenophycean index showed a narrow range (0.20–0.50). The wide range of the Chlorophycean index in this lake could be attributed to a relatively higher number of desmid species, and the narrow range of the Euglenophycean index was because of the low number of euglenoid species. Furthermore, it is supported by the presence of more desmids and fewer euglenoids due to low nutrients in this lake. A relatively wide range of compound index values in Rewalsar (12.00–20.00) and Kuntbhyog lakes (12.50–18.00) confirmed their eutrophic nature. This might be due to the addition of organic water observed during present studies of animal origin. However, a narrow range of the compound index was observed in Prashar Lake (3.00–3.30). It was also noted that pinnate diatoms generally did not tolerate a high nutrient level as 18 species of pinnate diatoms were encountered in Prashar Lake, which is oligotrophic Thakur et al., 2013.
As suggested by Datta (1997), the eutrophic nature of Rewalsar Lake is further confirmed by the higher values of GPP. The classification of the trophic status of European water bodies in relation to productivity has been given by Vollenweider (1968) and Rodhe (1969). According to Vollenweider (1968), water having a primary productivity rate of 65–300 mg C m–2 day–1 was considered to be oligotrophic, 250–1,000 mg C m–2 day–1 as mesotrophic, and 1,000–8,000 mg C m–2 day–1 as eutrophic. Contrary to this, Rodhe (1969) has given the values 30–100 mg C m–2 day–1 for oligotrophic and 300–1,000 mg C m–2 day–1 for natural eutrophic waters. Gessner (1949) reported that the gross primary productivity of temperate eutrophic water varies between 500 and 5,000 mg C m–2 day–1. Based on the trophic classification of water given by the aforementioned studies and on the basis of productivity among the lakes under study, Rewalsar Lake could be designated as eutrophic, Kuntbhyog Lake as mesotrophic to eutrophic, and Prashar Lake as oligotrophic–mesotrophic in nature. To sum up, on the basis of Nygaard’s trophic state indices, productivity values, and richness of nutrients, Rewalsar and Kuntbhyog lakes could be categorized as eutrophic and Prashar Lake as oligotrophic to eutrophic.
Statistics of the principal component analysis showed that eigen values were a maximum of 2.948, 2.511, and 3.416; the correlation was less, i.e., 42.114, 41.846, and 42.706, of Rewalsar, Kuntbhyog, and Prashar lakes, respectively. Plankton with physicochemical parameters showed a direct correlation, and some showed a negative correlation (Figure 5). Malik et al. (2021) reported that phytoplanktons showed a negative correlation with temperature, pH, alkalinity sodium, etc., and a positive correlation with D.O. and water velocity. This study highlights that plankton’s growth directly or indirectly depended upon D.O. and the flow of the lakes and rivers.
Studies conducted by several workers have shown marked differences in the floristic composition of oligotrophic and eutrophic waters, and various species of different groups of algae have been identified as indicators of the level of trophic status (Hutchinson, 1967; Palmer, 1969; Thakur et al., 2013). Hutchinson (1967) and Thakur et al. (2013) described eutrophic diatom association as Asteronella sp., Fragilaria sp., Melosira sp., Stephanodiscus sp., and Synedra sp.; eutrophic Myxophycean association as Aphanizomenon sp., Anabaena sp., and Oscillatoria sp.; eutrophic desmideae association as Cosmarium sp. and Staurastrum sp.; and eutrophic Chlorococcales association as Ankistrodesmus sp., Pediastrum sp., and Scenedesmus sp.
Forms like Asplanchna brightwelli (Gosse), Brachionus angularis (Gosse), Cyclops brevicornis (Baird), Chlorella vulgaris Beyerinck (Beijerinck), Closterium acerosum (Ehrenberg), Chlamydomonas reinhardi (Dangeard), Cryptomonas erosa (Ehrenberg), Daphnia magna (Straus), Microcystis aeruginosa (Kützing), Euglena oxyuris (Ehrenberg), E. viridis (Ehrenberg), Gomphonema gracile (Ehrenberg), Navicula cryptocephela (Kützing), Nitzschia palea (Kützing), Oscillatoria limosa (Agardh), Rotaria rotatoria (Pallas), Scenedesmus qudricauda (Meyen), Synedra ulna (Ehrenberg) Nitzschia, and Vorticella convallaria (Linnaeus), were tolerant to eutrophic conditions, whereas species like Closterium pseudodianae, Daphnia sp., Dimorphococcus lunatus (Braun), Dinobryon sp. (Ehrenberg), Euastrum sp. (Ehrenberg), Euchlanis dialata (Ehrenberg), Gloeocapsa sp. (Kützing), Notholca sp. (Gosse), Synura adamsii (Ehrenberg), and Vorticella nebularia (Linnaeus) were found to be sensitive to eutrophic conditions.
Conclusion
During the present study, the GPP (g C m2 d-1) of Rewalsar Lake ranged from 3.906 ± 1.663 to 5.782 ± 2.232, followed by Kuntbhyog Lake (0.750 ± 0.275 to 0.848 ± 0.333) and Prasher Lake (0.355 ± 0.195 to 0.602 ± 0.252). The NPP of Rewalsar Lake ranged from 1.055 ± 1.663 to 5.782 ± 2.232, followed by Kuntbhyog Lake (0.750 ± 0.275 to 0.848 ± 0.333) and Prasher Lake (0.355 ± 0.195 to 0.602 ± 0.252). A higher diversity index was recorded in Prasher Lake, and a lower diversity index, in Rewalsar Lake. The habitat ecological parameters, i.e., temperature, light intensity, nutrients, and chlorophyll-a, were liable for higher productivity. Based on the results of habitat ecological parameters, GPP, chlorophyll-a, and planktonic composition of the lakes, it may be concluded that these lakes are tending toward fast eutrophism, particularly Rewalsar Lake. The changes in temporal and spatial composition of the plankton that occurred in the three lakes were mainly due to eutrophication. In addition, from the study, it was clearly observed that dissolved oxygen was the dominant parameter for the pristine nature of freshwater bodies. The anthropogenic activities, urbanized catchment areas, and agricultural runoff were mainly responsible for the eutrophication of these lakes. These kinds of activities should be consistently checked and should be checked by scientific methods.
Data availability statement
The original contributions presented in the study are included in the article/Supplementary Material; further inquiries can be directed to the corresponding author.
Author contributions
RK and RJ: conceived the idea; RK: prepared the study design; DM, MK, and AS: data mining; RK, MK, DS, and KT: data analysis; SK, AK, AS, and BB: formal analysis; RK, MK, and DS: original draft preparation; SK, AK, RK, and RJ: manuscript editing.
Acknowledgments
The authors wish to acknowledge the Chairperson, Department of Zoology, Panjab University, for providing the necessary laboratory facilities; Prof. A.S. Ahluwalia, Department of Botany, Panjab University, Chandigarh, for his assistance in the identification of the phytoplankton; the Chio Lou Faculty of Science and Technology, Department of Civil and Environmental Engineering, University of Macau, China, for helping with calculation and PCA application; and to UGC (F.5-4/2006 (SAP-II) for the financial assistance to Rakesh Kumar.
Conflict of interest
The authors declare that the research was conducted in the absence of any commercial or financial relationships that could be construed as a potential conflict of interest.
Publisher’s note
All claims expressed in this article are solely those of the authors and do not necessarily represent those of their affiliated organizations, or those of the publisher, the editors, and the reviewers. Any product that may be evaluated in this article, or claim that may be made by its manufacturer, is not guaranteed or endorsed by the publisher.
Supplementary material
The Supplementary Material for this article can be found online at: https://www.frontiersin.org/articles/10.3389/fenvs.2023.1009942/full#supplementary-material
References
APHA (2005). Standard methods for the examination of water and wastewater. 21st Edition. Washington DC: American Public Health Association/American Water Works Association/Water Environment Federation.
Berger, W. H., and Parker, F. L. (1970). Diversity of planktonic foraminifera in deep-sea sediments. Science 168 (3937), 1345–1347. doi:10.1126/science.168.3937.1345
Brook, A. J. (1965). Planktonic algae as indicators of lake types, with special reference to the Desmidiaceae. Limnol. Oceanogr. 10 (3), 403–411. doi:10.4319/lo.1965.10.3.0403
Cunha, D. G. F., do Carmo Calijuri, M., and Lamparelli, M. C. (2013). A trophic state index for tropical/subtropical reservoirs (TSItsr). Ecol. Eng. 60, 126–134. doi:10.1016/j.ecoleng.2013.07.058
Datta, S. (1997). Ecosystem health assessment in five tropical waterbodies Proc 84th Indian Sci Cong Part III University of Delhi. New Delhi, 54.
Durve, V. S., and Rao, P. S. (1987). Seasonal variation in primary productivity and its interrelationship with chlorophyll in the lake jaisamand (Rajasthan, India). Acta Hydrochim. Hydrobiol. 15 (4), 379–387. doi:10.1002/aheh.19870150409
Edmondson, W. T. (1959). Ward and whipple’s fresh water Biology. 2nd ed. New York: John Wiley & Sons, 1248.
Feresin, E. G., Arcifa, M. S., Silva, L. H. S. D., and Esguícero, A. L. H. (2010). Primary productivity of the phytoplankton in a tropical Brazilian shallow lake: Experiments in the lake and in mesocosms. Acta Limnol. Bras. 22, 384–396. doi:10.4322/actalb.2011.004
Ganapati, S. V. (1960). “Ecology of tropical waters,” in Proceedings of symposium on algalogy ICAR advances in aquatic ecology (New Delhi: Daya Publishing House), 204–218.
Gaur, R. K. (1997). “Effects of Microcystis aeruginosa bloom on the density and diversity of cyanophycean population in a tropical pond,” in Proceedings of the 84th Indian science congress Part III (New Delhi: University of Delhi).
Gessner, F. (1949). Der Chlorophyllgehalt im See und seine photosynthetische Valenz als geophysikalisches Problem. Schweiz. Z. für Hydrol. 11 (3), 378–410. doi:10.1007/bf02503359
Hanson, M. A., and Butler, M. G. (1994). Responses to food web manipulation in a shallow waterfowl lake. Hydrobiologia 279 (1), 457–466. doi:10.1007/bf00027877
Hutchinson, G. E. (1967). A treatise on limnology introduction to lake Biology and the limnoplankton vol II. New York: John Wiley & Sons, 1115.
Jindal, R,., and Thakur, R. (2009). Biodiversity and trophic status in relation to hydrobiological factors of Rewalsar Wetland (District Mandi, Himachal Pradesh) India. J. Aqua. Biol. 24 (2), 50–56.
Jindal, R., and Prajapat, P. (2005). Productivity and trophic status of renuka wetland (distt. Sirmour, Himachal Pradesh). Indian J. Ecol. 32 (2), 180–183.
Jindal, R., and Thakur, R. K. (2014). Hydrobiology and productivity of Kuntbhyog Lake,(District Mandi, Himachal Pradesh). India. Int. J. Environ. Eng. 6 (4), 449–459.
Kalff, J. (1967). Phytoplankton abundance and primary production rates in two arctic ponds. Ecology 48 (4), 558–565. doi:10.2307/1936499
Khatri, T. C. (1984). Seasonal variation in primary production in relation to some limnological features in Lakhotia lake (India). Proc. Anim. Sci. 93 (7), 697–702. doi:10.1007/bf03186320
Kudo, R. R. (1986). Protozoology. 1st Indian Edition. New Delhi (India): Books and Periodicals Corporation, 1174.
Malik, D. S., and Bharti, U. (2012). Status of plankton diversity and biological productivity of Sahastradhara stream at Uttarakhand, India. J. Appl. Nat. Sci. 4 (1), 96–103. doi:10.31018/jans.v4i1.231
Malik, D. S., Sharma, M. K., Sharma, A. K., Kamboj, V., and Sharma, A. K. (2021). Anthropogenic influence on water quality and phytoplankton diversity of upper ganga basin: A case study of ganga river and its major tributaries. World Water Policy 7 (1), 88–111. doi:10.1002/wwp2.12049
Marshall, B. E., and Falconer, A. (1973). Physico-chemical aspects of Lake McIlwaine (Rhodesia), a eutrophic tropical impoundment. Hydrobiologia 42 (1), 45–62. doi:10.1007/bf00014145
Murugavel, P., and Pandian, T. J. (2000). Effect of altitude on hydrology, productivity and species richness in Kodayar–a tropical peninsular Indian aquatic system. Hydrobiologia 430 (1), 33–57. doi:10.1023/a:1004069013459
Nygaard, G. (1949). Hydrobiological studies on some Danish ponds and lakes. Kongl. Dan. Vid. Selsk. Biol. Skr. Kobenhavn. 7 (1), 1–293.
Oswald, W. J. (1988). in Micro-algae and wastewater treatment in microalgal biotechnology. Editors M. A. Borowitzka, and L. Z. Browitzke (Cambridge: Cambridge University Press), 305–329.
Palmer, C. M. (1969). Composite rating of algae tolerating organic pollution. Br. Phycol. Bull. 5, 78–92.
Patil, A. (2012). Temporal and spatial changes in phytoplankton in water bodies of Sangli district, Maharashtra. Ecoscan 6 (1&2), 23–28.
Patrick, R. (1965). in Algae as indicator of pollution in biological problems in water pollution. Editor R. A. Taft (Cincinnati, OH: US Department of Health Education and Welfare PHS Publications Cincinnati Ohio USA), 223–231.
Puts, I. C., Bergström, A. K., Verheijen, H. A., Norman, S., and Ask, J. (2022). An ecological and methodological assessment of benthic gross primary production in northern lakes. Ecosphere 13 (3), e3973. doi:10.1002/ecs2.3973
Rawson, D. S. (1956). Algal indicators of trophic lake types. Limnol. Oceanogr. 1 (1), 18–25. doi:10.4319/lo.1956.1.1.0018
Rodhe, W. (1969). Crystallization of eutrophication concepts in northen europe in eutrophication – causes consequences and correctives. Washington DC: National Academy of Sciences, 50–64.
Saha, L. C., and Pandit, B. (1987). Comparative primary production in one pond and river system at Bhagalpur, India. Limnologica 18 (2), 313–316.
Scharfenberger, U., Jeppesen, E., Beklioğlu, M., Søndergaard, M., Angeler, D. G., Çakıroğlu, A. İ., et al. (2019). Effects of trophic status, water level, and temperature on shallow lake metabolism and metabolic balance: A standardized pan-European mesocosm experiment. Limnol. Oceanogr. 64 (2), 616–631. doi:10.1002/lno.11064
Scheffer, M., Hosper, S. H., Meijer, M. L., Moss, B., and Jeppesen, E. (1993). Alternative equilibria in shallow lakes. Trends Ecol. Evol. 8 (8), 275–279. doi:10.1016/0169-5347(93)90254-m
Sen, N. S., Horo, P., and Mishra, V. K. (1992). Physico-chemistry, nutrient budget and the factors influencing primary production in a tropical lake. J. Freshwat. Biol. 4 (2), 141–153.
Shannon, C. E., and Wiener, W. (1949). The mathematical theory of communication. Urbana: University of Illinois Press, 117.
Singh, D. F. (1986). Relationships between primary productivity and environmental parameters of tropical lakes an statistical analysis. Poll. Res. 5 (3&4), 103–109.
Singh, D. N. (1990). Diurnal vertical migration of plankton in McPherson Lake Allahabad. Proc. Natl. Acad. Sci. (India) 60 (B), 141–147.
Singh, D., Rawat, M. S., and Gusain, O. P. (2016). Primary productivity in nachiketa tal, a high altitude lake of garhwal himalayas (India). Eur. J. Acad. Res. 4 (8), 6462–6478.
Smith, G. M. (1950). The freshwater algae of the United States. 2nd ed. New York: McGraw-Hill Book Co, 719.
Sreenivasan, A. (1964). The limnology primary production and fish production in a tropical pond. Limnol. Oceanogr. 9, 391–396. doi:10.4319/lo.1964.9.3.0391
Thakur, K., Sharma, A., Sharma, D., Brar, B., Choudhary, K., Sharma, A. K., et al. (2022). An insight into the interaction between Argulus siamensis and Labeo rohita offers future therapeutic strategy to combat argulosis. Aquac. Int. 1-15.
Thakur, R. K., Jindal, R., Singh, U. B., and Ahluwalia, A. S. (2013). Plankton diversity and water quality assessment of three freshwater lakes of Mandi (Himachal Pradesh, India) with special reference to planktonic indicators. Environ. Monit. Assess. 185 (10), 8355–8373. doi:10.1007/s10661-013-3178-3
Vandysh, O. I. (2004). Zooplankton as an indicator of the state of lake ecosystems polluted with mining wastewater in the Kola Peninsula. Russ. J. Ecol. 35 (2), 110–116. doi:10.1023/b:ruse.0000018936.56649.20
Verma, J. P., and Mohanty, R. C. (1994). Primary productivity and its correlation with certain selected physico-chemical and biocommunity parameters. Environ. Ecol. 12 (3), 625–629.
Verma, P. K., and Datta Munshi, J. S. (1989). Influence of certain abiotic factors on primary production in a thermal stream. Proc. Natl. Acad. Sci. India 59 (B), 87–91.
Vijayaraghavan, S. (1971b). Seasonal variation in primary productivity in three tropical ponds. Hydrobiologia 38, 395–408. doi:10.1007/bf00036545
Vijayaraghavan, S. (1971a). Studies on the diurnal variations in physico-chemical and biological factors in teppakulam tank. Proc. Indian Acad. Sci. 74 (2), 63–73. doi:10.1007/bf03050382
Vollenweider, R. A. (1968). Scientific fundamentals of the eutrophication of lakes and flowing waters with particular references to nitrogen and phosphorus as factors in eutrophication organization of economic cooperation and development directorate of scientific affairs. Paris, 193.
Wanganeo, A. (1984). Primary production characteristics of a himalayan Lake in Kashmir. Int. Rev. Gest. Hydrobiol. Hydrogr. 69 (1), 79–90. doi:10.1002/iroh.19840690108
Keywords: Western Himalayan Lakes, trophic status (TSI, TLI), knowledge mining model, principal component analysis, planktonic abundance
Citation: Kumar R, Jindal R, Kulharia M, Sharma AK, Thakur K, Brar B, Mahajan D, Sharma A, Kumar S and Sharma D (2023) Knowledge mining for the differentiation pattern with respect to the productivity and trophic status of some selected lakes of Western Himalayas. Front. Environ. Sci. 11:1009942. doi: 10.3389/fenvs.2023.1009942
Received: 02 August 2022; Accepted: 23 January 2023;
Published: 08 February 2023.
Edited by:
Idrissa Kabore, Joseph Ki-Zerbo University, Burkina FasoReviewed by:
Ramanathan Alagappan, Jawaharlal Nehru University, IndiaVladimir Razlutskij, State Scientific and Production Amalgamation “Scientific-practical center of the National Academy of Sciences of Belarus for biological resources”, Belarus
Copyright © 2023 Kumar, Jindal, Kulharia, Sharma, Thakur, Brar, Mahajan, Sharma, Kumar and Sharma. This is an open-access article distributed under the terms of the Creative Commons Attribution License (CC BY). The use, distribution or reproduction in other forums is permitted, provided the original author(s) and the copyright owner(s) are credited and that the original publication in this journal is cited, in accordance with accepted academic practice. No use, distribution or reproduction is permitted which does not comply with these terms.
*Correspondence: Rakesh Kumar, ZHJ0aGFrdXJjdWhwQGhwY3UuYWMuaW4=
 Rakesh Kumar
 Rajinder Jindal2
 Amit Kumar Sharma
 Bhavna Brar
 Danish Mahajan
 Ankita Sharma
 Dixit Sharma