 Martin Rulík
 Lukáš Weber1
 Saw Min
- 1Department of Ecology and Environmental Sciences Faculty of Science, Palacký University Olomouc, Olomouc, Czechia
- 2Yezin Agricultural University, Naypyidaw, Myanmar
Small waterbodies like floodplain ponds are considered to be an important component of the global carbon budget. Although they are found in large numbers worldwide and their numbers are increasing every year due to the creation of new ponds, we do not have sufficient data on direct estimates of emission fluxes from these waterbodies yet. Herein, we present results from a set of 24 ponds located in the Morava River floodplain, Czech Republic. The ponds varied in their origin (man-made vs. natural), size, depth, sediment organic matter content, and macrophyte growth. Water chemistry parameters, concentrations, and exchange of CO2 and CH4 with the atmosphere were directly measured during the day and night from spring to summer 2020. The ponds emitted more CO2 and CH4 during nighttime, and both CO2 and, in particular, CH4 emissions tend to increase with the duration of pond inundation. Total diffusive fluxes of CO2 and CH4 into the atmosphere ranged from −37072.9 to 432683.3 μmol m−2 d−1, and −11485.3 to 95,889.6 μmol m−2 day−1, respectively. Generally, all ponds were found to be a net source of CO2 and CH4 to the atmosphere. In average, ponds emitted 7.64 g CO2-equivalent m−2 d−1. Thus, our results indicate that floodplain ponds are an important source of both CO2 and CH4 to the atmosphere and they should not be omitted in a regional carbon budget.
Introduction
Wetlands are not only among the world’s most important but also most threatened ecosystems, offering many ecosystem services to humankind (Finlayson et al., 2018; Mitsch and Mander, 2018). Natural wetlands represent a long-term carbon sink and the potential for further carbon sequestration in the form of biomass accumulation, thus playing an important role in mitigating global climate change (Keller, 2011; Mitch et al., 2013; Nahlik and Fennessy, 2016; Villa and Bernal, 2018). Additionally, they comprise approximately 5%–8% of the terrestrial land surface, and 20%–30% of the earth’s soil carbon (C) is stored in wetlands (Bridgham et al., 2006). However, these ecosystems are also considered to be natural sources of greenhouse gas (GHG) emissions, especially methane (Whalen, 2005; Mitsch and Mander, 2018; Dušek et al., 2020). Wetlands are the largest natural source of atmospheric methane (Bridgham et al., 2013), contributing 217 Tg of methane to the atmosphere per year (Ciais et al., 2013).
Wetlands globally vary in their capacity to store C and regulate GHG emissions (Bernal and Mitsch, 2012), with hydrology being a critical driver of river and floodplain wetland ecosystem functions (Bunn and Arthington, 2002; Altor and Mitsch, 2006; Kang and Jang, 2018; Zhao et al., 2019; dos Santos et al., 2020; Zou et al., 2022). Floodplain and depressional wetlands very often function as retention sites for organic matter and nutrients (Craft et al., 2017) and also significantly influence watershed hydrology (Evenson et al., 2018). The yearly inundation of floodplain wetlands increases the extent of aquatic habitat and creates and maintains a variety of small waterbodies. Ponds and pools, small standing waters that permanently or temporarily contain water, vary in size from 1 m2 to approximately 2–5 ha in area, are shallow (<5 m), with <30% emergent vegetation by area (Søndergaard et al., 2005, Céréghino et al., 2008, 2017; Richardson et al., 2022). Being of man-made or natural origin, these waterbodies occur worldwide and represent approximately 30% of global standing water by surface area (Downing et al., 2006). Although they make up 0.46% of the global land surface (Premke et al., 2016), in some areas, they may be the most abundant surface waterbodies (Mullins and Doyle, 2019). As an integral part of wetlands, they have an irreplaceable ecological role in agricultural and urban landscapes and can be considered a key component of the wider landscape (Céréghino et al., 2014; Mullins and Doyle, 2019).
There is also substantial and increasing body of evidence that small ponds are critically important in diverse landscapes around the world by providing habitat, processing carbon, and mediating hydrological and nutrient fluxes to other larger surface waterbodies (Downing, 2010). While they are considered to be a biodiversity hot spot (Céréghino et al., 2014; Biggs et al., 2017) and are habitats for uncommon species of conservation importance (Duigan and Jones, 1997), ponds and pools also offer potential for studies in ecology, evolutionary biology, and conservation biology (De Meester et al., 2005). The small waterbodies (wetlands sensu lato) also play a very important role in the provision of various ecosystem services (Biggs et al., 2017) including the accumulation of organic matter, recycling of nutrients, trapping of sediments, and biomass production (Rulík and White, 2020). A largely unrecognized service, but potentially the most important of all those known, is their direct role in regulating water and air temperature—hence climate change—through evapotranspiration (ET). ET is an important part of the local water cycle and climate because it represents the combined loss of soil water from the earth’s surface to the atmosphere by evaporation of water from the soil or plant surfaces and transpiration via plant stomates (Hatfield and Prueger, 2011). The transition of liquid into gas consumes energy and thus is accompanied by local cooling. Hence, ET from small waterbodies is a powerful cooling process, significantly affecting the climate of surrounding landscapes (Pokorný, 2001; Pokorný et al., 2010; Huryna et al., 2014). Generally, the cooling effect of wetlands is regarded as an important wetland ecosystem service (Costanza et al., 1997; Sun et al., 2012).
However, wetlands, including small waterbodies, are facing constant anthropogenic pressure and are gradually disappearing from the landscape (Zacharias et al., 2007; Zacharias and Zamparas. 2010; Bagella et al., 2016; Reis et al., 2017). It is estimated that since the Industrial Revolution, as much as half of the original wetlands have disappeared, mainly as a result of agricultural development. Many lowland ponds have been degraded or lost, mainly due to the conversion of wetlands to agricultural land and due to changes in agricultural activities (Joniak et al., 2017), large-scale and local drainage, expansion of urban areas, and pollution (Biggs et al., 2000). Landscape fragmentation, urbanisation, and unsustainable tourism development are also significant problems. For instance, in Czech Republic, the natural character of wetlands and streams has been modified to a large extent. As an example, more than a million hectares of field were drained by subsurface pipe drainage (Pokorný, 2017). When considering the total area of the Czech Republic (78,866 km2), 1/7 of this area was drained by melioration. In the 1950s, approximately 1,300,000 ha of wetlands were recorded, and in 1995, only 350,000 ha remained (Rulík and White, 2020). From a total of 10,952 historical ponds that were larger than 0.5 ha, 7,536 still exist, with a total area of −44,000 ha. Most of these ponds have an area <5 ha. The majority of former ponds was turned into agricultural land, permanent grassland, and forest (Pavelková et al., 2014). As a consequence, degradation of freshwater wetlands occurred either through drainage or desiccation, and their conversion to agricultural use has often led to increased carbon emissions (Nieveen et al., 2005; Brigham et al., 2006; Watkins et al., 2017; Tan et al., 2020).
Recently, many new wetlands including small ponds were created across Europe (Thiere et al., 2009; Boix et al., 2012; Casas et al., 2011; Casas et al., 2012) and the Czech Republic. For instance, many new pools and ponds were created within the Operational Programme Environment 2007–2013 and 2014–2020 aimed at increasing the water retention capacity of the landscape, specifically in relation to adaptation strategies proposed to deal with changing climate and associated increase frequency and severity of drought in the Czech landscape. These new aquatic habitats often represent biodiversity’s centres in an otherwise relatively homogeneous and predominantly agricultural landscape. However, these aquatic habitats may also greatly increase the regional relevance of the landscape as potential sources of greenhouse gases because they play an active role in carbon cycling and might be net emitters of CO2, CH4, and N2O to the atmosphere (Torgersen and Branco, 2008; Premke et al., 2016; Grinham et al., 2018; Peacock et al., 2021a). These new, man-made waterbodies vary in size, depth, age, physicochemical parameters, and last but not the least, the purpose for which they were built. Their management can then fundamentally affect water residence time, nutrient levels, and ultimately carbon dynamics (Beaulieu et al., 2019). For example, several publications documented CH4 flux from created and restored wetlands (Tuitilla et al., 2000; Mander et al., 2014). Hence, minimizing its emission from created and restored wetlands should be a desirable goal (Altor and Mitsch, 2006).
Carbon exchange between wetlands and the atmosphere can be represented as the sum of two separate processes. First, aerobic ecosystem respiration, as well as autotrophic and heterotrophic respiration, produces carbon dioxide through the decomposition of organic matter and represents the emission of carbon dioxide to the atmosphere. Second, anaerobic respiration emits other chemical products, mainly methane (Sulman et al., 2009). Both processes are influenced primarily by water depth, and the amount of time the soil is submerged through inundation, which are affected by variable environmental factors (Tangen et al., 2015; Zhao et al., 2019). Maximum emission of CH4 occur when flooded wetlands have water levels well above the soil surface, while emissions of CO2 may exhibit relative extremes for both high water level and low water table conditions (Zou et al., 2022). In addition to the position of the water table, temperature, redox conditions, and plant community composition are important ecosystem level controls on wetland GHG emissions (Turetsky et al., 2014). Changes in temperature, particularly the rise in water temperature, stimulates microbial activity, which increases decomposition rates and increases CO2 and CH4 emissions through ecosystem respiration (Davidson and Janssens, 2006; McNicol et al., 2017). Generally, wetland plant communities are shaped by the duration, timing, and frequency of inundation (Casanova and Brock, 2000), whereas sediment dynamics and associated biogeochemical processes change with flooding (Wilson et al., 2011). Wetlands can be both sources and sinks of carbon, depending on their age (Zemanová et al., 2010), operation, and the environmental boundary conditions, such as location and climate (Kayranli et al., 2010).
Compared to lakes or reservoirs (Tranvik et al., 2009), the role of small alluvial waterbodies in the carbon cycle and especially in greenhouse gas production has so far been overlooked, although their global abundance (Downing et al., 2006; Verpoorter et al., 2014) and high potential for biogeochemical cycling indicate that they could be an important component of the global carbon budget (Downing, 2010). Due to their shallow depth and relatively larger perimeter, these small habitats retain large amounts of carbon (Downing et al., 2008) and produce more CO2 and CH4 compared to large lakes and reservoirs. Although very small ponds comprise only 8.6% of the area represented by ponds and lakes, they account for 15.1% of CO2 and 40.6% of CH4 emissions from these sources (Holgerson and Raymond, 2016). This inverse lake size-GHG flux relationship was also confirmed in a new synthesis, where the authors found that 37% of total lentic CH4 emissions come from waterbodies <0.001 km2 in size (Rosentretter et al., 2021).
Recent studies dedicated to measuring CO2 and CH4 emissions from various small waterbodies, e.g., small natural ponds like vernal pools (Catalán et al., 2014, Holgerson, 2015; Kifner et al., 2018) or various artificial waterbodies such as ponds, farming ponds, small dams, or ditches (Gilbert et al., 2017; Grinham et al., 2018; Ollivier et al., 2019a; Ollivier et al., 2019b; Peacock et al., 2021b) have provided evidence for the importance of small waterbodies in the global carbon cycle. Nevertheless, these studies are often limited by the fact that most measurements are rarey based on direct flux measurements and usually do not account for nighttime emissions. Indeed, GHG emissions can strongly be influenced by the diurnal cycle, which affects the temperature and especially photosynthetic activities. At night, the uptake of dissolved carbon is reduced, which, together with community respiration, increases the partial pressure of carbon dioxide in the water and consequently its emissions to the atmosphere (Rocher-Ros et al., 2020; Rudberg et al., 2021). In addition, the absence of oxygen during the nocturnal period can lead to the development of anaerobic conditions in the water column and sediment, resulting in increased rates of CH4 production (Podgrajsek et al., 2014). In addition, methane fluxes can be affected in different ways by wetland vegetation. On the one hand, plants provide a substrate for methanogenesis, and on the other hand, oxygen released by roots facilitates methanotrophy (Whalen, 2005). While emergent vegetation can act as a conduit for methane (Laanbroek, 2010), the role of submersed and floating macrophytes in the flow of gases from sediments to the atmosphere is less clear (Heilmann and Carlton, 2001; Yoshida et al., 2014). Diurnal differences in methane flux rates are therefore evident, where pressurized convection (ventilation) driving the flow of gases through aerenchyma (Vretare Strand, 2002) and diffusive transport through plant tissue (Altor and Mitsch, 2008) occur simultaneously. Because maximum rates of pressurized convection and diffusion can vary throughout the day depending on the gas concentration gradient between sediments, plants, and the atmosphere, as well as between different wetland plant types, the diurnal dynamics of CH4 compared to CO2 are less straightforward. Although increased attention has been paid to the diurnal pattern of CO2 and CH4 emissions in lakes and rivers (Sieczko et al., 2020; Attermeyer et al., 2021; Rudberg et al., 2021), changes in production and especially CO2 and CH4 emissions are currently still unknown in the ponds. Another shortcoming is that previous studies have either measured CO2 or CH4 emissions only and have not been conducted together. Carbon fixation by primary production in flooded wetlands (sink for CO2) is strongly coupled to CH4 production and emission to the atmosphere (source of CH4). Assuming that flooded wetlands generally act as sequesters of CO2 from the atmosphere and release CH4 to the atmosphere at the same time, the combination of these two factors then determines whether these offsetting processes make wetland ecosystems general contributors to the greenhouse effect (Whiting and Chanton, 2001).
Herein, we address these knowledge gaps by measuring diffusive CO2 and CH4 emissions from small ponds across Litovelské Pomoraví Protected Landscape Area near the city of Olomouc, Czech Republic, during the daytime and nighttime, and in spring and summer. A total of 24 small ponds varying in their nature (man-made vs. natural) were sampled during the flooding phase of the ponds when sufficient water level was present for diffusive CO2 and CH4 fluxes across the air–water interface along with basic physicochemical parameters, surface area, water depth, sediment carbon, and sediment methane potential production. The objective was to compare fluxes of CO2 and CH4 during the day and night. The second objective was to try to clarify which factors might be responsible for these fluxes. Our hypotheses for this study were as follows: 1) during the night, CO2 concentrations and fluxes will be higher than during the day, while methane emissions will be more dependent on local site conditions; 2) methane concentrations and fluxes will be closely correlated with the organic carbon content and methanogenic potential of pond sediments; 3) fluxes of both gases will be higher during the summer period, when temperatures are generally higher and the long flooding time creates an anaerobic environment that supports both CH4 and CO2 fluxes.
Materials and methods
Study sites
In order to encompass the diversity of standing water systems present in Litovelské Pomoraví Protected Landscape Area (the Morava River floodplain, Czech Republic, Central Europe—49.7047072N–49.6187033N and 17.1557522E–17.2681906E), 24 small waterbodies were chosen for our study (Figure 1). The ecological backbone of the protected landscape area is the naturally meandering Morava River, in floodplain forests branching out and forming a complex system of permanent and temporary river arms, a so-called anastomosing river system. The ponds varied in their origin (man-made vs. natural), size, depth, sediment organic matter content, and macrophyte growth (Table 1). Artificial ponds comprised those depressions made during railway construction, various pits created during fen/bog mining, or ponds newly created or restored by nature’s conservation activities. Most of the natural ponds were temporary pools found in former (abandoned) meanders of the Morava River, small alluvial depressions, and seasonally flooded grasslands. With the exception of water depth, dissolved oxygen concentration, and saturation ratio for CO2, the two groups of pools (man-made vs. natural) were not significantly different from each other (Table 1). Sampling was conducted during the flooding phase of the ponds when sufficient water level was present due to extraordinary long and heavy rain period, where many temporary pools having usually short water duration period (February–May) persisted until the end of September 2020, hence allowing to carry out sampling on foot four times from spring (April–May) 2020 to summer (July–August) 2020.
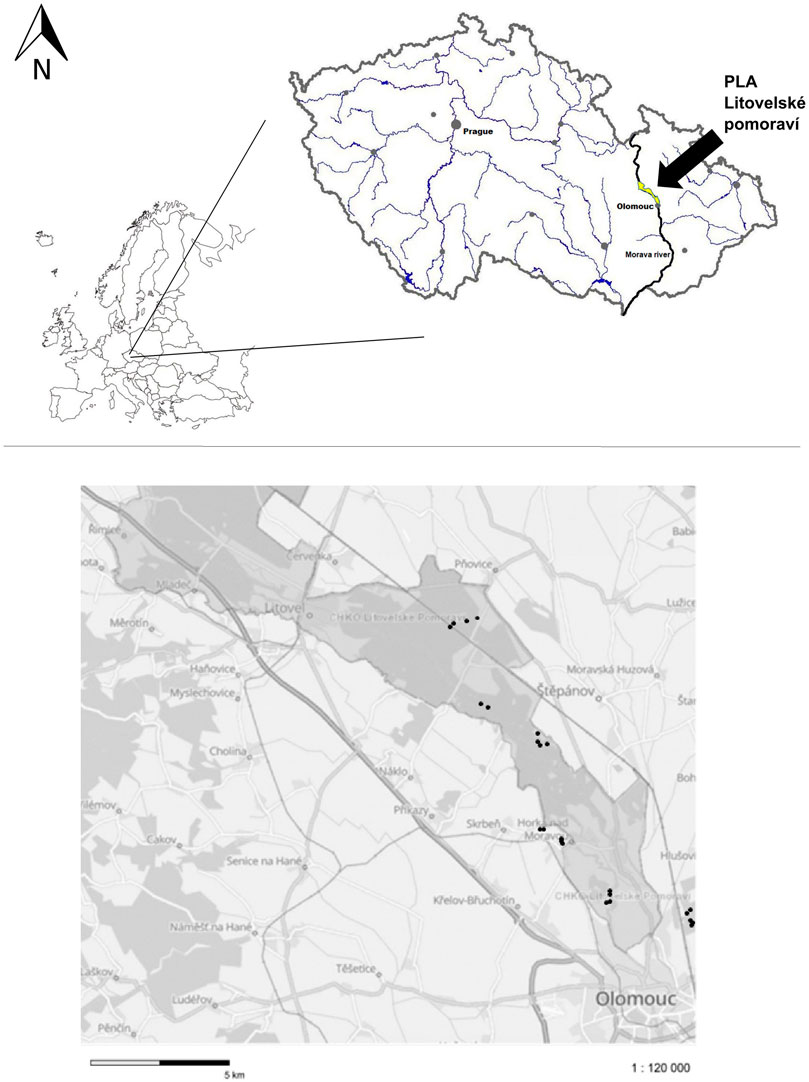
FIGURE 1. Map of Europe and Czech Republic with indications to the Morava River (black arrow in the cut-out) and the Litovelské Pomoraví Protected Landscape Area. Black dots in the lower figure represent the study sites.
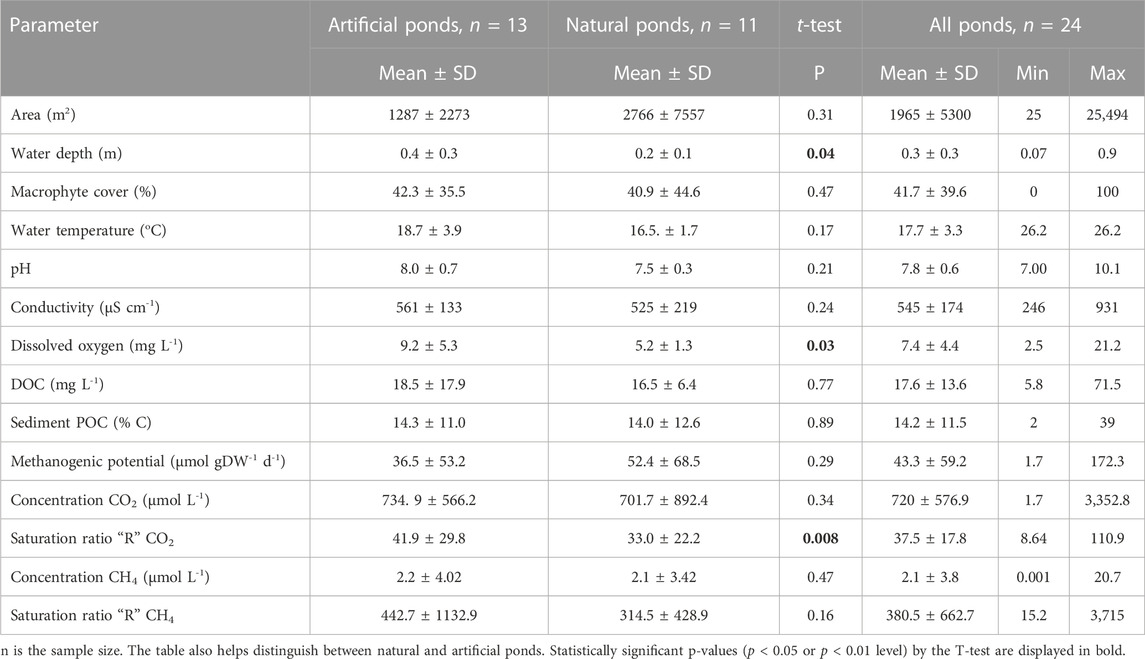
TABLE 1. Water physicochemical variables and sediment properties from sampled ponds summarized from sampling campaigns conducted in April, May, and August 2020.
Field and laboratory analyses
On each of the four sampling days, three replicated measurements of physicochemical parameters and the exchange of CO2/CH4 with the atmosphere (FCO2 and FCH4) were performed at all the localities between 10:00 and 16:00 for daytime hours and 22:00 and 04:00 for nighttime measurements (British Summer Time +01:00).
The surface area of each pond was measured in situ both manually (in the case of very small pools) and using a GPS and with the help of aerial photography in the MapoMat program version 2.0.0.8 (AOPK CR 2022). Water depth was measured at each waterbody during spring and summer season. The organic content of inundated sediments was determined by oven-drying at 105°C to a constant weight and subsequent combustion at 550°C for 5 h to obtain ash-free dry weight (AFDW). Organic matter values were then converted to carbon equivalents assuming a 45% carbon content of organic matter (Meyer et al., 1981).
Physicochemical variables
Dissolved oxygen, pH, conductivity, and temperature of surface water were measured with portable probes (HQ 40 days HACH, DiST® 3 EC/TDS conductometer, pH metre pHep®+ Hanna Instruments). Samples for the analysis of dissolved CO2 and CH4 were obtained using the headspace extraction technique (Drozd and Novák, 1979). Water samples (45 mL) were collected from the depth of 5–10 cm in glass vials equipped with septa, and the vials were immediately closed and kept gastight without a headspace in a portable fridge (10°C). Later, upon arrival to the laboratory, a 15 mL headspace was created by replacing 33.3% of the bottle with nitrogen gas, the vials were vigorously shaken for 60 s to equilibrate the gas between the headspace and the water, and 1 mL of gas sample was then collected from the headspace with a gastight syringe and manually injected into a closed loop between the gas inlet and the outlet of a Los Gatos ultraportable GHG analyser GGA-30p (Los Gatos Research Inc., CA, United States) to measure CO2 and CH4 contents (Baird et al., 2010; Mbaka et al., 2014). The effective volume of the loop was calculated according to the LI-COR guide (LI-COR, Inc. 2020) using calibration gas and was 111 ± 4.7 mL, and the precision of measurements amounted to 3%–5%. The partial pressures of the gases were converted into concentrations in water (expressed as μmol L−1) by using Henry’s constant, the water temperature, and the measured gas partial pressures in the air (while accounting for the water volume and the headspace inside the bottle). Overall, 281 surface samples were collected at random locations across each pond over four sampling campaigns in April–August 2020 and used to measure the concentrations of CO2 and CH4. The CO2 and CH4 saturation ratio was calculated as follows:
where Cm represents the measured CO2/CH4 concentration (μmol L−1) using the Los Gatos ultraportable GHG analyser GGA-30p, Ceq (μmol L−1), which is the concentration of dissolved gases in equilibrium with the atmosphere related to partial pressure in the gas phase via Henry’s law, using the solubility data of Wiesenburg and Guinasso (1979); Weiss (1974),; Weiss (1974). The degree of supersaturation was expressed in terms of a saturation ratio, defined as the measured concentration of gas divided by the concentration in equilibrium with the atmosphere at the environmental conditions of temperature and salinity (De Angelis and Scranton, 1993). A gas saturation ratio >1 means that CO2/CH4 is supersaturated in water, while a gas saturation ratio <1 represents undersaturation of CO2/CH4.
The analysis of DOC from the surface water (∼10 cm depth) was performed using a TOC analyser (Shimadzu TOC-LCPH, Japan) with a detection limit of ∼ 0.05 mgL−1.
Incubation experiments
Sediments intended for incubation experiments were sieved through a 1-mm sieve to remove coarse detritus, stones, or invertebrates and stored at 4°C until subsequent analyses, and laboratory experiments were carried out. For the determination of CH4 production potential, approximately 5 g (wet weight) of the sediments were transferred into 60-mL sterile serum bottles in triplicates, flushed with N2, closed with butyl rubber stoppers, and incubated at 25°C in a dark room. Gas samples (200 μL) were taken repeatedly (twice a week) during the course of incubation (4–6 weeks) and analysed for concentrations of CH4 and CO2. The concentration of both CO2 and CH4 was analysed using the Los Gatos ultraportable GHG analyser GGA-30p. CH4 production potential was calculated from the slope of CH4 concentration change over time (Bednařík et al., 2019).
Greenhouse gas flux measurements
Gas fluxes across the air–water interface were determined by the floating chamber method from spring 2020 to summer 2020 (April 21–22 and 26–27, May 9–10 and 17–18, July 19–20 and 28–29, and August 5–6 and 8–9). In total, 288 chamber measurements were performed at different ponds on 16 different days during the whole sampling campaign. Due to the high diel variability of CO2 and CH4 fluxes (Min and Rulík, 2020; Sieczko et al., 2020; Rudberg et al., 2021), FCO2 and FCH4 were consistently measured between 10:00 and 16:00 for daytime hours and 22:00 and 04:00 for nighttime measurements. On each sampling date, three replicated measurements were performed at all the ponds. The floating chamber was gently deployed from land onto the water surface in each pool in open water areas or between water plants to minimize any disturbances. The chamber was constructed from an inverted non-transparent plastic bucket (internal diameter 17.5 cm, total volume of 3,050 mL, and an area of 0.02 m2) with an attached floatation device around the base of the chamber, which assured that the volume of the chamber was above the water’s surface. The 10-m long gastight inflow and outflow tubes (Tygon) connected the chamber to the Los Gatos ultraportable GHG analyser and fixed the chamber in position. The internal pump circulated the air in the gas chamber through the GHG analyser. A relatively small area of the pools combined with water levels considerably below the top of the pools’ edges created a sheltered environment avoiding turbulence or disturbances caused by wind. The chamber was allowed to float on the water surface for 250 s, and the concentrations of CO2 and CH4 within the chamber were measured every second, which allowed the changes in CO2/CH4 to be tracked in situ. The concentrations of CH4 and CO2 inside the atmosphere of the chamber increased linearly over time under diffusional conditions, whereas CH4 concentrations increased abruptly when bubbling occurred. Although our experimental approach was designed to measure diffusive fluxes, ebullition events were frequently observed, particularly during spring, more often due to frog activities. If ebullition events were captured by the chamber, the chamber was ventilated and replaced on the waterbody to measure a diffusive flux as we consider diffusive fluxes only in our study.
Wind speed was not measured during our measurements because most of the pools were very small in area or located in floodplain forests, and thus any effect of wind on CO2 and CH4 emissions was considered quite marginal.
The water–atmosphere fluxes (F) of CO2 (FCO2) and CH4 (FCH4) (mol m−2 h−1) were calculated from the slopes of linear regressions of the concentrations in the chamber versus time as follows:
where F represents the diffusive gas flux from the water surface to the atmosphere, s represents the slope of change in chamber gas concentrations over time (ppm/s), Vch is the chamber volume (m3), R is the universal gas constant (8.2 × 10⁻⁵ m3 atm K−1 mol−1), T is the temperature in the chamber (K), Ach is the chamber area (m2), and t is the conversion from seconds to hour and µmol to mol m−2 h−1, respectively (Attermeyer et al., 2016, Ollivier et al., 2019b). The volume of tubing was also accounted for in calculations of headspace volume and changes in CO2 and CH4 concentrations.
The total gas flux for each pond (T-FCO2 and T-FCH4) was expressed in mmol m−2 d−1, with the convention that positive fluxes correspond to CO2/CH4 effluxes to the atmosphere. Day and night, FCO2 and FCH4 were calculated as measured emissions per hour multiplied by the length of the day and night. Day–night differences in FCO2 and FCH4 (night-time FCO2 minus daytime FCO2 and night-time FCH4 minus daytime FCH4) were calculated for each 24 h period, respectively. The length of the days and nights were defined according to the sunrise and sunset times (Czech Hydrometeorological Institute 2020) at each location and each month separately. Each day–night cycle started with a sunrise and ended with a sunrise on the consecutive day, thus the length of each light vs. dark period was dependent on the season.
Data analysis
To test for significant differences between respective data groups (day versus night, natural versus artificial ponds, and spring versus summer), one sample t-test was applied. Prior to the analysis, we visually checked data for normality. Possible interactions between measured parameters, CO2 and CH4 concentrations, and their gaseous emissions to the atmosphere were revealed by redundancy analysis (RDA). The forward selection procedure was used to select significant explanatory variables out of nine parameters. The response variables were CO2 and CH4 fluxes to the atmosphere. Among all measured factors, interactive forward selection selected four parameters in the RDA model that contribute the most to explain the variability of CO2 and CH4 fluxes in monitored ponds. The RDA analysis was conducted using Canoco 5.10 (Ter Braak and Šmilauer, 2012). Generalised additive models (GAMs) were also created for all tested parameters to predict the relationship between the response and predictors. Seasonal fluxes of CH4 were converted to CO2 equivalents assuming a 100-year global warming potential of 25 (IPCC 2007).
Results
Pond characteristics (physicochemical variables)
The studied ponds exhibited great variability in physical and chemical parameters, notably, the size area ranged from 25 to 25,484 m2, conductivity ranged from 247 to 931 µS cm−1, and dissolved oxygen ranged from 2.5 to 21.2 mg L−1, while DOC varied among ponds with values ranging from 5.8 mg L−1 to 71.5 mg L−1 (Table 1). Artificial ponds differed significantly from natural ones in water depth (p < 0.05), dissolved oxygen (p < 0.05), and CO2 saturation ratio “R” (p < 0.01) (Table 1). Within all monitored pools, temperatures in summer were significantly higher than those values measured in spring (p < 0.01). Water pH in pools also increased significantly in summer (p < 0.01), whereas conductivity decreased significantly during summer (p < 0.01) compared to values measured in spring. No significant change was observed in dissolved oxygen in pond water between spring and summer (p = 0.2) (Table 2).
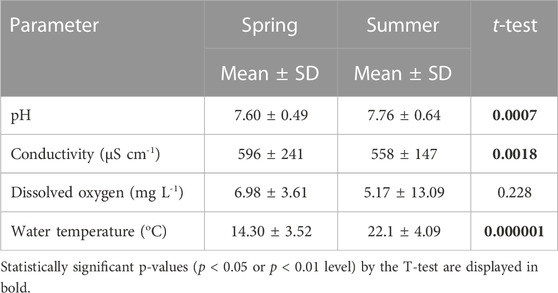
TABLE 2. Changes in selected physicochemical parameters of the water from the studied ponds along different seasons.
CO2 concentrations
Carbon dioxide concentration was supersaturated across all ponds and all sampling dates, with an overall median of 569.1 (quartile 1 = 391.6 and quartile 3 = 850.8 μmol L-1), equal to 37.5-fold supersaturation. The CO2 saturation ratio “R” varied from 8.6 to 110.9 with an average ratio of 37.5 (±17.8 SD) (Table 1). There was also a highly significant difference (p < 0.01) between CO2 concentration in water during daytime measurements (median = 573.1 μmol L−1, Q1 = 387 μmol L−1, and Q3 = 871.8 μmol L−1) compared to the nighttime concentration (median = 562 μmol L−1, Q1 = 403.4 μmol L−1, and Q3 = 679.0 μmol L−1) (Figure 2A). The CO2 concentration did not differ with seasons as there was no significant difference between spring and summer measurements (p = 0.08).
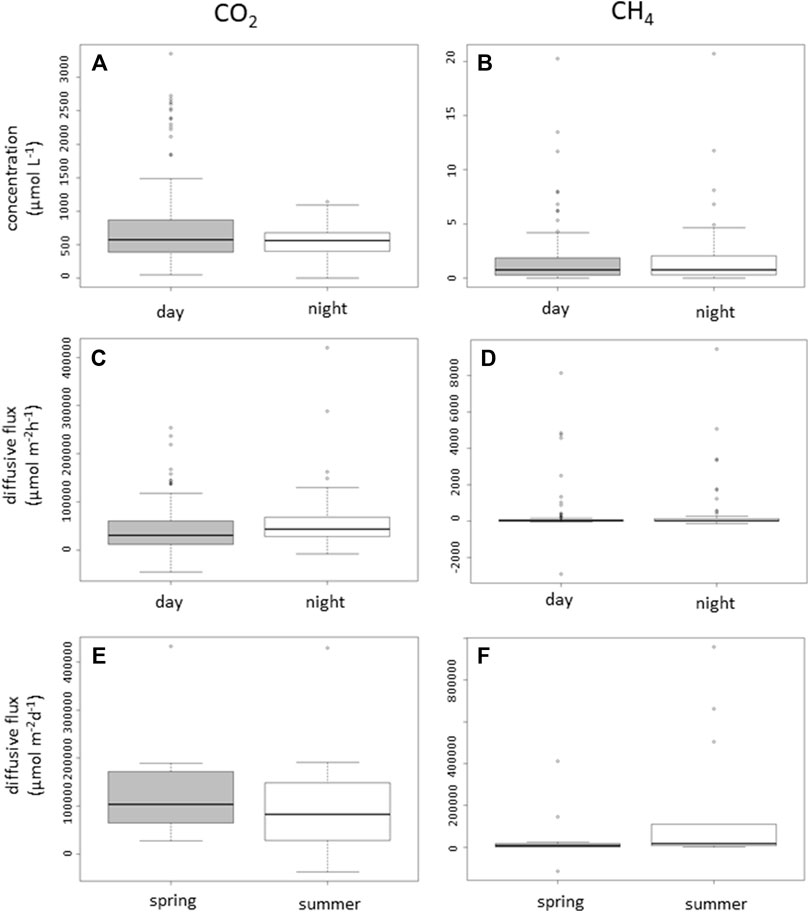
FIGURE 2. Concentrations (µmol L-1) and diffusive fluxes (µmol m-2 h-1 and μmol m-2 d-1, respectively) of CO2 (A) and CH4 (B) measured in the water from all ponds surveyed during the campaign showing differences between day and night. Diffusive fluxes of CO2 (C) and CH4 (D) measured in ponds surveyed during the campaign showing differences between day and night. (E) Total diffusive fluxes of CO2 and (F) CH4 (D) measured in ponds surveyed along different seasons (spring vs. summer). Box plots represent the minimum, lower quartile, median, upper quartile, and maximum values. Positive values represent an emission of CO2 or CH4 from the ponds to the atmosphere, while negative values represent an intake.
CH4 concentrations
Methane concentrations were supersaturated across all except three ponds, with an overall median of 0.75 (Q1 = 0.3 and Q3 = 2) μmol L−1, equal to 380.5-fold supersaturation. The CH4 saturation ratio ranged from 15.2 to 3, 715 with an average ratio of 380.5 (±662.7 SD) (Table 1). No significant difference between day (median = 0.8 μmol L−1, Q1 = 0.3 μmol L−1, and Q3 = 1.8 μmol L−1) and night measurements (median = 0.8 μmol L−1, Q1 = 0.3 μmol L−1, and Q3 = 2.1 μmol L−1) was found for the CH4 concentration (p = 0.3) (Figure 2B). Methane concentrations showed no significant changes during the seasons, with spring CH4 concentrations being similar to those found during the summer (p > 0.05).
Magnitude and variability of CO2 and CH4 fluxes
CO2 flux
Flux rates of CO2 (FCO2) varied markedly among ponds and during the daytime over the sampling campaign. The median of FCO2 was 3,600 (Q1 = 1800 and Q3 = 6,200) μmol m−2h−1, ranging from −4600 to 42,000 μmol m−2h−1. In average, the ponds emitted more CO2 during nighttime (median = 4,000, Q1 = 3,000, and Q3 = 7,000 μmol m−2h−1) compared to daytime (median = 3,000, Q1 = 1,000, and Q3 = 6,000 μmol m−2h−1) (p = 0.07) (Figure 2C). Both daytime and nighttime FCO2 were higher during spring measurements than those during summer measurements, but the differences were not significant (Table 3).
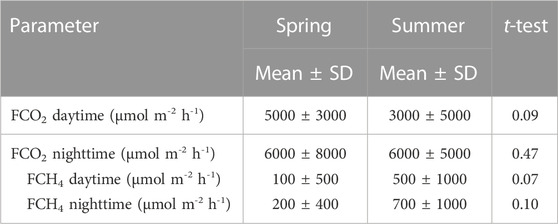
TABLE 3. Water–atmosphere fluxes (F) of CO2 (FCO2) and CH4 (FCH4) from the studied ponds along different seasons.
With the exception of one pond, all other ponds were net emitters of CO2 to the atmosphere regardless of the season and pond type, with a median of total flux (T-FCO2) of 100,000 (Q1 = 500,000 and Q3 = 160,000) μmol m-2 d-1 and a range −37072.9–432683.3 μmol m−2 d−1. The median of total CO2 flux during the spring (April–May) measurement 100,000 (Q1 = 50,000 and Q3 = 170,000) μmol m-2 d-1 was higher than that during summer (June–August) (median = 80,000, Q1 = 30,000, and Q3 = 140,000 μmol m-2 d-1); however, the difference was not statistically significant (p = 0.39) (Figure 2E).
CH4 flux
The flux rate of CH4 (FCH4) also varied among ponds and during the day (Figure 2D). The median of FCH4 was 25 (Q1 = 4 and Q3 = 77 μmol m-2h-1), ranging from −2900 μmol m-2h-1 to 9400 μmol m-2h-1. In average, the ponds emit non-significantly more CH4 during nighttime (median = 29, Q1 = 4.2, and Q3 = 130 μmol m-2h-1) compared to daytime (median = 21, Q1 = 4.5, and Q3 = 73 μmol m-2h-1) (Figure 2D). Summer FCH4 were slightly non-significantly (p = 0.07) higher than those in spring CH4 fluxes (Table 2).
Three ponds had very low CH4 concentration, thus the saturation ratio is usually <1, based on direct day–night measurements, and one pond showed a negative flux. With the exception of one pond, all the other ponds were net emitters of CH4 to the atmosphere irrespective of the season and pond type. A median of total flux (T-FCH4) was 800 μmol m-2 d-1 (Q1 = 400 and Q3 = 6500 μmol m-2 d-1) and ranged between −11485.3 to 95,889.6 μmol m−2 day−1. The median of total CH4 flux in summer was higher than that in spring (April–May), with the difference not statistically significant (p = 0.06) (Figure 2F).
Relationship with environmental variables
To unveil possible significant relationships between measured factors and net CO2 and CH4 fluxes, we conducted RDA(Supplementary Figure S1). Among all measured factors, interactive forward selection selected four parameters in the RDA model that contribute the most to explain the variability of CO2 and CH4 fluxes in monitored ponds. Dissolved oxygen content and pH together with the CH4 concentration and total area of the ponds were the explanatory variables, which explained 37.9% of the variability in CO2 and CH4 fluxes (FCO2 and FCH4). Dissolved oxygen content was the most important of the explanatory variables (19.6%, F = 28.6, p < 0.01), and water pH explained 10.9% of the variability (F = 19.9, p < 0.01). According to the first axis of RDA, these explanatory variables mainly explained the variability in CO2 fluxes (37.7%). CO2 fluxes to the atmosphere significantly (p < 0.05) increased with an increasing pond area (Figure 3A), while decreasing significantly (p < 0.01) with increasing depth, pH, and dissolved oxygen content in the water (Figures 3B–D). CO2 emissions from the water surface showed a non-linear relationship with CO2 concentration in the water and water temperature (Figures 3E,G). Generally, FCO2 tends to increase with the duration (length) of pond inundation, but in the late spring (around the middle of the time period), a downward trend in the FCO2 rate was observed there (Figure 3F). CO2 emissions increased with temperature up to approximately 20°C, and then further temperature increase caused fluxes to decrease. Similar to FCO2, FCH4 also decreased with increasing water depth (Figure 3B). CH4 fluxes increased significantly (p < 0.05) with higher oxygen concentration in the water (Figure 3D). Generally, FCH4 tend to increase with the duration of pond inundation (3F). Compared to FCO2, the response of FCH4 to temperature is less clear and non-significant (Figure 3G).
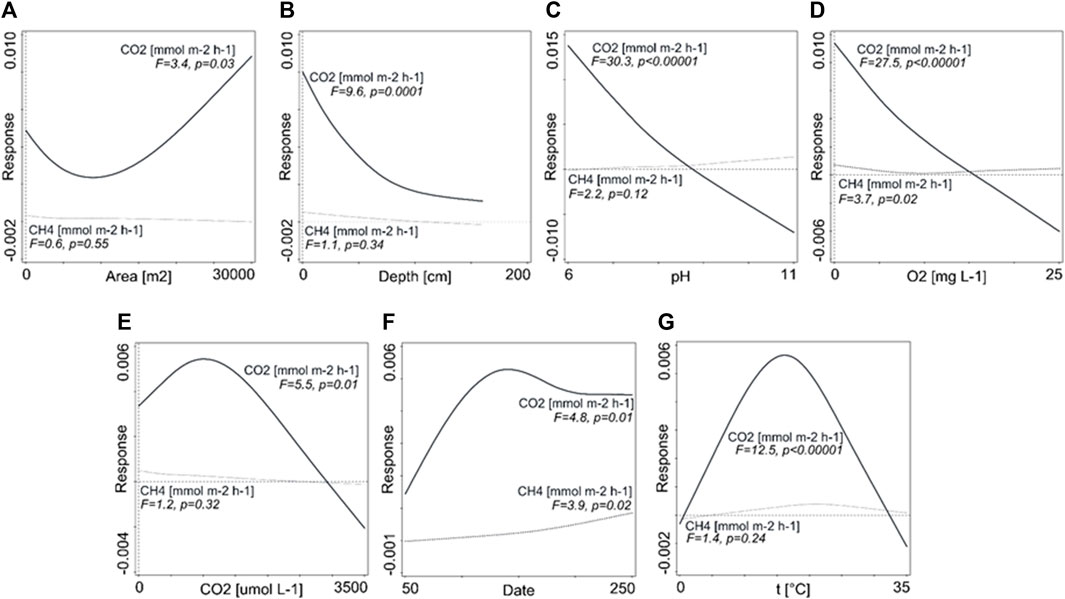
FIGURE 3. Generalised additive models for selected parameters showing a prediction of relationship between the response [diffusive fluxes of CO2 and CH4 (mol m-2 h-1))] and predictors: (A) pond area (m2); (B) water depth (cm); (C) pH of water; (D) content of dissolved oxygen (mg L-1); (E) concentration of CO2 (µmol L-1); (F) duration of inundation (days); and (G) water temperature (oC). Solid bold line indicates significant prediction.
Discussion
Our results support previous observations that despite their small size, small waterbodies have relatively large contributions to CO2 and CH4 emissions (Abnizova et al., 2012; Raymond et al., 2013; Holgerson, 2015; Holgerson and Raymond, 2016; Onandia et al., 2018). During their flooding phase, the studied ponds were net emitters of CO2 and CH4 to the atmosphere. Total CO2 and CH4 emissions from our ponds were lower than those heavily impacted artificial waterbodies (cf. Ollivier et al., 2019a), but comparable to emissions from similar waterbodies.
CO2 and CH4 concentrations and drivers of CO2 and CH4 emissions
CO2 and CH4 concentrations and fluxes in this study are of similar magnitude to those observed on small, temporary pools (Catalán et al., 2014; Holgerson, 2015; Kifner et al., 2018) and other small waterbodies (Premke et al., 2016; Gilbert et al., 2017; Grinham et al., 2018; Obrador et al., 2018; Ollivier et al., 2019a; Peacock et al., 2021a). The ponds were supersaturated with respect to CO2 across all surface samples and dates, indicating that all pools were emitting CO2 to the atmosphere. To the best of our knowledge, CO2 concentrations and saturation ratios in the studied ponds are some of the highest reported from small waterbodies and suggest high potential of these ponds for CO2 emission flux. In the case of CH4, three ponds were found to be undersaturated with respect to CH4; however, total CH4 fluxes (T-FCH4) were positive for each pond, indicating that, on daily basis measurements, those ponds are also net emitters of CH4 to the atmosphere. Similar to CO2, comparison made with available data (cf. Holgerson, 2015; Holgerson and Raymond, 2016; Kifner et al., 2018) shows that CH4 concentrations and especially the CH4 saturation ratio in our ponds were also among the highest reported values. However, our data were obtained from waterbodies only minimally affected by anthropogenic activities. Moreover, nutrient inputs due to the direct management were also minimal or zero. The mean GHG emissions from our waterbodies amounted to 7.64 g CO2-equivalent m-2 d-1, a value lower than those of Australian agricultural dam emissions, which were 11.1 g CO2-equivalent m-2 d-1 (Ollivier et al., 2019a). This is due, among other reasons, to the fact that methane and sometimes CO2 emissions can be up to an order of magnitude higher in eutrophic systems than in oligotrophic waters (Huttunen et al., 2003). Thus, in direct comparison with other small waterbodies, it is necessary to keep in mind their use, the extent of anthropogenic influence, and land use of the surrounding landscape. In any case, the total fluxes of CO2 and CH4 from our ponds were significantly higher than those emissions from lakes and reservoirs (St. Louis et al., 2000; Deemer et al., 2016; DelSontro et al., 2016), confirming previous findings of an inverse relationship between waterbody size and CH4 and CO2 fluxes (Holgerson and Raymond, 2016; Rosentreter et al., 2021).
CH4 atmospheric emissions in our study only considered diffusion across the water boundary layer even though ebullition can also be an important mechanism for its transport to the atmosphere. Due to their relatively shallow depth and relatively low hydrostatic pressure, small waterbodies can experience CH4 ebullition (DelSontro et al., 2016; Grinham et al., 2018). Although we have observed the release of methane bubbles very often in ponds and pools with the occurrence of amphibians, namely, mating frogs dwelling close to the bottom (see methods for CH4 flux measurements), the total CH4 emissions presented here are underestimated because the study does not report ebullitive fluxes. Hence, estimated diffusive fluxes from investigated ponds into the atmosphere should represent minimum values, especially for CH4. Since recent publications on methane dynamics in reservoirs reported significant changes in ebullition intensity as the water level decreased (Beaulieu et al., 2018; Hilgert et al., 2019), it is reasonable to expect that a decreasing water level could also stimulate deeper zones of ponds to begin bubbling or increase the intensity to bubbling. This could potentially offset the reduction on the surface available for diffusive emission, while total emissions would remain relatively constant (Grinham et al., 2018).
Carbon dioxide and methane fluxes were measured only during periods of inundation. Although there are some reports on methane fluxes from dry or wet phases of the ponds (Obrador et al., 2018), methanogenesis may only occur in saturated areas of the ponds (Kifner et al., 2018). Water table fluctuation in the floodplain area influences CO2 and CH4 production (Boon et al., 1997; Fromin et al., 2010). A higher water level generally leads to the prevalence of anoxic–anaerobic conditions and higher CH4 emissions, whereas inundated habitats may act either as a source or a sink of atmospheric CO2 along the year (Obrador et al., 2018). On the contrary, a lower water level leads to aerobic respiration and consequently to higher CO2 emissions (Fromin et al., 2010; Obrador et al., 2018). Generally, such processes are well known from various inland waters that are subjected to wetting and drying cycles (von Schiller et al., 2014; Marcé et al., 2019), as well as from inundated freshwater wetlands ecosystems, where CO2 exchange and carbon sink potential are mainly driven by hydrology (Altor and Mitsch, 2006; Huertas et al., 2017; Kang and Jang, 2018; Zou et al., 2022). In our study, both CO2 and CH4 emissions tend to increase significantly with the length of pond inundation. This was particularly true for methane, whose emission fluxes showed an increasing trend with increasing flooding duration. This suggests that permanent pools, which are filled with water throughout the year, are much more important in terms of methane production than periodic pools, which are characterised by relatively short flooding times (Figure 3F).
The variability of CO2 fluxes (FCO2) during the study across all measured pools was high, as determined by the standard deviation and the mean (0.006 ± 0.006 mol m-2h-1). This high variability indicates possible difficulty in making estimates of pond gas fluxes from limited number of measurements and is likely driven by multiple changing drivers of pond metabolisms (Torgersen and Branco, 2008). Although small waterbodies are expected to be highly dependent on external drivers, the differences in CO2 fluxes between ponds were most likely related to intrinsic properties of the pond. For instance, Catalán et al. (2014) found that the CO2 efflux was significantly correlated with the organic content of sediments; however, CO2 fluxes from the inundated sections were independent of this. This finding is congruent with our observation, as we observed no relationships between sediment organic carbon and CO2 and CH4 fluxes. This lack of relationship might be influenced not only by a water column and presence of water plants but also due to the respiration of DOC in the water column. Hence, it is possible that fluxes of gases in flooded ponds would more likely be related to DOC in the water column than to the sediment’s organic matter (Catalán et al., 2014). However, no relationship of CO2 fluxes to DOC was found in this study.
The production and emission of greenhouse gases is usually closely related to temperature due to an increase in the microbial activity with increasing temperature (Yvon-Durocher et al., 2011; Yvon-Durocher et al. 2014; Yvon-Durocher et al. 2017; Kifner et al., 2018; Rodriguez et al., 2018). In this study, interestingly enough, CO2 emissions increased with temperature up to 20°, and then further temperature increase caused fluxes to decrease. For methane, this response to temperature is less clear and non-significant (Figure 3G). A possible explanation regarding CO2 would be an increased consumption of CO2 by the primary producers during summer since longer hydroperiod favour the autochthonous C capture by phytoplankton (Morris et al., 2013). As we did not measure chlorophyll a, this consumption might be inferred from a significant decrease of CO2 fluxes with increasing flooding time and increasing oxygen concentration (Figures 3D,F). A higher oxygen content of the water indicates the high photosynthetic activity of primary producers to be present, which although releasing CO2 into the aquatic environment by respiration at night, substantially affects the diffusive CO2 fluxes during the day. In general, pools that were completely shaded by free-floating vegetation had lower total CO2 and CH4 emissions than pools with free-floating or submersed macrophytes in the water column and at the bottom. Reduction in diffusive CO2 fluxes due to fixation through photosynthesis from areas covered by floating water hyacinth (Eichhornia crassipes) was reported, for instance, by Attermeyer et al. (2016) from South India. Interestingly, the relationship between CO2 concentration in water and emissions showed a clear non-linear trend, where emission fluxes increased with increasing CO2 concentration, but then there was a steep decline. In general, we expected CO2 fluxes to increase with increasing concentration, and we cannot explain this contradiction objectively yet.
Compared to CO2, prediction of methane response to the tested parameters showed only few significant results, some of them being rather controversial. For instance, CH4 fluxes increased with higher oxygen concentration in the water of the ponds (Figure 3D), suggesting that the predicted methane behaviour in these small aquatic habitats is rather difficult. Since higher oxidation in the water column can be expected with higher oxygen content, methane concentrations and emissions to the atmosphere should decrease. A possible explanation for the observed higher emissions could be the role of submerged vegetation, which on the one hand releases oxygen into the water column by photosynthesis, and on the other hand, may also transport and release methane at the water surface. Thus, methane escapes potential oxidation in the water column in this case. In general, there may be several reasons why predicting the behaviour of methane in the ponds is difficult; first, methane concentration in the water may be lowered by aerobic (Chowdhury and Dick, 2013) or anaerobic methane oxidation (AOM). For instance, AOM in freshwater wetlands may reduce their potential methane emissions by over 50% (Segarra et al., 2015). Second, the presence of vascular plants has been recognized as one of the key factors controlling the scale of methane fluxes because it affects processes coupled to transport, production, and consumption of methane (Sebacher et al., 1985; Segers, 1998; Joabsson et al., 1999; Whalen, 2005; Bergström et al., 2007; Carmichael et al., 2014). Most authors indicate that emergent vegetation is much more important in relation to methane emissions than free-floating and submerged macrophytes (Laanbroek, 2010). In both emersed and submerged plants, CH4 diffuses into the roots and further into the lacunar systems of the plants. While CH4 emissions from emersed plants to the atmosphere are well documented (Altor and Mitsch, 2008; Laanbroek, 2010; Carmichael et al., 2014), we do not know much about the fate of lacunar CH4 within submersed macrophytes so far. Similar to emersed plants, O2 transport into and out of the roots of submersed plants may support root-associated methanotrophs that reduce the diffusion of CH4 from the sediment into the plants. In addition, submersed vegetation may support communities of epiphytic methane-oxidizing bacteria that are involved in methane oxidation, thus reducing the diffusive flux of CH4 from plants into the surrounding water (Heilmann and Carlton, 2001; Yoshida et al., 2014). As free-floating plants can affect CH4 emissions both positively and negatively, their general effect on CH4 emissions will depend strongly on local conditions (Kosten et al., 2016). The dominant vegetation in our ponds was usually submerged vegetation (Myriophyllum spicatum, Ceratophyllum demersum, and Hottonia palustris) or floating Lemna minor. In general, pools that were completely shaded by free-floating vegetation had lower total CO2 and CH4 emissions than those with free-floating or submersed macrophytes in the water column and at the bottom.
Diel variability in CO2 and CH4 emissions from small ponds
On an average, the ponds emitted more CO2 and CH4 at night. These findings are somewhat in contrast to previous studies which considered diel variability of both CO2 and methane emissions and observed the highest CO2 and CH4 emission in the daytime than nighttime (Sieczko et al., 2020; Rudberg et al., 2021). However, their measurements come from large lakes where different environmental drivers might play a role in controlling diel CO2 and CH4 flux dynamics. In accordance with our results, higher nighttime CO2 fluxes compared to daytime fluxes have been observed, for example, in rice paddies (Min and Rulík, 2020), in European and Arctic streams (Rocher-Ros et al., 2020; Attermeyer et al., 2021), and global rivers (Gómez-Gener et al., 2021). A recent study by Lhosmot et al. (2022) also showed a diel variability of CH4 fluxes, with higher fluxes at night and lower during the day. The ecosystem is different (peatland) but is close to rice paddies as cited here. In their study, Lhosmot et al. hypothesised that the injection of oxygen during the day by the photosynthetic activity could be at the origin of reduced CH4 fluxes compared to at night. This is also consistent with our hypothesis because we expected higher respiration in vegetated ponds and therefore higher CO2 concentrations and emissions during the night. However, because a number of ponds were without vegetation due to shading, it was not entirely clear whether the diurnal pattern of emissions described previously would be valid for all pools examined. In the case of methane, we do not have an explanation for the higher nocturnal fluxes yet because maximum rates of pressurized convection and diffusion can vary throughout the day depending on the gas concentration gradient between sediment, plant, and atmosphere. Nevertheless, our data are among the first measurements to take the ponds’ nighttime measurements into account and suggest that due to the existing diel variability, future research needs to include both daytime and nighttime measurements in total CO2 and CH4 emission estimates, as otherwise they may be significantly over- or under-estimated. In addition, direct daytime and nighttime measurements provided objective information on the net fluxes of CO2 and CH4 emissions from individual pools to the atmosphere and allowed an assessment of the role of these pools in the sink or source of GHG emissions.
Emissions of CO2 and CH4 from natural vs. artificial ponds
There are many reasons why artificial ponds differ from natural ponds (Clifford and Heffernan, 2018). In this study, natural pond emissions were usually higher when compared to the artificial waterbodies; however, the differences in CO2 and CH4 emissions were generally not significant. As natural ponds also showed to some degree similar values of the physicochemical parameters with artificial ones (Table 1), and with some cautions, it was possible to consider natural and anthropogenic waterbodies as one type and use the average emission values for possible regional extrapolation. This conclusion is somewhat at odds with the study proposed by Peacock et al. (2021a), where the authors claim that “emissions from artificial waterbodies are on average four times greater than emissions from analogous natural waterbodies” and therefore argue that emissions from natural systems cannot be used as a proxy for emissions from artificial waterbodies (Peacock et al., 2021a). An explanation for this discrepancy can be found in the fact that, under the term “artificial ponds,” we can include various farm ponds used for irrigation (Casas et al., 2012; Fuentes-Rodríguez et al., 2013) and small agricultural dams used as a collection point for rainwater runoff from surrounding lands (Olivier et al. 2019a; Olivier et al. 2019b), fishponds (Adámek et al., 2012; Pokorný and Květ, 2018), and urban ponds (Peacock et al., 2019) to small pools created primarily to enhance the biodiversity. Moreover, the very definition of the term “pond,” which is now widely used to refer to various small waterbodies, is problematic (Richardson et al., 2022). As mentioned previously, hydrology and the use of our waterbodies, both natural and artificial, have been only marginally affected by anthropogenic activities that may significantly affect biogeochemical cycling and consequently GHG emissions of the waterbodies (Altor and Mitsch, 2008). Artificial waterbodies are often subjected to an extensive hydrological management (e.g., regulated inflows and outflows or water abstraction), which affect retention times, in turn affecting pond biogeochemistry (Clifford and Hefferman, 2018). The use of ponds as breeding facilities for fish (i.e., fishponds), especially carp, is typical for the Czech Republic (Kořínek et al., 1987; Pokorný et al., 1994; Pokorný and Květ, 2018). Feeding and the associated introduction of huge amounts of nutrients lead to eutrophication of these ponds and consequently to higher GHG emissions (Rutegwa et al., 2019). Furthermore, the positive relationship between eutrophication and CH4 emissions has already been sufficiently documented for aquatic ecosystems (Beaulieu et al., 2019). However, this situation does not apply to newly built ponds and small waterbodies studied here, which are primarily intended to support biodiversity in the landscape and increase the water retention capacity of the landscape or as climate-improving elements in urban areas. However, another question is whether we need to consider emissions from these ponds strictly as an anthropogenic source and include it in national emission reports (according to the Intergovernmental Panel on Climate Change guidelines) (IPPC 2019; Peacock et al., 2021a).
Conclusion
Our data showed that despite their importance for water retention and storage in the landscape and their value for nature conservation, small waterbodies can be a significant source of GHG to the atmosphere. The ponds, like many other wetland systems, provide a range of ecosystem services, and many of these systems may represent net carbon sinks in the long term; however, in the light of recent measurements and in line with recent publications, it must be stated that small waterbodies may also represent hot spots of GHG emissions in the landscape. Carbon exchange from small waterbodies may be highly variable in time and in ways that are not usually accounted for in emission estimates. In particular, the time of the day can greatly influence the concentration and thus affect the exchange of C between the pond and the atmosphere. Therefore, our results based on direct day–night measurements provide objective information on the net fluxes of CO2 and CH4 emissions from individual ponds to the atmosphere, allowing us to assess the role of these ponds in the sink or source of GHG emissions. This view is by no means short-sighted and does not impose on anyone the idea that new wetlands should not be created because they produce GHG emissions (Mitsch and Mander. 2013; Mitsch and Mander, 2018). On the other hand, with respect to the latest assessment that nearly half of global methane emissions come from aquatic ecosystems (Rosentreter et al., 2021), future regional emission estimates would be greatly improved with the inclusion of man-made ponds and other small waterbodies, as their proliferation in the Czech Republic is evident.
We also believe that the knowledge of the processes by which small waterbodies can influence carbon cycling in the landscape will contribute to the better management of these water systems (van den Bos, 2003; Abdalla et al., 2016) and will be the most precise and beneficial path forward to counteract human-induced climate change (Premke et al., 2016). An example is the influence of hydrology on the frequency of drying and rewetting cycles and their impact on both CO2 and CH4 fluxes among ponds in the landscape (Gilbert et al., 2017). Longer hydroperiods may also favour autochthonous carbon sequestration by phytoplankton. Both direct anthropogenic influences and climate change (unanticipated and locally lower precipitation and greater evapotranspiration) have shortened hydroperiods in many reservoirs, suggesting the potential for altered C sequestration (Morris et al., 2013).
Data availability statement
The raw data supporting the conclusion of this article will be made available by the authors, without undue reservation.
Author contributions
MR—wrote the manuscript, field measuring, conceptualization, and methodology. LW—analysed the data, field measuring, laboratory analyses, and original draft preparation. SM—field measuring and laboratory analyses. RŠ—field measuring and laboratory analyses. All authors contributed to the article and approved the submitted version.
Funding
This study was supported by Univerzita Palackého v Olomouci, award numbers IGA_PrF_2020_020 and IGA_PrF_2021_014. The funders had no role in the study design, data collection and analysis, decision to publish, or preparation of the manuscript.
Acknowledgments
The authors would like to thank Adam Bednařík from the Institute of Global Change Research of the CAS in Brno for his valuable comments. The authors would also like to thank Petr Hekera and MS.c. Jan Černohorský for their help with the laboratory analyses and Ivan H Tuf for his selfless help with the statistical analyses.
Conflict of interest
The authors declare that the research was conducted in the absence of any commercial or financial relationships that could be construed as a potential conflict of interest.
Publisher’s note
All claims expressed in this article are solely those of the authors and do not necessarily represent those of their affiliated organizations, or those of the publisher, the editors, and the reviewers. Any product that may be evaluated in this article, or claim that may be made by its manufacturer, is not guaranteed or endorsed by the publisher.
Supplementary material
The Supplementary Material for this article can be found online at: https://www.frontiersin.org/articles/10.3389/fenvs.2023.1006988/full#supplementary-material
References
Abdalla, M., Hastings, A., Truu, J., Espenberg, M., Mander, Ü., and Smith, P. (2016). Emissions of methane from northern peatlands: A review of management impacts and implications for future management options. Ecol. Evol. 6 (19), 7080–7102. doi:10.1002/ece3.2469
Abnizova, A., Siemens, J., Langer, M., and Boike, J. (2012). Small ponds with major impact: The relevance of ponds and lakes in permafrost landscapes to carbon dioxide emissions. Glob. Biogeochem. Cycles 26 (2), 1. doi:10.1029/2011gb004237
Adámek, Z., Linhart, O., Kratochvíl, M., Flajšhans, M., Randák, T., Policar, T., et al. (2012). Aquaculture in the Czech republic in 2012: Modern European prosperous sector based on thousand-year history of pond culture. Aquac. Eur. 37 (2), 5–14.
Altor, A. E., and Mitsch, W. J. (2006). Methane flux from created riparian marshes: Relationship to intermittent versus continuous inundation and emergent macrophytes. Ecol. Eng. 28, 224–234. doi:10.1016/j.ecoleng.2006.06.006
Altor, A. E., and Mitsch, W. J. (2008). Pulsing hydrology, methane emissions and carbon dioxide fluxes in created marshes: A 2-year ecosystem study. Wetlands 28 (2), 423–438. doi:10.1672/07-98.1
Attermeyer, K., Casas-Ruiz, J., Fuss, T., Pastor, A., Cauvy-Fraunié, S., Sheath, D., et al. (2021). Carbon dioxide fluxes increase from day to night across European streams. Commun. Earth Environ. 2 (1), 118. doi:10.1038/s43247-021-00192-w
Attermeyer, K., Flury, S., Jayakumar, R., Fiener, P., Steger, K., Arya, V., et al. (2016). Invasive floating macrophytes reduce greenhouse gas emissions from a small tropical lake. Sci. Rep. 6 (1), 20424–20510. doi:10.1038/srep20424
Bagella, S., Gascón, S., Filigheddu, R., Cogoni, A., and Boix, D. (2016). Mediterranean temporary ponds: New challenges from a neglected habitat. Hydrobiologia 782 (1), 1–10. doi:10.1007/s10750-016-2962-9
Baird, A. J., Stamp, I., Heppell, C. M., and Green, S. M. (2010). CH4 flux from peatlands: A new measurement method. Ecohydrology 3 (3), 360–367. doi:10.1002/eco.109
Beaulieu, J. J., Balz, D. A., Birchfield, M. K., Harrison, J. A., Nietch, C. T., Platz, M. C., et al. (2018). Effects of an experimental water-level drawdown on methane emissions from a eutrophic reservoir. Ecosystems 21 (4), 657–674. doi:10.1007/s10021-017-0176-2
Beaulieu, J. J., DelSontro, T., and Downing, J. A. (2019). Eutrophication will increase methane emissions from lakes and impoundments during the 21st century. Nat. Commun. 10 (1), 1375–5. doi:10.1038/s41467-019-09100-5
Bednařík, A., Blaser, M., and Rulík, M. (2019). Methane formation and consumption by sediments in a cross-channel profile of a small river impoundment. J. Limnol. 78 (2). doi:10.4081/jlimnol.2019.1898
Bergström, I., Mäkelä, S., Kankaala, P., and Kortelainen, P. (2007). Methane efflux from littoral vegetation stands of southern boreal lakes: An upscaled regional estimate. Atmos. Environ. 41 (2), 339–351. doi:10.1016/j.atmosenv.2006.08.014
Bernal, B., and Mitsch, W. J. (2012). Comparing carbon sequestration in temperate freshwater wetland communities. Glob. Change Biol. 18, 1636–1647. doi:10.1111/j.1365-2486.2011.02619.x
Biggs, J., Von Fumetti, S., and Kelly-Quinn, M. (2017). The importance of small waterbodies for biodiversity and ecosystem services: Implications for policy makers. Hydrobiologia 793 (1), 3–39. doi:10.1007/s10750-016-3007-0
Boix, D., Biggs, J., Céréghino, R., Hull, A. P., Kalettka, T., and Oertli, B. (2012). Pond research and management in Europe:“Small is beautiful”. Hydrobiologia 689 (1), 1–9. doi:10.1007/s10750-012-1015-2
Boon, P. I., Mitchell, A., and Lee, K. (1997). Effects of wetting and drying on methane emissions from ephemeral floodplain wetlands in south-eastern Australia. Hydrobiologia 357 (1), 73–87. doi:10.1023/a:1003126601466
Bridgham, S. D., Cadillo-Quiroz, H., Keller, J. K., and Zhuang, Q. (2013). Methane emissions from wetlands: Biogeochemical, microbial, and modeling perspectives fromlocal to global scales. Glob. Change Biol. 19, 1325–1346. doi:10.1111/gcb.12131
Brigham, S. D., Megonigal, J. P., Keller, J. K., Bliss, N. B., and Trettin, C. (2006). The carbon balance of North American wetlands. Wetlands 26 (4), 889–916. doi:10.1672/0277-5212(2006)26[889:tcbona]2.0.co;2
Bunn, S. E., and Arthington, A. H. (2002). Basic principles and ecological consequences of altered flow regimes for aquatic biodiversity. Environ. Manag. 30 (4), 492–507. doi:10.1007/s00267-002-2737-0
Carmichael, M. J., Bernhardt, E. S., Bräuer, S. L., and Smith, W. K. (2014). The role of vegetation in methane flux to the atmosphere: Should vegetation be included as a distinct category in the global methane budget? Biogeochemistry 119, 1–24. doi:10.1007/s10533-014-9974-1
Casanova, M., and Brock, M. A. (2000). How do depth, duration and frequency of flooding influence the establishment of wetland plant communities? Plant Ecol. 147, 237–250. doi:10.1023/a:1009875226637
Casas, J. J., Toja, J., Peñalver, P., Juan, M., León, D., Fuentes-Rodríguez, F., et al. (2012). Farm ponds as potential complementary habitats to natural wetlands in a Mediterranean region. Wetlands 32 (1), 161–174. doi:10.1007/s13157-011-0265-5
Casas, J., Toja, J., Bonachela, S., Fuentes, F., Gallego, I., Juan, M., et al. (2011). Artificial ponds in a mediterranean region (Andalusia, southern Spain): Agricultural and environmental issues. Water Environ. J. 25 (3), 308–317. doi:10.1111/j.1747-6593.2010.00221.x
Catalán, N., von Schiller, D., Marcé, R., Koschorreck, M., Gomez-Gener, L., and Obrador, B. (2014). Carbon dioxide efflux during the flooding phase of temporary ponds. Limnetica 33 (2), 349–360. doi:10.23818/limn.33.27
Céréghino, R., Boix, D., Cauchie, H. M., Martens, K., and Oertli, B. (2014). The ecological role of ponds in a changing world. Hydrobiologia 723 (1), 1–6. doi:10.1007/s10750-013-1719-y
Céréghino, R., Biggs, J., Oertli, B., and Declerck, S. (2008). The ecology of European ponds: defining the characteristics of a neglected freshwater habitat. Hydrobiologia 597, 1–6. doi:10.1007/s10750-007-9225-8
Chowdhury, T. R., and Dick, R. P. (2013). Ecology of aerobic methanotrophs in controlling methane fluxes from wetlands. Appl. soil Ecol. 65, 8–22. doi:10.1016/j.apsoil.2012.12.014
Ciais, P. C., Sabine, G., Bala, L., Bopp, V., Brovkin, J., Canadell, A., et al. (2013). “Carbon and other biogeochemical cycles,” in Climate change 2013: The physical science basis contribution of working group I to the fifth assessment report of the intergovernmental Panel on climate change. Editors T. F. Stocker, D. Qin, G. K. Plattner, M. Tignor, S. K. Allen, J. Boschunget al. (Cambridge, United Kingdom and New York, NY, USA: Cambridge University Press).
Clifford, C. C., and Heffernan, J. B. (2018). Artificial aquatic ecosystems. Water 10 (8), 1096. doi:10.3390/w10081096
Costanza, R., d'Arge, R., De Groot, R., Farber, S., Grasso, M., Hannon, B., et al. (1997). The value of the world's ecosystem services and natural capital. nature 387 (6630), 253–315. doi:10.1016/s0921-8009(98)00020-2
Craft, C., Vymazal, J., and Kröpfelová, L. (2017). Carbon sequestration and nutrient accumulation in floodplain and depressional wetlands. Ecol. Eng. 114, 137–145. doi:10.1016/j.ecoleng.2017.06.034
Davidson, E. A., and Janssens, I. A. (2006). Temperature sensitivity of soil carbon decomposition and feedbacks to climate change. Nature 440, 165–173. doi:10.1038/nature04514
Deemer, B. R., Harrison, J. A., Li, S., Beaulieu, J. J., DelSontro, T., Barros, N., et al. (2016). Greenhouse gas emissions from reservoir water surfaces: A new global synthesis. BioScience 66 (11), 949–964. doi:10.1093/biosci/biw117
DelSontro, T., Boutet, L., St-Pierre, A., del Giorgio, P. A., and Prairie, Y. T. (2016). Methane ebullition and diffusion from northern ponds and lakes regulated by the interaction between temperature and system productivity. Limnol. Oceanogr. 61 (S1), S62–S77. doi:10.1002/lno.10335
De Meester, L., Declerck, S., Stoks, R., Louette, G., van de Meutter, F., de Bie, T., et al. (2005). Ponds and pools as model systems in conservation biology, ecology and evolutionary biology. Aquatic Conserv: Mar. Freshw. Ecosyst. 15, 715–725. doi:10.1002/aqc.748
dos Santos Pinto, R. M., Weigelhofer, G., Diaz-Pines, E., Brito, A. G., Zechmeister-Boltenstern, S., and Hein, T. (2020). River-floodplain restoration and hydrological effects on GHG emissions: Biogeochemical dynamics in the parafluvial zone. Sci. Total Environ. 715, 136980. doi:10.1016/j.scitotenv.2020.136980
Downing, J. A., Cole, J. J., Middelburg, J. J., Striegl, R. G., Duarte, C. M., Kortelainen, P., et al. (2008). Sediment organic carbon burial in agriculturally eutrophic impoundments over the last century. Glob. Biogeochem. Cycles 22 (1), 1. doi:10.1029/2006gb002854
Downing, J. A. (2010). Emerging global role of small lakes and ponds: Little things mean a lot. Limnetica 29 (1), 0009–0024. doi:10.23818/limn.29.02
Downing, J. A., Prairie, Y. T., Cole, J. J., Duarte, C. M., Tranvik, L. J., Striegl, R. G., et al. (2006). The global abundance and size distribution of lakes, ponds, and impoundments. Limnol. Oceanogr. 51 (5), 2388–2397. doi:10.4319/lo.2006.51.5.2388
Drozd, J., and Novák, J. (1979). Headspace gas analysis by gas chromatography. J. Chromatogr. A 165 (2), 141–165. doi:10.1016/s0021-9673(00)90938-5
Dušek, J., Dařenová, E., Pavelka, M., and Marek, M. V. (2020). “Methane and carbon dioxide release from wetland ecosystems,” in Climate change and soil interactions. Editors N. M. V. Prasad, and M. Pietrzykowski (Amsterdam, Netherlands: Elsevier Science Ltd), 509–553. doi:10.1016/B978-0-12-818032-7.00019-9
Duigan, C. A., and Jones, A. T. (1997). Pond conservation symposium: introduction. Aquatic Conserv: Mar. Freshw. Ecosyst. 7, 87–89.
Evenson, G. R., Golden, H. E., Lane, C. R., McLaughlin, D. L., and D’Amico, E. (2018). Depressional wetlands affect watershed hydrological, biogeochemical, and ecological functions. Ecol. Appl. 28 (4), 953–966. doi:10.1002/eap.1701
Finlayson, C. M., Everard, M., Irvine, K., McInnes, R. J., Middleton, B. A., van Dam, A. A., et al. (Editors) (2018). The wetland book: I: Structure and function, management, ad methods. 1st ed. (Germany: Springer), 2290.
Fromin, N., Pinay, G., Montuelle, B., Landais, D., Ourcival, J. M., Joffre, R., et al. (2010). Impact of seasonal sediment desiccation and rewetting on microbial processes involved in greenhouse gas emissions. Ecohydrology 3 (3), 339–348. doi:10.1002/eco.115
Fuentes-Rodríguez, F., Juan, M., Gallego, I., Lusi, M., Fenoy, E., Leon, D., et al. (2013). Diversity in mediterranean farm ponds: Trade-offs and synergies between irrigation modernisation and biodiversity conservation. Freshw. Biol. 58 (1), 63–78. doi:10.1111/fwb.12038
Gilbert, P. J., Cooke, D. A., Deary, M., Taylor, S., and Jeffries, M. J. (2017). Quantifying rapid spatial and temporal variations of CO2 fluxes from small, lowland freshwater ponds. Hydrobiologia 793 (1), 83–93. doi:10.1007/s10750-016-2855-y
Gómez-Gener, L., Rocher-Ros, G., Battin, T., Cohen, M. J., Dalmagro, H. J., Dinsmore, K. J., et al. (2021). Global carbon dioxide efflux from rivers enhanced by high nocturnal emissions. Nat. Geosci. 14 (5), 289–294. doi:10.1038/s41561-021-00722-3
Grinham, A., Albert, S., Deering, N., Dunbabin, M., Bastviken, D., Sherman, B., et al. (2018). The importance of small artificial water bodies as sources of methane emissions in Queensland, Australia. Hydrology Earth Syst. Sci. 22 (10), 5281–5298. doi:10.5194/hess-22-5281-2018
Hatfield, J. L., and Prueger, J. H., 2011. Spatial and temporal variation in evapotranspiration 3-16. In: Ribeiro da Cunha, A. and Schoffel, E. R. The Evapotranspiration in Climate Classification, Evapotranspiration - from Measurements to Agricultural and Environmental Applications, Dr. Giacomo Gerosa (Ed.), ISBN: 978-953-307-512-9, InTech.
Heilman, M. A., and Carlton, R. G. (2001). Methane oxidation associated with submersed vascular macrophytes and its impact on plnat diffusive methane flux. Biogeochemistry 52, 207–224. doi:10.1023/a:1006427712846
Hilgert, S., Fernandes, C. V. S., and Fuchs, S. (2019). Redistribution of methane emission hot spots under drawdown conditions. Sci. Total Environ. 646, 958–971. doi:10.1016/j.scitotenv.2018.07.338
Holgerson, M. A. (2015). Drivers of carbon dioxide and methane supersaturation in small, temporary ponds. Biogeochemistry 124 (1), 305–318. doi:10.1007/s10533-015-0099-y
Holgerson, M. A., and Raymond, P. A. (2016). Large contribution to inland water CO2 and CH4 emissions from very small ponds. Nat. Geosci. 9 (3), 222–226. doi:10.1038/ngeo2654
Huertas, I. E., Flecha, S., Figuerola, J., Costas, E., and Morris, E. P. (2017). Effect of hydroperiod on CO2 fluxes at the air-water interface in the Mediterranean coastal wetlands of Doñana. J. Geophys. Res. Biogeosciences 122 (7), 1615–1631. doi:10.1002/2017jg003793
Huryna, H., Brom, J., and Pokorny, J. (2014). The importance of wetlands in the energy balance of an agricultural landscape. Wetl. Ecol. Manag. 22 (4), 363–381. doi:10.1007/s11273-013-9334-2
Huttunen, J., Alm, J., Liikanen, A., Juutinen, S., Larmola, T., Hammar, T., et al. (2003). Fluxes of methane, carbon dioxide and nitrous oxide in boreal lakes and potential anthropogenic effects on the aquatic greenhouse gas emissions. Chemosphere 52 (3), 609–621. doi:10.1016/s0045-6535(03)00243-1
Joabsson, A., Christensen, T. R., and Wallén, B. (1999). Vascular plant controls on methane emissions from northern peatforming wetlands. Trends Ecol. Evol. 14 (10), 385–388. doi:10.1016/s0169-5347(99)01649-3
Joniak, T., Kuczyńska-Kippen, N., and Gąbka, M. (2017). Effect of agricultural landscape characteristics on the hydrobiota structure in small water bodies. Hydrobiologia 793 (1), 121–133. doi:10.1007/s10750-016-2913-5
Kang, H., and Jang, I. 2018. Carbon flux from wetlands. pp. 277–283. In: C. M. Finlayson (eds.), The wetland book, Germany, Springer Science+Business Media B.V., part of Springer Nature. doi:10.1007/978-90-481-9659-3_69
Kayranli, B., Scholz, M., Mustafa, A., and Hedmark, Å. (2010). Carbon storage and fluxes within freshwater wetlands: A critical review. Wetlands 30, 111–124. doi:10.1007/s13157-009-0003-4
Keller, J. K. (2011). Wetlands and the global carbon cycle: What might the simulated past tell us about the future? New Phytol. 192, 789–792. doi:10.1111/j.1469-8137.2011.03954.x
Kifner, L. H., Calhoun, A. J., Norton, S. A., Hoffmann, K. E., and Amirbahman, A. (2018). Methane and carbon dioxide dynamics within four vernal pools in Maine, USA. Biogeochemistry 139 (3), 275–291. doi:10.1007/s10533-018-0467-5
Kořínek, V., Fott, J., Fuksa, J., Lellák, J., and Pražáková, M. (1987). “Carp ponds of central Europe,” in Managed aquatic ecosystems. Editor R. G. Michael (Amsterdam: Elsevier Science Publishers B.V.), 29–62.
Kosten, S., Piňeiro, M., de Goede, E., de Klein, J., Lamers, L. P. M., and Ettwig, K. (2016). Fate of methane in aquatic systems dominated by free-floating plants. Water Res. 104, 200–207. doi:10.1016/j.watres.2016.07.054
Laanbroek, H. J. (2010). Methane emission from natural wetlands: Interplay between emergent macrophytes and soil microbial processes. A mini-review. Ann. Bot. 105, 141–153. doi:10.1093/aob/mcp201
Lhosmot, A., Jacotot, A., Steinmann, M., et al. (2022): Biotic and abiotic control over diurnal CH4 fluxes in a temperate transitional poor fen ecosystem. Ecosystems 2022. 1. doi:10.1007/s10021-022-00809-x
LI-COR Inc (2020). Measuring the methane concentration of small air samples with the LI-7810. Bad Homburg, Germany: Li_COR Biosciences GmBh, 1–4.
Mander, Ü., Dotro, G., Ebie, Y., Towprayoon, S., Chiemchaisri, C., Nogueira, F., et al. (2014). Greenhouse gas emission in constructed wetlands for wastewater treatment: A review. Ecol. Eng. 66, 19–35. doi:10.1016/j.ecoleng.2013.12.006
Marcé, R., Obrador, B., Gómez-Gener, L., Catalán, N., Koschorreck, M., Arce, M. I., et al. (2019). Emissions from dry inland waters are a blind spot in the global carbon cycle. Earth-science Rev. 188, 240–248. doi:10.1016/j.earscirev.2018.11.012
Mbaka, J. G., Somlai, C., Köpfer, D., Maeck, A., Lorke, A., and Schäfer, R. B. (2014). Methane-derived carbon in the benthic food web in stream impoundments. Plos One 9 (10), e111392. doi:10.1371/journal.pone.0111392
McNicol, G., Sturtevant, C. S., Knox, S. H., Dronova, I., Baldocchi, D. D., and Silver, W. L. (2017). Effects of seasonality, transport pathway, and spatial structure on greenhouse gas fluxes in a restored wetland. Glob. Change Biol. 15, 2768–2782. doi:10.1111/gcb.13580
Meyer, J. L., Likens, G. E., and Sloane, J. (1981). Phosphorus, nirogen, and organic carbon flux in a headwater stream. Arch. fur Hydrobiol. 91 (1).
Min, S., and Rulík, M. (2020). Comparison of carbon dioxide (CO2) fluxes between conventional and conserved irrigated rice paddy fields in Myanmar. Sustainability 12 (14), 5798. doi:10.3390/su12145798
Mitch, W. J., Bernal, B., Nahlik, A. M., Mander, U., Zhang, L., Anderson, C. J., et al. (2013). Wetlands, carbon, andclimate change. Landsc. Ecol. 28, 583–597. doi:10.1007/s10980-012-9758-8
Mitsch, W. J., and Mander, Ü. (2018). Wetlands and carbon revisited. Ecol. Eng. 114, 1–6. doi:10.1016/j.ecoleng.2017.12.027
Morris, E. P., Flecha, S., Figuerola, J., Costas, E., Navarro, G., Ruiz, J., et al. (2013). Contribution of Doñana wetlands to carbon sequestration. PloS one 8 (8), e71456. doi:10.1371/journal.pone.0071456
Mullins, M. L., and Doyle, R. D. (2019). Big things come in small packages: Why limnologists should care about small ponds. Acta Limnol. Bras. 31. doi:10.1590/s2179-975x4119
Nahlik, A. M., and Fennessy, M. S. (2016). Carbon storage in US wetlands. Nat. Commun. 7, 13835. doi:10.1038/ncomms13835
Nieveen, J. P., Campbell, D. I., Schipper, L. A., and Blair, I. J. (2005). Carbon exchange of grazed pasture on a drained peat soil. Glob. Change Biol. 11, 607–618. doi:10.1111/j.1365-2486.2005.00929.x
Obrador, B., von Schiller, D., Marcé, R., Gómez-Gener, L., Koschorreck, M., Borrego, C., et al. (2018). Dry habitats sustain high CO2 emissions from temporary ponds across seasons. Sci. Rep. 8, 3015. doi:10.1038/s41598-018-20969-y
Ollivier, Q. R., Maher, D. T., Pitfield, C., and Macreadie, P. I. (2019a). Punching above their weight: Large release of greenhouse gases from small agricultural dams. Glob. change Biol. 25 (2), 721–732. doi:10.1111/gcb.14477
Ollivier, Q. R., Maher, D. T., Pitfield, C., and Macreadie, P. I. (2019b). Winter emissions of CO2, CH4, and N2O from temperate agricultural dams: Fluxes, sources, and processes. Ecosphere 10 (11), e02914. doi:10.1002/ecs2.2914
Onandia, G., Lischeid, G., Kalettka, T., Kleeberg, A., Omari, M., Premke, K., et al. (2018). Biogeochemistry of natural ponds in agricultural landscape: Lessons learned from modeling a kettle hole in northeast Germany. Sci. Total Environ. 634, 1615–1630. doi:10.1016/j.scitotenv.2018.04.014
Pavelková, R., Frajer, J., Netopil, P., et al. (2014). “Historical ponds of the Czech republic: Comparison of the current state with that of the second half of the 19th century,” in Czech]. Výzkumný ústav vodohospodářský T. Editor G. Masaryka (Praha.
Peacock, M., Audet, J., Bastviken, D., Cook, S., Evans, C. D., Grinham, A., et al. (2021a). Small artificial waterbodies are widespread and persistent emitters of methane and carbon dioxide. Glob. Change Biol. 27 (20), 5109–5123. doi:10.1111/gcb.15762
Peacock, M., Audet, J., Bastviken, D., Futter, M. N., Gauci, V., Grinham, A. R., et al. (2021b). Global importance of methane emissions from drainage ditches and canals. Environ. Res. Lett. 16, 044010. doi:10.1088/1748-9326/abeb36
Peacock, M., Audet, J., Jordan, S., Smeds, J., and Wallin, M. B. (2019). Greenhouse gas emissions from urban ponds are driven by nutrient status and hydrology. Ecosphere 10 (3), e02643. doi:10.1002/ecs2.2643
Podgrajsek, E., Sahlée, E., and Rutgerson, A. (2014). Diurnal cycle of lake methane flux: Diurnal cycle of lake methane flux. Biogeosciences 119, 236–248. doi:10.1002/2013jg002327
Pokorný, J. (2001). Dissipation of solar energy in landscape—Controlled by management of water and vegetation. Renew. energy 24 (3-4), 641–645. doi:10.1016/s0960-1481(01)00050-7
Pokorný, J., and Květ, J. (2018). “Fishponds of the Czech republic,” in The wetland book. (Dordrecht: Springer), 469–485. doi:10.1007/978-94-007-4001-3_208
Pokorný, J., Květ, J., Rejšková, A., and Brom, J. (2010). Wetlands as energy-dissipating systems. J. Industrial Microbiol. Biotechnol. 37 (12), 1299–1305. doi:10.1007/s10295-010-0873-8
Pokorný, J., Schlott, J., Schlott, K., Pechar, L., and Koutníková, J. 1994. Monitoring of changes in fishpond ecosystems. pp. 37–45. In: Aubrecht G., Dick G., and Prentice C. (eds.): Monitoring of ecological change in wetlands of middle Europe. Proc. International workshop, Stapfia 31, Linz, Austria, and IWRB Publication No. 30, Slimbridge, UK, 224 pp.
Premke, K., Attermeyer, K., Augustin, J., Cabezas, A., Casper, P., Deumlich, D., et al. (2016). The importance of landscape diversity for carbon fluxes at the landscape level: Small-scale heterogeneity matters. Wiley Interdiscip. Rev. Water 3 (4), 601–617. doi:10.1002/wat2.1147
Raymond, P. A., Hartmann, J., Lauerwald, R., Sobek, S., McDonald, C., Hoover, M., et al. (2013). Global carbon dioxide emissions from inland waters. Nature 503 (7476), 355–359. doi:10.1038/nature12760
Reis, V., Hermoso, V., Hamilton, S. K., Ward, D., Fluet-Chouinard, E., Lehner, B., et al. (2017). A global assessment of inland wetland conservation status. BioScience 67 (6), 523–533. doi:10.1093/biosci/bix045
Richardson, D. C., Holgerson, M. A., Farragher, M. J., Hoffman, K. K., King, K., Alfonso, M. B., et al. (2022). A functional definition to distinguish ponds from lakes and wetlands. Sci. Rep. 12 (1), 10472–10513. doi:10.1038/s41598-022-14569-0
Rocher-Ros, G., Sponseller, R. A., Begrström, A. K., Myrstener, M., and Giesler, R. (2020). Stream metabolism controls diel patterns and evasion of CO 2 in Arctic streams. Glob. Change Biol. 26, 1400–1413. doi:10.1111/gcb.14895
Rodriguez, M., Gonsiorczyk, T., and Casper, P. (2018). Methane production increases with warming and carbon additions to incubated sediments from a semiarid reservoir. Inland Waters 8 (1), 109–121. doi:10.1080/20442041.2018.1429986
Rosentreter, J. A., Borges, A. V., Deemer, B. R., Holgerson, M. A., Liu, S., Song, C., et al. (2021). Half of global methane emissions come from highly variable aquatic ecosystem sources. Nat. Geosci. 14 (4), 225–230. doi:10.1038/s41561-021-00715-2
Rudberg, D., Duc, N. T., Schenk, J., Sieczko, A. K., Pajala, G., Sawakuchi, H. O., et al. (2021). Diel variability of CO2 emissions from northern lakes. J. Geophys. Res. Biogeosciences 126 (10), e2021JG006246. doi:10.1029/2021jg006246
Rulík, M., and White, S. M. (2020). “The role of water in the landscape,” in Assessment and protection of water resources in the Czech republic (Cham: Springer), 71–90.
Rutegwa, M., Gebauer, R., Veselý, L., Regenda, J., Strunecký, O., Hejzlar, J., et al. (2019). Diffusive methane emissions from temperate semi-intensive carp ponds. Aquacult Environ. Interact. 11, 19–30. doi:10.3354/aei00296
Sebacher, D. I., Harriss, R. C., and Bartlett, K. B. (1985). Methane emissions to the atmosphere through aquatic plants. J. Environ. Qual. 14 (1), 40–46. doi:10.2134/jeq1985.00472425001400010008x
Segarra, K. E. A., Schubotz, F., Samarkin, V., Yoshinaga, M. Y., Hinrichs, K. U., and Joye, S. B. (2015). High rates of anaerobic methane oxidation in freshwater wetlands reduce potential atmospheric methane emissions. Nat. Commun. 6 (1), 7477–7478. doi:10.1038/ncomms8477
Segers, R. (1998). Methane production and methane consumption: A review of processes underlying wetland methane fluxes. Biogeochemistry 41 (1), 23–51. doi:10.1023/A:1005929032764
Sieczko, A. K., Duc, N. T., Schenk, J., Pajala, G., Rudberg, D., Sawakuchi, H. O., et al. (2020). Diel variability of methane emissions from lakes. Proc. Natl. Acad. Sci. 117 (35), 21488–21494. doi:10.1073/pnas.2006024117
Søndergaard, M., Jeppesen, E., and Jensen, J. P. (2005). Pond or lake: Does it make any difference? Arch. für Hydrobiol. 162 (2), 143–165. doi:10.1127/0003-9136/2005/0162-0143
St. Louis, V. L., Kelly, C. A., Duchemin, E., Rudd, J. W., and Rosenberg, D. M. (2000). Reservoir surface as sources of greenhouse gases to the atmosphere: A global estimate. BioScience 50, 766–775. doi:10.1641/0006-3568(2000)050[0766:RSASOG]2.0.CO;2
Sulman, B. N., Desai, A. R., Cook, B. D., Saliendra, N., and Mackay, D. S. (2009). Contrasting carbon dioxide fluxes between a drying shrub wetland in Northern Wisconsin, USA, and nearby forests. Biogeosciences 6, 1115–1126. doi:10.5194/bg-6-1115-2009
Sun, R., Chen, A., Chen, L., and Lü, Y. (2012). Cooling effects of wetlands in an urban region: The case of Beijing. Ecol. Indic. 20, 57–64. doi:10.1016/j.ecolind.2012.02.006
Tan, L., Ge, Z., Zhou, X., Li, S., Li, Y., and Tang, J. (2020). Conversion of coastal wetlands, riparian wetlands, and peatlands increases greenhouse gas emissions: A global meta-analysis. Glob. Change Biol. 26, 1638–1653. doi:10.1111/gcb.14933
Tangen, B. A., Finocchiaro, R. G., and Gleason, R. A. (2015). Effects of land use on greenhouse gas fluxes and soil properties of wetland catchments in the Prairie Pothole Region of North America. Sci. Total Environ. 533, 391–409. doi:10.1016/j.scitotenv.2015.06.148
Ter Braak, C. J. F., and Šmilauer, P. (2012). Canoco reference manual and user’s guide: Software for ordination. Germany: Microcomputer Power, 496.
Thiere, G., Milenkovski, S., Lindgren, P. E., Sahlén, G., Berglund, O., and Weisner, S. E. (2009). Wetland creation in agricultural landscapes: Biodiversity benefits on local and regional scales. Biol. Conserv. 142 (5), 964–973. doi:10.1016/j.biocon.2009.01.006
Torgersen, T., and Branco, B. (2008). Carbon and oxygen fluxes from a small pond to the atmosphere: temporal variability and the CO2/O2 imbalance. Water Resour. Res. 44, W02417. doi:10.1029/2006WR005634
Tranvik, L. J., Downing, J. A., Cotner, J. B., Loiselle, S. A., Striegl, R. G., Ballatore, T. J., et al. (2009). Lakes and reservoirs as regulators of carbon cycling and climate. Limnol. Oceanogr. 54 (6), 2298–2314. doi:10.4319/lo.2009.54.6_part_2.2298
Tuittila, E. S., Komulainen, V. M., Vasander, H., Nykänen, H., Martikainen, P. J., and Laine, K. (2000). Methane dynamics of a restored cut-away peatland. Glob. Change Biol. 6, 569–581. doi:10.1046/j.1365-2486.2000.00341.x
Turetsky, M. R., Kotowska, A., Bubier, J., Dise, N. B., Crill, P., Hornibrook, E. R. C., et al. (2014). A synthesis of methane emissions from 71 northern, temperate, and subtropical wetlands. Glob. Change Biol. 20, 2183–2197. doi:10.1111/gcb.12580
van den Bos, R. (2003). Restoration of former wetlands in The Netherlands; effect on the balance between CO2 sink and CH4 source. Neth. J. Geosciences 82 (4), 325–331. doi:10.1017/s0016774600020151
Verpoorter, C., Kutser, T., Seekell, D. A., and Tranvik, L. J. (2014). A global inventory of lakes based on high-resolution satellite imagery. Geophys. Res. Lett. 41 (18), 6396–6402. doi:10.1002/2014gl060641
Villa, J. A., and Bernal, B. (2018). Carbon sequestration in wetlands, from science to practice: An overview of the biogeochemical process, measurement methods, and policy framework. Ecol. Eng. 114, 115–128. doi:10.1016/j.ecoleng.2017.06.037
von Schiller, D., Marcé, R., Obrador, B., Gómez-Gener, L., Casas-Ruiz, J. P., Acuña, V., et al. (2014). Carbon dioxide emissions from dry watercourses. Inland waters. 4 (4), 377–382. doi:10.5268/iw-4.4.746
Vretare Strand, V. (2002). The influence of ventilation systems on water depth penetration of emergent macrophytes. Freshw. Biol. 47, 1097–1105. doi:10.1046/j.1365-2427.2002.00834.x
Watkins, S. C., Baldwin, D. S., Waudby, H. P., and Ning, S. E. M. A. (2017). Managing rain-filled wetlands for carbon sequestration: A synthesis. Rangel. J. 39, 145–152. doi:10.1071/rj16077
Weiss, R. (1974). Carbon dioxide in water and seawater: The solubility of a non-ideal gas. Mar. Chem. 2 (3), 203–215. doi:10.1016/0304-4203(74)90015-2
Whalen, S. C. (2005). Biogeochemistry of methane Exchange between natural wetlands and the atmosphere. Environ. Eng. Sci. 22, 73–94. doi:10.1089/ees.2005.22.73
Whitting, G. J., and Chanton, J. P. (2001). Grennhouse carbon balance of wetlands: Methane emission versus carbon sequestration. Tellus 53B, 521–528.
Wiesenburg, D. A., and Guinasso, N. L. (1979). Equilibrium solubilities of methane, carbon monoxide, and hydrogen in water and sea water. J. Chem. Eng. data 24 (4), 356–360. doi:10.1021/je60083a006
Wilson, J., Baldwin, D., Rees, G., and Wilson, B. (2011). The effects of shortterm inundation on carbon dynamics, microbial community structure and microbial activity in floodplain soil. River Res. Appl. 27, 213–225. doi:10.1002/rra.1352
Yoshida, N., Iguchi, H., Yurimoto, H., Murakami, A., and Sakai, Y. (2014). Aquatic plant surface as a niche for methanotrophs. Front. Microbiol. 5 (30), 30–39. doi:10.3389/fmicb.2014.00030
Yvon-Durocher, G., Allen, A. P., Bastviken, D., Conrad, R., Gudasz, C., St-Pierre, A., et al. (2014). Methane fluxes show consistent temperature dependence across microbial to ecosystem scales. Nature 507 (7493), 488–491. doi:10.1038/nature13164
Yvon-Durocher, G., Hulatt, C. J., Woodward, G., and Trimmer, M. (2017). Long-term warming amplifies shifts in the carbon cycle of experimental ponds. Nat. Clim. Change 7 (3), 209–213. doi:10.1038/nclimate3229
Yvon-Durocher, G., Montoya, J. M., Goodward, G., Jones, J. I., and Trimmer, M. (2011). Warming increases the proportion of primary production emitted as methane from freshwater mesocosms: Warming alters methane emissions in freshwater mesocosms. Glob. Change Biol. 17, 1225–1234. doi:10.1111/j.1365-2486.2010.02289.x
Zacharias, I., Dimitriou, E., Dekker, A., and Dorsman, E. (2007). Overview of temporary ponds in the mediterranean region: Threats, management and conservation issues. J. Environ. Biol. 28 (1), 1–9.
Zacharias, I., and Zamparas, M. (2010). Mediterranean temporary ponds. A disappearing ecosystem. Biodivers. conservation 19 (14), 3827–3834. doi:10.1007/s10531-010-9933-7
Zemanová, K., Picek, T., Dušek, J., Edwards, K., and Šantrůčková, H. (2010). Carbon, nitrogen and phosphorus tranformations are related to age of a constructe wetland. Water Air Soil Pollut. 207, 39–48. doi:10.1007/s11270-009-0117-6
Zhao, J., Malone, S. L., Oberbauer, S. F., Olivas, P. C., Schedlbauer, J. L., Staudhammer, C. L., et al. (2019). Intensified inundation shifts a freshwater wetland from a CO2 sink to a source. Glob. Change Biol. 25, 3319–3333. doi:10.1111/gcb.14718
Keywords: floodplain ponds, carbon dioxide, methane, emission flux, carbon cycle
Citation: Rulík M, Weber L, Min S and Šmíd R (2023) CO2 and CH4 fluxes from inundated floodplain ponds: role of diel variability and duration of inundation. Front. Environ. Sci. 11:1006988. doi: 10.3389/fenvs.2023.1006988
Received: 29 July 2022; Accepted: 26 June 2023;
Published: 12 July 2023.
Edited by:
Cyril Marchand, University of New Caledonia, FranceReviewed by:
Victor Mikhailovich Stepanenko, Lomonosov Moscow State University, RussiaAnna Carolina Fornero Aguiar, Federal University of Rio de Janeiro, Brazil
Adrien Jacotot, UMR7327 Institut des Sciences de la Terre d’Orléans (ISTO), France
Copyright © 2023 Rulík, Weber, Min and Šmíd. This is an open-access article distributed under the terms of the Creative Commons Attribution License (CC BY). The use, distribution or reproduction in other forums is permitted, provided the original author(s) and the copyright owner(s) are credited and that the original publication in this journal is cited, in accordance with accepted academic practice. No use, distribution or reproduction is permitted which does not comply with these terms.
*Correspondence: Martin Rulík, bWFydGluLnJ1bGlrQHVwb2wuY3o=