 Lingaiah Keerthan
 Ramesh RamyaPriya
 Lakshmanan Elango
94% of researchers rate our articles as excellent or good
Learn more about the work of our research integrity team to safeguard the quality of each article we publish.
Find out more
ORIGINAL RESEARCH article
Front. Environ. Sci., 28 March 2023
Sec. Water and Wastewater Management
Volume 11 - 2023 | https://doi.org/10.3389/fenvs.2023.1001052
This article is part of the Research TopicGroundwater Quality Monitoring and Assessment of Human Health RiskView all 4 articles
Degradation of water quality is a major challenge in both developed and developing countries since it poses a great risk to ecological health. The Cauvery river is one of the most important rivers of southern India, where the effect of seasonal variation on the quality of river water and its adjoining groundwater on the lower part of the basin has not yet been studied. Hence, the present study was carried out to evaluate the river water and adjacent groundwater for drinking and irrigational purposes, and also to identify the sources affecting the water quality. About 118 river water and 131 groundwater samples were collected over 4 months from May 2018 to August 2019. The water samples were analyzed for electrical conductivity (EC), pH, major and minor ions, and trace elements. The major, minor, and trace elements were then compared with the Bureau of Indian Standards and World Health Organization for drinking water quality assessment. The drinking water quality was assessed, indicating that both river water and groundwater were unsuitable in the coastal regions, especially during dry seasons. Irrigation water quality was also assessed, which indicates that most of the river water and groundwater samples were unsuitable near the coastal region. The quality of river water and groundwater in the lower Cauvery Basin was found to be better during wet periods compared to the dry season. It was observed that the rock–water interactions was the major factor controlling the water quality for groundwater and surface water, followed by anthropogenic activities such as disposal of domestic sewage and effluents into the river, as runoff from irrigated lands. The study emphasizes the development of a finer observational network for water quality, along with stringent monitoring of the disposal of contaminants in the rivers and groundwater.
Deterioration of water quality is a major problem in both developed and developing countries. The quality of water is currently worsening globally due to widespread economic development, changes in demographics, and climate change. About 2 billion people, who constitutes 26% of the world’s population, lack access to safe drinking water (UNEP, 2021). Although water quality assessments have been carried out globally, the data representing the actual scenario of freshwater quality are still scarce, thus putting 3 billion people globally at risk (UNEP, 2021). Hence, the protection of freshwater resources has gained importance, and the UN has also emphasized this in its sustainable development goals (SDGs), where SDG 6 aims to provide clean water and sanitation to the world’s population. After the advent of COVID-19, water quality issues have been addressed at the forefront globally. Most of countries are falling behind the target of achieving sustainable water management by 2030 (UN water 2021). The challenges faced by developing countries are more severe, since they face greater risks to ecological and human health, mostly due to lack of access to clean water. Recent studies state the increase of salinity in rivers, especially in Asia has worsened since 2010, indicating the risk to humans who consume polluted water (Gupta and Deshpande, 2004; United Nations Environment Programme, 2016). In addition, South Asian countries are the predominant users of groundwater in the world, where groundwater contamination is a major threat, especially in developing countries such as India. In India, the piped water supply is not provided in most of the rural regions, where it is assumed that the groundwater is safe for consumption. The Dependence on groundwater is high in the country, especially in southern India, due to limited surface water resources, non-perennial rivers, and frequent failure of monsoonal rains. About 70% of the freshwater systems are contaminated in India (Aayog, 2019), where 600 million people face high to extreme water stress. The gross domestic product (GDP) of the country has been reduced by one-third due to environmental degradation, leading to an annual loss of $80 billion (World bank 2019). In addition, the data systems related to the water of India are limited in their coverage, robustness, and efficiency.
Hence, the constant monitoring of surface water and groundwater quality is of prime importance. However, studies worldwide have assessed groundwater quality and surface water quality separately, although surface water and groundwater are interconnected. In the case of shallow aquifers, the groundwater is contaminated due to the percolation of contaminated surface water, which can be vice versa as well. Hence, surface water and groundwater need to be considered a single entity in most cases, emphasizing the need for conducting an integrated assessment of the quality of both river water and groundwater. This is critical for the sustainable and efficient management of water resources of river basins. Very few studies have assessed the interaction of surface water and groundwater and its effect on water quality (Brindha et al., 2014; Zhang et al., 2016; Zhu et al., 2019; Johnstone et al., 2022; Khan et al., 2019; Khan and Wen, 2021). Such surface water and groundwater interactions holds much significance in non-perennial rivers since they possess peculiar hydrology. The changing times between flow and non-flow periods will have a greater effect on the surface water and groundwater interactions and, subsequently, on the water quality. This aspect of the impact of water quality during the flow/non-flow periods in non-perennial rivers has not yet been studied in detail.
The Cauvery river, is a major non-perennial river of Southern India covering three states of the Country. The river branches into several distributaries, forming a delta at the lower part, and empties into the Bay of Bengal. The distributaries along with the main river Cauvery are have been the major source of water for both irrigation and domestic uses for the population residing in the Cauvery deltaic zone. The lower part of the Cauvery river is one of the significant hubs for rice production in India, which has been recently categorized as a protected special agricultural zone by the State Government of Tamil Nadu. Despite large-scale utilization of the river basin for irrigation and drinking purposes, poor water management practices along with unplanned urbanization and industrialization have deteriorated the water quality predominantly, especially in the lower part of the basin. Most of the water quality studies in the lower Cauvery Basin are mostly confined to groundwater. The quality of groundwater in few regions of the Cauvery delta regions were assessed for domestic and irrigation uses by various researchers (Rengaraj et al., 1998; Vetrimurugan and Elango, 2007; Nagarajan et al., 2010; Vetrimurugan et al., 2013; Gnanachandrasamy et al., 2015; Sivakumar et al., 2017). In addition to this, the assessment of groundwater pollution due to heavy metals was also studied (Vetrimurugan et al., 2017; TamilMani and Venkatesan, 2021). Multivariate statistical analysis was also used by a few researchers to decipher the contamination of groundwater in the lower Cauvery basin (Solaraj et al., 2010; Lalitha et al., 2021). However, studies pertaining to river water quality in the lower part of the basin are limited. RamyaPriya and Elango (2018) and RamyaPriya and Elango (2021) studied both groundwater and river water quality and its dissolved load; where they have studied only on the main stretch of the Cauvery river, indicating poor quality of water in the delta part of the river. Sharma and Ravichandran et al. (2021) studied river water quality in a smaller areal extent of the basin. However, most of the existing studies have neglected the river water quality of the distributaries present in the lower Cauvery basin. All the distributaries of Cauvery river are non-perennial, where the flow in these distributaries is mainly due to regulated flows from the upper catchment. Also, the effect of seasonal variation on the quality of river water and its adjoining groundwater has also not yet been studied. Hence, the present study was carried out to understand the factors controlling hydrogeochemistry and also to evaluate the quality of surface water and its adjoining groundwater in the lower part of the Cauvery Basin.
The Cauvery river, one of the most important non-perennial rivers of southern India, has a basin area of 81,555 km2 and flows along a length of 800 km. It originates from the Brahmagiri hill ranges of the Western Ghats at Thalakaveri at an elevation of about 1,341 m and drains into the Bay of Bengal, forming a delta. The Cauvery delta forms the lower part of the Cauvery river system, which falls under the state of Tamil Nadu and has complex water issues. The mean temperature of the lower part of the basin is between 26°C and 30°C. April is generally the hottest month of the year with a mean monthly maximum temperature of 34.31°C (CWC, 2014). The main climatic feature in the lower region of the Cauvery river basin is the monsoon rain. The northeast monsoon provides the greater portion of annual precipitation; with the average annual rainfall of about 1,000 mm. The delta region receives greater rainfall during October, November, and December in the coastal districts, while further inland, the peak monthly rainfall is during early October (Supplementary Figure S3). Since the upper part of the basin receives rainfall during the southeast monsoon, the lower part of the Cauvery basin has river flow only from June to January and remains dry during the remaining periods (CWC, 2014). The Cauvery delta is river-dominated and is occupied by several of its distributaries. At Tiruchirappalli, three medium-sized reservoirs are in operation, of which the Upper Anicut reservoir is in the upstream of the urban region, while the Grand Anicut and Anaikarai are located downstream. The northern branch of the river is called the Kollidam, while the southern branch retains the name Cauvery and then flows directly eastward into Thanjavur District. From Thanjavur, the river splits and flows to a few places in the Cauvery delta Central groundwater board (CGWB, 2020). Some of the important distributaries of Cauvery forming the delta are Nandalar, Vanjiyar, Vettar, Kudamurutti, Vennai, Vennar, Pamani, Nanilam, and Thirumalarajanar (Figure 1). The present delta has developed a triangular pattern with three distinct morphological areas consisting of a marginal denudational unit, a central fluvial–marine depositional unit, and a coastal marine depositional unit (Babu, 1991). Geologically, the lower basin of the Cauvery river chiefly comprises of Quaternary alluvium; along with exposures of Cretaceous sediments (Uttatur, Ariyallur, and Tiruchirapalli formations) and sandstone (Cuddalore Formation) of the Mio-Pliocene age (Supplementary Figure S2). The Quaternary sediments are fluvial sediments, middle Holocene beach ridges, and late Holocene dune sands (Kunz et al., 2010). Also, the rock formations of Precambrian crystalline to Quaternary sediments exist in Cauvery delta. In the Quaternary alluvial sediments, there are both shallow (unconfined) and deep aquifers (semi-confined). The Cauvery delta region is underlain by different aquifers, namely, Archean, Cretaceous, Eocene, Miocene, and Quaternary alluvial aquifers Ministry of Water Resources (2012). The study area is an intensively irrigated region, where most of the area is covered by agricultural lands and lakes. The delta area is the most fertile tract in the basin. The main crops grown in the study region are paddy, pulses, groundnut, cotton, sugarcane, coconut, and vegetables. Principal soil types found in the basin are black soils, red soils, laterites, alluvial soils, forest soils, and mixed soils. Alluvial soils are commonly found in the delta areas. The lower Cauvery basin is also known for its hydrocarbon prospects, and the deltaic region has potential aquifer systems, particularly along the paleochannels and levee deposits (Das, 1991).
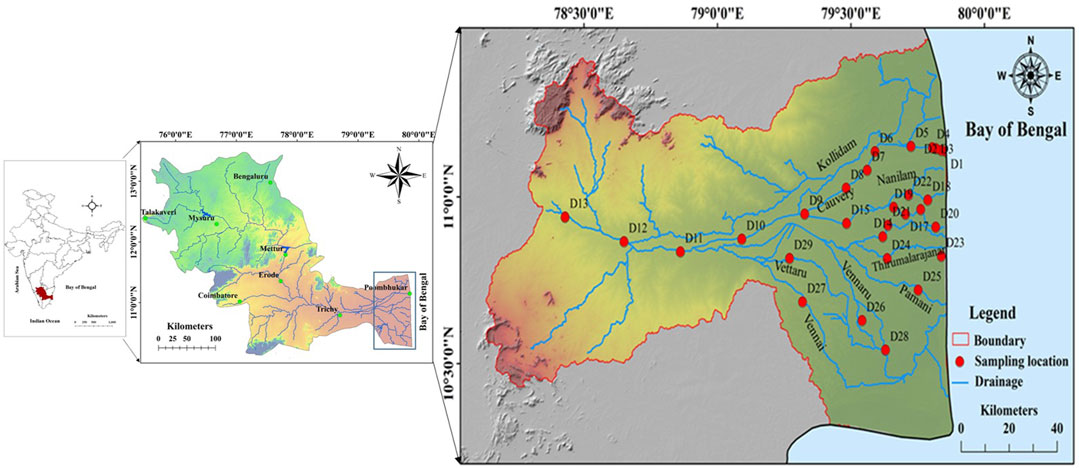
FIGURE 1. Study area with monitoring locations.
Initially, a preliminary field survey was carried out in the study area to select representative river water and adjacent groundwater locations. The sampling locations were chosen in all the distributaries to assess the river water and groundwater quality of the entire lower Cauvery river basin. Care was taken in selecting locations not close to the outfalls of industries and sewage treatment plants to avoid anthropogenic inputs. Electrical conductivity (EC) of river water and groundwater was measured in these locations using a multiparameter probe (Eureka Sub Manta). Based on this initial survey, 29 sampling locations were chosen for regular monitoring, as shown in Figure 1. The groundwater locations were selected in such a way that the distance between river water and the groundwater sampling location was not more than 500 m. The river water and groundwater samples were collected three times a year to understand the impact of seasonal variation. The sampling period was ascertained based on the monsoon conditions of the basin. The Cauvery basin receives rainfall during both northeast monsoon and southeast monsoon, and hence, the period from June to January is considered to be the wet season, while the period from February to May is considered the dry season. The samples were collected once in four months from May 2018 to August 2019. Also, samples of municipal wastewater, sea water and water from agricultural land were collected to identify the potential sources that influences the water quality of this region. The flow chart outlines the steps for analyzing the geochemistry of river water, including measuring physical properties, major ions, trace elements and nutrients (Supplementary Figure S1). The samples were collected in cleaned polythene bottles (250-mL capacity) and were properly labeled. The water samples were filtered using 0.45-μm nylon filter paper using a vacuum hand pump (MV 8000) in the field itself to remove suspended dirt particles. The samples for trace elements were acidified with concentrated nitric acid (HNO3), and nutrient samples were acidified with concentrated sulfuric acid (H2SO4). The water samples were collected, and parameters such as EC and pH were measured immediately after collection in the field itself using a multiparameter probe (Eureka Sub Manta). The concentrations of bicarbonate (HCO3) and carbonate (CO3) were also determined in the field using a titration kit (Aquamerck 1.11109), which is based on the volumetric principle.
The chemical composition of river water and groundwater was assessed for both drinking and irrigational uses, and hence, major ions (Na, Ca, K, Mg, Cl, SO4, CO3, and HCO3) were considered in the study. Along with these, nutrients (NO3 and PO4) and a few essential and non-essential trace elements (F, Fe, Pb, Cu, Cd, Zn, F, and U) were also considered for the study. The lower Cauvery basin has several urban cities, while the region is also intensively irrigated. Hence, these elements were chosen to understand the effect of anthropogenic and geogenic contamination in both river water and groundwater. Sodium (Na), calcium (Ca), magnesium (Mg), potassium (K), chloride (Cl), sulfate (SO4), and nitrate (NO3) were analyzed by ion chromatography (Metrohm 863). Ion chromatography is a method for separating ions based on their interactions with resin (stationary phase) and the eluent (mobile phase). These phases differ between an anion column, which attracts anions, and a cation column, which attracts cations. Phosphate (PO4) was estimated by the ascorbic acid method American public health association (APHA 1992) using a UV–VIS spectrophotometer (Systronics 119). Lead (Pb), copper (Cu), zinc (Zn), and cadmium (Cd) were analyzed using a trace metal analyzer by the voltammetric method (Metrohm 797 VA Computrace). Iron (Fe) was analyzed by AAS (GBC 932), and uranium (U) was analyzed using an LED fluorimeter (LF 2a Quantalase). This method measures the fluorescence of the uranium complex in the water sample by excitation under ultraviolet light, and fluoride (F) was analyzed using a pen-type handheld fluoride probe (Extech FL700). To ensure analytical precision, standards and blanks were run in between. The ion balance error was computed for the samples, which were below ±10%.
Multivariate statistical methods in water quality analysis were utilized to identify the relationship between physical and chemical parameters, which suggests the sources that influences the water quality. IBM Statistical Package for the Social Sciences (SPSS) version 21 was used for performing the statistical analysis in this study. The bivariate correlation coefficient matrix and principal component analysis (PCA) extraction method were used in the study. Pearson’s correlation coefficient method with p < 0.05 was considered. The PCA was performed using Kaiser’s varimax rotation principle, where the components having eigenvalue greater than 1 were taken into consideration.
The analytical results have been evaluated to assess the suitability of river water and groundwater for drinking and agricultural uses. The summary of the analytical results for all the parameters of both river water and groundwater samples is shown in Table 1.
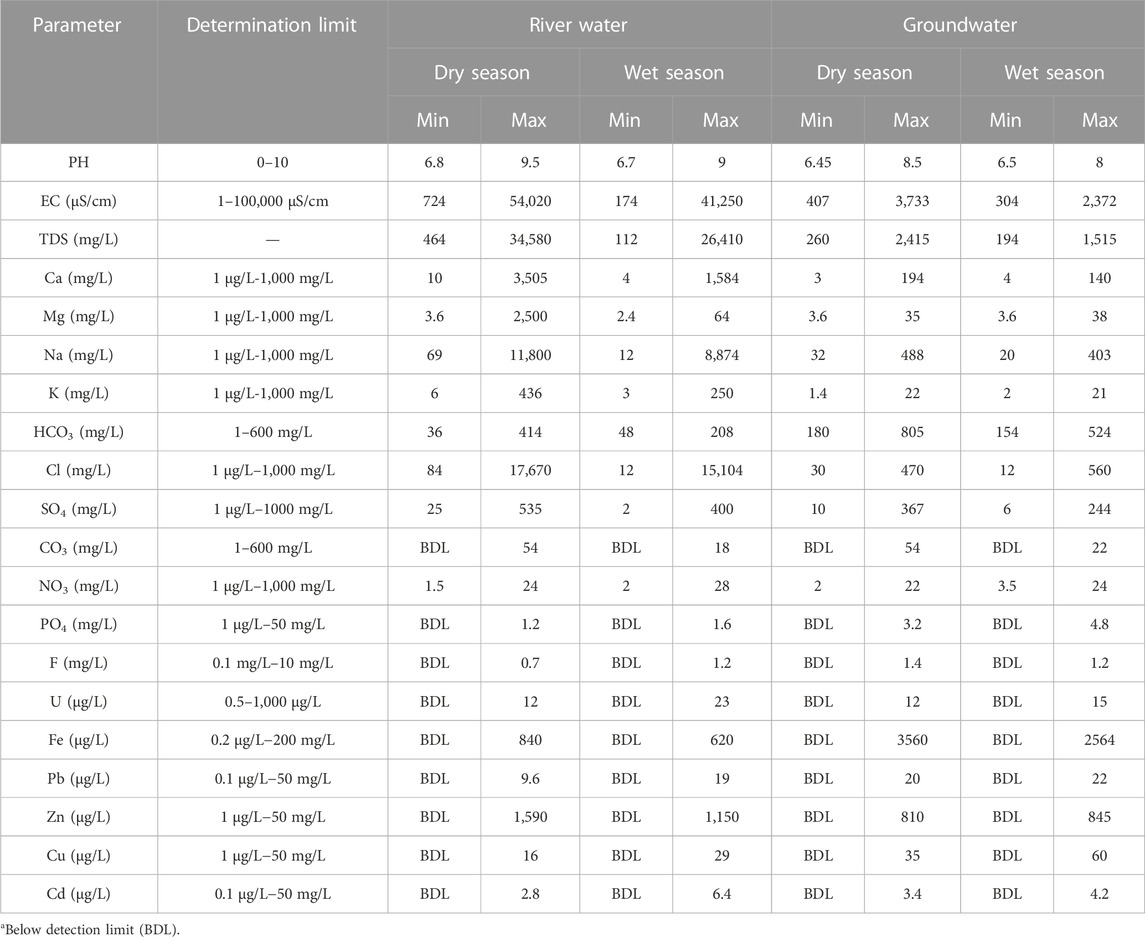
TABLE 1. Summary of physico-chemical parameters of river water and groundwater.
pH is an important parameter in water quality which evaluates the acid–base balance of water. The pH of both river water and groundwater was found to be slightly acidic to alkaline. The pH of the river water of a few locations (D3, D5, and D12) was found to exceed the permissible limit of 8.5 Bureau of Indian standards (BIS, 2012). EC is an approximate index of the total content of the dissolved substance in water. The EC in both river water and groundwater was found to be higher during dry seasons than that during wet seasons. Spatially, the EC in river water was found to be very high in locations near the sea (D1, D2, D18, D20, and D23), and for groundwater, it was higher in locations D1, D16, D18, D20, D21, D23, and D25.
In natural waters, dissolved solids consist mainly of inorganic salts such as carbonates, bicarbonates, chloride, sulfate, phosphate, calcium, magnesium, sodium, potassium, and iron and a small amount of organic matter and dissolved gases (Singh et al., 2015). The total dissolved solids (TDS) were calculated using measured EC values, TDS (mg/l) = EC (μS/cm) x 0.64 (Lloyd and Heathcote, 1985). According to the World Health Organization’s specification, WHO (2017) specification, TDS up to 500 mg/L is desirable while 1,500 mg/L is the maximum permissible limit. The river water was found to exceed the permissible limits in a few locations (D1, D2, D3, D5, D18, D20, and D23) during both seasons, while in groundwater, TDS exceeded the permissible limits in a few locations during both wet (D1, D16, D18, and D20) and dry seasons (D1, D16, D18, D20, D21, D23, and D25). According to Freeze and Cherry’s (Figure 2) classification of river water and groundwater based on TDS, the river water in D1 comes under the saline category, where the location is very close to the sea. In addition, few river water and groundwater samples were found to be of the brackish category, while the rest of the samples were of the freshwater type.

FIGURE 2. Relationship between TDS and TH.
The hardness of the water is due to the presence of alkaline earth metals such as calcium and magnesium. TH was estimated using the following equation (Todd, 1959):
According to Sawyer and McCarty (1967), the river water at a few locations (D1, D2, D3, D18, and D20) was of very hard type, while few samples were categorized under the moderately hard-to-hard type, and the rest of the samples were soft. The groundwater samples were mostly of the moderately hard-to-hard water type, and the rest of the samples were soft (Figure 2).
The major ion chemistry of river water and groundwater has been compared with BIS (2012) and WHO (2017) limits to evaluate the suitability of water for drinking. Groundwater typically contains high concentrations of dissolved ions than surface waters, especially in areas with an abundance of sodium mineral deposits or in areas with sea or estuarine water intrusions (WHO, 1979). The concentration of Na exceeds the limits of 200 mg/L (WHO, 2017) in most of the locations both in river and groundwater (D1, D2, D16, D18, and D20). The potassium concentration in natural waters may be derived from fertilizers, although evaporation is likely to be responsible for the higher concentrations. Dissolution of potassium-bearing minerals and ion exchange reactions are also the major causes for potassium concentration in waters. The concentrations of potassium are often low, except at locations D1, D2 D3, D18, and D20 in river water during both seasons, whereas in groundwater, the concentration exceeds in the locations D1, D2, D3, D18, and D20 during both the seasons. Magnesium and calcium, which occur naturally in water, are among the most highly available alkali metals in the environment (Grochowska and Tandyrak, 2009). Magnesium and calcium concentrations in groundwater and surface water are due to the weathering process and mineral dissolution (Galczyńska et al., 2013; RamyaPriya and Elango, 2018). The concentration of magnesium and calcium in river water and groundwater was found to be below the permissible limit of 100 mg/L and 200 mg/L (BIS, 2012), respectively, except in few locations, namely, D1, D2, D3, and D18, during both seasons.
The concentration of chloride in river water exceeds the permissible limit of 1,000 mg/L (BIS, 2012) in some of the locations, which are mostly near the coast, whereas the chloride concentration in groundwater was found to be within the permissible limits. The concentration is high in river water, probably due to agricultural runoff and effluent discharge from urban regions. Alkalinity is a measure of the buffering capacity of stream water. River water with relatively high alkalinities has a greater ability to neutralize acidic pollution from rainfall or wastewater. The concentration of alkalinity in river water exceeds the permissible limit of 600 mg/L (BIS, 2012) in a few locations (D1, D2, D3, and D18), while in groundwater, the concentration of alkalinity is higher in few locations (D1, D2, D3, D18, and D20). Sulfate is commonly present in natural waters, where the main source could be due to rock dissolution, biochemical action of anaerobic bacteria, and anthropogenic activities. The concentration of sulfate in river water was found to exceed the permissible limit of 200 mg/L (BIS, 2012) in a few locations (D1, D2, and D3) during both dry and wet seasons, while in groundwater, it was found to be within the permissible limit during both the seasons except at location D18. The concentration of NO3 was found to be within the permissible limit of 45 mg/L (BIS, 2012) in both river water and groundwater during both seasons. Nitrate can occur in both river water and groundwater due to anthropogenic activities such as runoff from agricultural farmlands, wastewater treatment discharge, and oxidation of nitrogenous waste products in human and animal excreta, including septic tanks.
The trace elements in river water and groundwater occur due to natural factors such as weathering of rocks, erosion, and dissolution of water-soluble salts. Human activities such as mining, urban runoff, industrial emissions, and agricultural activities can also contribute trace elements to the surface and groundwater. Trace elements such as Fe, Cu, Zn, Pb, Cd, and U are very important for the proper functioning of the biological system, and their deficiency or excess in the human system can lead to several disorders. Iron in natural waters could be from geogenic or natural deposits, industrial wastes, refinement of iron ores, or corrosion of metals. Although normal amounts of iron are essential, a higher concentration affects the human system and also the quality of water. The concentration of Fe in river water (Figure 3A) exceeds the prescribed limit of 0.3 mg/L (BIS, 2012) in a few locations (D1, D2, D3, D18, and D20) during the wet season, while in the dry season, most of the locations were found to be within the limit except for D3 and D18. The concentration of Fe in groundwater was found to be within the permissible limit in most of the locations except D3 and D18 during both seasons. The Cadmium concentrations in unpolluted natural waters are usually found below 1 μg/L (Friberg et al., 1986). Excess amounts of cadmium in natural water could be due to anthropogenic activities such as impurities in the galvanized pipes or solders in fittings, water heaters, water coolers, or taps. The concentration of cadmium in river water (Figure 3C) in locations D8 and D14 and locations D3, D12, D24, and D26 exceeds the permissible limit of 0.003 mg/L (BIS, 2012) during the dry season and wet season, respectively. Few locations (D3, D12, D24, and D26) exceed the permissible limit of Cd in groundwater during both seasons. Lead is a toxic metal, and continuous consumption causes human health hazards, where its common sources in drinking water could be due to leachate of e-wastes such as old batteries, hazardous waste, or lead water pipes. The concentration of lead exceeds the permissible limit of 0.01 mg/L (BIS, 2012) in most of the locations in the river water (Figure 3B) during the wet season compared to the dry season. In groundwater, the concentration exceeds in a few locations (D1, D3, D6, D10, D12, and D14) during both seasons. Uranium, a commonly occurring radiogenic contaminant in natural water, was found to be within the permissible limit under both WHO and United States Environmental Protection Agency (USEPA) guidelines of 15 ppb and 30 ppb, respectively. The concentration of fluoride was found to be within the permissible limit of 1.5 mg/L (BIS, 2012) in both river water and groundwater during both seasons. Phosphate is one of the key elements necessary for the growth of plants and animals. A higher amount of phosphate could cause eutrophication in water bodies, thus resulting in a reduction of dissolved oxygen and an increase in mineral and organic nutrients. Phosphate could be present in natural water due to the leaching of pipes, sewage, organic manure, and fertilizer runoff. This region consists of intensively cultivated agricultural lands, and hence, the concentration of phosphate appeared to be the maximum in most of the locations in both river water and groundwater (Figure 3D).
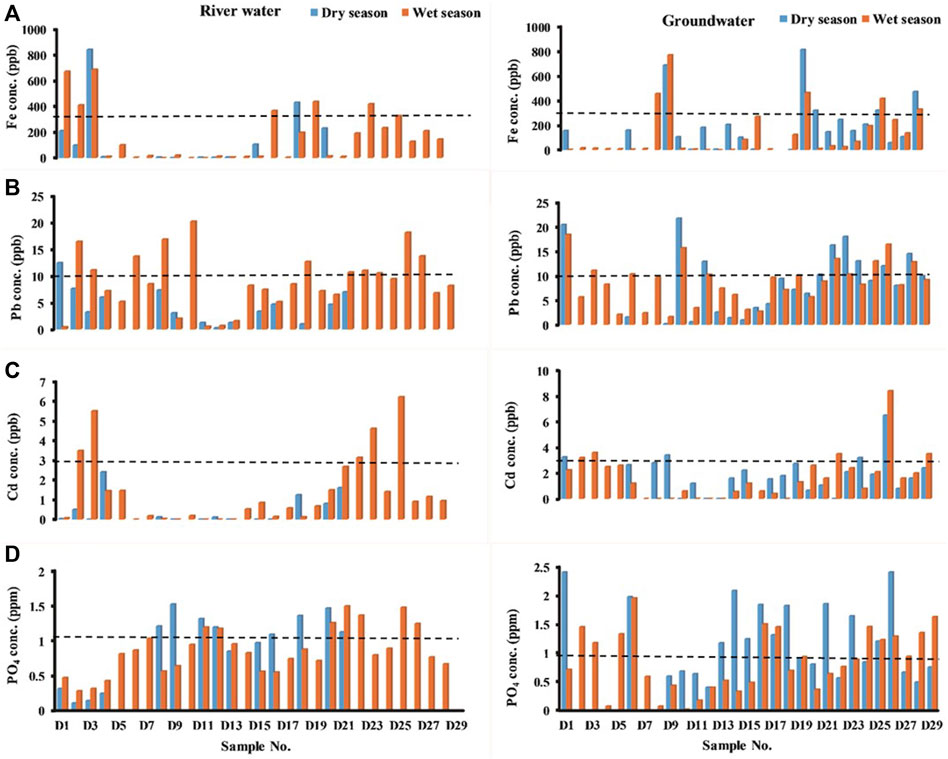
FIGURE 3. Trace elements measured in river water and groundwater: (A) Fe, (B) Pb, (C) Cd, and (D) PO4.
The Water Quality Index (WQI) is an effectual tool to provide a single numerical value for the comprehensive water quality data to better understand water quality. The WQI compares the various water quality parameters concerning a particular standard. The Canadian Council of Ministers of the Environment (CCME) WQI is one such method, where all parameters are mathematically represented in such a way that they contribute adequately to the final number of the index. The index model is flexible and includes three essential measures of variance (scope, frequency, and amplitude). These three measures of variance combine to produce a value between 0 and 100 that represents the overall water quality.
The detailed formulation of the WQI, as described in the Canadian WQI Technical report (CCME, 2001), is as follows:
where F1 (scope) represents the extent of water quality guideline non-compliance over the time period of interest.
F2 (frequency) represents the percentage of individual tests that do not meet the objectives (failed tests).
F3 (amplitude) represents the amount by which failed test values do not meet their objectives. F3 is calculated in three steps.
Step 1: Calculation of excursion
The excursion is the number of times an individual concentration is greater than the objective when the objective under consideration is maximum. In this case, the excursion is calculated as
If it is less than the objective, excursion in this case is given as
Step 2: Estimation of the normalized sum of excursions.
The normalized sum of excursions (nse) represents the collective amount by which individual tests are out of compliance. It is defined as follows:
Step 3: Estimation of F3 (amplitude).
F3 (amplitude) is calculated by an asymptotic function that scales the normalized sum of the excursions from the objectives to yield a range of values from 0 to 100.
The CCME WQI was calculated for parameters such as major and minor ions, and nutrients so that the suitability of water quality can be understood well. The BIS (2012) and WHO (2017) guidelines were used for the analyzed water quality parameters, and the results were classified based on the CCME (2001) guidelines. The results indicated that a few river water samples were found to be unsuitable for drinking purposes during both the wet and dry seasons (Figures 4A, B). About 10 groundwater samples (Figures 4C, D) were found to be unsuitable according to the CCME index. Both river water and groundwater were found to be unsuitable at locations near the coast and irrigated lands. Temporally, it was found that both river water and groundwater were unsuitable during dry seasons compared with the wet periods. This is because the flow in the river influences the quality of both river water and groundwater, where the river water recharges the groundwater during flow periods.
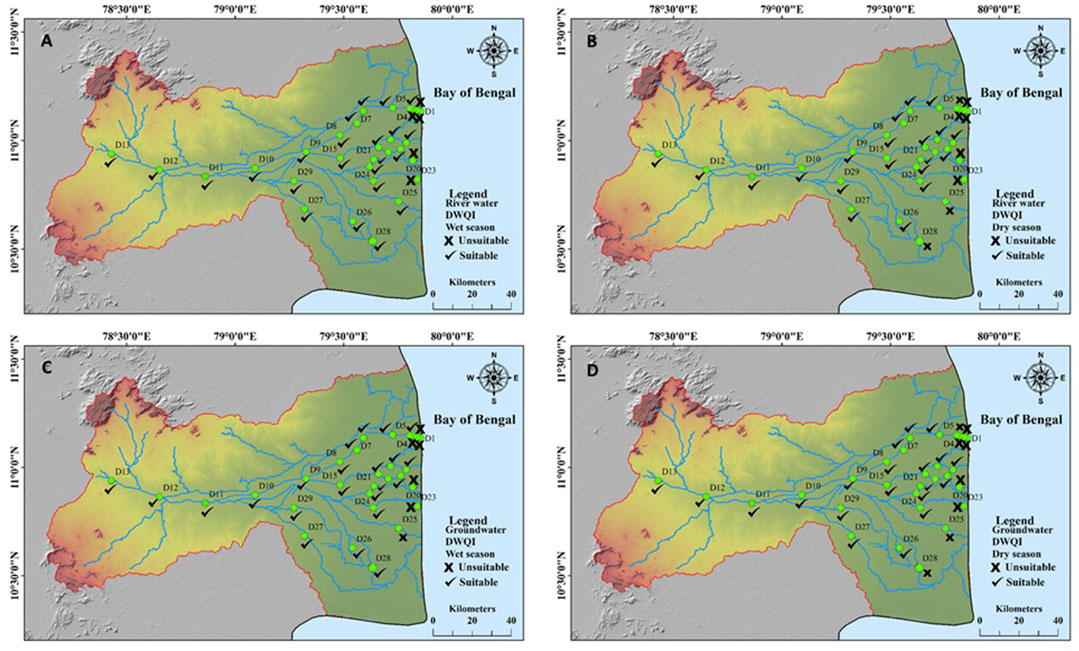
FIGURE 4. Drinking water quality index: (A) river water—wet season. (B) River water—dry season. (C) Groundwater—wet season. (D) Groundwater—dry season.
The lower basin of Cauvery is one of the most intensively irrigated regions in the country. The quality of water for irrigation was assessed using various parameters such as TDS, trace elements, SAR (sodium absorption ratio), RSC (residual sodium carbonate), MH (magnesium hazard), and KR (Kelly’s ratio).
As per the Food and Agriculture Organization Food and agriculture organization (FAO 1994) guidelines, the usual range of TDS for irrigation water is below 2,000 mg/L. The river water at sampling locations D1, D2, D3, D16, D18, and D20 exceeds the permissible limits during the dry season, whereas during the wet season, few sampling locations (D1, D2, D3, and D20) exceed the permissible limit. The groundwater at sampling locations D1, D16, D18, D20, D23, and D25 exceeds the permissible limit during both seasons (Table 2).
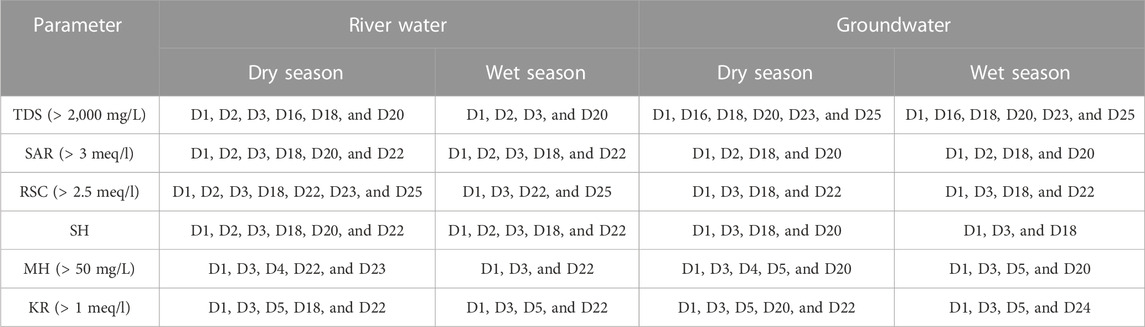
TABLE 2. Irrigation water quality unsuitable locations.
The water used for irrigation when containing large amounts of sodium is of special concern due to sodium’s effects on the soil and poses a sodium hazard. Sodium hazard is usually expressed as the sodium absorption ratio (SAR). A SAR value below 3.0 meq/L is considered safe for irrigation. In river water and groundwater, few locations fell under the S4 category during both seasons and are unsuitable for irrigational uses (Figures 5A, B). It was observed that the unsuitability of samples was higher in the dry season than in the wet period. Also, the quality of river water samples was influenced by agricultural runoff, wastewater, and also seawater, while in groundwater, the influence of agricultural runoff and wastewater was predominant in a few unsuitable samples, and the rest of the samples were within the limit (<3 meq/l) prescribed by the FAO (1994).
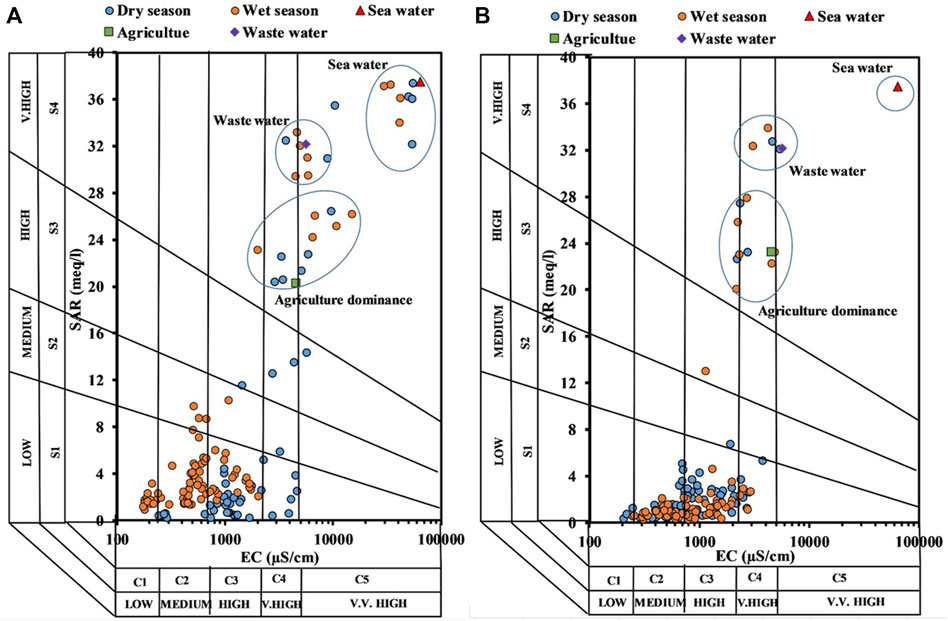
FIGURE 5. Sodium absorption ratio: (A) river water and (B) groundwater.
The concept of the RSC is important for determining the high carbonate amount in water, and it is used to predict the additional sodium hazard. RSC is another alternative measure of sodium content with calcium and magnesium. The water with a high RSC amount has high pH. Therefore, land irrigated with such water becomes infertile, owing to the deposition of sodium carbonate. The RSC can be calculated by using the formula given by Eaton (1950):
where all concentrations are in meq/l.
According to the US Salinity Laboratory, an RSC value of less than 1.25 meq/l is safe for irrigation. A value between 1.25 and 2.5 meq/l is of marginal quality, and a value more than 2.5 meq/l is unsuitable for irrigation. The categorization based on RSC is given in Table 2.
Water containing large amounts of sodium has negative effects on the soil and poses a sodium hazard. Excess sodium in water produces the undesirable effects of changing soil properties and reducing soil permeability. The sodium percentage is given by the following equation (Wilcox, 1955):
The Wilcox (1955) equation shows the relationship between sodium percentage and electrical conductivity for river water and groundwater samples. Figure 6A shows that locations D1, D2, D3, D18, D20, and D22 in the dry season and D1, D2, D3, and D18 in the wet season are unsuitable for irrigational uses. For groundwater (Figure 6B), the sample locations D1, D2, D18, and D20 were unsuitable during both seasons. As observed in the SAR plot, the anthropogenic influences in river water were from agricultural runoff, wastewater, and backwater effects, while for groundwater, the influence of seawater intrusion was negligible.
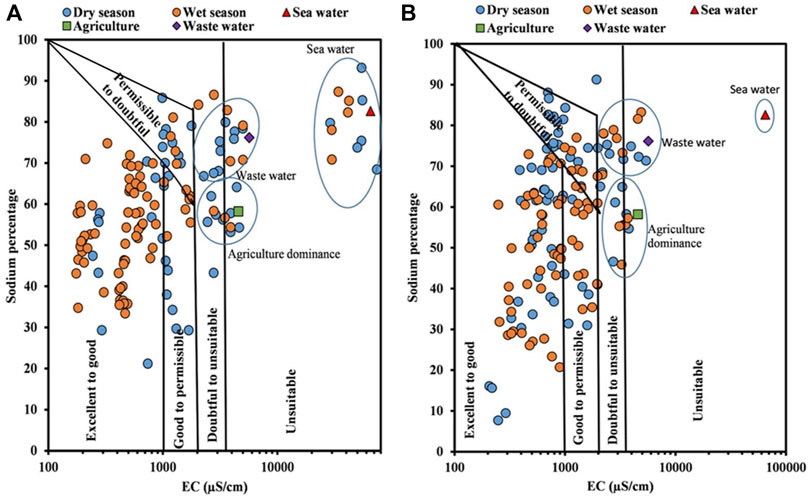
FIGURE 6. Suitability of irrigation water based on the Wilcox plot: (A) river water and (B) groundwater.
Generally, calcium and magnesium maintain a state of equilibrium in most waters. A higher amount of magnesium in water will adversely affect crop yields as the soils become more saline (Joshi and Rao, 2009). A ratio, i.e., the index of magnesium hazard, was developed by Paliwal and Gandhi (1976) as shown as follows:
According to this, a high magnesium hazard value (>50%) has an adverse effect on crop yield as the soil becomes more alkaline. The magnesium content in river water and groundwater samples was classified, as shown in Table 2, where most of the samples were found to be unsuitable.
Water having a KR value of less than 1 is considered to be good for irrigation, whereas water with KR values greater than 1 is not suitable. Kelly’s ratio is calculated by using the following formula (Kelly, 1957):
The river water and groundwater samples are classified based on the KR (Table 2), which indicates that a few samples of both river water and groundwater are not suitable for irrigation.
Trace elements in small quantities are essential for plant growth. However, excessive quantities will cause undesirable accumulations in plant tissue and growth reductions (Ayers and Westcot, 1994). Zinc is an important micronutrient element for the growth and development of plants. The maximum concentration of Zn in both river water and groundwater is 1.6 ppm, which is well within the permissible limit of 2.5 mg/L prescribed by the FAO (1994). Concentrations of iron as low as 0.15–0.22 ppm are considered a potential hazard to drip irrigation systems (Ford, 1982). Irrigation water with iron levels above 0.1 ppm may cause clogging of drip irrigation emitters, and iron levels above 0.3 ppm may lead to iron rust stains and discoloration on foliage plants in overhead irrigation applications. During the wet season the concentration of Fe in river water at a few locations (D1, D2, D3, D18, and D20) are greater than 0.3 ppm, whereas in the dry season, most of the locations were found to be within the limit except for two locations (D3 and D18). The concentration of Fe in groundwater was found to be within the permissible limit in most of the locations except D3 and D18 during both seasons.
The irrigation water quality was assessed based on the TDS, SAR, RSC, MH, and KR, as well as trace elements. The results indicated that the river water samples (Figures 7A, B) that are located near the coastal regions (D1, D2, D3, D18, and D23) were found to be unsuitable for irrigational purposes. Most of the groundwater samples (Figures 7C, D) collected near the coast and agricultural areas were found to be unsuitable. The representative samples of agricultural dominance, wastewater, and seawater, as shown in the SAR (Figure 5) and Wilcox (Figure 6) plot, indicate that few samples of groundwater are influenced by anthropogenic activities such as agricultural runoff and wastewater, while a few samples in river water were affected due to agricultural and wastewater and effluent runoff along with seawater intrusion due to backwater effects.
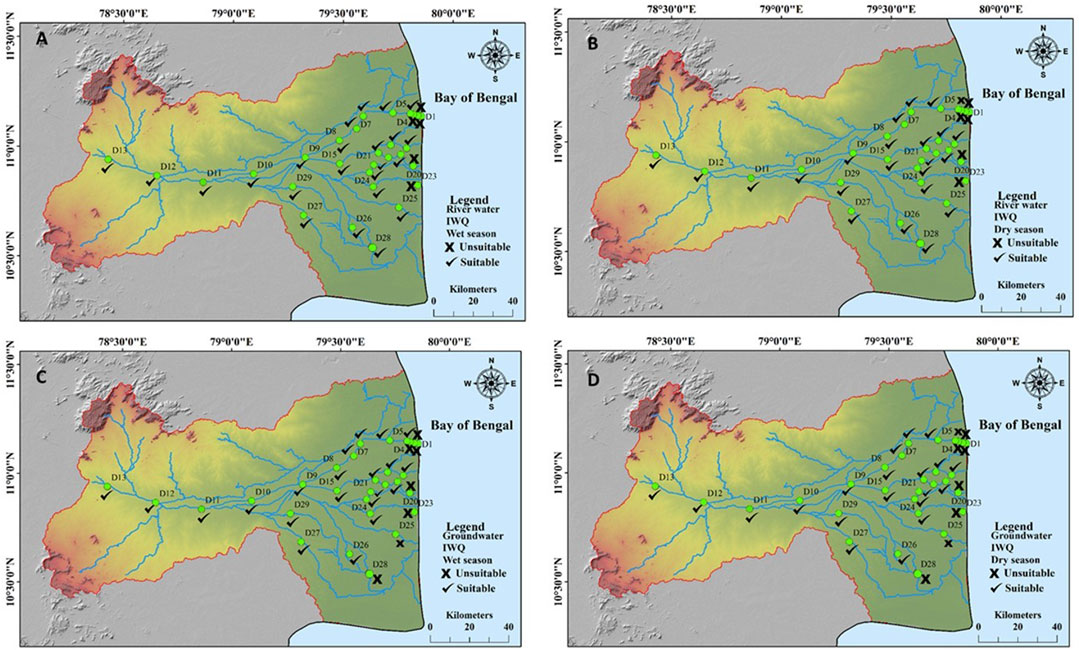
FIGURE 7. Irrigation water quality index for (A) river water—wet season. (B) River water—dry season. (C) Groundwater—wet season. (D) Groundwater—dry season.
Generally, water quality is influenced by geogenic factors such as lithology and soil type; anthropogenic activities such as urban runoff, discharge of sewage, effluents, and agricultural runoff; and climate factors, such as precipitation and temperature, in addition to other factors. The Pearson correlation analysis was used to study the relationship of major, minor, and trace elements and to understand the factors affecting the quality of river water and groundwater. The correlation matrix with a positive correlation of HCO3 with Ca (r2 = 0.832), Mg (r2 = 0.553), and Na (r2 = 0.777) was observed during the wet and dry seasons (Supplementary Tables S1, S2). The HCO3 ions correlated with Ca (r2 = 0.613), Mg (r2 = 0.563), Na (r2 = 0.656), and Cl (r2 = 0.596) can be observed both in river water and ground water (Supplementary Tables S3, S4). This indicates that weathering of minerals is one of the major contributors of ions to surface water and groundwater. The weathering of silicate minerals from hard rocks such as quartz, plagioclase feldspar, pyroxenite, and mica could have contributed these ions to water. In river water, the correlation was observed between NO3 and PO4 (r2 = 0.533) in both seasons, whereas in groundwater, the correlation of PO4 (r2 = 0.480) indicates the contamination from agricultural runoff, where NPK fertilizers are extensively used. A moderate correlation was observed between Zn with Cu (r2 = 0.457) and Cd (r2 = 0.481) during the wet season, and Zn with Cu (r2 = 0.478), Cd (r2 = 0.434), and Cd with Pb (r2 = 0.480) was observed during the dry season in river water. In groundwater, the relationship between Fe with Cu (r2 = 0.664) and Zn with Cu (r2 = 0.446) during both seasons indicates that they could have evolved from municipal sewage, industrial effluents, runoff containing fertilizer inputs from agricultural fields, and leaching from galvanized pipes. This indicates that anthropogenic activities influences the water chemistry of river water and groundwater. The mobility of Zn increases in water with high carbonate concentration, influencing the formation of hydrogen carbonates in water (Namieśnik and Rabajczyk, 2010).
The selected geochemical parameters are considered variables for principal component analysis (Figure 8) during both dry and wet seasons. Three principal components (PCs) have been extracted based on an eigenvalue greater than one. The factors account for a total variance of PC1 of 37.68% during the dry season and 31% during wet seasons in river water, whereas in groundwater, PC1 of 35.51% during the dry season and 32.16% during the wet season can be observed. PC1 has a strong positive load of Ca, Mg, Na, K, and HCO3. This factor possesses the influence of geogenic inputs and also the effect of mineral dissolution in the study area. PC2 consists of 18.05% in river water during the dry season and 16.27% during the wet season. In groundwater, 12.08% during the dry season and 10.38% in the wet season can be observed with a positive load of Na, Cl, Cu, Fe, Zn, NO3, PO4, and Pb. This factor suggests the influence of agricultural inputs, fertilizer runoff, and corrosion of metals. PC3 constitutes 12.68% during the dry season and 9.07% during the wet season in river water; while in groundwater, 9.37% in the dry season and 7.78% in the wet season of the total variance, consisting of positive loading of F, U, Cd, NO3, and PO4, can be observed. This factor indicates that the concentration was attributed due to anthropogenic inputs, agricultural and urban land pollution, and corrosion of underground pipes.
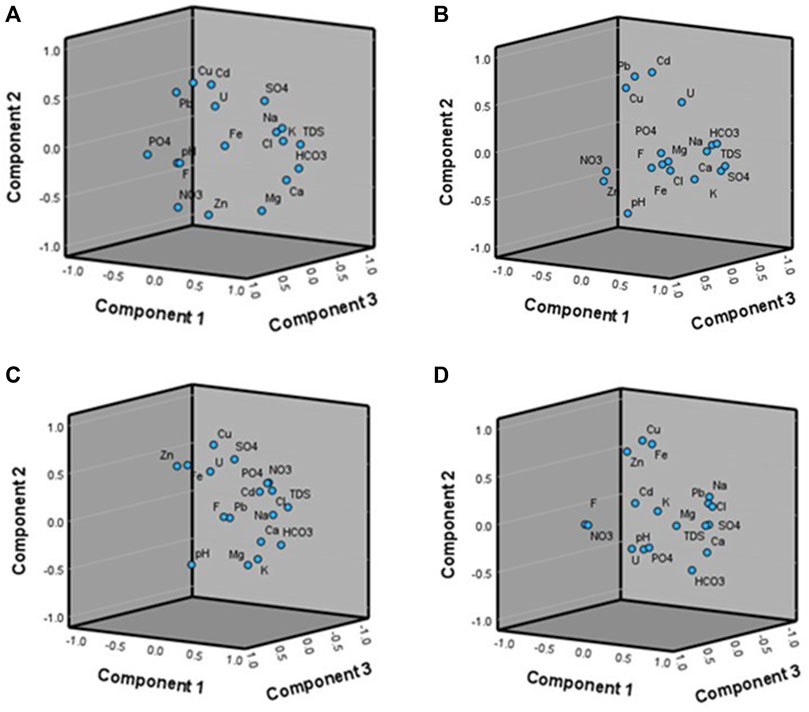
FIGURE 8. Component matrix in (A) river water—dry season, (B) river water—wet season, and (C) groundwater—dry season, and (D) groundwater—wet season.
The hydrogeochemical process plays an important role in determining the chemical constituents of the river and groundwater. The Durov (1948) plot in both river water and groundwater shows similar water types of Ca–HCO3 type, followed by SO4–Na (Figure 9). This shows that the river water and groundwater have the same type of chemical composition in this study area. Gibbs (1970) proposed a diagram representing the plots in which TDS vs. Na/(Na + Ca) for cations and TDS vs. Cl/(Cl + HCO3) for anions were used to assess the functional sources of dissolved chemical constituents, which could be precipitation dominance, rock dominance, or evaporation dominance. The rock–water interaction was the dominant process, followed by the evaporation process for river water in the study region. For groundwater, it was found that the rock–water interaction was the most dominant process.
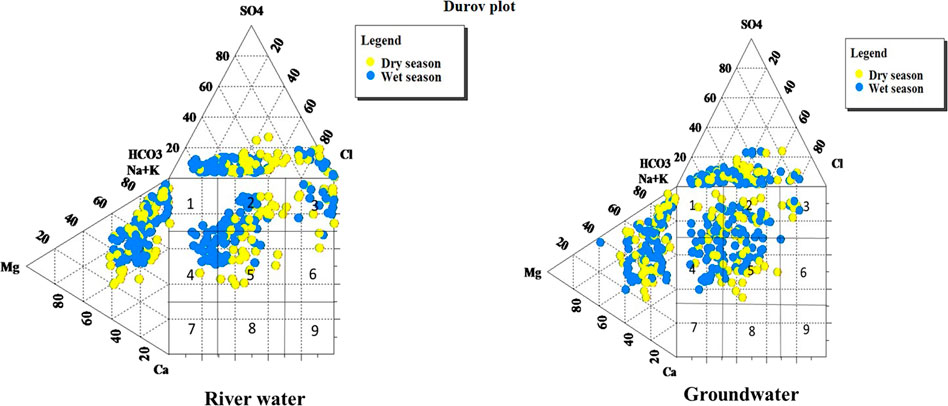
FIGURE 9. Classification of water based on the Durov diagram (Lloyd and Heathcote, 1985).
The effect of evaporation on the water quality was also assessed, since evaporation is a natural process that increases the concentrations of all dissolved ions in water, especially during the dry season, leading to an increase in the salinity of the water. The relationship between the sodium chloride ratio vs. EC of water is an indication of evaporation or evapotranspiration. If evaporation is dominant, assuming that no mineral species are precipitated, then the Na/Cl ratio would be unchanged (Jankowski and Acworth, 1997). Hence, the plot of the Na/Cl ratio is an indicator of an increase in concentration by evaporation or evapotranspiration. The EC vs. Na/Cl scatter diagram (Figures 10A, B) shows that the trend line is horizontal, which means that evaporation plays a significant role in controlling the river water chemistry during both seasons. When evaporation is dominant, the concentration of ions in the soil zone increases, thus leading to the precipitation of salts in the soil zone. In groundwater (Figures 10C, D), the inclined trend line is found, indicating that evaporation is not the dominant process in controlling the geochemistry.
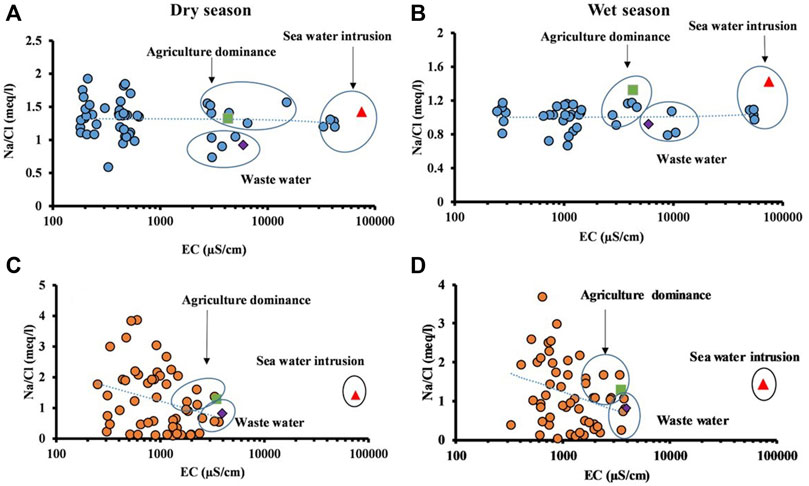
FIGURE 10. Relationship between EC and Na/Cl in (A) river water—dry season, (B) river water—wet season, (C) groundwater—dry season, and (D) groundwater—wet season.
The rock–water interaction is the major contributor of ions for both river water and groundwater in the lower Cauvery Basin. The rock–water interaction could be due to the weathering of rock and the ion exchange process. It is identified that the weathering of rocks contributes to most of the major ions in both river water and groundwater (Figure 11). Therefore, the concentration of major ions in river water and groundwater has been used to determine the weathering process. The role of silicate weathering is dominant if sodium-normalized Mg values are between 0.1 and 1 and the value of Ca is between 0.5 and 5 (Gaillardet et al., 1999). Figure 11 indicates that the samples fall in the zone of silicates, which indicates the dominance of silicate weathering in the lower Cauvery Basin.
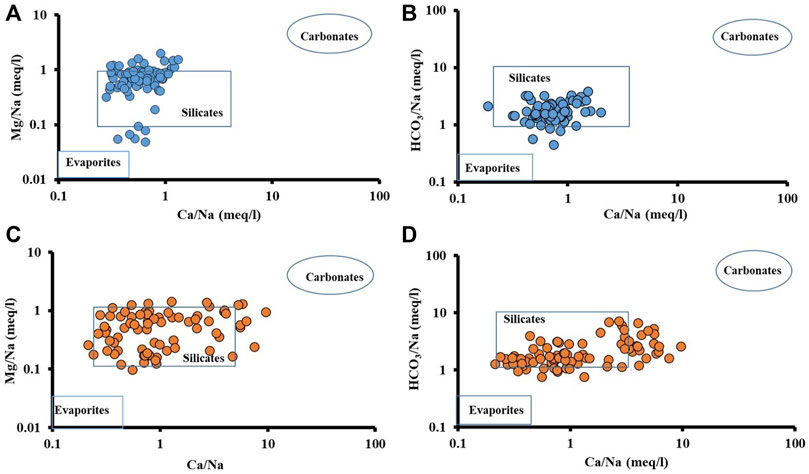
FIGURE 11. Weathering process in (A, B) river water and (C, D) groundwater.
Ion exchange is one of the important processes responsible for the concentration of ions in water. Chloro-alkaline indices (CAI) are a better representation of the ion exchange process, where CAI I and CAI II are calculated for the river water and groundwater samples by using the following formula (Schoeller, 1967):
When there is an exchange between Ca and Mg in the water with Na and K in the aquifer material, both the aforementioned indices would be negative, and if there is a reverse ion exchange, then both these indices will be positive (Schoeller, 1965; Schoeller, 1967). In river water, the reverse ion exchange process occurs during the dry season in most of the locations, whereas in the wet season, both the indices values were negative, indicating the ion exchange process (Figures 12A, B). In groundwater, CAI I and CAI II indices indicate the dominance of the reverse ion exchange process during both seasons (Figures 12C, D). The evidence for cation exchange is given by bivariate plots of Ca + Mg–HCO3–SO4 as a function of Na–Cl. Na–Cl represents the amount of Na + K gained or lost relative to that provided by chloride salt dissolution (mostly halite dissolution), while Ca + Mg–HCO3–SO4 represents the amount of Ca and Mg gained or lost relative to that provided by gypsum, calcite, and dolomite dissolution. If reverse cation exchange was an important composition-controlling process, the relation between these two parameters would be linear, with a slope of –1 (Fisher et al., 1997; McLean et al., 2000). The reverse ion exchange process occurs in groundwater during both seasons, whereas in river water, the reverse ion process occurs only during the dry season. The flow in the river controls the ion exchange process in the river, where during the dry periods, the river water is enriched with sodium ions which forces the sodium ions toward Ca–Mg-based minerals, thus causing reverse ion exchange. During the wet periods, the flow of the river inhibits the enrichment of ions, thus causing cation exchange to occur in the river water.
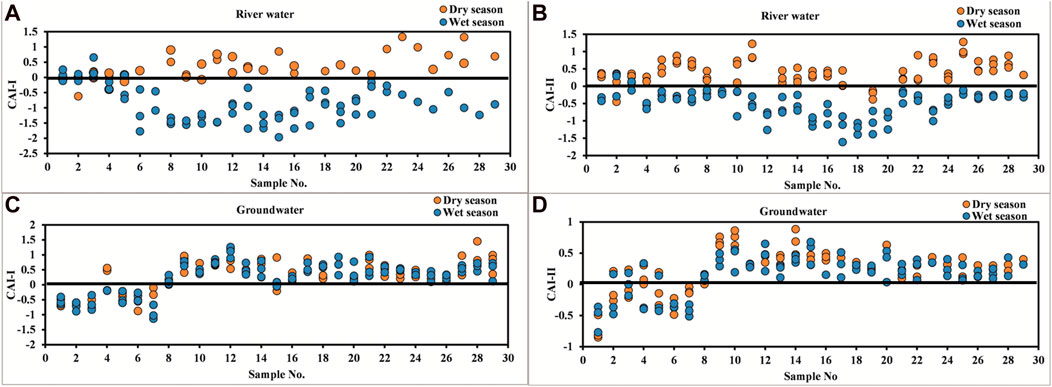
FIGURE 12. Chloro-alkaline indices I in (A) river water and (C) groundwater and chloro-alkaline indices II in (B) river water and (D) groundwater.
The quality of both river water and groundwater in the lower Cauvery basin was found to be good during wet periods compared with the dry season. The flow of the river controls the quality of river water to a greater extent, where the concentration of ions is much lesser during the wet periods due to dilution. Also, the quality of groundwater is heavily influenced by the recharge of river water, where the quality is good during wet periods. The relation between the levels of river water and groundwater indicates that during the dry seasons groundwater is discharged into the river, while the river recharges the groundwater during the wet seasons (Figure 13). Also, the temporal variation of major ions between river water and groundwater in a few locations indicates that they follow a similar pattern, thus indicating their interrelationships. This evidences the interaction between river water and groundwater in the lower part of the Cauvery basin. Since these rivers are of non-perennial nature, the interconnection between the river water and groundwater is very much prominent. Also, unregulated release of effluents, agricultural runoff, and improper sewage disposal in the water systems affects both river water and groundwater, especially during dry periods. Hence, proper stringent measures should be taken to protect both groundwater and river water from such improper disposal of pollutants. This study also necessitates the development of a finer observational network for water quality at the downstream and distributaries for the surface water and groundwater in the lower part of the Cauvery basin. Integrated water management options should be explored in the lower part of the Cauvery basin, considering the groundwater in river basin management planning. Developing capacity-building programs and community participation in river basin management should be encouraged to sustainably protect and preserve the water resources in the Cauvery lower basin.

FIGURE 13. Temporal variation of river water and groundwater of locations (A) D3 and (B) D24.
The quality of the river water and groundwater for drinking and irrigational uses in the lower Cauvery river basin was assessed. Most of the river water and groundwater samples were found to be fresh and were of the soft category. Based on the CCME water quality index, it was observed that most of the river water and groundwater samples were suitable for drinking purposes. Both river water and groundwater were found to be unsuitable for drinking at locations near the coast and near irrigated lands. The irrigation water quality index based on TDS, SAR, RSC, MH, KR, and trace elements, where the results shows that some groundwater and river water samples near the coast and agricultural areas were not suitable for irrigational purposes. In general, it was found that the quality of both river water and groundwater were poor during dry seasons compared with the wet periods. The geogenic sources were the major contributor of ions such as Ca, Mg, Na, K, and HCO3. Anthropogenic sources also resulted in elevated concentrations of Na, Cl, Cu, Fe, Zn, NO3, PO4, and Pb in water. The rock–water interaction, followed by evaporation, were the dominant process controlling the hydrogeochemistry of river water, while the rock–water interaction was the dominant process in groundwater. Silicate weathering was the dominant process, followed by carbonate weathering. The study indicated that the source of contamination of river water and groundwater is also due to the indiscriminate disposal of untreated sewage and solid waste into the river, runoff from agricultural fields, and seawater intrusion in the coastal regions. Hence, it is necessary to strengthen the water quality monitoring network to find out the sources of anthropogenic polluters and it necessary to prevent the disposal of sewage and waste into the Cauvery river.
The original contributions presented in the study are included in the article/Supplementary Material, further inquiries can be directed to the corresponding author.
LK and RR were involved in the preliminary investigation and collection of water samples. LK and RR were involved in the laboratory analysis. All authors contributed to the interpretation of data, preparation of the manuscript, and approved the submitted version.
The authors thank the Indian Space Research Organization and National Remote Sensing Centre [Grant No. ISRO/IGBP/NCP/NRSC/Project funds/10-2012(2)] for financial support.
The authors declare that the research was conducted in the absence of any commercial or financial relationships that could be construed as a potential conflict of interest.
All claims expressed in this article are solely those of the authors and do not necessarily represent those of their affiliated organizations, or those of the publisher, the editors, and the reviewers. Any product that may be evaluated in this article, or claim that may be made by its manufacturer, is not guaranteed or endorsed by the publisher.
The Supplementary Material for this article can be found online at: https://www.frontiersin.org/articles/10.3389/fenvs.2023.1001052/full#supplementary-material
APHA (1992). Standard Methods of the Examination of Water And Wastewater, 18th edition. American Public Health Association, American Water Works Association, Washington, DC.
Ayers, R. S., and Westcot, D. W. (1994). Water quality for agriculture. Rome: FAO, 174. FAO Irrigation and Drainage Paper 29, Revision 1.
Babu, P. V. L. P. (1991). Cauvery delta-its past and present, 22. India: Memoir of Geological Society of India, India 91–101.
Brindha, K., Neena Vaman, K. V., Srinivasan, K., Sathis Babu, M., and Elango, L. (2014). Identification of surface water-groundwater interaction by hydrogeochemical indicators and assessing its suitability for drinking and irrigational purposes in Chennai, Southern India. Appl. Water Sci. 4 (2), 159–174. doi:10.1007/s13201-013-0138-6
CCME, (2001). Canadian water quality guidelines for the protection of aquatic life: Canadian water quality index 1.0 technical report. In Canadian environmental quality guidelines. Winnipeg, Manitoba.
Central Ground Water Board, (2020). Ground water year book: India 2018-2019. Ministry of Jal Shakti, Department of Water Resources, River Development and Ganga Rejuvenation, Government of India, India.
Das, S. (1991). Hydrogeological features of deltas and estuarine tracts of India, 22. India: Memoir of Geological Society of India, India 183–225.
Drinking Water Sectional Committee (2012). Indian standard DRINKING WATER–SPECIFICATION (second revision), 10500. New Delhi. IS: Bureau of Indian Standards, 3.
Durov, S. A. (1948). Natural waters and graphic representation of their composition. Dokl. Akad. Nauk. SSSR 59 (3), 87–90.
Eaton, F. M. (1950). Significance of carbonates in irrigation waters. Soil Sci. 69 (2), 123–134. doi:10.1097/00010694-195002000-00004
Fisher, R. S., and Mullican, W. F., 1997. Hydrochemical evolution of sodium-sulfate and sodium-chloride groundwater beneath the northern Chihuahuan Desert, Trans-Pecos, Texas, USA. Hydrogeology journal Germany, 5(2),
Ford, H. W., 1982. Estimating the potential for ochre clogging before installing drains. Trans. ASAE, 25(6), pp.1597–1600. pp.4-16.
L. Friberg, G. F. Nordberg, and V. B. Vouk (Editors) (1986). (Amsterdam: Elsevier), II, 130–184. kell.Handbook of the toxicology of metals
Gaillardet, J., Dupré, B., Louvat, P., and Allegre, C. J. (1999). Global silicate weathering and CO2 consumption rates deduced from the chemistry of large rivers. Chem. Geol. 159 (1-4), 3–30. doi:10.1016/s0009-2541(99)00031-5
Gałczyńska, M., Gamrat, R., Burczyk, P., Horak, A., and Kot, M. (2013). The influence of human impact and water surface stability on the concentration of selected mineral macroelements in mid-field ponds. Woda Środowisko Obsz. Wiej. 13 (43), 41–54.
Gibbs, R. J. (1970). Mechanisms controlling world water chemistry. Science 170 (3962), 1088–1090. doi:10.1126/science.170.3962.1088
Gnanachandrasamy, G., Ramkumar, T., Venkatramanan, S., Vasudevan, S., Chung, S. Y., and Bagyaraj, M. (2015). Accessing groundwater quality in lower part of nagapattinam district, southern India: Using hydrogeochemistry and GIS interpolation techniques. Appl. water Sci. 5 (1), 39–55. doi:10.1007/s13201-014-0172-z
Grochowska, J., and Tandyrak, R. (2009). The influence of the use of land on the content of calcium, magnesium, iron and manganese in water, exemplified in three lakes in the Olsztyn vicinity. Limnol. Rev. 9 (1), 9–16.
Gupta, S. K., and Deshpande, R. D. (2004). Water for India in 2050: First-order assessment of available options. Curr. Sci., 1216–1224.
Jankowski, J., and Acworth, R. I. (1997). Impact of debris-flow deposits on hydrogeochemical processes and the developement of dryland salinity in the Yass River Catchment, New South Wales, Australia. Hydrogeology J. 5 (4), 71–88. doi:10.1007/s100400050119
Johnstone, C., Bedaso, Z. K., and Ekberg, M. (2022). Characterizing surface water and groundwater interaction for sustainable water resources management in southwestern Ohio. Sustain. Water Resour. Manag. 8 (1), 10–16. doi:10.1007/s40899-021-00598-6
Joshi, A., and Roh, H. (2009). The role of context in work team diversity research: A meta-analytic review. Acad. Manag. J. 52 (3), 599–627. doi:10.5465/amj.2009.41331491
Kelly, W. P. (1957). Adsorbed sodium cation exchange capacity and percentage sodium sorption in alkali soils. Science 84, 473–477. FA.
Khan, M. A., and Wen, J. (2021). Evaluation of physicochemical and heavy metals characteristics in surface water under anthropogenic activities using multivariate statistical methods, Garra River, Ganges Basin, India. Environ. Eng. Res. 26 (6).
Khan, M. Y. A., Khan, B., and Chakrapani, G. J. (2016). Assessment of spatial variations in water quality of Garra river at shahjahanpur, Ganga basin, India. Arabian J. Geosciences 9 (8), 516–610. doi:10.1007/s12517-016-2551-2
Kunz, A., Frechen, M., Ramesh, R., and Urban, B. (2010). Luminescence dating of late Holocene dunes showing remnants of early settlement in Cuddalore and evidence of monsoon activity in south east India. Quat. Int. 222 (1-2), 194–208. doi:10.1016/j.quaint.2009.10.042
Lalitha, M., Dharumarajan, S., Kalaiselvi, B., Shivanand, K., Koyal, A., Kaliraj, S., et al. (2021). Hydrochemical characterization and groundwater quality in Cauvery deltaic fluvial plains of Southern India. Environ. Sci. Pollut. Res. 28 (33), 44861–44876. doi:10.1007/s11356-021-13467-8
Lloyd, J. W., and Heathcote, J. A. (1985). Natural inorganic hydrochemistry in relation to groundwater: An introduction. Clarendon Press.
McLean, W., Jankowski, J., and Lavitt, N. (2000). “Groundwater quality and sustainability in an alluvial aquifer, Australia,” in Groundwater: Past achievements and future challenges, 567–573.
Ministry of Water Resources (2012). National water mission under national action plan on climate change, comprehensive mission document, India.
Nagarajan, R., Rajmohan, N., Mahendran, U., and Senthamilkumar, S. (2010). Evaluation of groundwater quality and its suitability for drinking and agricultural use in Thanjavur city, Tamil Nadu, India. Environ. Monit. Assess. 171 (1), 289–308. doi:10.1007/s10661-009-1279-9
Namieśnik, J., and Rabajczyk, A. (2010). The speciation and physico-chemical forms of metals in surface waters and sediments. Chem. Speciat. Bioavailab. 22 (1), 1–24. doi:10.3184/095422910x12632119406391
Paliwal, K. V., and Gandhi, A. P. (1976). Effect of salinity, SAR, Ca: Mg ratio in irrigation water, and soil texture on the predictability of exchangeable sodium percentage. Soil Sci. 122 (2), 85–90. doi:10.1097/00010694-197608000-00004
RamyaPriya, R., and Elango, L. (2021). Atmospheric CO2 consumption by rock weathering over a five-year period in a large non-perennial tropical river basin of southern India. Environ. Sci. Pollut. Res. 28 (21), 26461–26478. doi:10.1007/s11356-020-12257-y
RamyaPriya, R., and Elango, L. (2018). Evaluation of geogenic and anthropogenic impacts on spatio-temporal variation in quality of surface water and groundwater along Cauvery River, India. Environ. earth Sci. 77 (1), 2. doi:10.1007/s12665-017-7176-6
Rengaraj, S., Elampooranan, T., Elango, L., and Murugesan, V. (1998). Groundwater quality in kumbakonam and thiruvidaimaruthur taluks of Thanjavur district. INDIAN J. Environ. Prot. 18 (10), 773–779.
Schoeller, H. (1967). Geochemistry of groundwater-an international guide for research and practice, 1–18. Chap. 15.
Schoeller, H. (1965). Qualitative evaluation of groundwater resources. Methods and techniques of groundwater investigations and development. Paris, France: UNESCO, 5483.
Sharma, T. R., and Ravichandran, C. (2021). Appraisal of seasonal variations in water quality of river Cauvery using multivariate analysis. Water Sci. 35 (1), 49–62. doi:10.1080/23570008.2021.1897741
Singh, S., Raju, N. J., and Ramakrishna, C. (2015). Evaluation of groundwater quality and its suitability for domestic and irrigation use in parts of the Chandauli-Varanasi region, Uttar Pradesh, India. J. Water Resour. Prot. 7 (07), 572–587. doi:10.4236/jwarp.2015.77046
Sivakumar, P., Senthamizhchelvi, T., Reguananth, R., Anusha, J., and Manivannan, S. (2017). Spatial assessment of water quality in the lower reaches of Cauvery River, Tamil Nadu. Int. J. Fish. Aquatic Stud. 5 (2), 336–342.
Solaraj, G., Dhanakumar, S., Rutharvel Murthy, K., and Mohanraj, R. (2010). Water quality in select regions of Cauvery Delta River basin, southern India, with emphasis on monsoonal variation. Environ. Monit. Assess. 166 (1), 435–444. doi:10.1007/s10661-009-1013-7
Syvitski, J. P., Kettner, A. J., Overeem, I., Hutton, E. W., Hannon, M. T., Brakenridge, G. R., et al. (2009). Sinking deltas due to human activities. Nat. Geosci. 2 (10), 681–686. doi:10.1038/ngeo629
Tamilmani, A., and Venkatesan, G. (2021). Assessment of trace metals and its pollution load indicators in water and sediments between Upper and Grand Anicuts in the Cauvery. Int. J. Environ. Sci. Technol. 18 (12), 3807–3818. doi:10.1007/s13762-020-03034-y
Todd, D. K. (1959). Annotated bibliography on artificial recharge of groundwater through 1954. United States: US Government Printing Office.
Unep, D. (2021). Partnership and United Nations Environment Programme (2021). Reducing consumer food waste using green and digital technologies.
United Nations Environment Programme (2016). UN Environment 2016 Annual Report: Empowering People to Protect the Planet. https://wedocs.unep.org/20.500.11822/19529, Kenya.
Vetrimurugan, E., Brindha, K., Elango, L., and Ndwandwe, O. M. (2017). Human exposure risk to heavy metals through groundwater used for drinking in an intensively irrigated river delta. Appl. Water Sci. 7 (6), 3267–3280. doi:10.1007/s13201-016-0472-6
Vetrimurugan, E., Elango, L., and Rajmohan, N. (2013). Sources of contaminants and groundwater quality in the coastal part of a river delta. Int. J. Environ. Sci. Technol. 10 (3), 473–486. doi:10.1007/s13762-012-0138-3
Vetrimurugan, E., and Elango, L. (2007). Seasonal and spatial variation in magnesium and chloride concentration in groundwater of deltaic regions of Kumbakonam, Nannilam and Karaikal, Tamil Nadu. INDIAN J. Environ. Prot. 27 (11), 987.
Water, U. N., 2021. Progress on change in water-use efficiency: Global status and acceleration needs for SDG indicator 6.4. 1. Rome, Italy: Food & Agriculture Org.
Wilcox, L. (1955). Classification and use of irrigation waters (No. 969). United States: US Department of Agriculture.
World Bank (2019). Global financial development report 2019/2020: Bank regulation and supervision a decade after the global financial crisis. United States: The World Bank.
World Health Organization (2017). Guidelines for drinking-water quality: First addendum to the fourth edition.
World Health Organization (1979). WHO handbook for reporting results of cancer treatment. Geneva, Switzerland: World Health Organization.
Zhang, B., Song, X., Zhang, Y., Ma, Y., Tang, C., Yang, L., et al. (2016). The interaction between surface water and groundwater and its effect on water quality in the Second Songhua River basin, northeast China. J. Earth Syst. Sci. 125 (7), 1495–1507. doi:10.1007/s12040-016-0742-6
Keywords: CCME, multivariate analysis, water quality, irrigation water quality, river water and groundwater interactions, weathering process, ion exchange process
Citation: Keerthan L, RamyaPriya R and Elango L (2023) Geogenic and anthropogenic contamination in river water and groundwater of the lower Cauvery Basin, India. Front. Environ. Sci. 11:1001052. doi: 10.3389/fenvs.2023.1001052
Received: 22 July 2022; Accepted: 20 February 2023;
Published: 28 March 2023.
Edited by:
Titus Alfred Makudali Msagati, University of South Africa, South AfricaReviewed by:
Mohd Yawar Ali Khan, King Abdulaziz University, Saudi ArabiaCopyright © 2023 Keerthan, RamyaPriya and Elango. This is an open-access article distributed under the terms of the Creative Commons Attribution License (CC BY). The use, distribution or reproduction in other forums is permitted, provided the original author(s) and the copyright owner(s) are credited and that the original publication in this journal is cited, in accordance with accepted academic practice. No use, distribution or reproduction is permitted which does not comply with these terms.
*Correspondence: Lakshmanan Elango, ZWxhbmdvMzRAaG90bWFpbC5jb20=
Disclaimer: All claims expressed in this article are solely those of the authors and do not necessarily represent those of their affiliated organizations, or those of the publisher, the editors and the reviewers. Any product that may be evaluated in this article or claim that may be made by its manufacturer is not guaranteed or endorsed by the publisher.
Research integrity at Frontiers
Learn more about the work of our research integrity team to safeguard the quality of each article we publish.