 Julia Mackin-McLaughlin1,2*
 Shreya Nemani1,2
 Benjamin Misiuk3
 Adam Templeton1
 Patrick Gagnon4Evan Edinger2
 Katleen Robert1
- 1School of Ocean Technology, Fisheries and Marine Institute of Memorial University of Newfoundland, St. John’s, NL, Canada
- 2Department of Geography, Memorial University of Newfoundland, St. John’s, NL, Canada
- 3Department of Oceanography, Dalhousie University, Halifax, NS, Canada
- 4Department of Ocean Sciences, Ocean Sciences Centre, Memorial University of Newfoundland, St. John’s, NL, Canada
Coastal habitats have the potential to be biodiversity hotspots that provide important ecosystem services, but also hotspots for human development and exploitation. Continued use of coastal ecosystem services requires establishing baselines that capture the present state of the benthos. This study employs habitat mapping to establish a baseline describing the spatial distribution of benthic organisms along the western coast of Placentia Bay, an Ecologically and Biologically Significant Area (EBSA) in Newfoundland, Canada. The influence of seafloor characteristics on the distribution of four dominant epifaunal assemblages and two macrophyte species were modelled using two machine learning techniques: the well-established Random Forest and the newer Light Gradient Boosting Machine. When investigating model performance, the inclusion of fine-scale (<1 m) substrate information from the benthic videos was found to consistently improve model accuracy. Predictive maps developed here suggest that the majority of the surveyed areas consisted of a species-rich epifaunal assemblage dominated by ophiuroids, porifera, and hydrozoans, as well as prominent coverage by Agarum clathratum and non-geniculate crustose coralline algae. These maps establish a baseline that enables future monitoring of Placentia Bay’s coastal ecosystem, helping to conserve the biodiversity and ecosystem services this area provides.
Introduction
Human reliance on coastal ecosystem services places stress on benthic habitats, which may impact future availability of those services (Costanza et al., 1997; Barbier et al., 2011) and also biodiversity (Lotze et al., 2006), warranting management actions that balance coastal ecosystem function and human use. Considering the modern trend of increased utilization of ocean resources (Bennett et al., 2019), it is imperative to understand the current distribution of biota and non-living resources (i.e. oil, mined goods), against which change can be monitored over time (Shumchenia and King, 2010; Siwabessy et al., 2018). Conserving ecosystem function and services requires effective ecosystem-based management, which aims to preserve biodiversity and functionality by recognizing complex ecological linkages at varying scales, instead of relying on policies managing individual species (O’Higgins et al., 2020). The resultant holistic management therefore works to balance stakeholder involvement with sustainable practice (Long et al., 2015).
The benthos plays an important role in providing physical structure to the marine environment, supporting the ecological niches of other biota and serving as an indicator of ecosystem health which may be monitored to inform conservation priorities (Brey, 2012; Oug et al., 2012, Alexandridis et al., 2017). Benthic epifaunal invertebrates form the trophic basis for marine food webs (Iken et al., 2010), influencing both benthic and pelagic zones via cycling of energy, nutrients, and organic matter (Sandnes et al., 2000; Hajializadeh et al., 2020; Lam-Gordillo et al., 2021), and acting as ecosystem engineers (Reise, 1985; Meadows et al., 2012). The majority of benthic species are relatively immobile, if not completely sessile (Bilyard, 1987), and are long-lived, resulting in prolonged exposure to stressors and disturbances (Wei et al., 2019; Meng et al., 2021). Therefore, long-term monitoring of ecosystem function and health may benefit from the inclusion of epibenthic invertebrates as bioindicators.
Brown kelp, primarily of the order Laminariales, are one particular taxon known to enhance local biodiversity (Steneck et al., 2002; Krumhansl et al., 2016). They act as both primary and secondary producers, sequester carbon, provide shelter from predators, act as nursery grounds (Gagnon et al., 2003), and provide the physical framework to increase habitat complexity (Steneck et al., 2002). Kelp beds in temperate and sub-polar coastal regions of the northwest Atlantic are subject to periodic decimation by the herbivorous green sea urchin (Strongylocentrotus droebachiensis), resulting in coastal barrens that are less productive, which may extend 1000s of km (Filbee-Dexter and Scheibling, 2014). In the Northeast Atlantic, some of the few remaining floral species not consumed by urchins may include the kelp Agarum clathratum and non-geniculate crustose coralline algae (CCA). A. clathratum presumably deters urchins via phenolic compounds that render them unpalatable (Vadas, 1968; Vadas, 1977). For urchins, CCA are a poor nutritional substitute compared to kelps (Agatsuma, 2000; Kelly et al., 2008). Both A. clathratum and CCA are associated with a unique suite of invertebrates [Ojeda and Dearborn, 1989; Freiwald, 1993; Bégin et al., 2004; Swanson et al., 2006; Chenelot et al., 2011; Blain and Gagnon, 2014; Tebben et al., 2015; Jørgensbye and Halfar, 2017], potentially boosting subtidal biodiversity.
Benthic fauna and flora associate strongly with the physical structure of the seafloor (Auster and Langton, 1998; Kostylev et al., 2001), and geospatial models based on remotely sensed data may be used to support our understanding of spatial ecological patterns and the physical factors that drive them. The defined species-environmental relationships can be used to develop a baseline grounded in the function of an ecosystem that qualifies the composition and distribution of the benthos in a target area. These resultant habitat maps have been utilized for fisheries management (Brown et al., 2012), to inform effective Marine Protected Areas (MPAs) (Lacharite and Brown, 2019), for observing the impacts following ecological disturbance (e.g. oil spills (Botello et al., 2015)), and the first step in the establishment of long-term monitoring programs of coastal biodiversity (Obst et al., 2018). The effectiveness of a baseline relies on accurate and robust modelling techniques employed during its development, and these techniques are being improved continuously as there is an urgent need for such spatial data products.
This study aims to establish a baseline describing the benthic epifaunal assemblages and two marine algae species (A. clathratum and CCA) found in the subtidal zone of an Ecologically and Biologically Significant Area (EBSA) in Newfoundland, Canada (Templeman, 2007; DFO, 2016). An EBSA is an area notable for its distinct ecosystem characteristics, role in species’ life stages (i.e. feeding/spawning grounds), resilience, and socio-economic utilization (DFO, 2004). The Placentia Bay EBSA has exhibited growth in vessel traffic and coastline activities that will likely shift the state of the benthos (DFO, 2007; LGL, 2018). The baseline established here will enable documenting changes to the dominant epifauna and marine algae using spatially explicit predictions of their current distribution based on the relationships with the physical structure of the seafloor. While modeling the relationship between seafloor features and biota, the performance of a new machine-learning algorithm, Light Gradient Boosting Machine (LightGBM), is tested against a well-established algorithm, Random Forest (RF). The predictive models and habitat maps developed in this study may be applied for future monitoring of changes in ecosystem structure and health within the Placentia Bay EBSA.
Methods
Study area
Placentia Bay is a deep-water embayment located on the southern side of the Island of Newfoundland, in the province of Newfoundland and Labrador (Atlantic Canada). Following an overview of its ecosystem status, present fish distribution and spawning locations, and a species inventory, Placentia Bay was designated by the Government of Canada Department of Fisheries and Oceans as an EBSA (Templeman, 2007; DFO, 2016). Any severe disturbance (i.e. oil spill) would be of greater ecological consequence within the EBSA boundary than if the same perturbation occurred beyond its extent (DFO, 2004). Placentia Bay hosts important capelin spawning beaches, seagrass meadows, seabird colonies, and herring aggregations (Sjare et al., 2003). It is also a location where charismatic megafauna such as whales (DFO, 2018) and leatherback turtles (DFO, 2012b) may be observed. Paired with its ecological relevance, Placentia Bay has local socio-economic importance, including traditional and commercial fisheries of groundfish and shellfish (Robichaud and Rose, 2006; DFO, 2012a; DFO, 2019), a growing finfish aquaculture industry (LGL, 2018), and frequent marine traffic, including oil tankers. Placentia Bay is considered to be amongst marine areas at greatest risk of oil spill across Canada (DFO, 2007).
Four survey areas along the west coast of Placentia Bay were selected for this study: Rushoon, D’Argent Bay, Burin and St-Lawrence (Figure 1). These sites are notable for their local ecological importance. Rushoon was the northernmost site surveyed, and is likely one of the more pristine of the four due to its remoteness. This may be subject to change, as development of salmon aquaculture progresses in the area, which may impact the local environment (LGL, 2018). Further southwest, D’Argent Bay was selected for its capelin spawning sites, herring aggregations, and high occurrence of whales (Sjare et al., 2003). Burin is near a relatively large cluster of towns, including the towns of Burin and Marystown. Finally, closest to the mouth of Placentia Bay, St. Lawrence was selected for its capelin spawning sites, as well as its role as an important seabird habitat (White, 2018).
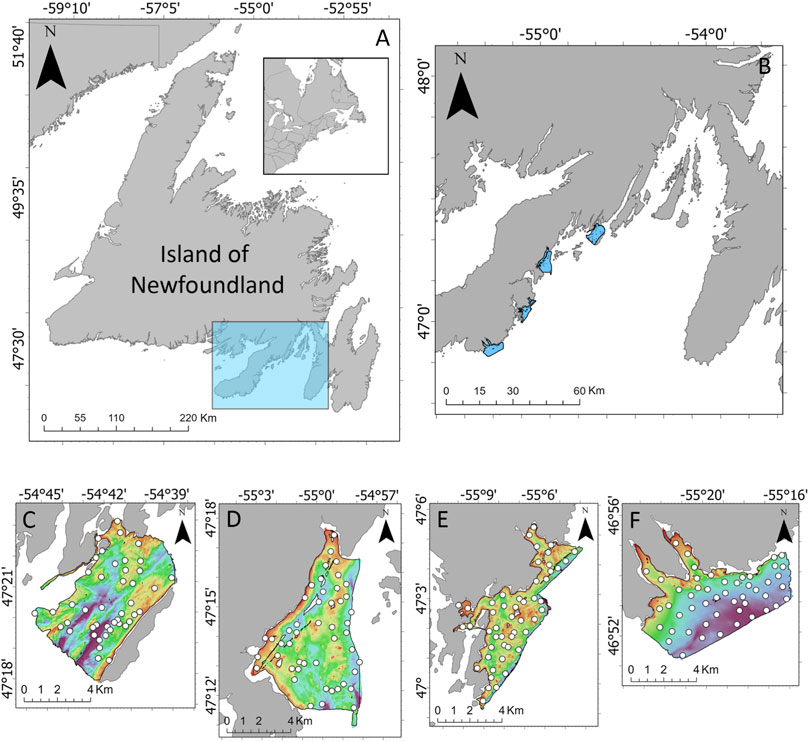
FIGURE 1. (A) Location of Placentia Bay (highlighted in the blue box) on the southern coast of the Island of Newfoundland, located on the eastern coast of Canada. (B) Locations of the four survey areas along the west coast of Placentia Bay. Bathymetry and ground-truth locations for (C) Rushoon, (D) D’Argent Bay, (E) Burin, and (F) St. Lawrence.
Environmental survey
Multibeam echosounder (MBES) surveying was carried out between winter 2018 and summer 2020 (Table 1) on board the 27’ Fisheries and Marine Institute research vessel D. Cartwright. MBES uses sound waves that travel from the sensor to the seafloor and back again, forming a swath of depth soundings across the path of the vessel. As sound waves echo back from the seafloor, the strength of their return is also measured, and this acoustic backscatter can be indicative of substrate types. Harder substrates like bedrock or boulders return a higher backscatter signal, while softer sediments like mud or sand will produce a weaker signal (Lamarche et al., 2011; Lurton and Lamarche, 2015; Calvert et al., 2015). Bathymetry and backscatter were collected using a Kongsberg EM 2040P, operating at 400 kHz. Positioning data were obtained using a Fugro 3,610 differential GPS with a Seastar subscription that provided spatial accuracy of up to 8 cm. Sound Velocity Profiles (SVP) between the transducer and seafloor were obtained using an AML BaseX sound velocity profiler, while sound velocity measurements at the MBES transducer head were obtained by an AML Micro SV sound speed sensor.
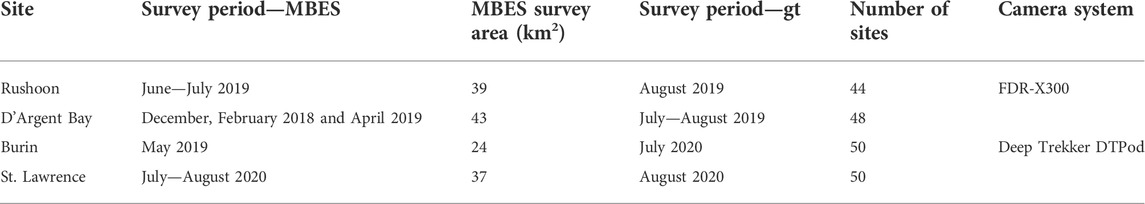
TABLE 1. Acquisition information for multibeam echosounder (MBES) and ground-truth (GT) surveys.
Raw sonar files for each survey area were imported into the Quality Positioning Services (QPS) Qimera v2.0.3 software. Bathymetric data were adjusted for Rushoon and D’Argent Bay using observations from the Argentia tide station (Station #835, https://www.tides.gc.ca/en/stations/835) and for Burin and St. Lawrence using the St. Lawrence tide station (Station #755, https://www.tides.gc.ca/en/stations/00755).). SVPs were imported into each respective Qimera project: 25 for D’Argent Bay, 19 for Rushoon, 19 for Burin, and 17 for St. Lawrence. Spline filters were employed to automatically remove outliers, and once processing was completed, a bathymetric surface was exported as a Floating Point GeoTIFF Grid at 5 × 5 m spatial resolution for each area. Processed files were additionally exported to. GSF format, and were imported into QPS Fledermaus Geocoder Toolbox (FMGT) v.7.8.4. For backscatter processing. Backscatter mosaics were exported at 5 × 5 m spatial resolution. All environmental rasters were projected to UTM Zone 21.
Bathymetric surfaces were used to derive terrain features that have been found to influence benthic biota distribution. These features can act as surrogates for variables that are difficult to measure directly (e.g. slope can act as a proxy for finer-scale currents). Six terrain features identified by Lecours et al., 2016a that capture a large amount of topographic information were calculated in ESRI ArcGIS using the Terrain Attribute Selection for Spatial Ecology toolbox (TASSE) (Lecours, 2015). These included slope (change in elevation), eastness and northness (orientation, calculated as the sine and cosine of slope), relative difference to the mean value (RDMV; relative position), and standard deviation (SD) of bathymetry (a measure of rugosity). Additionally, bathymetric position index (BPI) and vector ruggedness measure (VRM) were also selected to potentially provide information on seafloor structure. BPI is an adaptation of the topographic position index (Weiss, 2001) that measures the relative position of an area to the surrounding seabed (Lecours et al., 2016b). Positive and negative values represent peaks and troughs, respectively. VRM incorporates both slope and aspect in a single measure of surface roughness that is independent of slope (Hobson, 1972; Sappingtom et al., 2007; Martín-García et al., 2013), unlike SD. BPI, and VRM were derived from the bathymetric surfaces using the Benthic Terrain Modeller (BTM) Version 3.0 (Wright et al., 2012). Additionally, a layer measuring the distance from the coast was calculated within each survey area using the ‘Euclidean Distance’ tool in ESRI ArcGIS, which has previously been used to inform on benthic assemblage distributions (Degraer et al., 2008; Richmond and Stevens, 2014; Vassallo et al., 2018).
Features were derived from backscatter mosaics based on the spatial distribution of the varying shades of grey denoting backscatter intensity (Haralick et al., 1973). Three features were calculated using a grey-level co-occurrence matrix via the R package ‘GLCM’ (Zvoleff, 2020): contrast (local variation), homogeneity (closeness of distribution), and entropy (randomness) (Haralick et al., 1973). These features were selected for their common application in previous studies of similar systems (Blondel and Sichi, 2009; Samsudin and Hasan, 2017; Shang et al., 2021).
Terrain features were calculated across a range of spatial scales (i.e. using moving-windows of varying sizes), as no single scale can account for all ecological processes of a benthic ecosystem (Dolan, 2012; Lecours et al., 2015). All features (except for BPI) were derived using a 3x3-cell window, with additional scales obtained using the “calculate-average” approach (Dolan and Lucieer, 2014; Misiuk et al., 2021), by focal averaging using increasing window sizes (13 × 13-and 35 × 35-cell windows; Table 2). BPI layers were calculated by setting the outer and inner radii (in cells) of an annulus (ring-shape) and calculating the mean elevation value of all cells within the analysis neighborhood (Walbridge et al., 2018). BPI was calculated using the Benthic Terrain Modeler Toolbox, with outer and inner radii of 60 and 3, 150 and 45, 260 and 13, 630 and 195, 700 and 35, and 1750 and 525 cells.
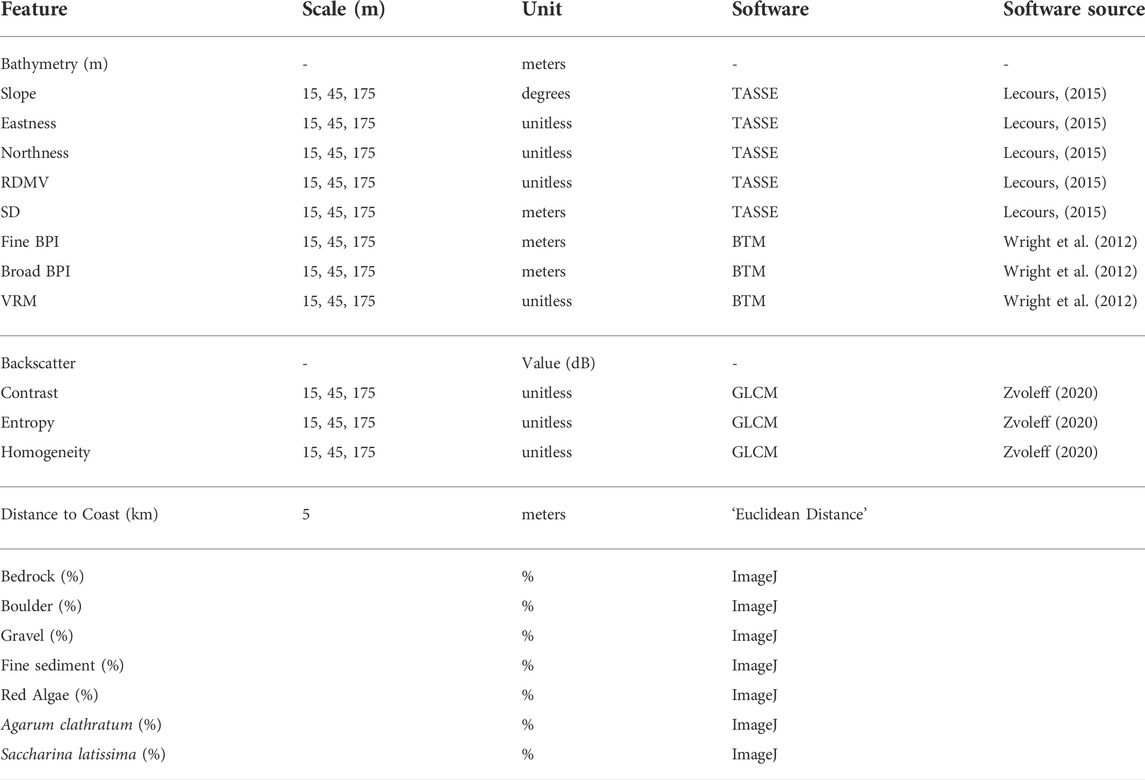
TABLE 2. Multiscale environmental features calculated at each site.
Benthic biota
Ground-truthing sites (n = 192) across all four survey areas were selected using a Generalized Random Tessellation Stratified (GRTS) survey design (Supplementary Table S1) (Stevens and Olsen, 2004), stratified by bathymetry and backscatter. For the St. Lawrence sites, MBES data were unavailable prior to ground-truthing, and bathymetry was interpolated from depth soundings on a nautical chart (e.g. Great St. Lawrence Harbour, Marine Chart CA4642_2). Ground-truthing consisted of underwater video with two systems: a Sony FDR-X3,000 Action Cam (1920 × 1,080 pixels, 60 frames/sec), contained in a Deep Blue Abysso waterproof housing, paired with two 3,500 lumen neutral white light Cree LED bulbs and two green lasers spaced 10 cm apart; and a Deep Trekker DTPod (1920 × 1,080 pixels, 30 frames/sec) with an integrated light and two red lasers spaced 2.5 cm apart. For both systems, a live video feed was used to adjust the height of camera above the seabed. Boat positioning at the start and end of each transect was obtained using the onboard Garmin GPS 16x; the midpoint of each transect was used to extract point-wise data from terrain features.
Two-minutes of continuous video were annotated using the Monterey Bay Aquarium Research Institute’s (MBARI) Video Annotation and Reference System (VARS) (Schlining and Stout, 2006). The presence or absence of Agarum clathratum and non-geniculate coralline algae (CCA) were recorded. Because of varying coverage across different ground-truthing sites, CCA were divided into three classes: full coverage, partial coverage, and absent. The full-coverage class was assigned when most of the seafloor was covered by CCA. Partial coverage was given when at least half of the substrate was covered. If little to no CCA was present, the site was marked as absent. Because abundance of S. droebachiensis may influence macroalgae distributions, counts at each site were included as a possible predictor variable.
All epifauna larger than 2 cm were counted and identified to the lowest possible taxonomic level, using expert knowledge and published species guides (Gosner, 1979; Harvey-Clark, 1997; Martinez and Martinez, 2003; Fox et al., 2014; Salvo et al., 2018). When species identification was not feasible, a morphotype approach was employed (Howell et al., 2019). The total number of individual species/morphotypes per transect was calculated and converted to densities by estimating the total area recorded for each transect. Using the Blender v.2.8.2, 12 frames at 10 s intervals were extracted and the distance between lasers was measured and used to calculate transect width with ImageJ. This was averaged and multiplied by the total length of the transect. Species/morphotypes that had an abundance of <5 individuals across all ground-truthing sites were removed to reduce the influence of low-abundance species. The dominant assemblages for ground-truthing sites with <5 faunal counts could not be characterized (De la Torriente et al., 2018); these sites were removed prior to analysis.
The species matrix was Hellinger transformed to reduce the importance of larger epifaunal abundances (Legendre and Gallagher, 2001; Borcard et al., 2011). Faunal assemblages were clustered using the average hierarchical clustering method ‘Unweighted Pair-Group Method using arithmetic Averages’ (UPGMA) (Sokal and Michener, 1958), with hierarchical relationships plotted as a dendrogram. The UPGMA approach is fast, simple, and may even outperform other clustering algorithms (Kreft and Jetz, 2010). Dissimilarity values between two branches of the derived dendrogram (i.e., “fusion levels”) were plotted to determine the optimal number of faunal assemblages. Silhouette widths were additionally calculated and plotted for each fusion level, providing a metric for distinguishing assemblages. Silhouette widths range from -1 to 1, with one representing assemblages that are clearly distinguished (Borcard et al., 2011). Once faunal assemblages were identified, the characteristic species or morphotypes of each assemblage were identified using an IndVal procedure (Legendre, 2013). A species accumulation curve was developed for each assemblage to identify if species richness was effectively captured (Ugland et al., 2003; Bevilacqua et al., 2018).
Model development
For both the assemblages and for each marine algae taxa model, a Boruta Feature Selection (Kurse and Rudnicki, 2010) algorithm was run separately to include terrain features grouped by scale (window of analysis: 3 × 3, 13 × 13, 35 × 35 cells) in order to reduce the number of candidate terrain features and promote model parsimony and support performance (Nemani et al., 2021). Important variables are identified by the Boruta wrapper as it compares the importance of a variable with a randomly shuffled version containing the same distribution of values (i.e., “shadow features”). A variable is deemed important if it consistently contributes more to the model than its shadow variable. Degenhardt et al., 2019 found that the Boruta algorithm generally outperformed other selection methods, and previous successful applications can be found in Li et al., 2016, Diesing and Thorsnes, (2017) and Nemani et al., 2021. Variables identified as “important” or “tentative” were selected for model training here. Variables were further dropped that had absolute correlation values exceeding 0.7, as determined using the R function ‘corrplot’ (Wei, 2013). In these cases, the variable with the lower impact on model accuracy was dropped.
Separate multiclass classification Random Forest (RF) and Light Gradient Boosting Machine (LightGBM) models were developed for the epifaunal dataset, the A. clathratum dataset, and the CCA dataset. Each model was trained with 2/3 of the samples, which included a proportional representation of classes (i.e. presence and absence of A. clathratum or epifaunal assemblage). The remaining 1/3 was reserved to test model performance. Model accuracy was assessed using the test data by computing a confusion matrix of predicted and observed classes (Congalton, 1991), from which overall accuracy and Cohen’s kappa were derived. Overall accuracy is the number of accurately predicted classifications divided by the total number of observations. The kappa statistic incorporates the chance of random agreement between observed and predicted classes based on their prevalence (Cohen, 1960; Allouche et al., 2006). Both the RF and LightGBM models were run with and without fine-scale (<1 m) substrate % coverage to understand the importance of fine-scale features in explaining spatial patterns. Using both the RF and LightGBM models and the environmental data layers, full-coverage predictive maps were developed for the distribution of epifaunal assemblages, presence/absence of A. clathratum, and for the absence/partial/full coverage of CCA. Since substrate % coverage features were not spatially continuous, full-coverage predictions were based on the terrain feature-only models.
RF is a well-established ensemble machine-learning algorithm that builds a ‘forest’ of classification trees from which predictions are obtained through majority voting. It employs ‘bagging’, where the data are repeatedly bootstrapped to train different classification trees (Quinlan, 1986), which are uncorrelated. Additionally, each tree split uses a random subset of variables, instead of the entire set. RF models were trained using the R package ‘randomForest’ (Liaw and Weiner, 2002), with the default number of variables included in each split (‘mtry’) retained for each model. Random Forest has been used successfully for predictive models with limited sample sizes similar to the number of observations in this study (Stephens and Diesing, 2014; Robert et al., 2015; McLaren et al., 2019; Misiuk et al., 2019; Ilich et al., 2021; Janowski et al., 2021).
LightGBM is a relatively recent Gradient Boosting Decision Tree algorithm (Ke et al., 2017). Unlike RF, LightGBM uses ‘boosting’ rather than ‘bagging’ to enhance performance. Boosting is another ensemble method in which classification trees are grown on the residuals from previous trees (Vaghela et al., 2009; Schapire and Freund, 2013). Tree growth and learning rate are controlled by a suite of tunable parameters (Table 3). The parameters recommended in the LightGBM release 3.2.1.99 guide (Zhang et al., 2012) were chosen to tune the model.
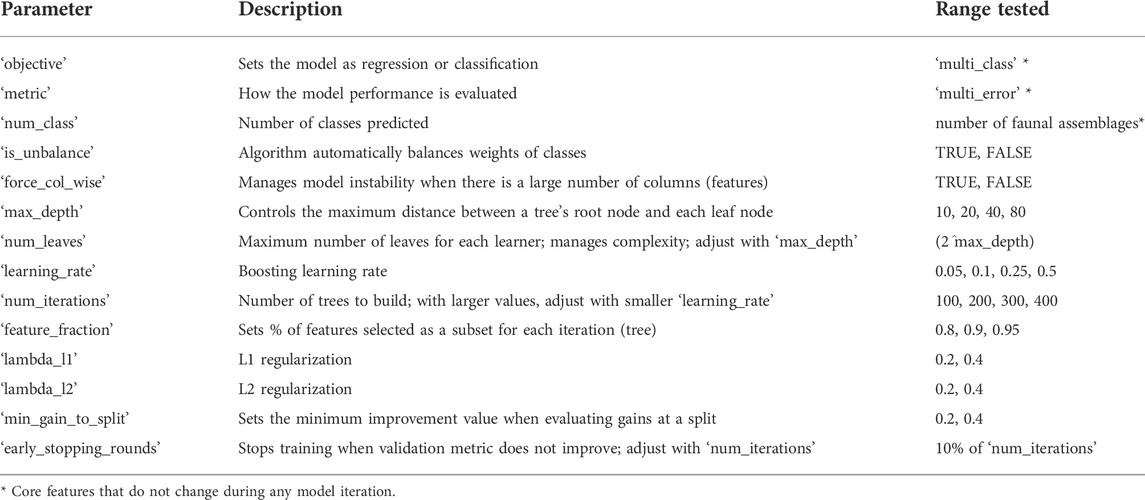
TABLE 3. Parameters selected for LightGBM model tuning.
A variable importance plot was derived for each model, ranking variables based on their predictive importance. The RF model used Gini Importance, which measures the total decrease in node impurity by calculating the sum over the number of splits including a variables, across all trees (Friedman et al., 2001). LightGBM implements a gain-based method that is similar to the Gini Importance used by RF (Lundberg et al., 2020), but excludes unimportant features. Univariate partial dependence plots were derived from the best-performing model to visualize the relationship between an individual variable and a faunal assemblage or marine algae (Marini et al., 2015; Vassallo et al., 2018).
By comparing model accuracy and ranked variable importance, preliminary modelling using the derived terrain features suggested that important variables may be missing. Substrate heterogeneity information extracted from videos of the seafloor was tested to improve model performance. Substrate observations were obtained from the underwater video collected for biological analysis (described below). An image was extracted every 10 s from each video using Blender v.2.8.2 and images were imported to ImageJ (Image processing and analysis in Java). A 50-square grid was superimposed on each image and each square was labelled as one of seven classes: bedrock, boulder, gravel-mix, fine sediment (including both mud and sand), red algae (excluding coralligenous algae), Agarum clathratum, and Saccharina latissima (Figure 2). Following Connell et al., 2014, red algae can be qualitatively categorized as turfs (i.e. loosely to densely aggregated filamentous algae <15 cm tall and covering an area greater than 1 m2). Biogenic substrates were included because observing the sediment underneath was often not possible and algae presence is likely to influence the presence of other epifauna. The number of occurrences of each class was divided by the total number of grids for a ground-truth site, yielding fine-scale (<1 m) percent cover for each substrate class.
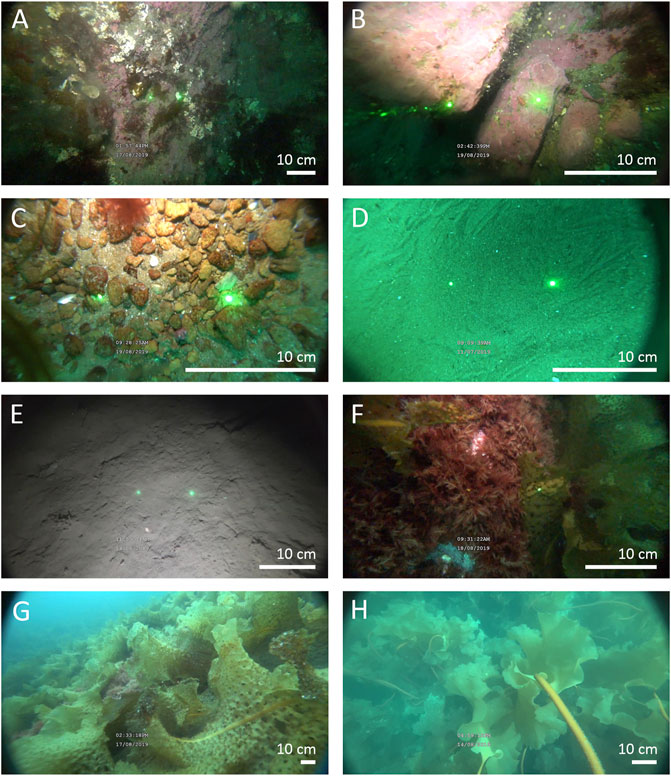
FIGURE 2. Images of the substrate classes identified during video annotation: (A) bedrock, (B) boulder, (C) gravel mix, (D) fine-sediment (sand), (E) fine-sediment (mud), (F) filamentous red algae (excluding coralline algae), (G) Agarum clathratum, and (H) sugar kelp (Saccharina latissima). Distance between lasers was 10 cm for the Sony FDR-X300 camera and 2.5 cm for the Deep Trekker DTPod.
Results
Epifaunal assemblages
Of the 192 ground-truthing sites collected, 117 fulfilled the criteria for assemblage identification. One site (Rushoon-53) exhibited two distinct epifaunal assemblages and substrate types, and was split into two, producing 118 total samples. From these, a total of 12,096 individuals were counted and 55 taxa were identified (Supplementary Table S2), 14 of which (25.5%) were identified to species level. The brittle star morphotype ‘Ophiuroidea spp.’ had the highest overall abundance (6,693 individuals; 55.5% of all counts), followed by ‘Hormathia sp.1’ (1,631 individuals; 13.5%), Strongylocentrotus droebachiensis (766 individuals; 6.3%), and Echinarachnius parma (627 individuals; 5.2%). Porifera had the highest taxa diversity with 14 morphotypes. Echinodermata was second in taxa diversity (7 morphotypes; six species), followed by Cnidaria (8 morphotypes; two species).
Four epifaunal assemblages were identified (Figure 3; Table 4). Sixty-four of 119 sites (53.8%) were identified as OPH, typified by ‘Ophiuroidea spp.‘, ‘Porifera sp.5’, and ‘Hydrozoa sp.1’. OPH contained the highest taxa richness (51 taxa: 39 morphotypes, 12 species), as well as the most taxa unique to a single assemblage (8 taxa). SDR represented 21 sites (17.6%) and contained 13 morphotypes and seven species, with S. droebachiensis and ‘Stauromedusae sp.2’ as the typifying taxa. MIX was found at 26 sites (21.8%) and had the second highest taxa richness, with 30 morphotypes and 12 species. It was typified by ‘Hormathia sp.1’, ‘Cerianthidae sp.3’, ‘Cnidaria sp.1’, and ‘Sagittidae sp.1’. EPA was the rarest assemblage, with only eight representative sites (6.7%). EPA had the lowest taxa richness, with only eight morphotypes and seven species, and was typified by E. parma and Pseudopleuronectes americanus, with the former unique to this assemblage. While OPH exhibited the highest taxa richness, species accumulation curves indicate that the species/morphotypes richness of SDR, MIX, and EPA are underrepresented (Figure 4). Greater surveying effort could reveal additional species/morphotypes for each assemblage. However, this lack of plateau may also be the result of removing species with <5 occurrences across all ground-truthing sites.
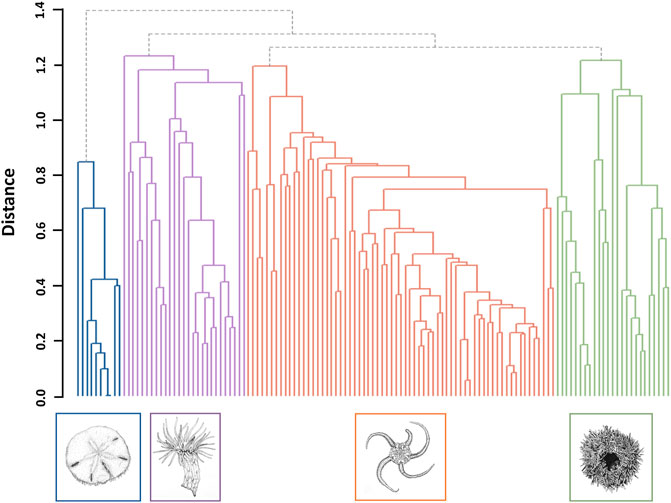
FIGURE 3. Dendrogram of the four dominant epifaunal assemblages identified at sites across the west coast of Placentia Bay. Illustrations by J. Mackin-McLaughlin.
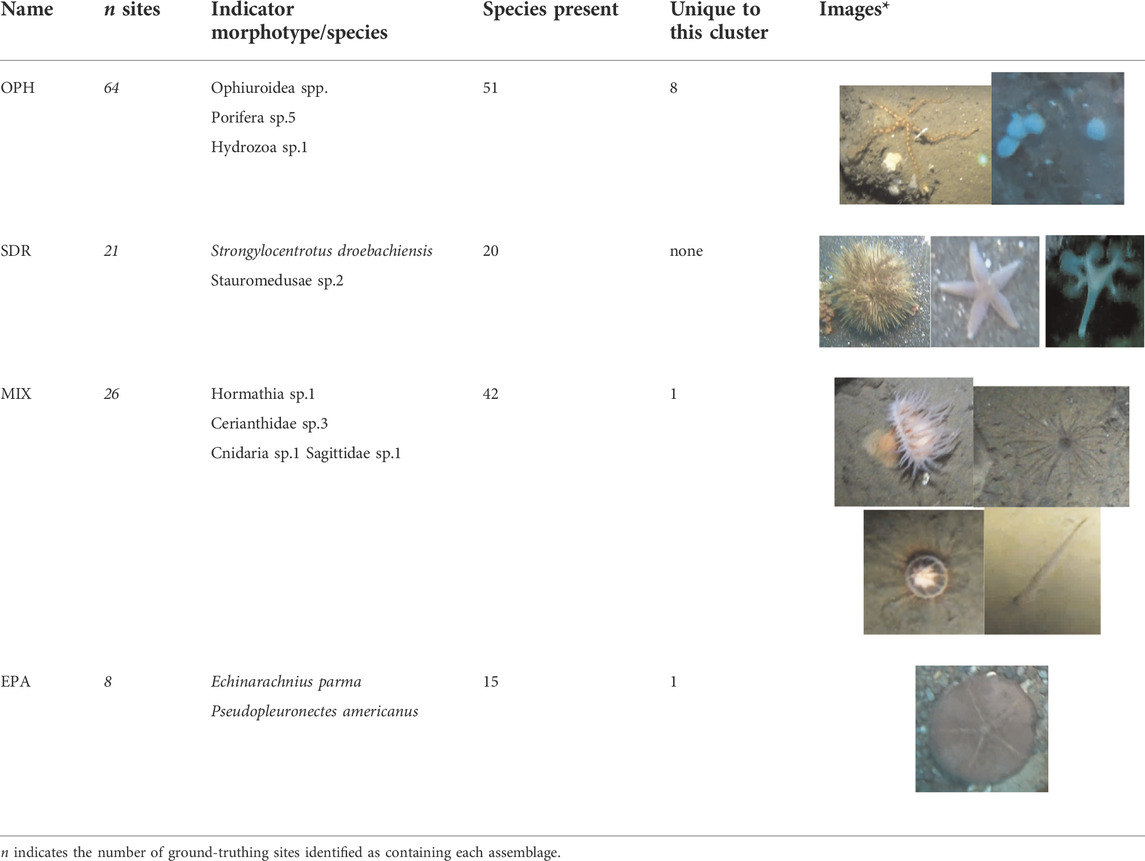
TABLE 4. Indicator species by IndVal analysis of faunal assemblages.
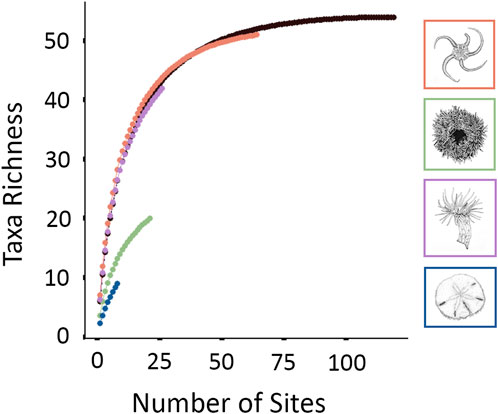
FIGURE 4. A species accumulation curve was developed for each faunal assemblage and for the summation of species observed across all sites included in analysis (in black).
Model performance and predicted distribution
Following the Boruta algorithm and assessment of collinearity, 18 variables were included in the epifaunal models, 18 in the A. clathratum models, and 24 in the CCA models. Without fine-scale substrate % features, the RF model accuracy was 61.0% (kappa = 0.31) and the LightGBM model accuracy was 68.3% (kappa = 0.47). With the addition of fine-scale substrate features, the epifaunal RF test accuracy increased to 78.1% (kappa = 0.62), and the LightGBM model accuracy increased to of 78.1% (kappa = 0.62). Both the RF and LightGBM models overestimated the occurrence of OPH, and as a result, a large number of SDR and MIX observations were incorrectly classified as OPH. This is evidenced in the RF and LightGBM predictive maps, where OPH was predicted to cover the majority of each survey area, excluding Rushoon (Figure 5). RF, however, included a greater coverage of SDR along the coastal side of D’Argent Bay and of MIX along the interior of St. Lawrence. LightGBM underestimated the coverage of both SDR and MIX in D’Argent Bay and St. Lawrence, respectively, even though ground-truthing sites assigned as those assemblages were observed. RF correctly identified all EPA observations while LightGBM was unable to correctly predict any of the EPA sites.
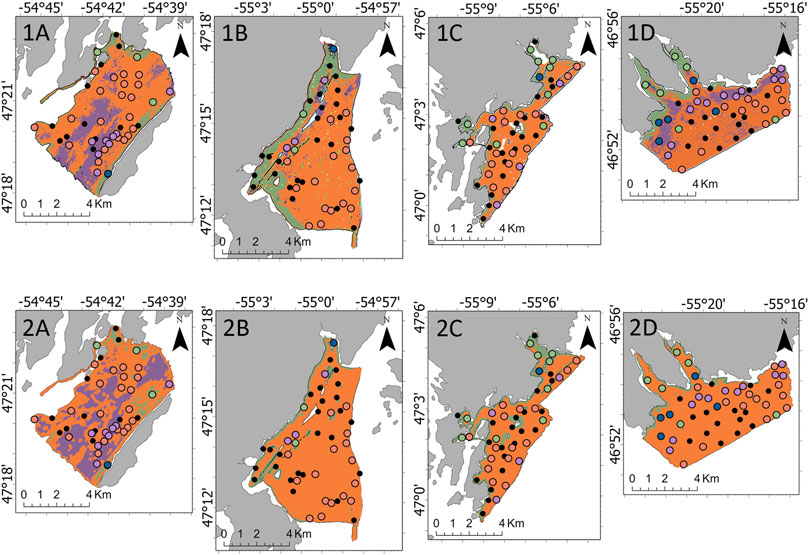
FIGURE 5. Predicted spatial coverage of the identified four assemblages by the 1) Random Forest and 2) Light Gradient Boosting Machine models across the four target survey areas: (A) Rushoon, (B) D’Argent Bay, (C) Burin, and (D) St. Lawrence.
Only ground-truthing sites within the observed depth range for each marine algae were included. For A. clathratum model development, 115 sites at a depth range of 15–66 m were included. A. clathratum was present at 60 of 115 ground-truth sites, the majority of which occurred in Burin (25 of 60 sites; 41.7%). A. clathratum was present at over 50% of sites in all survey areas except for St. Lawrence. Model performance without fine-scale substrate % features was 82.1% (kappa = 0.64) for the RF model and 87.2% (kappa = 0.74) for the LightGBM model. Maps derived from these models predicted a majority coverage of A. clathratum across Burin, though a patchwork of absences is predicted by LightGBM in the interior of Burin’s extent. Differences in predicted A. clathratum extent is apparent in Rushoon and St. Lawrence. The greatest discrepancies were observed in D’Argent Bay though, with very little coverage predicted by LightGBM compared to RF (Figure 6).
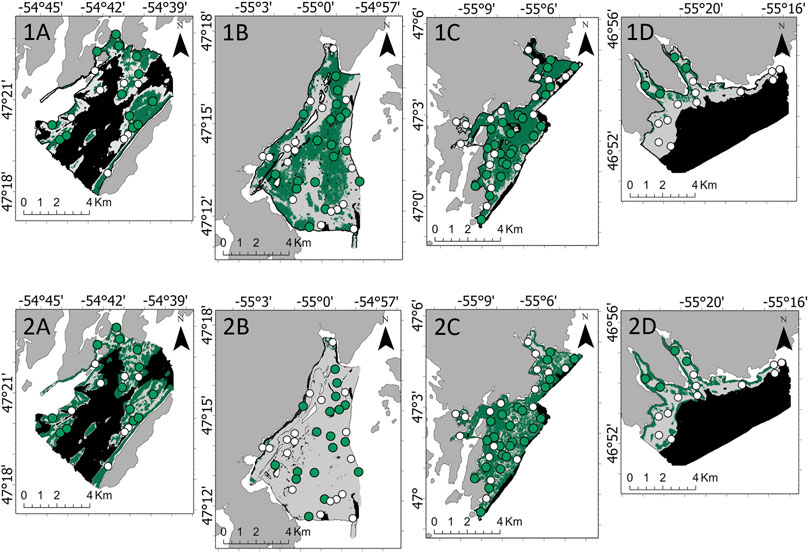
FIGURE 6. Predicted absence (white) and presence (green) of Agarum clathratum by the 1) Random Forest and 2) Light Gradient Boosting Machine models across the four target survey areas: (A) Rushoon, (B) D’Argent Bay, (C) Burin, and (D) St. Lawrence. No predictions were developed where black is seen, as depth exceeded the range established in A. clathratum model development.
132 sites were included in the CCA model at a depth range of 15–78 m. For CCA, 42 sites had full coverage (31.8%) and 31 sites had partial coverage (23.5%). Rushoon had the highest number of ground-truthing sites with full coverage off CCA (15 of 27). Aside from one instance of full coverage, the northeastern coast of St. Lawrence was characterized by partial coverage of CCA. Few absences of CCA were observed in D’Argent Bay (7 out of 36 sites) and Burin (11 out of 45 sites). When models were developed without fine-scale substrate % coverage, the CCA RF model had an accuracy of 68.9% (kappa = 0.49) and the LightGBM model had an accuracy of 68.9% (kappa = 0.51). Predictive maps derived from these differed in the concentration of absences, with LightGBM predicting an underestimation across all four survey areas of both partial and full coverage (Figure 7).
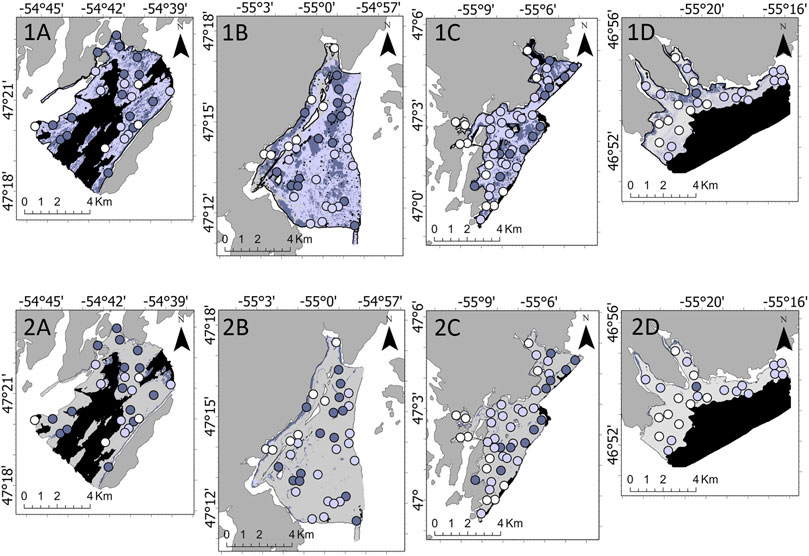
FIGURE 7. Predicted absence (white), partial coverage (light purple), and full coverage (dark purple) of non-geniculate crustose coralline algae (CCA) by the 1) Random Forest and 2) Light Gradient Boosting Machine models across the four target survey areas: (A) Rushoon, (B) D’Argent Bay, (C) Burin, and (D) St. Lawrence. No predictions were developed where black is seen, as depth exceeded the range established in CCA model development.
The accuracy of all marine algae models was increased with the introduction of fine-scale substrate % coverage features. The A. clathratum RF and LightGBM model accuracies increased to 89.7% (kappa = 0.80) and 92.3% (kappa = 0.85), respectively and both the CCA RF and LightGBM accuracies increased to 82.2% (kappa = 0.72).
Species-Environment relationships
Depth was the most important variable for explaining the distribution of epifaunal assemblages, according to the RF model (Figure 8). OPH and MIX were associated with deeper portions of the surveyed areas, while SDR and EPA were generally observed at depths shallower than 50 m. Relationships between EPA and the five most important variables appeared opposite to those observed for the other assemblages (according to the best-preforming RF model) (Figure 9). EPA was the only assemblage that was more prevalent with increased coverage of fine sediment and flat terrain. Assemblages SDR, MIX, and OPH appeared more prevalent at areas of rugged and boulder terrain, according to models. EPA was most prevalent within 2 km of the coast, with decreasing occurrence with greater distance. Unlike SDR and MIX, OPH was most prominent at sites closer to shore, but also occurred at the furthest offshore sites that were sampled.
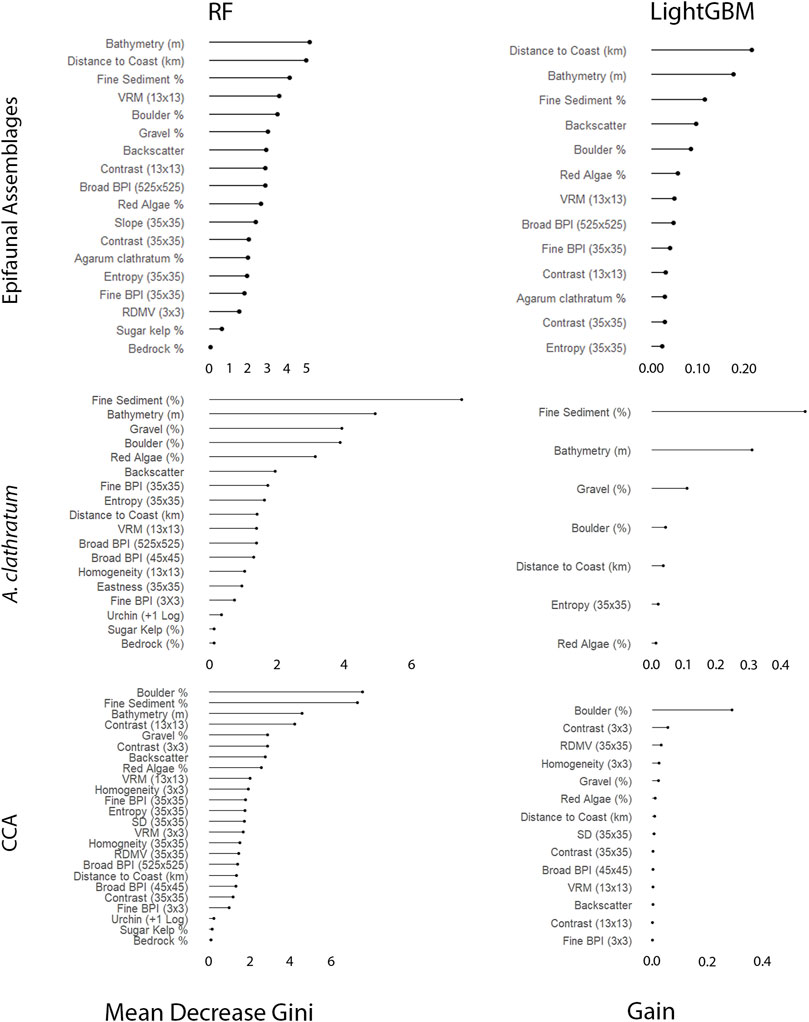
FIGURE 8. Order of variable importance as determined by the Random Forest (RF) and Light Gradient Boosting Machine (LightGBM) for the epifaunal, Agarum clathratum, and non-geniculate crustose coralline algae (CCA).
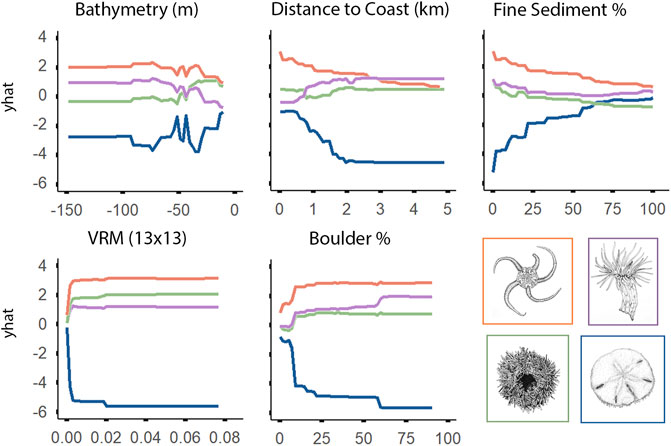
FIGURE 9. Univariate partial dependence plots derived from the Random Forest classification model for the top five most important explanatory environmental features explaining the distribution of individual epifaunal assemblages. The ‘yhat’ axis refers to the value of partial dependence function. The partial response of the epifaunal assemblages to all features is provided in Supplementary Figure S1.
Fine-scale substrate % coverage was identified as being even more important than depth to explain the spatial patterns of both A. clathratum and CCA models (Figure 8). Specifically, the presence of even low % coverage of fine sediment influences the presence of both A. clathratum and CCA. The predicted presence of either marine algae was higher with increasing coverage of harder substrates, including both boulder (%) and gravel (%) coverage (Figure 10).
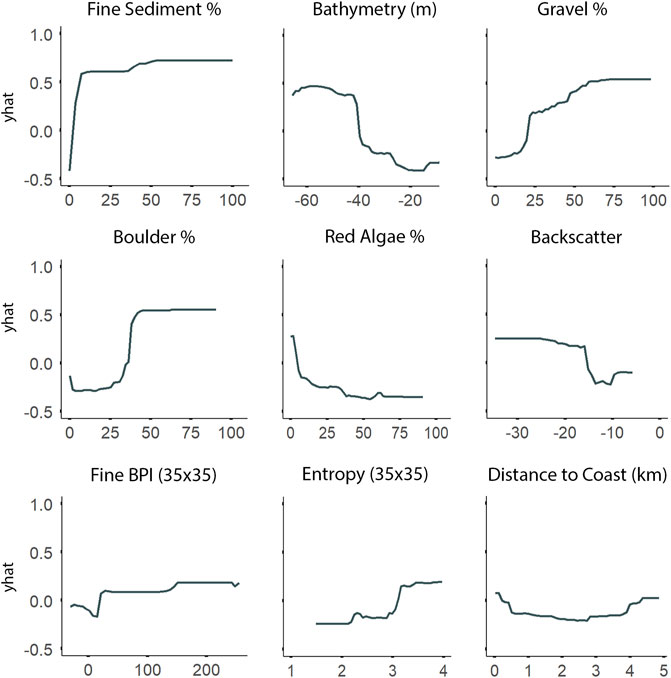
FIGURE 10. Partial dependence plots derived from the Random Forest classification model for the most important explanatory environmental features describing the distribution of Agarum clathratum. The ‘yhat’ axis refers to the value of partial dependence function. The partial response of A. clathratum to all features is provided in Supplementary Figure S2.
According to both RF and LightGBM models, bathymetry was the second most important variable influencing the distribution of A. clathratum, with the majority of occurrences constrained to depths of 15–48 m. Bathymetry appeared less important for predicting CCA distribution in the RF model, and was not included at all in the CCA LightGBM model. The model suggested that softer sediments were more influential than harder substrate in determining the presence of A. clathratum (Figure 10). For CCA models, partial and full coverage were associated with higher backscatter values, while sites with absences were characterized by lower backscatter (Figure 11).
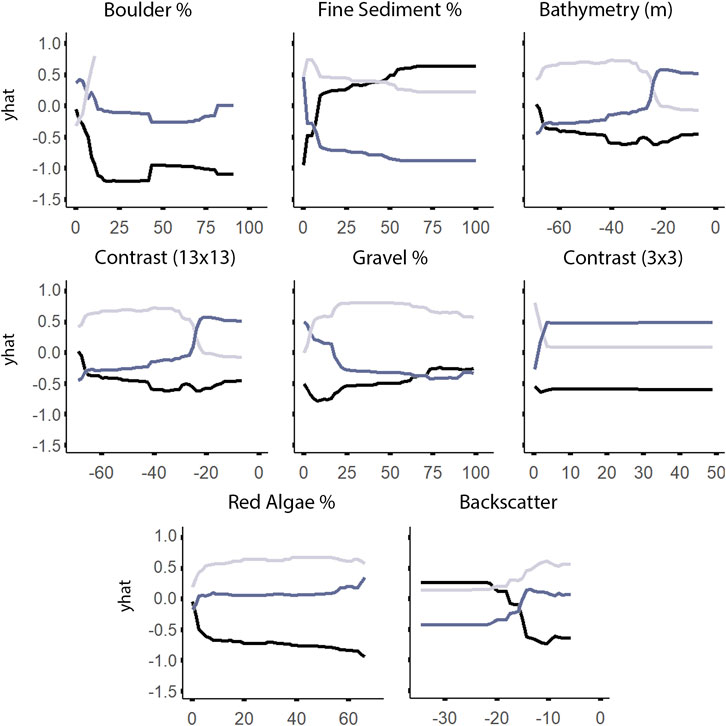
FIGURE 11. Univariate partial dependence plots derived from the Random Forest classification model for the most important explanatory environmental features describing the distribution of non-geniculate crustose coralline algae (CCA). The ‘yhat’ axis refers to the value of partial dependence function. The partial response of absence, partial coverage, and full coverage of CCA to all features is provided in Supplementary Figure S3.
Discussion
The west coast of Placentia Bay hosts a diverse and heterogeneous collection of benthic invertebrates, with prominent populations of A. clathratum and substantial CCA coverage. Fine-scale (<1 m) substrate features appear highly important for explaining observed spatial patterns. Performance improved in all cases when substrate features were included in the models, yet ultimately, these variables could not be used for continuous spatial prediction due to their discontinuous coverage. This highlights the importance of fine-scale substrate as a benthic habitat driver. Nonetheless, the models developed in this study provide valuable insight into the species-environment relationships driving the distribution of the heterogeneous benthic biota found in Placentia Bay–a necessary step in establishing a baseline for monitoring changes over time.
Depth has often been identified as an important variable in explaining benthic biota distribution (Bekkby et al., 2009; Gorman et al., 2013; Neves et al., 2014; Schückel et al., 2015; Bekkby et al., 2019). However, depth is likely acting as a proxy for other co-varying and harder to characterize variables, such as light availability, temperature, salinity, wave action, or ice scouring (Elith and Leathwick, 2009; Sandman et al., 2013). For example, in the case of the spatial distribution of A. clathratum and CCA within Placentia Bay, depth likely acts as a proxy for light attenuation. A. clathratum extends to greater depths than most kelp species due to its shade-tolerance (Krause-Jensen et al., 2019), with an observed depth limit in this study of up to 66 m, consistent with findings along coastal Greenland (Krause-Jensen et al., 2019). CCA are even more tolerant of low-light conditions due to their low photosynthetic capacity (Littler et al., 1985; Roberts et al., 2002; Nelson, 2009). CCA are found within most coastal habitats (Littler et al., 1985), including Antarctica (Zaneveld and Sanford, 1965; Schwarz et al., 2005; Castellan et al., 2021), and are observed at depths greater than any other local marine algae species (McConnaughey and Whelan, 1997). This may explain the exclusion of bathymetry from the CCA LightGBM model. Dean et al., 2015 observed a similar pattern with coralline algae along the Great Barrier Reef, where depth had little effect on their distribution compared to physical features.
In the case of EPA, shallower depths may be associated with a greater abundance of food for the typifying species E. parma, such as benthic diatoms, which are known to migrate to shallowed depths as they grow older and larger (Cabanac and Himmelman, 1996; Cabanac and Himmelman, 1998). In contrast, OPH and MIX were found across most of the depth range surveyed. The dominant epifauna of these assemblages included porifera and cnidarians, with dense ophiuroid beds in OPH and abundant Hormathia sp.1 aggregations in MIX. As these epifauna rely on filter- and suspension-feeding techniques, their survival may depend on food transport from the euphotic zone (Maldonado et al., 2017). Food transport may be constrained by both hydrography and depth in coastal environments (Grebmeier and Barry, 1991; Graf, 1992; Piepenburg, 2005; Sswat et al., 2015).
Mean current circulation in Placentia Bay is counterclockwise, with currents entering on the eastern coast and exiting on the west (Ma et al., 2012). The west coast is therefore subject to upwelling currents that may be beneficial to filter- and suspension feeders (Ma et al., 2012), such as the porifera and cnidarians (i.e. Hormathia sp.1) observed within the OPH and MIX assemblages. Sponge aggregations (Hogg et al., 2010) and Hormathia digitata (Dunlop et al., 2020) are known to associate with strong, nutrient-enriched currents delivering a constant food supply–though the current strength in these small embayments is strongly influenced by the complex bathymetry and shoreline (Largier, 2020). A. clathratum and CCA were found on westward-facing substrate in line with Placentia Bay’s south westerly currents [Supplementary Figures S2,3]. Kelp beds are well-adapted to environments of moderate wave exposure (Gorman et al., 2013; Bekkby et al., 2019), as wave action boosts nutrient supply and uptake, ensures continuous light exposure (Hurd et al., 1996; Hepburn et al., 2007; Bekkby et al., 2019), and reduce survivability of epiphytes (Strand and Weisner, 1996). However, at exposed areas such as St. Lawrence, which may experience excessive wave action, growth may be inhibited due to abrasions or transport (Marrack, 1999; Sañé et al., 2016).
With the exception of EPA, hard substrates were associated with suitable habitat for all epifaunal assemblages, A. clathratum, and CCA. Fine sediments and sedimentation may reduce habitat suitability for these sessile organisms by inhibiting feeding strategies. Large kelps such as A. clathratum additionally require a stable foundation for holdfast attachment to endure currents and storm surge (Morrison et al., 2009; Watanabe et al., 2014; Masteller et al., 2015). In contrast, E. parma would preferentially inhabit coarse sand areas (Stanley and James, 1971; Sisson et al., 2002), enabling filtering where coarse sand traps particulate matter for consumption without excess fouling (Bland et al., 2019), and burying to avoid predation (Manderson et al., 1999; Pappal et al., 2012) and damaging storm surge (O’Neill, 1978). Distance from the coast may act as a surrogate for sedimentation rate (Stephens and Diesing, 2015; Misiuk et al., 2018). In the case of CCA, growth occurs only on hard substrate (Connell, 2005; Gagnon et al., 2012, Jørgensbye and Halfar, 2017), with fine sediment additionally reducing light availability for photosynthesis (Konar and Iken, 2005; Jørgensbye and Halfar, 2017). Smaller grain sizes, like gravel, are more likely to be reworked in a dynamic environment, limiting consistent light exposure and increasing physical damage and making it more difficult for CCA to establish growth due to abrasion (Foster, 2001; Hetzinger et al., 2006).
Removal of fine-scale substrate features from the RF models produced a substantial drop in predictive accuracy (∼25%). Owing to the highly heterogeneous nature of the seafloor in Placentia Bay, the ability to capture increased structural complexity can allow for the identification of potential ‘keystone structures’, (i.e. structures that directly bolster species richness) (Tews et al., 2004). For example, ‘Hormathia sp.1’ was often seen attached to the sporadic boulders scattered across the silt-covered seafloor in the deep channels within Rushoon. Drop stones resulting from glacial retreat (Shaw et al., 2011) have been shown to increase diversity of more homogeneous sediment dominated areas (Meyer et al., 2016). This fine-scale feature cannot currently be captured by acoustic surveying techniques such as MBES, but new methods such as synthetic apertures sonar may provide this capability (Gini et al., 2021).
Increased physical habitat complexity has previously been linked to increases in abundance and diversity (Barry and Dayton, 1991; Bracewell et al., 2018). In coastal environments, rocky shores play a critical role in structuring coastal benthic communities (Menge, 1982; Underwood and Denley, 1984). Within Placentia Bay, boulder and gravel fields occur along the offshore extent of D’Argent Bay and Burin and along the shoreline of Rushoon and St. Lawrence. These fields may provide a level of stability and topographical diversity that could increase structural availability for sessile invertebrates (MacArthur and Wilson, 1967; Liversage and Chapman, 2018; Franz et al., 2021), such as the sponges and anemones observed in Rushoon and St. Lawrence. These areas were found to be associated with a higher presence of arcto-boreal species, such as the different morphotypes of porifera and anthozoan as well as species of echinoderms and crustaceans. 1,064 individuals from 25 morphotypes of the Phylum Porifera were recorded in these areas, further increasing habitat complexity by acting as biogenic substrate for associated fauna (Buhl-Mortensen et al., 2017; Hogg et al., 2010, Maldonado et al., 2017). Those areas may represent rocky reefs–an ecologically important habitat characterized as a subtidal natural hard substrate, which has been linked to increased biodiversity (Taylor, 1998; Kostylev et al., 2005; Wahl, 2009).
Rocky reefs from temperate to Arctic environments are often covered with canopy-forming kelp species. Likely, the dense coverage of A. clathratum observed in the subtidal would also contribute to increased epifaunal richness (Blain and Gagnon, 2014; Teagle et al., 2017). Fewer species were observed than expected in the SDR assemblage, but this may have resulted from limited visibility of the seafloor due to obstruction by A. clathratum blades.
Few other brown kelp species were observed during ground-truthingan exception being two sites in Rushoon fully covered by the sugar kelp S. latissima. A. clathratum was often found to co-exist with red algae though. The potential for increased coverage by red algae is an example of an observable change made possible by comparing to the baseline established in this study. As compared to kelp beds, low-lying red algae turfs are a fast-growing and stress-tolerant opportunistic group (Airoldi, 1998; Filbee-Dexter and Wernberg, 2018), and high turnover rates allow them to succeed kelp forests that have been weakened by thermal stress (Scheibling and Gagnon, 2006; Filbee-Dexter et al., 2016; Wernberg et al., 2019). Kelp is more susceptible to stress due to ocean warming and increased storm activity, concurrent with cyclical herbivorous pressure by S. droebachiensis (Filbee-Dexter and Wernberg, 2018). Once it supersedes kelp, red algae turfs cover the substrate, preventing kelp from resettling and inducing phase shifts to environments with reduced oxygen and increased sediment accumulation (Gorgula and Connell, 2004), further negatively impacting settlement of kelp spores (Norton and Fetter, 1981; Gorman and Connell, 2009; Connell and Russell, 2010). Kelp is susceptible to stress due to ocean warming and increased storm activity, concurrent with cyclical herbivorous pressure by S. droebachiensis. No observations of turf-dominated areas show shifting back to kelp (Filbee-Dexter and Wernberg, 2018).
The performances of the RF algorithm, which is well-established in the field of benthic habitat mapping, and the newer LightGBM were comparable considering only model accuracy and variable importance estimates. However, disagreements occurred over the predictions of the rarer assemblages, especially when both model types were used to develop predictive maps. LightGBM is a powerful modelling technique, but it was developed to manage large datasets (e.g., 1,00,000 s of observations) (Ke et al., 2017). Sample sizes of this magnitude are uncommon in marine ecology [Benkendorf and Hawkins, 2020; Luan et al., 2020]. The small sample size in this study likely resulted in overfitting of the LightGBM models, apparent, for example, in the prediction of CCA absences. Ground-truthing samples indicated extensive full and partial coverage of CCA in D’Argent Bay and Burin; however, LightGBM predicted very sparse CCA coverage for most of the areas.
LightGBM advertises faster training speed, low memory usage (Ke et al., 2017; McCarty et al., 2020), and in-depth control over boosting and model learning via tunable parameters. The latter point, though, requires the user to be confident in their understanding of each parameter. In contrast, RF has only two parameters that generally require manipulation, and even appears quite robust to these in practice, making it a more user-friendly algorithm (Brieman, 2001; Liaw and Weiner, 2002). RF has demonstrated repeated success in benthic habitat mapping studies comparing techniques (Lucieer et al., 2013; Robert et al., 2015; Rooper et al., 2017; Misiuk et al., 2019; Pillay et al., 2020; Shang et al., 2021). However, RF may be biased towards computational efficiency in favor of accuracy (Fernandez-Delgado et al., 2011; Wainberg et al., 2016). The comparison carried out here supports the continued use of RF as a modelling technique that can perform well with the limited amount of data that is common in marine studies. It will be of great interest to determine whether the newer LightGBM algorithm shows better performance with larger datasets.
The subtidal zone of western Placentia Bay is host to a diverse and heterogeneous benthic environment that supports multiple ecosystem services. The baseline information provided by this study provides information necessary to monitor potential changes in biodiversity and ecosystem function within the Placentia Bay EBSA. The communities of OPH and MIX are notable for their epifaunal diversity, comprising structure-forming sessile invertebrates. Biogenic structural heterogeneity is often linked to increased biodiversity (Buhl-Mortensen et al., 2010; Thomsen et al., 2010; Lefcheck et al., 2017; Kazanidis et al., 2021), which may support ecosystem health. Coastal townships of Placentia Bay also rely on the health of this benthic ecosystem, which support local livelihoods, but which may be threatened under increased anthropogenic activity (e.g. aquaculture, oil shipping) and shifts in ocean temperature and pH (Doney et al., 2009). Proactive management action may mitigate potential detrimental changes brought on by these stressors.
Conclusion
The predictive maps developed in this study indicate a heterogenous benthic ecosystem in the western part of the Placentia Bay EBSA, composed of habitat-forming biotasuch as marine algae and sessile invertebrates including porifera and anemones. This contributes substantiallyto baseline understanding of marine epifaunal distributions and richness in a subtidal area of recognized ecological and socio-economic importance. Concurrent with predictive geospatial modelling, investigation of fine-scale (<1 m) substrate characteristics highlight their importance as benthic habitat drivers. All models tested here performed better with the addition of discrete fine-scale substrate observations compared to the use of spatially continuous acoustic backscatter proxies. The LightGBM models had higher accuracies, but often demonstrated signs of overfitting as compared with the predictive maps derived from the RF models. The fundamental knowledge derived from these models provide information that is critically needed for monitoring the health of the Placentia Bay EBSA over time.
Data availability statement
The datasets presented in this study can be found in online repositories. The names of the repository/repositories and accession number(s) can be found below: https://slgo.ca/en/coastal-environment-baseline-program/.
Author contributions
JM-M collected ground-truthing data for Burin and St. Lawrence, with Rushoon and D’Argent Bay collected by SN. Acoustic surveying of all study areas was conducted on the R/V Cartwright by AT and Kirk Regular (latter not included). Data processing, analysis, and model development and interpretation was conducted by JM-M with assistance from SN and BM. JM-M and SN collaborated in creating a species guide for the identification of all observed benthic flora and fauna (>2 cm) to the lowest taxonomic level possible. BM assisted with processing multibeam echosounder data from the survey areas. Project initiation with the Fisheries and Oceans Canada and the organization of fieldwork was led by KR. All writing was inititally done by JM-M with editorial input from SN, AT, BM, KR, EE, and PG.
Conflict of interest
The authors declare that the research was conducted in the absence of any commercial or financial relationships that could be construed as a potential conflict of interest.
Publisher’s note
All claims expressed in this article are solely those of the authors and do not necessarily represent those of their affiliated organizations, or those of the publisher, the editors and the reviewers. Any product that may be evaluated in this article, or claim that may be made by its manufacturer, is not guaranteed or endorsed by the publisher.
Supplementary material
The Supplementary Material for this article can be found online at: https://www.frontiersin.org/articles/10.3389/fenvs.2022.999483/full#supplementary-material
References
Agatsuma, Y. (2000). Food consumption and growth of the juvenile sea urchin Strongylocentrotus intermedius. Fish. Sci. 66, 467–472. doi:10.1046/j.1444-2906.2000.00075.x
Airoldi, L. (1998). Roles of disturbance, sediment stress, and substratum retention on spatial dominance in algal turf. Ecology 79, 2759–2770. doi:10.1890/0012-9658(1998)079[2759:rodssa]2.0.co;2
Alexandridis, N., Bacher, C., Desroy, N., and Jean, F. (2017). Building functional groups of marine benthic macroinvertebrates on the basis of general community assembly mechanisms. J. Sea Res. 121, 59–70. doi:10.1016/j.seares.2017.01.007
Allouche, O., Tsoar, A., and Kadmon, R. (2006). Assessing the accuracy of species distribution models: Prevalence, kappa and the true skill statistic (TSS). J. Appl. Ecol. 43, 1223–1232. doi:10.1111/j.1365-2664.2006.01214.x
Auster, P. J., and Langton, R. W. (1998). The effects of fishing on fish habitat. Am. Fish. Soc. Symposium 22, 150–187.
Barbier, E. B., Hacker, S. D., Kennedy, C., Koch, E. W., Stier, A. C., and Silliman, B. R. (2011). The value of estuarine and coastal ecosystem services. Ecol. Monogr. 81, 169–193. doi:10.1890/10-1510.1
Barry, J. P., and Dayton, P. H. (1991). “Physical heterogeneity and the organisation of marine Communities,” in Ecological heterogeneity. Editors J. Kolasa,, and S. T. A. Pickett (New York, NY: Springer-Verlag), 270–320.
Bégin, C., Johnson, L. E., and Himmelman, J. H. (2004). Macroalgal canopies: Distribution and diversity of associated invertebrates and effects on the recruitment and growth of mussels. Mar. Ecol. Prog. Ser. 271, 121–132. doi:10.3354/meps271121
Bekkby, T., Rinde, E., Erikstad, L., and Bakkestuen, V. (2009). Spatial predictive distribution modelling of the kelp species Laminaria hyperborea. ICES J. Mar. Sci. 66, 2106–2115. doi:10.1093/icesjms/fsp195
Bekkby, T., Smit, C., Gundersen, H., Rinde, E., Steen, H., Tveiten, L., et al. (2019). The abundance of kelp is modified by the combined impact of depth, waves and currents. Front. Mar. Sci. 6, 1–10. doi:10.3389/fmars.2019.00475
Benkendorf, D. J., and Hawkins, C. P. (2020). Effects of sample size and network depth on a deep learning approach to species distribution modeling. Ecol. Inf. 60, 101137. doi:10.1016/j.ecoinf.2020.101137
Bennett, N. J., Cisneros-Montemayor, A. M., Blythe, J., Silver, J. J., Signh, G., Andrews, N., et al. (2019). Towards a sustainable and equitable blue economy. Nat. Sustain. 2, 991–993. doi:10.1038/s41893-019-0404-1
Bevilacqua, S., Ugland, K. I., Plicanti, A., Scuderi, D., and Terlizzi, A. (2018). An approach based on the total-species accumulation curve and higher taxon richness to estimate realistic upper limits in regional species richness. Ecol. Evol. 8, 405–415. doi:10.1002/ece3.3570
Bilyard, G. R. (1987). The value of benthic infauna in marine pollution monitoring studies. Mar. Pollut. Bull. 18, 581–585. doi:10.1016/0025-326X(87)90277-3
Blain, C., and Gagnon, P. (2014). Canopy-forming seaweeds in urchin-dominated systems in eastern Canada: Structuring forces or simple prey for keystone grazers. PLoS ONE 9, e98204. doi:10.1371/journal.pone.0098204
Bland, A., Konar, B., and Edwards, M. (2019). Spatial trends and environmental drivers of epibenthic shelf community structure across the Aleutian Islands. Cont. Shelf Res. 175, 12–29. doi:10.1016/j.csr.2019.01.006
Blondel, P., and Sichi, O. G. (2009). Textural analyses of multibeam sonar imagery from Stanton Banks. Northern Ireland continental shelf. Appl. Acoust. 70, 1288–1297. doi:10.1016/j.apacoust.2008.07.015
Botello, A. V., Soto, L. A., Ponce-Velez, G., and Villanueva, S. (2015). Baseline for PAHs and metals in NW Gulf of Mexico related to the Deepwater Horizon oil spill. Estuar. Coast. Shelf Sci. 156, 124–133. doi:10.1016/j.ecss.2014.11.010
Bracewell, S. A., Clark, G. F., and Johnston, E. L. (2018). Habitat complexity effects on diversity and abundance differ with latitude: An experimental study over 20 degrees. Ecology 99, 1964–1974. doi:10.1002/ecy.2408
Brey, T. (2012). A multi-parameter artificial neural network model to estimate macrobenthic invertebrate productivity and production. Limnol. Oceanogr. Methods 10, 581–589. doi:10.4319/lom.2012.10.581
Brown, C. J., Sameoto, J. A., and Smith, S. J. (2012). Multiple methods, maps, and management applications: Purpose made seafloor maps in support of ocean management. J. Sea Res. 72, 1–13. doi:10.1016/j.seares.2012.04.009
Buhl-Mortensen, L., Vanreusel, A., Gooday, A. J., Levin, L. A., Priede, I. G., Buhl-Mortensen, P., et al. (2010). Biological structures as a source of habitat heterogeneity and biodiversity on the deep ocean margins. Mar. Ecol. Berl. 31, 21–50. doi:10.1111/j.1439-0485.2010.00359.x
Buhl-Mortensen, P., Buhl-Mortensen, L., and Purser, A. (2017). “Trophic ecology and habitat provision in cold-water coral ecosystems,” in Marine animal forests. Editors S. L. RossiBramanti, A. Gori, and C. Orejas (Cham: Springer).
Cabanac, A., and Himmelman, J. H. (1998). Directional movement of the sand dollar Echinarachnius parma. Ophelia 48, 93–102. doi:10.1080/00785236.1998.10428679
Cabanac, A., and Himmelman, J. H. (1996). Population structure of the sand dollar Echinarachnius parma in the subtidal zone of the northern Gulf of St. Lawrence, eastern Cananda. Can. J. Zool. 74, 698–709. doi:10.1139/z96-079
Calvert, J., Strong, J. A., Service, M., McGonigle, C., and Quinn, R. (2015). An evaluation of supervised and unsupervised classification techniques for marine benthic habitat mapping using multibeam echosounder data. ICES J. Mar. Sci. 72, 1498–1513. doi:10.1093/icesjms/fsu223
Castellan, G., Angeletti, L., Canese, S., Mazzoli, C., Montagna, P., Schiaparelli, S., et al. (2021). Visual imaging of benthic carbonate-mixed factories in the ross sea region marine protected area, Antarctica. Minerals 11, 833. doi:10.3390/min11080833
Chenelot, H., Jewett, S. C., and Hoberg, M. K. (2011). Macrobenthos of the nearshore aluetian archipelago, with emphasis on invertebrates associated with clathromorphum nereostratum (rhodophyta, corallinaceae). Mar. Biodivers. 41, 413–424. doi:10.1007/s12526-010-0071-y
Cohen, J. (1960). A coefficient of agreement for nominal scales. Educ. Psychol. Meas. 20, 37–46. doi:10.1177/001316446002000104
Congalton, R. G. (1991). A review of assessing the accuracy of classifications of remotely sensed data. Remote Sens. Environ. 37, 35–46. doi:10.1016/0034-4257(91)90048-B
Connell, S., and Russell, B. D. (2010). The direct effects of increasing CO2 and temperature on non-calcifying organisms: Increasing the potential for phase shifts in kelp forests. Proc. R. Soc. B 277, 1409–1415. doi:10.1098/rspb.2009.2069
Connell, S. D. (2005). Assembly and maintenance of subtidal habitat heterogeneity: Synergistic effects of light penetration and sedimentation. Mar. Ecol. Prog. Ser. 289, 53–61. doi:10.3354/meps289053
Connell, S. D., Foster, M. S., and Airoldia, L. (2014). What are algal turfs? Towards a better description of turfs. Mar. Ecol. Prog. Ser. 495, 299–307. doi:10.3354/meps10513
Costanza, R., d'Arge, R., deGroot, R., Farber, S., Grasso, M., Hannon, B., et al. (1997). The value of the world's ecosystem services and natural capital. Nature 387, 253–260. doi:10.1038/387253a0
De la Torriente, A., Serrano, A., Fernanzdez-Salas, L. M., Garcia, M., and Aguilar, R. (2018). Identifying epibenthic habitats on the Seco de los Olivos Seamount: Species assemblages and environmental characteristics. Deep Sea Res. Part I Oceanogr. Res. Pap. 135, 9–22. doi:10.1016/j.dsr.2018.03.015
Dean, A. J., Steneck, R. S., Tager, D., and Pandolfi, J. M. (2015). Distribution, abundance and diversity of crustose coralline algae on the Great Barrier Reef. Coral Reefs 34, 581–594. doi:10.1007/s00338-015-1263-5
Degenhardt, F., Seifert, S., and Szymczak, S. (2019). Evaluation of variable selection methods for random forests and omics data sets. Brief. Bioinform. 20, 492–503. doi:10.1093/bib/bbx124
Degraer, S., Verfaillie, E., Willems, W., Adiaens, E., Vincx, M., and Van Lancker, V. (2008). Habitat suitability modelling as a mapping tool for macrobenthic communities: An example from the Belgian part of the North Sea. Cont. Shelf Res. 28, 369–379. doi:10.1016/j.csr.2007.09.001
DFO (2004). Identification of ecologically and biologically significant areas. Ottawa, ON. DFO Canadian Science Advisory Secretariat. Ecosystem Status Report 2004/006.
DFO (2018). Identification of habitat important to the Blue whale in the western north atlantic. Ottawa, ON. DFO Canadian Science Advisory Secretariat Science Advisory Report #2018/003.
DFO (2007). Placentia Bay integrated management plan. Ottawa, ON. DFO Canadian Science Advisory Secretariat 2007/1292.
DFO (2019). Re-Evaluation of the Placentia Bay-Grand Banks area to identify ecologically and biologically significant areas. St. John’s, NL. DFO Canadian Science Advisory Secretariat Science Advisory Report. 2019/040.
DFO (2016). Refinement of information relating to ecologically and biologically significant areas (EBSAs) identified in the Newfoundland and Labrador (NL) bioregion. St. John’s, NL. DFO Canadian Science Advisory Secretariat #2016/032.
DFO (2012a). State of the ocean for the Placentia Bay – grand banks large ocean management area, 2983. Ottawa, ON: DFO Canadian Manuscript Report of Fisheries and Aquatic Sciences. viii + 34 p.
DFO (2012b). Using satellite tracking data to define important habitat for leatherback turtles in Atlantic Canada. Ottawa, ON. DFO Canadian Science Advisory Secretariat Science Advisory Report #2012/036.
Diesing, M., and Thorsnes, T. (2017). Mapping of cold-water coral carbonate mounds based on geomorphometric features: An object-based approach. Geosciences 8, 34. doi:10.3390/geosciences8020034
Dolan, M. F. J. (2012). Calculation of slope angle from bathymetry data using GIS – effects of computation algorithms, data resolution and analysis scale. Trondheim, Norway: Geological Survey of Norway. NGU Report, 2012.041.
Dolan, M. F. J., and Lucieer, V. L. (2014). Variation and uncertainty in bathymetric slope calculations using geographic information systems. Mar. Geod. 37, 187–219. doi:10.1080/01490419.2014.902888
Doney, S. C., Fabry, V. J., Feely, R. A., and Kleypas, J. A. (2009). Ocean acidification: The other CO2 problem. Ann. Rev. Mar. Sci. 1, 169–192. doi:10.1146/annurev.marine.010908.163834
Dunlop, K., Harendza, A., Plassen, L., and Keeley, N. (2020). Epifaunal habitat associations on mixed and hard bottom substrates in coastal waters of northern Norway. Front. Mar. Sci. 7, 568802. doi:10.3389/fmars.2020.568802
Elith, J., and Leathwick, J. R. (2009). Species distribution models: Ecological explanation and prediction across space and time. Annu. Rev. Ecol. Evol. Syst. 40, 677–697. doi:10.1146/annurev.ecolsys.110308.120159
Fernandez-Delgado, M., Riberio, J., Cernadas, E., and Ameneiro, S. B. (2011). Direct parallel perceptions (DPP): Fast analytical calculation of the parallel perceptions weights with margin control for classification tasks. Neural Netw. IEEE Trans.22, 1837–1848. doi:10.1109/TNN.2011.2169086
Filbee-Dexter, K., Feehan, C. J., and Scheibling, R. E. (2016). Large-scale degradation of a kelp ecosystem in an ocean warming hotspot. Mar. Ecol. Prog. Ser. 543, 141–152. doi:10.3354/meps11554
Filbee-Dexter, K., and Scheibling, R. E. (2014). Sea urchin barrens as alternative stable states of collapsed kelp ecosystems. Mar. Ecol. Prog. Ser. 495, 1–25. doi:10.3354/meps10573
Filbee-Dexter, K., and Wernberg, T. (2018). Rise of turfs: A new battlefront for globally declining kelp forests. Bioscience 68, 64–76. doi:10.1093/biosci/bix147
Foster, M. S. (2001). Rhodoliths: Between rocks and soft places. J. Phycol. 37, 659–667. doi:10.1046/j.1529-8817.2001.00195.x
Fox, J., Lambert, G., and Salomonsen, H. (2014). Basic identification guide of common bycatch species – fishing intensity trial. Bangor, United kingdom: Bangor University.
Franz, M., von Ronn, G. A., Barboza, F. R., Karez, R., Reimers, H. C., Schwarzer, K., et al. (2021). How do geological structure and biological diversity relate? Benthic communities in boulder fields of the southwestern baltic sea. Estuaries Coasts 44, 1994–2009. doi:10.1007/s12237-020-00877-z
Freiwald, A. (1993). Coralline algal maerl frameworks-Islands within the phaeophytic kelp belt. Facies 29, 133–148. doi:10.1007/BF02536925
Friedman, J., Hastie, T., and Tibshirani, R. (2001). The elements of statistical learning, 1. Berlin: Springer.
Gagnon, P., Himmelman, J. H., and Johnson, L. E. (2003). Algal colonization in urchin barrens: Defense by association during recruitment of the Brown alga Agarum cribrosum. J. Exp. Mar. Biol. Ecol. 290, 179–196. doi:10.1016/S0022-0981(03)00077-7
Gagnon, P., Matheson, K., and Stapleton, M. (2012). Variation in rhodolith morphology and biogenic potential of newly discovered rhodolith beds in Newfoundland and Labrador (Canada). Bot. Mar. 55, 85–99. doi:10.1515/bot-2011-0064
Gini, C., Robert, K., Jamieson, J., and Dillon, J. (2021). Interferometric synthetic aperture sonar as a tool for seafloor geological mapping on the grand banks offshore atlantic Canada: Preliminary results. [Conference presentation] European Geophysical Union General Assembly, virtual. St. John’s, NL: Memorial University of Newfoundland.
Gorgula, S. K., and Connell, S. D. (2004). Expansive covers of turf-forming algae on human-dominated coast: The relative effects of increasing nutrient and sediment loads. Mar. Biol. 145, 613–619. doi:10.1007/s00227-004-1335-5
Gorman, D., Bajjouk, T., Populus, J., Vasquez, M., and Erhold, A. (2013). Modeling kelp forest distribution and biomass along temperate rocky coastlines. Mar. Biol. 160, 309–325. doi:10.1007/s00227-012-2089-0
Gorman, D., and Connell, S. D. (2009). Recovering subtidal forests in human-dominated landscapes. J. Appl. Ecol. 46, 1258–1265. doi:10.1111/j.1365-2664.2009.01711.x
Gosner, K. L. (1979). A field guide to the atlantic seashore: Invertebrates and seaweeds of the atlantic coast from the Bay of fundy to cape hatteras; text and illustrations. Boston: Houghton Mifflin.
Grebmeier, J. M., and Barry, J. P. (1991). The influence of oceanographic processes on pelagic-benthic coupling in polar regions: A benthic perspective. J. Mar. Syst. 2, 495–518. doi:10.1016/0924-7963(91)90049-z
Hajializadeh, P., Safaie, M., Naderloo, R., Shojaei, M. G., Gammal, J., Villnas, A., et al. (2020). Species composition and functional traits of macrofauna in different mangrove habitats in the Persian gulf. Front. Mar. Sci. 7, 575480. doi:10.3389/fmars.2020.575480
Haralick, R. M., Shanmugam, K., and Dinstein, I. (1973). Textural features for image classification. IEEE Trans. Syst. Man. Cybern. SMC-3, 610–621. doi:10.1109/TSMC.1973.4309314
Harvey-Clark, C. (1997). Eastern tidepool & reef: North-central atlantic marine life. Surrey: Hancock House Publishers.
Hepburn, C. D., Holborow, J. D., Wing, S. R., Frew, R. D., and Hurd, C. L. (2007). Exposure to waves enhances the growth rate and nitrogen status of the giant kelp Macrocystis pyrifera. Mar. Ecol. Prog. Ser. 339, 99–108. doi:10.3354/meps339099
Hetzinger, S., Halfar, J., Riegl, B., and Godinez-Orta, L. (2006). Sedimentology and acoustic mapping of modern rhodolith facies on a non-tropical carbonate shelf (Gulf of California, Mexico). J. Sediment. Res. 76, 670–682. doi:10.2110/jsr.2006.053
Hobson, R. D. (1972). “Surface roughness in topography: A quantitative approach,” in Spatial analysis in geomorphology. Editor R. J. Chorley (London: Methuen & Co.), 221–245.
Hogg, M. M., Tendal, O. S., Conway, K. W., Pomponi, S. A., van Soest, R. W. M., Gutt, J., et al. (2010). Deep-sea sponge-grounds: Reservoirs of biodiversity. Cambridge, UK: UNEP-WCMC. UNEP-WCMC Biodiversity Series No.32.
Howell, K. L., Davies, J. S., Allcock, A. L., Braga-Henriques, A., Buhl-Mortensen, P., Carreiro-Silva, M., et al. (2019). A framework for the development of a global standardised marine taxon reference image database (SMarTaR-ID) to support image-based analyses. PLoS ONE 14, e0218904. doi:10.1371/journal.pone.0218904
Hurd, C. L., Harrison, P. J., and Druehl, K. D. (1996). Effect of seawater velocity on inorganic nitrogen uptake by morphologically distinct forms of Macrocystis intergrifolia from wave-sheltered and exposed sites. Mar. Biol. 126, 205–214. doi:10.1007/BF00347445
Iken, K., Bluhm, B., and Dunton, K. (2010). Benthic food-web structure under differing water mass properties in the southern Chukchi Sea. Deep Sea Res. Part II Top. Stud. Oceanogr. 57, 71–85. doi:10.1016/j.dsr2.2009.08.007
Ilich, A. R., Brizzolara, J. L., Grasty, S. E., Gray, J. W., Hommeyer, M., Lembke, C., et al. (2021). Integrating towed underwater video and multibeam acoustics for marine benthic habitat mapping and fish population estimation. Geosciences 11, 176. doi:10.3390/geosciences11040176
Janowski, L., Wroblewski, R., Dworniczak, J., Kolakowski, M., Rogowska, K., Wojcik, M., et al. (2021). Offshore benthic habitat mapping based on object-based image analysis and geomorphometric approach. A case study from the Slupsk Bank, Southern Baltic Sea. Sci. Total Environ. 801, 149712. doi:10.1016/j.scitotenv.2021.149712
Jørgensbye, H. I. O., and Halfar, J. (2017). Overview of coralline red algal crusts and rhodolith beds (Corallinales, Rhodophyta) and their possible ecological importance in Greenland. Polar Biol. 40, 517–531. doi:10.1007/s00300-016-1975-1
Kazanidis, G., Henry, L. A., and Roberts, J. M. (2021). Hidden structural heterogeneity enhances marine hotspots’ biodiversity. Coral Reefs 40, 1615–1630. doi:10.1007/s00338-021-02114-w
Ke, G., Meng, Q., Finley, T., Wang, T., Chen, W., Ma, W., et al. (2017). LightGBM: A highly efficient gradient boosting decision tree. Adv. Neural Inf. Process. Syst. 2017, 3147–3155.
Kelly, J. R., Scheibling, R. E., Iverson, S. J., and Gagnon, P. (2008). Fatty acid profiles in the gonads of the sea urchin Strongylocentrotus droebachiensis on natural algal diets. Mar. Ecol. Prog. Ser. 373, 1–9. doi:10.3354/meps07746
Konar, B., and Iken, K. (2005). Competitive dominance among sessile marine organisms in a high Arctic boulder community. Polar Biol. 29, 61–64. doi:10.1007/s00300-005-0055-8
Kostylev, V. E., Erlandsson, J., Ming, M. Y., and Williams, G. A. (2005). The relative importance of habitat complexity and surface area in assessing biodiversity: Fractal application on rocky shores. Ecol. Complex. 2, 272–286. doi:10.1016/j.ecocom.2005.04.002
Kostylev, V. E., Todd, B. J., Fader, G. B. J., Courtney, R. C., Cameron, G. D. M., and Pickrill, R. A. (2001). Benthic habitat mapping on the Scotian Shelf based on multibeam bathymetry, surficial geology and sea floor photographs. Mar. Ecol. Prog. Ser. 219, 121–137. doi:10.3354/meps219121
Krause-Jensen, D., Sejr, M. K., Bruhn, A., Rasmussen, M. B., Christensen, P. B., Hansen, J. L. S., et al. (2019). Deep penetration of kelps offshore along the west coast of Greenland. Front. Mar. Sci. 6, 375. doi:10.3389/fmars.2019.00375
Kreft, H., and Jetz, W. (2010). A framework for delineating biogeographical regions based on species distributions. J. Biogeogr. 37, 2029–2053. doi:10.1111/j.1365-2699.2010.02375.x
Krumhansl, K. A., Okamoto, D. K., Rassweiler, A., Novak, M., Bolton, J. J., Cavanaugh, K. C., et al. (2016). Global patterns of kelp forest change over the past half-century. Proc. Natl. Acad. Sci. U. S. A. 113, 13785–13790. doi:10.1073/pnas.1606102113
Kurse, M. B., and Rudnicki, W. R. (2010). Feature selection with the Boruta package. J. Stat. Softw. 26, 1–13. doi:10.18637/jss.v036.i11
Lacharite, M., and Brown, C. J. (2019). Utilizing benthic habitat maps to inform biodiversity monitoring in marine protected areas. Aquat. Conserv. 29, 938–951. doi:10.1002/aqc.3074
Lam-Gordillo, O., Baring, R., and Dittmann, S. (2021). Taxonomic and functional patterns of benthic communities in southern temperate tidal flats. Front. Mar. Sci. 8, 113202. doi:10.3389/fmars.2021.723749
Lamarche, G., Lurton, X., Verdier, A. L., and Augustin, J. M. (2011). Quantitative characterisation of seafloor substrate and bedforms using advanced processing of multibeam backscatter—application to cook strait, New Zealand. Cont. Shelf Res. 31, S93–S109. doi:10.1016/j.csr.2010.06.001
Largier, J. L. (2020). Upwelling bays: How coastal upwelling controls circulation, habitat, and productivity in bays. Ann. Rev. Mar. Sci. 12, 415–447. doi:10.1146/annurev-marine-010419-011020
Lecours, V., Brown, C. J., Devillers, R., Lucieer, V. L., and Edinger, E. N. (2016a). Comparing selections of environmental variables for ecological studies: A focus on terrain attributes. PLoS ONE 11, e0167128. doi:10.1371/journal.pone.0167128
Lecours, V., Devillers, R., Schneider, D. C., Lucieer, V. L., Brown, C. J., and Edinger, E. N. (2015). Spatial scale and geographic context in benthic habitat mapping: Review and future directions. Mar. Ecol. Prog. Ser. 525, 259–284. doi:10.3354/meps11378
Lecours, V., Dolan, M. F. J., Micallef, A., and Lucieer, V. L. (2016b). A review of marine geomorphometry, the quantitative study of the seafloor. Hydrol. Earth Syst. Sci. 20, 3207–3244. doi:10.5194/hess-20-3207-2016
Lecours, V. (2015). Terrain Attribute selection for spatial ecology (TASSE). V.1.0.. Quebec City, Quebec: University of Quebec. doi:10.13140/RG.2.2.15014.52800
Lefcheck, J. S., Marion, S. R., and Orth, R. J. (2017). Restored eelgrass (zostera marina L.) as a refuge for epifaunal biodiversity in mid-western atlantic coastal bays. Estuaries Coasts 40, 200–212. doi:10.1007/s12237-016-0141-x
Legendre, P., and Gallagher, E. D. (2001). Ecologically meaningful transformations for ordination of species data. Oecologia 129, 271–280. doi:10.1007/s004420100716
Legendre, P. (2013). “Indicator species: Computation,” in Encyclopedia of biodiversity. Second Edition, 4, 264–268. doi:10.1016/B978-0-12-384719-5.00430-5
LGL (2018). Fish and fish habitat. Component study for the environmental impact statement of the Placentia Bay atlantic salmon aquaculture project. Marystown, NL: Rep. by LGL Limited, St. John’s, NL for Grieg NL, 71. LGL Rep. FA0144-2+ appendices.
Li, J., Tran, M., and Siwabessy, J. (2016). Selecting optimal random forest predictive models: A case study on predicting the spatial distribution of seabed hardness. PLoS ONE 11, e0149089. doi:10.1371/journal.pone.0149089
Littler, M. M., Littler, D. S., Blair, S. M., and Norris, J. N. (1985). Deepest known plant life discovered on an uncharted seamount. Science 227, 57–59. doi:10.1126/science.227.4682.57
Liversage, K., and Chapman, M. G. (2018). Coastal ecological engineering and habitat restoration: Incorporating biologically diverse boulder habitat. Mar. Ecol. Prog. Ser. 593, 173–185. doi:10.3354/meps12541
Long, R. D., Charles, A., and Stephenson, R. L. (2015). Key principles of marine ecosystem-based management. Mar. Policy 57, 53–60. doi:10.1016/j.marpol.2015.01.013
Lotze, H. K., Lenihan, H. S., Bourque, B. J., Bradbury, R. H., Cooke, R. G., Kay, M. C., et al. (2006). Depletion, degradation, and recovery potential of estuaries and coastal seas. Science 312, 1806–1809. doi:10.1126/science.1128035
Luan, J., Zhang, C. L., Xu, B. D., Xue, Y., and Ren, Y. P. (2020). The predictive performances of random forest models with limited sample size and different species traits. Fish. Res. 227, 105534. doi:10.1016/j.fishres.2020.105534
Lucieer, V., Hill, N. A., Barret, N. S., and Nichol, S. (2013). Do marine substrates ‘look’ and ‘sound’ the same? Supervised classification of multibeam acoustic data using autonomous underwater vehicle images. Estuar. Coast. Shelf Sci. 117, 94–106. doi:10.1016/j.ecss.2012.11.001
Lundberg, S. M., Erion, G., Chen, H., DeGrave, A., Prutkin, J. M., Nair, B., et al. (2020). Explainable AI for trees: From local explanations to global understanding. Nat. Mach. Intell. 2, 56–67. doi:10.1038/s42256-019-0138-9
Lurton, X., and Lamarche, G. (Eds). (2015). Backscatter measurements by seafloor‐mapping sonars. Guidelines and Recommendations. Auckland, New Zealand: GeoHab, 200. Available at: http://geohab.org/wp-content/uploads/2014/05/BSWG-REPORT-MAY2015.pdf.
Ma, Z., Han, G., and DeYoung, B. (2012). Modelling temperature, currents and stratification in Placentia Bay. Atmosphere-Ocean 50, 244–260. doi:10.1080/07055900.2012.677413
MacArthur, R. H., and Wilson, E. O. (1967). The theory of island biogeography. Princeton: Princeton University Press.
Maldonado, M., Aguilar, R., Bannister, R. J., Bell, J. J., Conway, K. W., DaytonDíaz, P. C., et al. (2017). “Sponge grounds as key marine habitats: A synthetic review of types, structure, functional roles, and conservation concerns,” in Marine animal forests: The ecology of benthic biodiversity hotspots. Editors L. Bramanti, A. Gori, C. Orejas, and S. Rossi (Cham: Springer), 145–183.
Manderson, J. P., Pheln, B. A., Bejda, A. J., Stehlik, L. L., and Stoner, A. W. (1999). Predation by striped searobin (Prionotus evolans, triglidae) on young-of-the-year winter flounder (Pseudopleuronectus americanus, walbum): Examining prey size selection and prey choice using field observations and laboratory experiments. J. Exp. Biol. Ecol. 242, 211–231. doi:10.1016/S0022-0981(99)00105-7
Marini, C., Fossa, F., Paoli, C., Bellingeri, M., Gnone, G., and Vassallo, P. (2015). Predicting bottlenose dolphin distribution along Liguria coast (northwestern Mediterranean Sea) through different modeling techniques and indirect predictors. J. Environ. Manag. 150, 9–20. doi:10.1016/j.jenvman.2014.11.008
Marrack, E. C. (1999). The relationship between water motion and living rhodolith beds in the southwestern gulf of California, Mexico. Palaios 14, 159–171. doi:10.2307/3515371
Martín-García, L., González-Lorenzo, G., Brtio-Izquierdo, I. T., and Barquín-Diez, J. (2013). Use of topographic predictors for macrobenthic community mapping in the marine reserve of La palma (canary islands, Spain). Ecol. Model. 263, 19–31. doi:10.1016/j.ecolmodel.2013.04.005
Martinez, A. J., and Martinez, C. S. (2003). Marine life of the north atlantic: Canada to new england. New York: Aqua Quest Publications.
Masteller, C. C., Finnegan, N. J., Warrick, J. A., and Miller, I. M. (2015). Kelp, cobbles, and currents: Biologic reduction of coarse grain entrainment stress. Geology 43, 543–546. doi:10.1130/G36616.1
McCarty, D. A., Kim, H. W., and Lee, H. K. (2020). Evaluation of light gradient boosted machine learning technique in large scale land use and land cover classification. Environments 7, 84. doi:10.3390/environments7100084
McConnaughey, T. A., and Whelan, J. F. (1997). Calcification generates protons for nutrient and bicarbonate uptake. Earth-Science Rev. 42, 95–117. doi:10.1016/S0012-8252(96)00036-0
McLaren, K., McIntyre, K., and Prospere, K. (2019). Using the random forest algorithm to integrate hydroacoustic data with satellite images to improve the mapping of shallow nearshore benthic features in a marine protected area in Jamaica. GIsci. Remote Sens. 56, 1065–1092. doi:10.1080/15481603.2019.1613803
Meadows, P. S., Meadows, A., and Murray, J. M. H. (2012). Biological modifiers of marine benthic seascapes: Their role as ecosystem engineers. Geomorphology 157, 31–48. doi:10.1016/j.geomorph.2011.07.007
Meng, Z., Han, Q. X., and Wang, X. B. (2021). Distribution pattern of macrobenthic composition, diversity and secondary production in Hangzhou Bay, northern East China Sea. Regional Stud. Mar. Sci. 47, 101956. doi:10.1016/j.rsma.2021.101956
Menge, B. A. (1982). “Effects of feeding on the environment: Asteroidea,” in Echinoderm nutrient. Editors M. Jangoux,, and J. Lawrence. 1st edition (Rotterdam: A.A. Balkema), 521–551.
Meyer, K. S., Young, C. M., Sweetman, A. K., Taylor, J., Soltwedel, T., and Bergmann, M. (2016). Rocky islands in a Sea of mud: Biotic and abiotic factors structuring deep-sea dropstone communities. Mar. Ecol. Prog. Ser. 556, 45–57. doi:10.3354/meps11822
Misiuk, B., Diesing, M., Aitken, A., Brown, C. J., Edinger, E. N., and Bell, T. (2019). A spatially explicit comparison of quantitative and categorical modelling approaches for mapping seabed sediments using random forest. Geosciences 9, 254. doi:10.3390/geosciences9060254
Misiuk, B., Lecours, V., and Bell, T. (2018). A multiscale approach to mapping seabed sediments. PLoS ONE 13, e0193647. doi:10.1371/journal.pone.0193647
Misiuk, B., Lecours, V., Dolan, M. F. J., and Robert, K. (2021). Evaluating the suitability of multi-scale terrain Attribute calculation approaches for seabed mapping applications. Mar. Geod. 44, 327–385. doi:10.1080/01490419.2021.1925789
Morrison, L., Feely, M., Stengel, D. B., Blamey, N., Dockery, P., Sherlock, A., et al. (2009). Seaweed attachment to bedrock: Biophysical evidence for a new geophycology paradigm. Geobiology 7, 477–487. doi:10.1111/j.1472-4669.2009.00206.x
Nelson, W. A. (2009). Calcified macroalgae – critical to coastal ecosystems and vulnerable to change: A review. Mar. Freshw. Res. 60, 787–801. doi:10.1071/MF08335
Nemani, S., Cote, D., Shaw, J., Templeton, A., Misiuk, B., Mackin-McLaughlin, J., et al. (2021). A multi-scale feature selection approach for predicting benthic assemblages. Estuar. Coast. Shelf Sci. 277, 108053. doi:10.1016/j.ecss.2022.108053
Neves, B. M., Du Preez, C., and Edinger, E. (2014). Mapping coral and sponge habitats on a shelf-depth environment using multibeam sonar and ROV video observations: Learmonth Bank, northern British Columbia, Canada. Deep Sea Res. Part II Top. Stud. Oceanogr. 99, 169–183. doi:10.1016/j.dsr2.2013.05.026
Norton, T. A., and Fetter, R. (1981). The settlement of Sargassum muticum propagules in stationary and flowing water. J. Mar. Biol. Assoc. U. K. 61, 929–940. doi:10.1017/S0025315400023067
Obst, M., Vicario, S., Lundin, K., Berggren, M., Karlsson, A., Haines, R., et al. (2018). Marine long-term biodiversity assessment suggests loss of rare species in the Skagerrak and Kattegat region. Mar. Biodivers. 48, 2165–2176. doi:10.1007/s12526-017-0749-5
O’Higgins, T. G., Lago, M., and DeWitt, T. H. (2020). Ecosystem-based management, ecosystem services and aquatic biodiversity: Theory, tools and applications. Cham, Switzerland: Springer Nature Switzerland AG.
Ojeda, F. P., and Dearborn, J. H. (1989). Community structure of macroinvertebrates inhabiting the rocky subtidal zone in the gulf of Maine: Seasonal and bathymetric distribution. Mar. Ecol. Prog. Ser. 57, 147–161. doi:10.3354/meps057147
O’Neill, P. L. (1978). Hydrodynamic analysis of feeding in sand dollars. Oecologia 34, 157–174. doi:10.1007/BF00345164
Oug, E., Fleddum, A., Rygg, B., and Olsgard, F. (2012). Biological traits analyses in the study of pollution gradients and ecological functioning of marine soft bottom species assemblages in a fjord ecosystem. J. Exp. Mar. Biol. Ecol. 432, 94–105. doi:10.1016/j.jembe.2012.07.019
Pappal, A. L., Rountree, R. A., and MacDonald, D. G. (2012). Relationship between body size and habitat complexity preference in age-0 and -1 year winter flounder Pseudopleuronectus americanus. J. Fish. Biol. 81, 220–229. doi:10.1111/j.1095-8649.2012.03328.x
Piepenburg, D. (2005). Recent research on arctic benthos: Common notions need to be revised. Polar Biol. 28, 733–755. doi:10.1007/s00300-005-0013-5
Pillay, T., Cawthra, H. C., and Lombard, A. T. (2020). Characterisation of seafloor substrate using advanced processing of multibeam bathymetry, backscatter, and sidescan sonar in Table Bay, South Africa. Mar. Geol. 429, 106332. doi:10.1016/j.margeo.2020.106332
Reise, K. (1985). Tidal flat ecology: An experimental approach to species interactions. Berlin: Springer-Verlag.
Richmond, S., and Stevens, T. (2014). Classifying benthic biotopes on sub-tropical continental shelf-reefs: How useful are abiotic surrogates. Estuar. Coast. Shelf Sci. 138, 79–89. doi:10.1016/j.ecss.2013.12.012
Robert, K., Jones, D. O. B., Tyler, P. A., Van Rooij, D., and Huvenne, V. A. I. (2015). Finding the hotspots within a biodiversity hotspot: Fine-scale biological predictions within a submarine canyon using high-resolution acoustic mapping techniques. Mar. Ecol. Berl. 36, 1256–1276. doi:10.1111/maec.12228
Roberts, R. D., Kühl, M., Glud, R. N., and Rysgaard, S. (2002). Primary production of crustose coralline red algae in a high arctic Fjord1. J. Phycol. 38, 273–283. doi:10.1046/j.1529-8817.2002.01104.x
Robichaud, D., and Rose, G. A. (2006). Density-dependent distribution of demersal juvenile atlantic cod (Gadus morhua) in Placentia Bay, Newfoundland. ICES J. Mar. Sci. 63, 766–774. doi:10.1016/j.icesjms.2005.12.002
Rooper, C. N., Zimmerman, M., and Prescott, M. M. (2017). Comparison of modeling methods to predict the spatial distribution of deep-sea coral and sponge in the Gulf of Alaska. Deep Sea Res. Part I Oceanogr. Res. Pap. 126, 148–161. doi:10.1016/j.dsr.2017.07.002
Salvo, F., Oldford, V., Bungay, T., Boone, C., and Hamoutene, D. (2018). Guide for video monitoring of hardbottom benthic communities of the south coast of Newfoundland for aquaculture impact assessments. St. John’s, Newfoundland: Fisheries and Oceans Canada. Canadian Technical Report of Fisheries and Aquactic Sciences.
Samsudin, S. A., and Hasan, R. C. (2017). Assessment of multibeam backscatter texture analysis for seafloor sediment classification. Int. Arch. Photogramm. Remote Sens. Spat. Inf. Sci. 42-4, 177–183. doi:10.5194/isprs-archives-XLII-4-W5-177-2017
Sandman, A. N., Wikström, S. A., Blomqvist, M., Kautsky, H., and Isaeus, M. (2013). Scale-dependent influence of environmental variables on species distribution: A case-study on five coastal benthic species in the baltic sea. Ecography 36, 354–363. doi:10.1111/j.1600-0587.2012.07053.x
Sandnes, J., Forbes, T., Hansen, R., Sandnes, B., and Rygg, B. (2000). Bioturbation and irrigation in natural sediments, described by animal-community parameters. Mar. Ecol. Prog. Ser. 197, 169–179. doi:10.3354/meps197169
Sañé, E., Chiocci, F. L., Basso, D., and Martorelli, E. (2016). Environmental factors controlling the distribution of rhodoliths: An integrated study based on seafloor sampling, ROV and side scan sonar data, offshore the W-Pontine Archipelago. Cont. Shelf Res. 129, 10–22. doi:10.1016/j.csr.2016.09.003
Sappingtom, J. M., Longshore, K. M., and Thompson, D. B. (2007). Quantifying landscape ruggedness for animal habitat analysis: A case study using bighorn sheep in the mojave desert. J. Wildl. Manag. 71, 1419–1426. doi:10.2193/2005-723
Schapire, R. E., and Freund, Y. (2013). Boosting: Foundations and algorithms. Cambridge, MA: MIT Press.
Scheibling, R. E., and Gagnon, P. (2006). Competitive interactions between the invasive green alga Codium fragile spp. tomentosoides and native canopy-forming seaweeds in Nova Scotia (Canada). Mar. Ecol. Prog. Ser. 325, 1–14. doi:10.3354/meps325001
Schlining, B. M., and Stout, N. J. (2006). “MBARI’s video annotation and reference system,” in Proceedings of the Marine Technology Society/Institute of Electrical and Electronics Engineers Ocean Conference (Boston, MA: OCEANS), 1–5. doi:10.1109/OCEANS.2006.306879
Schückel, U., Beck, M., and Kroncke, I. (2015). Macrofauna communities of tidal channels in jade Bay (German wadden sea): Spatial patterns, relationships with environmental characteristics, and comparative aspects. Mar. Biodivers. 45, 841–855. doi:10.1007/s12526-014-0308-2
Schwarz, A. M., Hawes, I., Andrew, N., Mercer, S., Cummings, V., and Thrush, S. (2005). Primary production potential of non-geniculate coralline algae at Cape Evans, Ross Sea, Antarctica. Mar. Ecol. Prog. Ser. 294, 131–140. doi:10.3354/meps294131
Shang, X. D., Robert, K., Misiuk, B., Mackin-McLaughlin, J., and Zhao, J. H. (2021). Self-adaptive analysis scale determination for terrain features in seafloor substrate classification. Estuar. Coast. Shelf Sci. 254, 107359. doi:10.1016/j.ecss.2021.107359
Shaw, J., Potter, D. P., and Kostylev, V. E. (2011). Seascapes, Placentia Bay, Newfoundland and Labrador. Ottawa, ON: Geological Survey of Canada. Open File 6683, scale 1:250,000. doi:10.4095/288644
Shumchenia, E. J., and King, J. W. (2010). Comparison of methods for integrating biological and physical data for marine habitat mapping and classification. Cont. Shelf Res. 30, 1717–1729. doi:10.1016/j.csr.2010.07.007
Sisson, J. D., Shimeta, J., Zimmer, C. A., and Traykovski, P. (2002). Mapping epibenthic assemblages and their relations to sedimentary features in shallow-water, high-energy environments. Cont. Shelf Res. 22, 565–583. doi:10.1016/S0278-4343(01)00074-7
Siwabessy, P. J. W., Tran, M., Picard, K., Brooke, B. P., Huang, Z., Smit, N., et al. (2018). Modelling the distribution of hard seabed using calibrated multibeam acoustic backscatter data in a tropical, macrotidal embayment: Darwin Harbour, Australia. Mar. Geophys. Res. 39, 249–269. doi:10.1007/s11001-017-9314-7
Sjare, B., Nakashima, B. S., and Mercer, D. (2003). Integrating scientific and local ecological knowledge to identify potential critical habitats: A case study in Placentia Bay, Newfoundland. Fisheries and Oceans Canada, science. Ottawa, ON: DFO Canadian Science Advisory Secretariat #2003/114.
Sokal, R. R., and Michener, C. D. (1958). A statistical method for evaluating systematic relationships. J. Biomed. Sci. Eng. 2, 1409–1438.
Sswat, M., Gulliksen, B., Menn, I., Sweetman, A. K., and Piepenburg, D. (2015). Distribution and composition of the epibenthic megafauna north of Svalbard (Arctic). Polar Biol. 38, 861–877. doi:10.1007/s00300-015-1645-8
Stanley, D. J., and James, N. P. (1971). “Distribution of Echinarachnius parma (lamarck) and associated fauna on sable Island Bank, Southeast Canada,” in Smithsonian contributions to the Earth Sciences (Washington, DC: Smithsonian), 1–24. doi:10.5479/si.00810274.6.1
Steneck, R. S., Graham, M. H., Bourque, B. J., Corbett, D., Erlandson, J. M., Estes, J. A., et al. (2002). Kelp forest ecosystems: Biodiversity, stability, resilience and future. Environ. Conserv. 29, 436–459. doi:10.1017/S0376892902000322
Stephens, D., and Diesing, M. (2014). A comparison of supervised classification methods for the prediction of substrate type using multibeam acoustic and legacy grain-size data. PLoS ONE 9 (4), e93950. doi:10.1371/journal.pone.0093950
Stephens, D., and Diesing, M. (2015). Towards quantitative spatial models of seabed sediment composition. PLoS ONE 10 (11), e0142502. doi:10.1371/journal.pone.0142502
Stevens, D. L., and Olsen, A. R. (2004). Spatially balanced sampling of natural resources. J. Am. Stat. Assoc. 99, 262–278. doi:10.1198/016214504000000250
Strand, J. A., and Weisner, S. E. B. (1996). Wave exposure related growth of epiphyton: Implications for the distribution of submerged macrophytes in eutrophic lakes. Hydrobiologia 325, 113–119. doi:10.1007/BF00028271
Swanson, R. L., de Nys, R., Huggett, M. J., Green, J. K., and Steinberg, P. D. (2006). In situ quantification of a natural settlement cue and recruitment of the Australian sea urchin Holopneustes purpurascens. Mar. Ecol. Prog. Ser. 314, 1–14. doi:10.3354/meps314001
Taylor, R. B. (1998). Density, biomass and productivity of animals in four subtidal rocky reef habitats: The importance of small mobile invertebrates. Mar. Ecol. Prog. Ser. 172, 37–51. doi:10.3354/meps172037
Teagle, H., Hawkins, S. J., Moore, P. J., and Smale, D. A. (2017). The role of kelp species as biogenic habitat formers in coastal marine ecosystems. J. Exp. Mar. Biol. Ecol. 492, 81–98. doi:10.1016/j.jembe.2017.01.017
Tebben, J., Motti, C. A., Siboni, N., Tapiolas, D. M., Negri, A. P., Schupp, P. J., et al. (2015). Chemical mediation of coral larval settlement by crustose coralline algae. Sci. Rep. 5, 10803. doi:10.1038/srep10803
Templeman, N. D. (2007). Placentia bay-grand banks large ocean management area ecologically and biologically significant areas. St. John’s, NL. DFO Canadian Science Advisory Secretariat #2007/52.
Tews, J., Brose, U., Grimm, V., Tielbörger, K., Wichmann, M. C., Schwager, M., et al. (2004). Animal species diversity driven by habitat heterogeneity/diversity: The importance of keystone structures. J. Biogeogr. 31, 79–92. doi:10.1046/j.0305-0270.2003.00994.x
Thomsen, M. E., Wernberg, T., Altieri, A. H., Tuya, F., Gulbransen, D., McGlathery, K. J., et al. (2010). Habitat cascades: The conceptual context and global relevance of facilitation cascades via habitat formation and modification. Integr. Comp. Biol. 50, 158–175. doi:10.1093/icb/icq042
Ugland, K. I., Gray, J. S., and Ellingsen, K. E. (2003). The species accumulation curve and estimation of species richness. J. Anim. Ecol. 72, 888–897. doi:10.1046/j.1365-2656.2003.00748.x
Underwood, A. J., and Denley, E. J. (1984). “Paradigms, explanations, and generalisations in models for structure of intertidal communities on rocky shores,” in Ecological communities: Conceptual issues and the evidence. Editors D. R. Strong, D. Simberloff, L. G. Abele, and A. B. Thistle (Princeton, NJ: Princeton University Press), 151–180.
Vadas, R. L. (1977). Preferential feeding: An optimization strategy in sea urchins. Ecol. Monogr. 47, 337–371. doi:10.2307/1942173
Vadas, R. L. (1968). The ecology of Agarum and the kelp bend community. Seattle (WA): University of Washington. [dissertation].
Vaghela, V. B., Ganatra, A., and Thakkar, A. (2009). “Boost a weak learner to a strong learner using an ensemble system Approach,” in IEEE International Advance Computing Conference, (Patiala, India: IEEE), 1432–1436.
Vassallo, P., Bianchi, C. N., Paoli, C., Holon, F., Navone, A., Bavestrello, G., et al. (2018). A predictive approach to benthic marine habitat mapping: Efficacy and management implications. Mar. Pollut. Bull. 131, 218–232. doi:10.1016/j.marpolbul.2018.04.016
Wahl, M. (2009). “Habitat characteristics and typical functional groups,” In Marine hard bottom communities. Editor M. Wahl (Berlin: Springer), 7–17.
Wainberg, M., Alipanahi, B., and Frey, B. J. (2016). Are random forests truly the best classifiers. BMC Genomics 17, 787. doi:10.1186/s12864-016-3121-4
Walbridge, S., Slocum, N., Pobuda, M., and Wright, D. J. (2018). Unified geomorphological analysis workflows with benthic terrain modeler. Geosciences 8, 94. doi:10.3390/geosciences8030094
Watanabe, H., Ito, M., Matsumoto, A., and Arakwawa, H. (2014). Effects of sediment influx on the settlement and survival of canopy-forming macrophytes. Sci. Rep. 6, 18677. doi:10.1038/srep18677
Wei, C. L., Cusson, M., Archambault, P., Belley, R., Brown, T., Burd, B. J., et al. (2019). Seafloor biodiversity of Canada’s three oceans: Patterns, hotspots, and potential drivers. Divers. Distrib. 26, 226–241. doi:10.1111/ddi.13013
Weiss, A. D. (2001). “Topographic positions and landform analysis,” in ESRI international user conference (San Diego California: ESRI).
Wernberg, T., Krumhansl, K., Filbee-Dexter, K., and Pendersen, M. F. (2019). “Chapter 3 – status and trends for the world’s kelp forests,” in World seas: An environmental evaluation. Editor C. Sheppard (Cambridge MA: Academic Press), 57–78.
White, N. (2018). Special marine areas in Newfoundland and labrador. 2nd Edition. Prepared for CPAWS-NL. 162 pg.
Wright, D. J., Slocum, N., Pobuda, M., and Wright, D. J. (2012). Unified geomorphological analysis workflows with Benthic terrain modeler. Geosci. 8, 94. doi:10.3390/geosciences8030094
Zaneveld, J. S., and Sanford, R. B. (1965). Crustose corallinaceous algae (rhodophyta) of the New Zealand and united-states scientific expedition to the ross, balleny islands, and macquarie ridge. Blumea 26, 205–231.
Zhang, H., Zhang, J., and Zheng, Y. (2012). “Discriminative learning for anatomical structure detection and segmentation,” in Ensemble machine learning. Editors C. Zhang,, and Y. Ma (New York, NY: Springer), 160.
Keywords: marine habitat mapping, machine learning, multiscale, benthic epifauna, benthic algae
Citation: Mackin-McLaughlin J, Nemani S, Misiuk B, Templeton A, Gagnon P, Edinger E and Robert K (2022) Spatial distribution of benthic flora and fauna of coastal placentia bay, an ecologically and biologically significant area of the island of newfoundland, atlantic Canada. Front. Environ. Sci. 10:999483. doi: 10.3389/fenvs.2022.999483
Received: 21 July 2022; Accepted: 03 October 2022;
Published: 20 October 2022.
Edited by:
Elisabetta Manea, Institute of Marine Science, National Research Council (CNR), ItalyReviewed by:
Giorgio Castellan, Institute of Marine Science, National Research Council (CNR), ItalyThadickal V Joydas, King Fahd University of Petroleum and Minerals, Saudi Arabia
Copyright © 2022 Mackin-McLaughlin, Nemani, Misiuk, Templeton, Gagnon, Edinger and Robert. This is an open-access article distributed under the terms of the Creative Commons Attribution License (CC BY). The use, distribution or reproduction in other forums is permitted, provided the original author(s) and the copyright owner(s) are credited and that the original publication in this journal is cited, in accordance with accepted academic practice. No use, distribution or reproduction is permitted which does not comply with these terms.
*Correspondence: Julia Mackin-McLaughlin, amFtYWNraW5tY2xhdWdobGluQHZpbXMuZWR1