
94% of researchers rate our articles as excellent or good
Learn more about the work of our research integrity team to safeguard the quality of each article we publish.
Find out more
ORIGINAL RESEARCH article
Front. Environ. Sci., 05 October 2022
Sec. Environmental Economics and Management
Volume 10 - 2022 | https://doi.org/10.3389/fenvs.2022.999096
This article is part of the Research TopicEconomic Development, Social Consequences, and Technological Innovation Under Climate Change COVID-19 Pandemic ConditionsView all 48 articles
 Muhammad Anees Khan1*
 M. S. Mazliham2Muhammad Mansoor Alam3Nida Aman1
 Sakshi Malik3Syeda Faiza Urooj4Tanveer Taj1
Although strong recommendations and steps have been developed and taken to adopt the latest technological trend through corporate governance reforms for improving the economic development, however, the trend toward adopting the latest technology has not been adopted and thus has remained a big issue in the non-financial sector for the last two decades around the globe. The study used GLS (random effect) regression estimator to a sample composed of 1600 firm-year observations from 2017 to 2021. The findings indicated that the majority of the firms were involved in an income-decreasing economic situation. Moreover, the findings evidenced that compliance with some specific CG attributes welcomed the technological innovation and significantly had an impact on the economic development. However, some CG attributes of the models did not play any significant role in technological innovation and economic development which needs improvement. Moreover, this study also evidenced that the impact of CG attributes is not directly affecting economic development but is mediated by the technological innovation, which is of importance to managers of a firm, who hold responsibility for investing and financing activities. In addition, this study revealed a fully significant mediating role of technological innovation in the relationship of BOD meetings, audit committee size, managerial ownership, and foreign ownership with economic development. However, no significant mediating role of technological innovation was observed in the relationship of independent BOD and economic development. All in all, the results of this study have significance for regulatory bodies, researchers, academic researchers, practitioners, publicly listed companies in Malaysia, the Bursa Malaysia and the security commission to uplift their financial performance and curb EM activities through the effective use of CG mechanisms.
Over the last two decades, technological innovation (artificial intelligence), economic development, and corporate governance (CG) mechanisms have significantly influenced businesses, stakeholders, and shareholders around the world. In this regard, due to lack of technological innovation (artificial intelligence), the late 1990s and early 21st century witnessed the series of different accounting scandals (e.g., Enron, HealthSouth, Parmalat, Tyco, WorldCom, and Xerox) appeared across the United States and Europe which have changed the climate of business and trust (Petrick and Scherer, 2003). In addition, companies did not focus on environmental, social, and governance issues, which in return create issues for different business organizations around the globe. After witnessing these scandals, security agencies, stock markets, and other stakeholders felt the need for technological innovation that will control these scandals and will lead to economic development. These scandals caused damage, including a decline in the worldwide reputations of companies, auditors, security analysts, regulators, and financial markets (Ball, 2009). Moreover, it was also noted by the authors that the adoptability issue of technological innovation has always been a concern for the stakeholders and auditors which can lead to economic development. Empirical evidence from the academic literature has shown that the good corporate governance practices have always had an impact on the economic and financial performance of the organization by minimizing the economic development issues by adopting the latest technological advancement (Barth and Lang, 2008). Ban et al. (2022); Chen et al. (2021); Lei et al. (2021) demonstrated that technological development is one of the successful instruments of the executives, which attract the stakeholders for investment, and thus helps in boosting the economic development in the shape of return on assets, return on equity and earning per share. It also helps in minimizing the time and improves the efficiency of the organization. So, in this regard, installing and using technology in the shape of artificial intelligence is considered as core business decisions of the firm. Overall, it can be noted that the essential goal of the firm was to boost the investor’s wealth by choosing an appropriate advancement in technology to have a positive impact on the relationship between corporate governance mechanism and economic/financial growth (Lei et al., 2021; Pan et al., 2021; Lu et al., 2022). In this regard, numerous specialists have conducted their examinations to recognize corporate governance, technological advancement, and economic performance to center around whether what are its qualities and how these attributes affect the performance of the firm Shen et al., 2022; Wu and Zhu 2021; Xu et al., 2022). Studies found numerous answers identified with analysts’ questions through giving a reasonable meaning of good corporate governance, their morals and techniques utilized so as to perform, oversee, and screen a business. The greater part of these examinations was to look at the connection between corporate governance components and performance measures (Shen et al., 2022). In the previous two decades, consideration about problems identified with corporate governance, technological advancement, and economic development is expanding because of progression of money-related and financial occasions occurring in the world over. In such a manner, prominent budgetary outrages, monetary emergencies, and startling corporate disappointment come across nations to reinforce the corporate rules so as to building the trust in money-related markets.
The study is further structured with the corporate governance mechanism literature together with technological innovation based on the AI technique. In addition, econometrics models will be run based on theory discussed with methodology, results, and mediation interpretation.
Corporate governance (CG) is defined as a system by which companies are directed and controlled (O'Sullivan, 1999). Agency theory suggests that the CG system is of the utmost importance for effective monitoring and development of an organization (Farber, 2005; Murthy, 2006). Thus, the CG mechanism is similar to a monitoring system which helps in improving the overall performance of the firm (Fama, 1980; Murphy and Zimmerman, 1993; Gul and Leung, 2004; Ali Shah et al., 2009). Therefore, it is widely accepted that an effective compliance of CG also increases a manager’s ability to constrain EM practices and maximize shareholders wealth (Peasnell et al., 2005; Ali Shah et al., 2009; Jaggi et al., 2009; Lo et al., 2010). CG broadly refers to the mechanisms, processes, and relations by which corporations are controlled and directed (Gul et al., 2003). A CG mechanism is the combination of internal directors of the board, internal audit committee, structure of ownership, and the external auditor (Hillman and Keim, 2001). A CG mechanism is the process of directing and monitoring the overall FFP and reducing the EM (Farber, 2005). Moreover, CG practices increase a manager’s ability to work for the maximization of shareholder wealth (Peasnell et al., 2005; Jaggi et al., 2009; Lo et al., 2010). Although the CG mechanism is differently defined by authors, CG is a system that minimizes the earnings manipulation ability of managers (Lo et al., 2010). Following this, many firms significantly improvised and executed the CG mechanism to reduce the practices of EM to improve their firm’s financial performance.
We measure the technological innovation based on the latest artificial intelligence (AI) techniques that is used in finance. Artificial intelligence relates to technological advances which allow machines to become “intelligent.” In 1956, John McCarthy coined the word artificial intelligence. The objective of artificial intelligence was to develop a system that is intellectual and self-contained. Machine learning comes under the heading of artificial intelligence which allows a system to adapt and develop its own understanding without having to program it explicitly. AI works in two ways: one is data-driven, and the other is symbolic. For the data-based side called ML, a large amount of data is needed to be fed into the machine before it is capable of learning. Machines are capable of learning in a much wider range of dimensions. Reasoning, information representation, NLP, scheduling, deep learning, interpretation, and the ability of transferring and controlling them are all domains of the AI study. One of AI’s aims was to achieve general intelligence. ANN can be used for forecasting because of their ability of pattern recognition and machine learning (Zaidi and Ofori-Abebrese, 2016). The procedures which are needed to achieve the objective comprise traditional symbolic AI, artificial intelligence, and statistical methods. AI is rapidly developing in a variety of fields and has an excess of features. The technology has the prospective to be used in a variety of industries and sectors. Artificial intelligence is applied in finance to recognize and track financial and banking activities. All of these processes are conducted through machine learning. Machine learning systems are categorized based on how much and what kind of supervision they receive during training. Machine learning is broadly divided into the following three categories.
Based on the training dataset, supervised learning develops a function that translates inputs to outputs. The purpose of supervised learning was to predict a known outcome. To train a model, a dataset with features and labels is used. The technique generates a function that maps features to labels and then utilizes it to forecast the labels of unlabeled data. The accuracy of supervised learning models in forecasting outcome across one or more sets of data not included in the growth process is typically measured.
In unsupervised learning, the training data are unlabeled. The system tries to realize this without the assistance of a teacher. Unsupervised learning uncovers hidden patterns in unlabeled data and makes conclusions from it. It is not anticipation of a precise outcome. Instead, the program looks for patterns or groups of data to identify. This is a difficult task to review, and the value of groups learned through unsupervised learning is frequently assessed by performance in a successive supervised learning assignment, which determines if these groupings are beneficial.
The reinforcement technique is relatively a new type of learning that combines supervised and unsupervised learning. It is a completely distinct beast. The algorithm in it maximizes accuracy through trial and error. The model is shaped through feedback from the training set’s outcomes of real and simulated decisions. In this context, the learning system is referred to as an agent since it can check the environment, select, and carry out actions, and receive rewards or penalties. It must, then, figure out for itself what the ideal technique, known as a policy, is for maximizing reward over time. In each case, a policy specifies what action the agent should take.
We measure the economic development based on the financial performance of the firm that will collectively contribute to the GDP as an economic growth. So, in this regard, economic development of a firm is defined as “how well a firm generates the maximum revenue by using the available resources to satisfy the stockholders and investors.” Economic/financial development is the output of a successful business operation in the shape of a higher return on assets or return on equity. In simple words, economic/financial development increases the earning, dividends, and overall price of the share (Stout, 2013). According to shareholder primacy theory, every owner of a firm wants to increase the share price which, in turn, positively affects the shareholder value and overall firm performance (Hillman and Keim, 2001). The core objective of the management of any firm is to increase the economic/financial development, which will increase the goodwill of the firm in the market (Shen and Chih, 2007). Moreover, economic/financial development is seen as a major concern by investors, shareholders, and stakeholders (Pfeffer, 1973; Lang and Stulz, 1993). International strategy research and behavioral finance theories state that economic/financial development is one of the most important characteristics of the firm in that it creates a helpful scale for deciding upon an investment in a firm (Tong et al., 2008). Hence, investors and creditors observe economic/financial development on regular basis before making the investment or lending credit to the concerned firm (Ittner and Larcker, 2001; Lin and Chen, 2005; Bird and Casavecchia, 2007; Kantudu and Samaila, 2015; Shittu et al., 2016).
Agency theory strength is subject to the existence of CG mechanisms by which firm owners are able to monitor the performance of managers (Fama, 1980). Therefore, strict monitoring of managers is undertaken by the firms boards (principals or their representatives), for constraining the managerial opportunistic behavior and reducing the agency costs (Fama, 1980; McKnight and Weir, 2009). The aforementioned argument is strongly supported by the Malaysian Codes of Corporate Governance (MCCG, 2017), that the role of CG is continuous monitoring of managers and thus protecting the shareholders. Therefore, researchers who examine the association between EM and CG relied upon agency theory (Watts & Zimmerman, 1986; Dellaportas et al., 2012; González and García-Meca, 2014). Hence, the relationship between CG, technological innovation, and economic development is developed based on the agency theory concept.
Mary Parker Follett brought the idea of stakeholder theory about 60 years ago (Schilling, 2000). The origins of stakeholder theory draw on four key academic fields, that is , sociology, economics, politics, and ethics (Freeman, 2004). The modern utilization of stakeholder theory developed back in 1963, when Stanford Research Institute generalized and expanded the notion of the shareholders (Benneworth and Jongbloed, 2010). A stakeholder is defined as any group or individual who can influence or is influenced by the achievement of the organization’s objectives (Freeman, 2004). Thus, stakeholders are persons or groups with legitimate interests in procedural aspects of corporate activity (Friedman and Miles, 2002).
The main question/objective of this study was to examine the mediating impact of technological innovation (artificial intelligence) on the relationship between the corporate governance mechanism (BODSIZE, INDEPBOD, BODMEET, AUDTCOMMSZE, AUDTCOMMEET, MANGEROWNR, and FORGNOWNR) and economic/financial development in Malaysian public listed companies.”
The following conceptual framework is developed based on the aforementioned discussion to examine the relationship between the CG mechanism (BODSIZE, INDEPBOD, BODMEET, AUDTCOMMSZE, AUDTCOMMEET, MANGEROWNR, and FORGNOWNR) and economic/financial development with a mediation of technological innovation (artificial intelligence) in Malaysian public listed companies. The mediation links between the CG mechanism technological innovation and economic/financial development.
Previously, the study developed and discussed the theories of this study; however, the next section discusses the econometric models with their respective conceptual models for testing the hypotheses developed for the current study. To investigate the effects of specific CG attributes on techno innovation and economic development with a mediating impact of techno innovation on the relationship between CG attributes and economic development, the study was separated into four models. Thus, the study develops four models for testing the 22 hypotheses. This research utilizes the following four models to test the research hypotheses.
In model A to B as shown in the Figure 1, this study regressed TechnoInnovat (AI) on specific CG attributes selected from MCCG-2017. Seven of 19 hypotheses were developed for model A to B. The econometric equation model with its respective conceptual model of A to B is given as below:
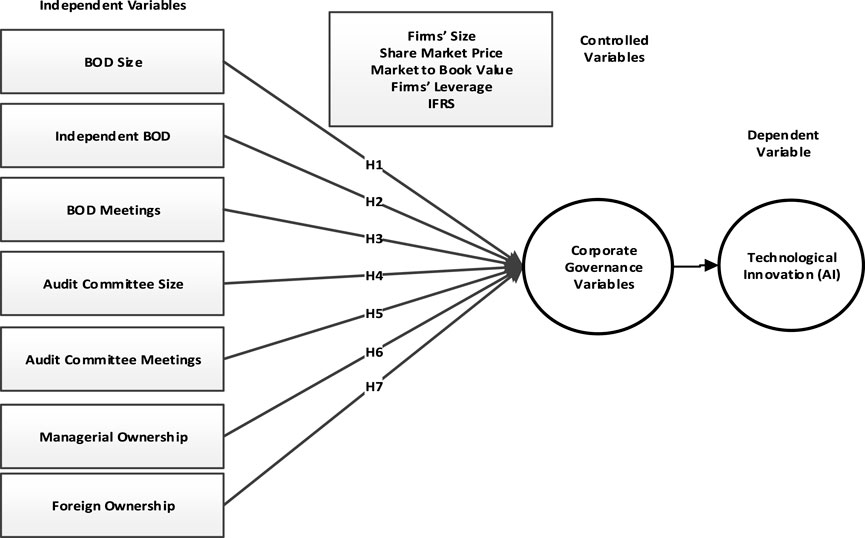
FIGURE 1. Conceptual model of A to B.
In model B to C, as shown in the Figure 2 economic/financial development was regressed on technological innovation. Economic/financial development was measured by ROA, ROE, and EPS, while technological innovation was measured by dummy variables based on Malaysia country data. However, only one hypothesis was developed for model B to C. Following is the econometric equation model with its respective conceptual model of model B to C:
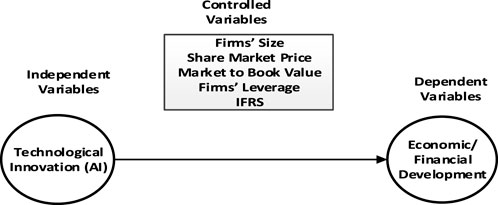
FIGURE 2. Conceptual model of B to C.
In Model A to C as shown in the Figure 3, this study replaces technological innovation with economic/financial development and then regressed it on specific CG attributes selected from MCCG-2017. Moreover, seven hypotheses were developed for model A to C as well. The econometric presentation of model four with its respective conceptual model is given as follows: economic/financial development was measured by ROA, ROE, and EPS, while technological innovation was measured by dummy variables based on Malaysia country data.
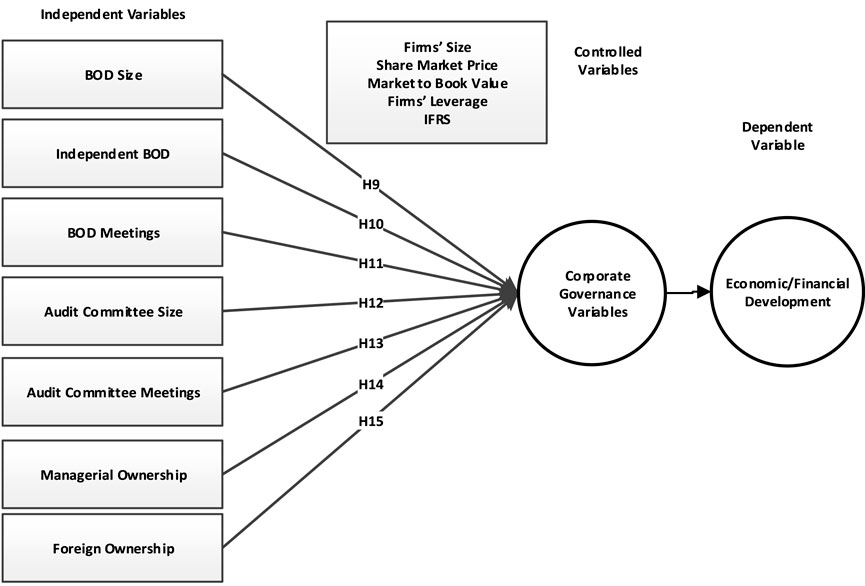
FIGURE 3. Conceptual model of A to C.
Following the aforementioned econometric models, from models 1 to 4, this study used the generalized least square (GLS) random effect regression estimator, which was selected based on Hausman specification test in STATA 15.0.
The last and the fourth model (A to B, B to C, A to C, and ABC) as shown in Figure 4 was the novel model of mediation wherein FFP was taken a mediating variable in the relationship of specific CG attributes and EM practices in Malaysian public listed companies for the years 2010–14. Therefore, the empirical models with the econometric equation of main variables of this study tests are as follows.where
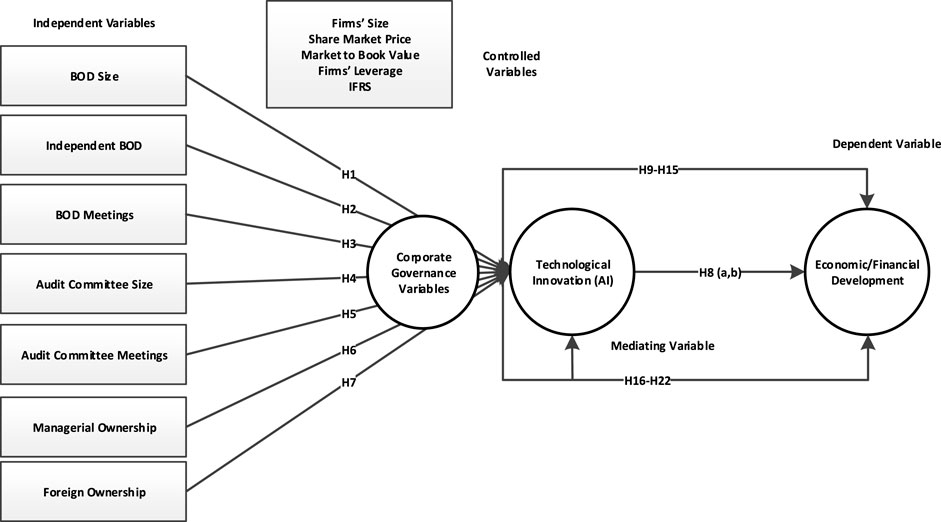
FIGURE 4. Conceptual models A to B and B to C and ABC.
Economic/Financial Dep: economic/financial development
TechnoInnovatn: technological innovation (AI)
β0: constant
BODSZ: board of director’s size
INDBOD: board of director’s independence
BODMTG: board of directors’ meeting
ACSZ: audit committee size
ACMTG: audit committee meeting
MANOWN: managerial ownership
FOROWN: foreign ownership
LOGTASST: log total assets.
SHAREMKTPRICE: share market price
MKTTOBV: market to book value
LEVERAGE: leverage
IFRS: International Financial Reporting System
e: residual error
This study used balanced panel data because it is a more sensitive measurement of the changes that could take place between points in time (Cavana et al., 2001).The sample size of this study comprises 320 firms listed on Bursa Malaysia, during the period 2017–2021. Financial institutions, insurance, and mining firms are excluded, as is common in this type of studies because of their particular accounting practices (González and García-Meca, 2014). We assumed technological innovation (artificial intelligence) data a dummy and collected 1 as if the company use latest financial innovation, that is, AI while 0 for not using the AI. The financial data for economic development are secondary in nature and obtained from the DataStream database, while data of the CG mechanism (board of director size, audit committee meetings, and external auditor) extracted directly from company’s annual reports, which are available on firms’ websites or through the Bursa Malaysia website. The data will be analyzed through descriptive statistics, correlation, multiple regression, and mediation analysis for results interpretation. Data run through the statistical package for social science (SPSS), Version 21 and STATA, Version 15. For making the result more robust, constant, and stable, we run some initial steps for cleaning and screening the data, which will imply that the samples are more representative and the results are meaningful (Sekaran and Bougie, 2003).
Table 1 shows the descriptive statistics for dependent, mediating, independent, and control variables of the study in Malaysian public listed companies for the 9 years from 2017 to 2021. The results in Table 1 for dependent variable ECODEVELOPEMENT shows that the mean value of 0.409 ranged from a minimum of -1.77 to a maximum of 0.636. Similarly, TECHINNOVAT (AI) was measured by earnings multiples and taken as a mediating variable in the study. The finding presented in Table 1 for TECHINNOVAT (AI) shows a mean of 0.6, ranging from 0 to 1. Moreover, all the descriptive results of other variables are also shown in the table.
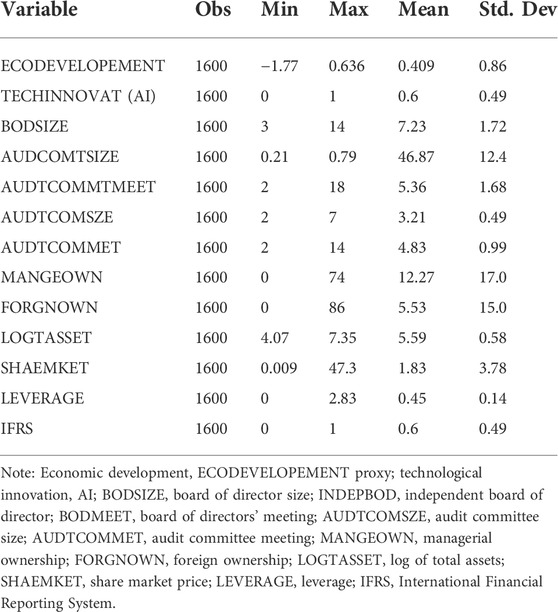
TABLE 1. Descriptive statistics of the study.
This section presents the summary of Pearson’s correlations between the mediating, dependent, independent, and control variables. The purpose of checking correlation among variables was to investigate the correlations of study variables as well as to know about any multicollinearity issue among the independent variables. A multicollinearity problem exists in the data if the Pearson’s correlation coefficient is greater than 0.80 (Hooper et al., 2008). Due to the continuous nature of the variables, this study provided only Pearson’s correlation. Table 2 presents the Pearson’s correlations matrix for the model of this study, which clearly demonstrates no multicollinearity issue is present among the independent variables as none of the coefficients are greater than 0.80 (Hooper et al., 2008). Table 2 shows the statistics for Pearson’s correlation matrix of the sampled firms for the dependent, independent, and control variables. The correlation statistics reported for model 1 (A to B) in Table 2 show that ECODEVELOPEMENT had a significant positive correlation with the board of director size (BODSIZE). These findings are consistent with previous studies such as Salihi (2015), Germain et al. (2014), and Cheng and Warfield (2005), who stated that there is a positive impact of board size on ECODEVELOPEMENT. However, the proportion of independent board of director (INDEPBOD) showed an insignificant and positive correlation with ECODEVELOPEMENT.
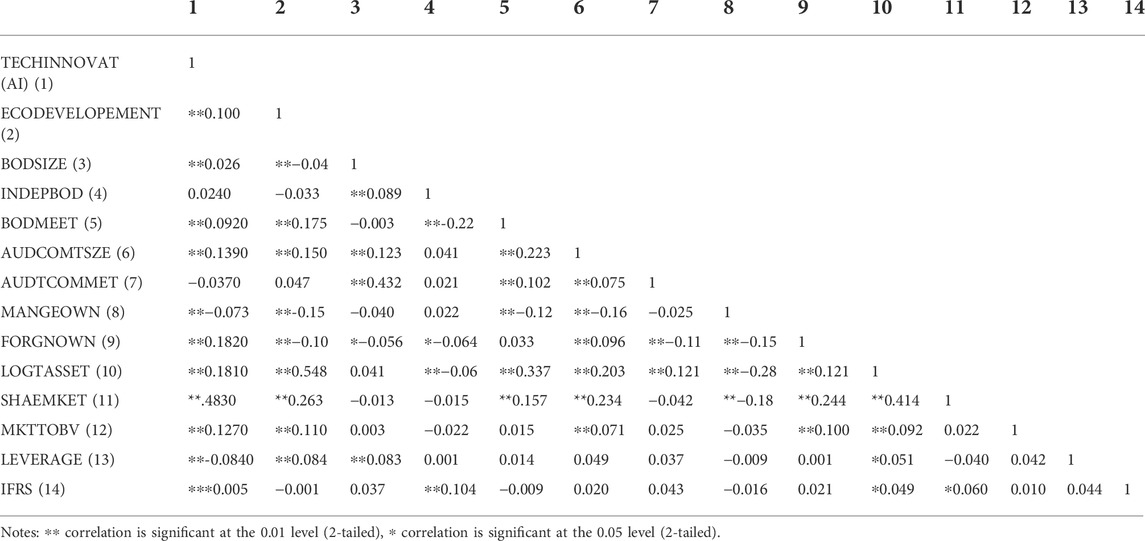
TABLE 2. Pearson’s correlation matrix.
The results of random effect (GLS) regression for the first model of the study are summarized in Table 3. The regression estimator for model 1 examined the impact of CG attributes (BODSIZE, INDEPBOD, BODMEET, AUDTCOMMSZE, AUDTCOMMEET, MANGEROWNR, and FORGNOWNR) on TECHINNOVAT (AI). In addition, Table 3, also explains the impact of control variables (LOGTASSETS, SHAREMKETPRC, MKTTOBV, LEVERGE, and IFRS) on the relationship of CG attributes and TECHINNOVAT (AI). According the study of Baltagi and Kao (2001), a goodness-of-fit test should be conducted to examine the robustness of the model and data. Therefore, for confirming the goodness-of-fit of the model, this study used Wald Chi2 (1) and Prob > Chi2 test. The statistics of Wald Chi2 (1) = 67.48, with Prob > Chi2 = 0.000 are shown in Table 3. The significance of the result (Prob > Chi2 = 0.000) confirms the goodness-of-fit for the first model of the study. Similarly, for making the model more robust and error free, this study also used Durbin–Watson statistic for autocorrelation. The results of Durbin–Watson statistics test = 2.07 shows no issues of autocorrelation as the threshold value of Durbin–Watson statistics is either equal to two (2) or near to two (2) (Johnson and Wichern, 2014). Moreover, the statistics of Durbin (score) Chi2 (1) and Wu–Hausman F (1589) in Table 3, also show no endogeneity issue in the first model of the study by revealing the results as Durbin (score) Chi2 (1) = 1.23 with p = 0.110, and the results for Wu–Hausman F (1589) = 1.54 with p = 0.134. The rule of thumb for the aforementioned tests is, if the probability value is greater than 0.05, no endogeneity is present in the model. Therefore, in this case; the p-value is greater than 0.05 and indicates no issue of endogeneity in the model. Similarly, R-square (49.22) in Table 3 suggests the amount of change in a dependent variable (FFP) caused by independent variables, CG attributes in Malaysian public listed companies for the years 2017–2021.
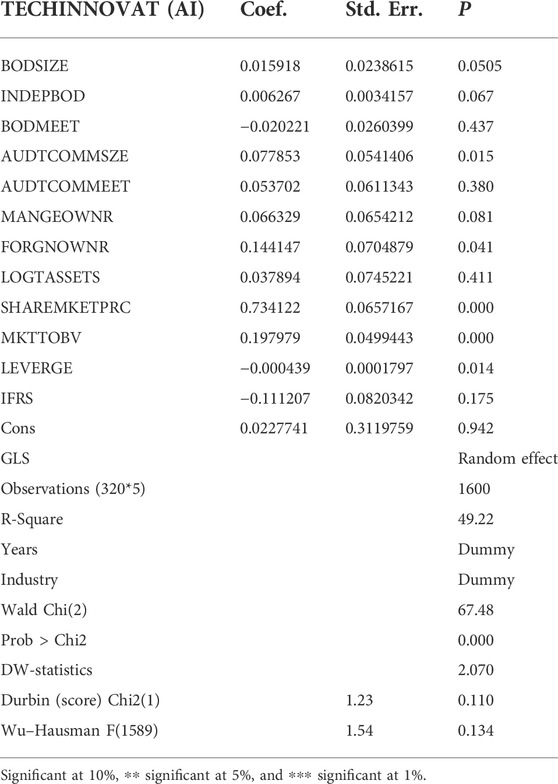
TABLE 3. Random effect (GLS) model 1 (A to B).
Regression results based on the random effect (GLS) technique for the second model of the study sample are summarized in Table 4. The model examined the impact of TECHINNOVAT (AI) on ECODEVELOPEMENT. In addition to the regression findings of model two for dependent, independent, and control variables, Table 4 also reports the results of Wald Chi2(1) for goodness-of-fit, Prob > Chi2 for confirming the goodness-of-fitness of the model, Durbin–Watson statistics for autocorrelation, Breusch–Pagan/Cook–Weisberg test of Chi2(1) for heteroscedasticity, while both the Durban (score) test and Wu–Hausman F(1589) test for confirming the endogeneity (Gujarati, 2009; Greene, 2012; Wooldridge, 2013; Babones, 2016). Following the previous discussion, the statistics of Wald Chi2 (1) = 56.48, with Prob > Chi2 = 0.000 for model 2 are shown in Table 4. The significance of the result (Prob > Chi2 = 0.000)confirms the goodness-of-fit for the second model of the study. Similarly, the issue of autocorrelation was identified through the Durbin–Watson test. The results of Durbin–Watson test were 1.95, showing that no issues of autocorrelation are present, as the result lies under the threshold value of Durbin–Watson, which is 2.
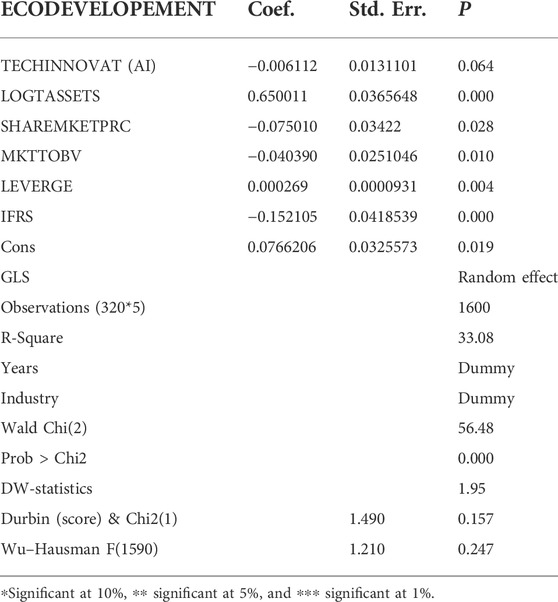
TABLE 4. Random effect (GLS) model 2 (B to C).
The regression results based on the random effect (GLS) technique for the third model of the study are summarized in Table 5. The findings examined the impact of specific CG attributes (BOD size, independent BOD, BOD meeting, audit committee size, audit committee meetings, managerial ownership, and foreign ownership) on ECODEVELOPEMENT. Moreover, Table 5 also explains the impact of control variables (firm size, share market price, market to book value, and leverage) on ECODEVELOPEMENT. It is worth noting that before running the regression estimator, some specific tests such as(Wald Chi2, DW-statistics, Breusch–Pagan/Cook–Weisberg test, Durban (score) test, and Wu–Hausman) should be run to examine the reliability of the model 3 (Gujarati, 2009; Greene, 2012; Wooldridge, 2013; Babones, 2016). Following the aforementioned discussion, Table 5 reports the findings of Wald Chi2 (1) for goodness-of-fit, Prob > Chi2 for confirming the goodness-of-fit of the model, DW-statistics for autocorrelation, the Breusch–Pagan/Cook–Weisberg test of Chi2 (1) for heteroscedasticity, and both the Durban (score) test and Wu–Hausman F (1589) test for confirming the endogeneity in the third model of the study.
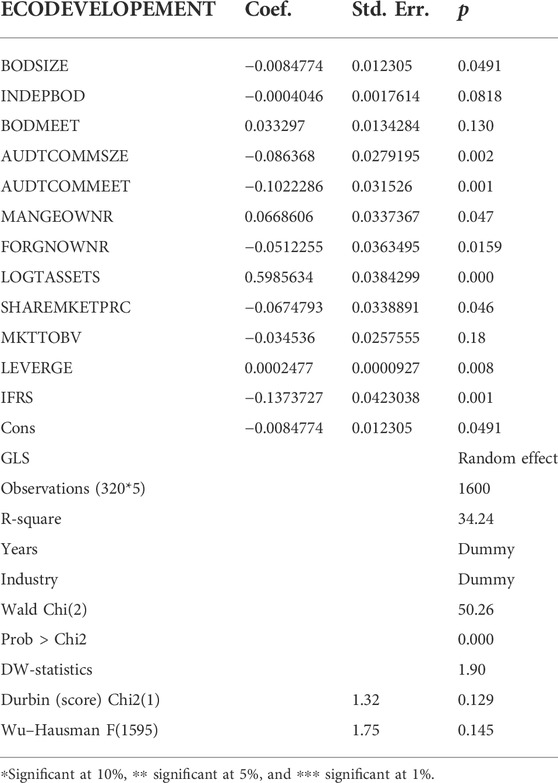
TABLE 5. Random effect (GLS) model 3 (A to C).
Table 6 shows the mediational models that are concerned with explaining the mechanism by which an independent variable exerts its impact on a dependent variable through a mediating variable. Mediation is said to occur when the causal effect of an independent variable (x) on a dependent variable (y) is transmitted by a mediator (M). This section empirically investigates model 4 of this study concerning the mediating impact of TECHINNOVAT (AI) on the relationship between specific CG attributes (BODSIZE, INDEPBOD, BODMEET, AUDTCOMMSZE, AUDTCOMMEET, MANGEROWNR, and FORGNOWNR) and ECODEVELOPEMENT.
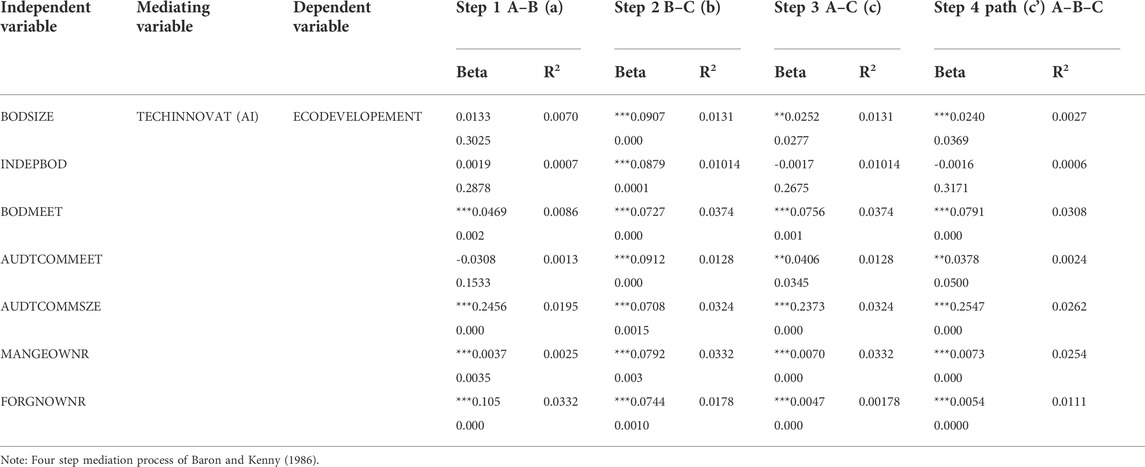
TABLE 6. CG, FFP, and EM.
This study is the evidence that the effective use of the corporate governance mechanism has a differential effect on the economic development with a perfect blend of technological innovation, which clarifies the important contribution of corporate governance attributes toward the maximization of firm wealth and improvement of the overall performance of the firm that contributes to the GDP. This research provides key insights for market participants including investors, analysts, accounting, and auditing professionals. These insights relate to the role of the corporate governance mechanism in relation to technological innovation and economic development. The result also improves general awareness of the extent of technological innovation and corporate governance effectiveness in improving the economic development of the country. Similarly, the empirical result will contribute to help in recommendation and improvement of technological innovation and its adoption, economic development for the development of the Malaysian code of corporate governance (MCCG-2017). Moreover, the results of this study will help the board of directors, policy makers, government, Security Commission of Malaysia, and Bursa Malaysia for further improvements of the relevant policies and regulations in future. This study also provides theoretical contributions to prove the essence of agency theory in Malaysia, that firms should play its role in management through corporate governance practices. The empirical results also contributed to the latest knowledge of the study and extended the literature on the corporate governance mechanism and its impact on the shareholder value. Overall, although not all corporate governance variables support the stated hypotheses; but this study has achieved its objective by identifying the attributes that answer the research question. Because the sample companies reviewed in this study suggest that earning management in Malaysian listed companies averagely increased even after the introduction of MCCG-2017. This study investigated that how a good corporate governance structure can influence earning management practices in the firm. After this empirical study, it is clear that reform in MCCG-2017 is important and new effective corporate governance compliance practices should be developed in order to minimize the practices of earning management. Apart from several contributions, this study has some limitations. First, as discussed earlier, the scope of the study is limited by its population, which included only non-financial companies listed on Bursa Malaysia under the main market rather than the ACE market. For this reason, the sample should be expanded to ACE market companies and the results should be compared with the main market companies in Bursa Malaysia. Moreover, with different years, samples, populations, and use of moderation analysis are also suggested for future researchers.
The original contributions presented in the study are included in the article/supplementary material; further inquiries can be directed to the corresponding author.
The patients/participants provided their written informed consent to participate in this study.
Idea and literature was first drafted by MK. Data were collected by MM. Analysis was performed by MA and MK, while SM helped in overview.
The authors declare that the research was conducted in the absence of any commercial or financial relationships that could be construed as a potential conflict of interest.
All claims expressed in this article are solely those of the authors and do not necessarily represent those of their affiliated organizations, or those of the publisher, the editors, and the reviewers. Any product that may be evaluated in this article, or claim that may be made by its manufacturer, is not guaranteed or endorsed by the publisher.
Ali Shah, S. Z., Butt, S. A., and Hassan, A. (2009). Corporate governance and earnings management an empirical evidence form Pakistani listed companies. Eur. J. Sci. Res. 26 (4), 624–638.
Babones, S. (2016). Interpretive quantitative methods for the social sciences. Sociology 50 (3), 453–469. doi:10.1177/0038038515583637
Ball, R. (2009). Market and political/regulatory perspectives on the recent accounting scandals. J. Account. Res. 47 (2), 277–323. doi:10.1111/j.1475-679x.2009.00325.x
Baltagi, B. H., and Kao, C. (2001). “Nonstationary panels, cointegration in panels and dynamic panels: A survey,” in Nonstationary panels, panel cointegration, and dynamic panels (NY City: Emerald Group Publishing Limited), 7–51.
Ban, Y., Liu, M., Wu, P., Yang, B., Liu, S., Yin, L., et al. (2022). Depth estimation method for monocular camera defocus images in microscopic scenes. Electron. (Basel) 11 (13), doi:10.3390/electronics11132012
Baron, R. M., and Kenny, D. A. (1986). The moderator–mediator variable distinction in social psychological research: Conceptual, strategic, and statistical considerations. Journal of personality and social psychology 51 (6), 1173
Barth, L W. R., and Lang, M. H. (2008). International accounting standards and accounting quality. J. Account. Res. 46 (3), 467–498. doi:10.1111/j.1475-679x.2008.00287.x
Benneworth, P., and Jongbloed, B. W. (2010). Who matters to universities? A stakeholder perspective on humanities, arts and social sciences valorisation. High. Educ. (Dordr). 59 (5), 567–588. doi:10.1007/s10734-009-9265-2
Bird, R., and Casavecchia, L. (2007). Sentiment and financial health indicators for value and growth stocks: The European experience. Eur. J. Finance 13 (8), 769–793. doi:10.1080/13518470701705777
Cavana, R. Y., Delahaye, B. L., and Sekaran, U. (2001). Applied business research: Qualitative and quantitative methods. Australia: John Wiley & Sons Australia.
Chen, Y., Kumara, E. K., and Sivakumar, V. (2021). Investigation of Finance industry on risk awareness model and digital economic growth. Ann. Oper. Res 23, 7. doi:10.1007/s10479-021-04287-7
Cheng, Q., and Warfield, T. D. (2005). Equity incentives and earnings management. Account. Rev. 80 (2), 441–476. doi:10.2308/accr.2005.80.2.441
Dellaportas, S., Leung, P., Cooper, B. J., Lary, A. M., and Taylor, D. W. (2012). Governance characteristics and role effectiveness of audit committees. Manag. Auditing J. 27 (4), 336–354. doi:10.1108/02686901211217969
Fama, E. F. (1980). Agency problems and the theory of the firm. J. Polit. Econ. 88, 288–307. doi:10.1086/260866
Farber, D. B. (2005). Restoring trust after fraud: Does corporate governance matter?. Account. Rev. 80 (2), 539–561. doi:10.2308/accr.2005.80.2.539
Freeman, R. E. (2004). The stakeholder approach revisited. zfwu 5 (3), 228–241. doi:10.5771/1439-880x-2004-3-228
Friedman, A. L., and Miles, S. (2002). Developing stakeholder theory. J. Manag. Studs. 39 (1), 1–21. doi:10.1111/1467-6486.00280
Germain, L., Galy, N., and Lee, W. (2014). Corporate governance reform in Malaysia: Board size, independence and monitoring. J. Econ. Bus 75, 126–162. doi:10.1016/j.jeconbus.2014.06.003
González, J. S., and García-Meca, E. (2014). Does corporate governance influence earnings management in Latin American markets?. J. Bus. Ethics 121 (3), 419–440. doi:10.1007/s10551-013-1700-8
Gul, F. A., Chen, C. J., and Tsui, J. S. (2003). Discretionary accounting accruals, managers' incentives, and audit fees. Contemp. Account. Res 20 (3), 441–464. doi:10.1506/686e-nf2j-73x6-g540
Gul, F. A., and Leung, S. (2004). Board leadership, outside directors’ expertise and voluntary corporate disclosures. J. Account. public Policy 23 (5), 351–379. doi:10.1016/j.jaccpubpol.2004.07.001
Hillman, A. J., and Keim, G. D. (2001). Shareholder value, stakeholder management, and social issues: what's the bottom line?. Strateg. Manag. J 22 (2), 125–139. doi:10.1002/1097-0266(200101)22:2<125::aid-smj150>3.0.co;2-h
Hooper, D., Coughlan, J., and Mullen, M. (2008). Structural equation modelling: Guidelines for determining model fit. Articles 2, 53–60. doi:10.21427/D7CF7R
Ittner, C. D., and Larcker, D. F. (2001). Assessing empirical research in managerial accounting: A value-based management perspective. J. Account. Econ 32 (1), 349–410. doi:10.1016/s0165-4101(01)00026-x
Jaggi, B., Leung, S., and Gul, F. (2009). Family control, board independence and earnings management: Evidence based on Hong Kong firms. J. Account. public Policy 28 (4), 281–300. doi:10.1016/j.jaccpubpol.2009.06.002
Johnson, R. A., and Wichern, D. W. (2014). Applied multivariate statistical analysis. New Jersey: Prentice-Hall.
Kantudu, A. S., and Samaila, I. A. (2015). Board characteristics, independent audit committee and financial reporting quality of oil marketing firms: Evidence from Nigeria. J. Finance, Account. Manag. 6 (2), 34.
Lang, L. H., and Stulz, R. M. (1993). Tobin's q, corporate diversification and firm performance. Beijing China: The University of Chicago Press.
Lei, W., Hui, Z., Xiang, L., Zelin, Z., Xu-Hui, X., and Evans, S. (2021). Optimal remanufacturing service resource allocation for generalized growth of retired mechanical products: Maximizing matching efficiency. IEEE access 9, 89655–89674. doi:10.1109/ACCESS.2021.3089896
Lei, X. T., Xu, Q. Y., and Jin, C. Z. (2021). Nature of property right and the motives for holding cash: Empirical evidence from Chinese listed companies. MDE. Manage. Decis. Econ. 43, 1482–1500. doi:10.1002/mde.3469
Lin, B. W., and Chen, J. S. (2005). Corporate technology portfolios and R&D performance measures: A study of technology intensive firms. R&D. Manag 35 (2), 157–170. doi:10.1111/j.1467-9310.2005.00380.x
Lo, A. W., Wong, R. M., and Firth, M. (2010). Can corporate governance deter management from manipulating earnings? Evidence from related-party sales transactions in China. J. Corp. finance 16 (2), 225–235. doi:10.1016/j.jcorpfin.2009.11.002
Lu, S., Ban, Y., Zhang, X., Yang, B., Liu, S., Yin, L., et al. (2022). Adaptive control of time delay teleoperation system with uncertain dynamics. Front. Neurorobot. 16, 928863. doi:10.3389/fnbot.2022.928863
McKnight, P. J., and Weir, C. (2009). Agency costs, corporate governance mechanisms and ownership structure in large UK publicly quoted companies: A panel data analysis. Q. Rev. Econ. Finance 49 (2), 139–158. doi:10.1016/j.qref.2007.09.008
Murphy, K. J., and Zimmerman, J. L. (1993). Financial performance surrounding CEO turnover. J. Account. Econ 16 (1), 273–315. doi:10.1016/0165-4101(93)90014-7
Murthy, N. (2006). Good corporate governance-A checklist or a mindset. George Washington University 7, 76–81. doi:10.5923/j.ijfa.20180703.03
O'Sullivan, N. (1999). Board characteristics and audit pricing post-cadbury: A research note. Eur. Account. Rev 8 (2), 253–263. doi:10.1080/096381899336023
Pan, W., Zhuang, M., Zhou, Y., and Yang, J. (2021). Research on sustainable development and efficiency of China's E-Agriculture based on a data envelopment analysis-Malmquist model. Technol. Forecast. Soc. Change 162, 120298. doi:10.1016/j.techfore.2020.120298
Peasnell, K. V., Pope, P. F., and Young, S. (2005). Board monitoring and earnings management: Do outside directors influence abnormal accruals?. J. Bus. Finance Account 32 (78), 1311–1346. doi:10.1111/j.0306-686x.2005.00630.x
Petrick, J. A., and Scherer, R. F. (2003). The Enron scandal and the neglect of management integrity capacity. Am. J. Bus 18 (1), 37–50. doi:10.1108/19355181200300003
Pfeffer, J. (1973). Size, composition, and function of hospital boards of directors: A study of organization-environment linkage. Adm. Sci. Q 18, 349–364. doi:10.2307/2391668
Salihi, A. A., and Jibril, R. U. S. (2015). The effect of board the size and audit committee the size on earnings management in Nigerian consumer industries companies. Int. J. Innovative Res. Developmen 4 (3), 84–91.
Schilling, M. A. (2000). Decades ahead of her time: Advancing stakeholder theory through the ideas of mary parker Follett. J. Manag. Hist 6 (5), 224–242. doi:10.1108/13552520010348371
Sekaran, U., and Bougie, R. (2003). Research method of business: A skill building approach. New York: John Willey & Sons.
Shen, C. H., and Chih, H. L. (2007). Earnings management and corporate governance in Asia's emerging markets. Corp. Gov 15 (5), 999–1021. doi:10.1111/j.1467-8683.2007.00624.x
Sheng, H., Cong, R., Yang, D., Chen, R., Wang, S., and Cui, Z. (2022). UrbanLF: A comprehensive light field dataset for semantic segmentation of urban scenes. IEEE Trans. Circuits Syst. Video Technol 1, 1–1. doi:10.1109/TCSVT.2022.3187664
Sheng, H., Zhang, Y., Wang, W., Shan, Z., Fang, Y., Lyu, W., et al. (2022). High confident evaluation for smart city services. Front. Environ. Sci 10, 950055. doi:10.3389/fenvs.2022.950055
Shittu, I., Ahmad, A. C., and Ishak, Z. (2016). Antimicrobial evaluation, acute and sub-acute toxicity studies of Allium sativum. Journal of Acute Disease 5 (4).
Tong, T. W., Alessandri, T. M., Reuer, J. J., and Chintakananda, A. (2008). How much does country matter? An analysis of firms’ growth options. J. Int. Bus. Stud 39 (3), 387–405. doi:10.1057/palgrave.jibs.8400355
Wooldridge, J. (2013). Introductory econometrics: A modern. Singapore: South-Western Cengage Learning.
Wu, Y., and Zhu, W. (2021). The role of CSR engagement in customer-company identification and behavioral intention during the COVID-19 pandemic. Front. Psychol 12, 721410. doi:10.3389/fpsyg.2021.721410
Xu, L., Liu, X., Tong, D., Liu, Z., Yin, L., and Zheng, W. (2022). Forecasting urban land use change based on cellular automata and the PLUS model. Land (Basel) 11 (5), 652. doi:10.3390/land11050652
Keywords: AI, economic, corporate governance, random effect regression, fintech
Citation: Khan MA, Mazliham MS, Alam MM, Aman N, Malik S, Urooj SF and Taj T (2022) An empirical mediation analysis of technological innovation based on artificial intelligence in the relationship between economic development and corporate governance mechanism. Front. Environ. Sci. 10:999096. doi: 10.3389/fenvs.2022.999096
Received: 20 July 2022; Accepted: 31 August 2022;
Published: 05 October 2022.
Edited by:
Vishal Dagar, Great Lakes Institute of Management, IndiaReviewed by:
Federica Demaria, Council for Agricultural and Economics Research (CREA), ItalyCopyright © 2022 Khan, Mazliham, Alam, Aman, Malik, Urooj and Taj. This is an open-access article distributed under the terms of the Creative Commons Attribution License (CC BY). The use, distribution or reproduction in other forums is permitted, provided the original author(s) and the copyright owner(s) are credited and that the original publication in this journal is cited, in accordance with accepted academic practice. No use, distribution or reproduction is permitted which does not comply with these terms.
*Correspondence: Muhammad Anees Khan, bG9va2FuZWVzMTIzQGdtYWlsLmNvbQ==
Disclaimer: All claims expressed in this article are solely those of the authors and do not necessarily represent those of their affiliated organizations, or those of the publisher, the editors and the reviewers. Any product that may be evaluated in this article or claim that may be made by its manufacturer is not guaranteed or endorsed by the publisher.
Research integrity at Frontiers
Learn more about the work of our research integrity team to safeguard the quality of each article we publish.