 Beiqing Cui
 Zhonghao Shui1†
 Sen Yang
94% of researchers rate our articles as excellent or good
Learn more about the work of our research integrity team to safeguard the quality of each article we publish.
Find out more
HYPOTHESIS AND THEORY article
Front. Environ. Sci. , 17 October 2022
Sec. Environmental Economics and Management
Volume 10 - 2022 | https://doi.org/10.3389/fenvs.2022.997724
This article is part of the Research Topic Eco-Innovation and Green Productivity for Sustainable Production and Consumption View all 47 articles
The carbon emission trading mechanism is an environmental regulation that has both market and government orientations and has a significant impact on the innovation of green technology and low-carbon development. Based on the evolutionary game theory and considering the strategic choices of different enterprise types in the carbon trading market, a three-party game model, involving enterprise A, the government, and enterprise B, is constructed. Based on data on the carbon emission trading market, data simulation is used to analyze the evolutionary game trajectory of government and enterprise behavior strategies. This study finds that 1) carbon prices, additional green technology innovation benefits, and innovation incentives have a significant impact on corporate strategy choices, as with higher carbon prices, additional benefits, and greater innovation incentives, green technology innovation can compensate for corporate innovation investment enterprises tending to choose innovative strategies; 2) enterprises with different innovation inputs and outputs have different strategic choices under identical conditions, such as small enterprise B having higher input and lower output than large enterprise A, and therefore, when the government encourages policies such as innovation subsidies, it must treat different types of enterprises differently; and 3) the cost of supervision and punishment can help avoid behaviors such as “floating green” and “fraudulent compensation”, but enterprises and the supervision strategy of the government are affected by the associated supervision cost. This study not only further verifies the Porter hypothesis in both theory and practice but also has important implications for corporate green innovation strategies and government regulatory behavior while providing a reference for the carbon emission trading market and corporate low-carbon development.
The advancement of the global industrialization process has not only created unprecedented wealth for human beings but also caused irreparable damage to the natural environment (Yang et al., 2020; Yu et al., 2020). As a byproduct of energy consumption, the substantial increase in the total amount of carbon dioxide emissions has had a series of adverse effects on the ecological environment and global climate (Ren et al., 2022a; Zhang et al., 2022). The carbon emission trading mechanism is regarded as one of the most efficient market means to reduce energy consumption and carbon dioxide emissions and has an important impact on the promotion of low-carbon development and guiding of the green technology innovation of enterprises (Hammoudeh et al., 2015; Zhao et al., 2020). Green technology innovation has the characteristics of “innovation” and “green,” thus not only reflecting the concept of green and sustainable development but also meeting the requirements of the era of high-quality economic development. Such innovation is an effective method to solve the dilemma of economic growth, energy conservation, and emission reduction (Wang and Zhang, 2020). Therefore, the study on the green technology innovation of enterprises under the carbon emission trading market is of great significance for both policymakers and enterprises.
The carbon emission trading mechanism is a dual-oriented environmental regulation with both market and government orientations that internalizes the externalities brought about by carbon emissions through a price mechanism (Wei and Ren, 2021). On the one hand, enterprises can purchase carbon emission rights in the carbon trading market, thereby increasing the cost of emission reduction, and on the other hand, enterprises can obtain innovation incentives and additional income through green technology innovation, simultaneously selling excess carbon emission rights and making profits (Jiang et al., 2022a). Profit-seeking companies choose technological innovation under the constraints of carbon emissions to promote low-carbon production and reduce carbon emissions per unit of output (Fan et al., 2022).
However, whether the carbon emission trading mechanism can induce corporate innovation is a hot issue that has been widely considered in academic and practical circles. Porter and Vander Linde (1995) pointed out that rationally designed environmental regulations can stimulate innovation and produce innovation compensation effects. In other words, environmental regulations play an important role in promoting technological innovation. Johnstone et al. (2012), Qi and Zhang (2019), Ley et al. (2016), and Dong and Wang (2021), among other studies, have considered the Porter hypothesis. However, some scholars’ studies have shown that environmental regulation hinders green technology innovation. In other words, the Porter hypothesis is not necessarily true. Wu et al. (2019), Ren et al. (2019), and Zhang (2020), among others, have suggested that the environmental regulation increases enterprise costs, thus inhibiting the technological innovation of enterprises. Ren et al. (2021) showed that in addition to those target heavy-polluting industries directly, the environmental regulations do not result in improved environmental effects. In the absence of sufficient market and institutional elements for matching, excessive technological investment forms a “resource curse” effect, which is not conducive to green technology innovation (Zhu et al., 2022). The cost of green technology innovation for enterprises to achieve zero carbon emissions is too high, and the increase in environmental governance investment causes enterprise costs to become too high, thus forming a crowding out effect on corporate R&D investment and hindering corporate green technology innovation (Wang et al., 2022). Therefore, one of the aims of this study is to explore whether corporate innovation can be induced under the carbon emission trading mechanism and to verify the Porter hypothesis.
As a participant in the emission trading market, there is a supply and demand relationship between enterprises, and different innovation costs have an important impact on the strategic choice of enterprises. The adoption of green innovation technology by enterprises can help them enhance their sustainable development and maintain their relative advantages in the face of future market competition (Tang and Hu, 2018). However, negative externalities such as higher R&D costs and uncertain green product demand reduce the drive of enterprises to adopt green innovation technologies (Wang and Li, 2021a). Therefore, the study on the strategy choice of enterprises with different innovation costs in the carbon emission trading market is another aim of this research study.
More importantly, in the carbon emission trading market dominated by the government, the strategies of the government and the enterprises restrict and influence each other (Fang et al., 2021). Government behavioral strategies can lead to “superficial” innovation by firms. The market-oriented green technology innovation system is an important means to promote the construction of an ecological civilization (Lu et al., 2021), but the technological innovation of enterprises is also characterized by disturbances such as large investment, high risk, and uncertain returns, leading to enterprises, as “economists,” exhibiting discretionary behaviors (Liang and Xu, 2020). Small enterprises are prone to shut down under strict environmental protection policies due to factors such as transformation and sunk costs, while some large and medium-sized enterprises are prone to strategic innovations such as “greenwashing on the surface” and “greening in the short term” due to the short-term profit-seeking behavior (Shao et al., 2018). Although the government regulation forces enterprises to carry out green technology innovation to a certain extent, the compensation for the green innovation of enterprises is limited to the upper limit of administrative penalties, which can easily lead to some enterprises being satisfied with the “standards” of green innovation activities (Tao et al., 2021). Then, under the carbon trading market, the identification of how the government implements innovation incentive strategies to avoid the phenomenon of “pseudo-innovation” or “subsidy fraud” while promoting corporate emission reduction research and development is the third goal of this study.
Focusing on the three issues mentioned previously, this study builds a three-party evolutionary game model involving enterprise A, the government, and enterprise B, under the carbon emission rights trading mechanism based on previous research works and considering the strategic behavior of different types of enterprises. The data on the rights trading market are simulated, and the game stability strategies of each subject under different scenarios are obtained. The present study is different from those in the literature as follows: first, this research method fully considers the different results produced by the different innovation costs of enterprises. Existing studies have usually not distinguished between enterprises with different green technology innovation costs, which may lead to a “one-size-fits-all” policy that can adversely affect some enterprises. Thus, this study makes up for this deficiency. Second, the evolutionary game method using bounded rationality is more realistic than the other methods. When studying the game relationship between the government and enterprises, many scholars have adopted the traditional game model based on the assumption of complete rationality. However, in fact, the information about the participants in the game is incomplete, and both the government and enterprise are often not completely rational. Therefore, the game model based on bounded rationality has more practical value.
Our research finds that 1) carbon prices, additional benefits of technological innovation, and innovation incentives have important influences on corporate strategy choices; 2) enterprises with different innovation inputs and outputs have different strategic choices under the same conditions, as for large enterprises with lower innovation costs, it is easier to compensate for their innovation costs through the carbon emission trading market and thus choose technological innovation, while small enterprises with high innovation input and low output tend to purchase carbon emission rights in the carbon market; and 3) the penalty cost of supervision and “pseudo-innovation” helps avoid pseudo-innovation behaviors such as the “short-term greenery” of enterprises. In addition, the simulation results of different scenarios all show that the Porter hypothesis is valid; that is, the Porter hypothesis is further verified both theoretically and practically.
The contributions of this study are as follows: first, this study provides a new perspective on the study of corporate green technology innovation. Based on the carbon emission trading market, we analyze green technology innovation from the dual orientation of market and policy. This approach avoids the insufficiency of analyzing government and enterprise behavior strategies from a single orientation of either policy or market.
Second, this study specifically distinguishes the strategic choices of enterprises with different innovation costs in the carbon emission trading market, thus providing a reference for the formulation of government incentives. Previous studies have usually regarded the innovation costs of enterprises as being exactly the same, and few studies have considered that enterprises have different innovation costs. Therefore, we distinguish the strategic choices of enterprises with different innovation costs. Under the carbon emission trading mechanism, we study the strategic choices of enterprises with different innovation costs from the perspective of the supply and demand relationship of carbon emission rights.
Third, with the help of the evolutionary game model, this study deeply analyzes the relationship between government behavior and enterprise green technology innovation, discusses the data simulation of different scenario models, and offers new solutions for the government, such as “strategic innovation” and “short-term greenwashing,” in terms of governing the behaviors of enterprises.
The rest of the article is organized as follows: Section 2 reviews the relevant literature and proposes and analyzes the evolutionary game theory adopted in this research; Section 3 proposes research hypotheses and constructs a three-party evolutionary game model involving enterprise A, the government, and enterprise B; Section 4 analyzes the evolutionary equilibrium of the evolutionary game participants’ strategies; Section 5, based on the data on the carbon emission trading market, simulates the equilibrium strategy; and Section 6 presents future research directions.
Carbon dioxide produced by energy consumption has brought about serious environmental problems to the world (Ren et al., 2022a; Jiang et al., 2022a). With the increasingly serious impact of carbon dioxide on the environment, low-carbon development has attracted the attention of all countries. In the face of carbon dioxide emissions and environmental changes, how to balance economic growth and environmental protection has become an important issue. Green technology is considered an important tool for balancing environmental degradation and economic development (Xu and Cui, 2020).
Green technology innovation is the general term for those processes and technologies for controlling environmental pollution and improving resource utilization (Braun and Wield, 1994), aiming to emphasize the use of new technologies and concepts to achieve the efficient use of resources and effective reduction in pollution while obtaining the corresponding economic performance (Wang and Li, 2019) to achieve a win–win situation for economic benefits and environmental protection. However, some scholars have found that the green technology innovation of enterprises in practice, both economic benefits and environmental benefits, is obtained, showing a positive externality; however, due to the unclear definition of environmental property rights and the unsound revenue economy system, such innovation causes market failure and exhibits negative externalities; that is, there are double externalities in green technology innovation (Cai and Li, 2018; Bian et al., 2021). Moreover, the “dual externalities” brought about by technological spillovers and environmental protection often lead to “dual market failure,” which causes green technology innovation investment to decrease to below the socially optimal scale for a long time (Jaffe et al., 2004). Therefore, there is an urgent need to explore reasonable and effective environmental policies to eliminate such “dual market failure” and promote green technology innovation to achieve the “dual carbon goal” (Xu et al., 2022).
In fact, the government and enterprises are two participants in the carbon emission trading market, and their relationship is actually a game process between the achievement of the government’s emission reduction targets and the long-term behavior choices of enterprises (Chen et al., 2021). On the one hand, the carbon price affects the emission reduction cost of enterprises, which in turn affects the way of their emission reduction (Jiang et al., 2022b). On the other hand, the government can improve both the efficiency of the carbon market and the effectiveness of carbon emission reduction through carbon emission trading (Ren et al., 2022b; Ren et al., 2022c). Moreover, the regulation of the government will also have an impact on the carbon market, thereby improving the environment (Ren et al., 2022d). Therefore, how to analyze the mechanism of action between the two and explore the evolutionary path of green technology innovation under the carbon emission trading mechanism is a proposition worthy of further study. However, due to the complexity of the relationship between the government and enterprises, there is no standard index system for measuring the evolution path between these two factors. The game theory, as a tool for studying the strategic choices of participants, can well analyze the whole process of government–enterprise games. For example, Cao et al. (2011) constructed a three-stage dynamic game model to study the impact of government incentives on corporate emission reductions. For low-carbon development, Wan and Lu (2015) constructed a dynamic game model between the government and enterprises under an environmental pollution emission quota system and studied and analyzed the dynamics of the government’s expectation of social costs and enterprises’ pollution reduction costs under different circumstances. Moreover, Zu et al. (2018) used a Stackelberg game model to analyze the optimal strategic choices of the government and enterprises in the supply chain. It is worth noting that the aforementioned game models are traditional game models, which are based on the assumption that game participants are completely rational and that participants make strategic choices under the condition of complete information (Fang et al., 2021). However, in the real economic world, the conditions of complete rationality and complete information about participants are difficult to achieve, and both the government and enterprises are often not fully rational (Simon, 1990).
To make up for this shortcoming of the traditional game theory, many scholars have used evolutionary games to study green technology innovation based on bounded rationality. Under the assumption of bounded rationality, Wang and Li (2021b) and Wang and Liu (2022) constructed a business–consumer–government tripartite evolutionary game model to analyze the evolution process of the equilibrium strategy of the system under different real-world situations and explore the evolution path and law of the three-party decision-making subject under the market-oriented mechanism. Although this evolutionary game model was constructed based on the assumption of bounded rationality, the research perspectives of different scholars can differ. Under policy guidance, Shang et al. (2021), with the help of the evolutionary game theory, focused on analyzing the process of different policies for enterprises in selecting two green technology innovation modes—resource capture and value creation. Moreover, Chen et al. (2021) constructed an evolutionary game model between the government and enterprises across regions and discussed the evolution process of government supervision and decision-making and government-to-enterprise green technology transformation decisions. It is believed that strict environmental regulation policies and supervision mechanisms promote the green technology transformation of enterprises. The aforementioned scholars studied green technology innovation from a single orientation based on the assumption of bounded rationality, while Chen et al. (2022) used the evolutionary game theory to construct a two-stage evolutionary game model of green technology innovation diffusion based on complex market networks. Analyzing the optimal and stable conditions for the diffusion of green technology innovation from the perspectives of the government and market provides a new research aim for this study. However, the aforementioned scholars did not consider that different types of enterprises have different effects on the strategic choice of green technology innovation.
In summary, although the evolutionary game theory has been used by many scholars to study the evolution process of corporate green technology innovation under environmental regulation, the existing research is still based on policy orientation, and few studies have explored the choice of government and enterprise strategies in the carbon emission trading market from the dual orientation of the government and the market. More importantly, evolutionary game models usually see companies as homogeneous and ignore the strategic choices of companies with different innovation costs.
In a market where green technology innovation and carbon emission trading coexist, the government and different enterprise types, as game participants, have limited rationality. Enterprises can be divided mainly into two groups, namely, large enterprise A and small enterprise B, and their strategies are the same: {innovation, purchasing}. The government is recorded as group G, and its strategy is {strict regulation, loose regulation}.
Assumption 1: the initial payoff of enterprise i is Ri>0; i = A, B.
Assumption 2: according to the requirements of the government, the carbon emission reduction required by enterprise i is qi, and the trading price of carbon emission allowances that is determined by the market is p.
Assumption 3: the innovation cost of enterprise i is Ci, and its carbon emission reduction following innovation is Qi. Here, Qi > qi; that is, enterprise i not only fulfills government requirements following innovation but also has an excess carbon emission quota (Qi -qi) for sale in the market. At this time, if enterprise j adopts the purchasing strategy, then enterprise i is able to obtain additional income △I; otherwise, it is zero, where j = A, B and j≠i.
Assumption 4: if only enterprise i chooses to innovate, then the government can obtain benefit πi. If both enterprises A and B choose innovation, then the government can obtain benefit π.
Assumption 5: the government has introduced environmental regulations as a means of encouraging enterprises to innovate green technologies. The government provides enterprise j with special funds wi to assist it in developing green technology innovations. Regardless of the strategy of the government, both enterprises have access to this special fund. To prevent enterprises from “defrauding” such special funds, the government regulates the market with a certain probability, and its regulation cost is CG. If the government chooses a strict regulation, then the probability of the regulation is 1. If the government chooses a loose regulation, then the probability of the regulation is α, where 0≤α < 1. When the government regulates the market, if enterprise j chooses to purchase, then special fund wi is recovered, and a fine, Ti, can then be imposed.
Assumption 6: the probabilities of enterprises A and B choosing innovation are x and y, respectively, where 0 ≤ x ≤ 1 and 0 ≤ y ≤ 1. The probability of the government choosing a strict regulation is z, where 0 ≤ z ≤ 1. In addition, x, y, and z are all functions of time.
Based on the aforementioned assumptions, the payoff matrix of the evolutionary game among enterprise A, enterprise B, and the government is shown in Tables 1 and 2. The first, second, and third rows of each cell in Tables 1, 2 the payoff of enterprise A, enterprise B, and the government, respectively.
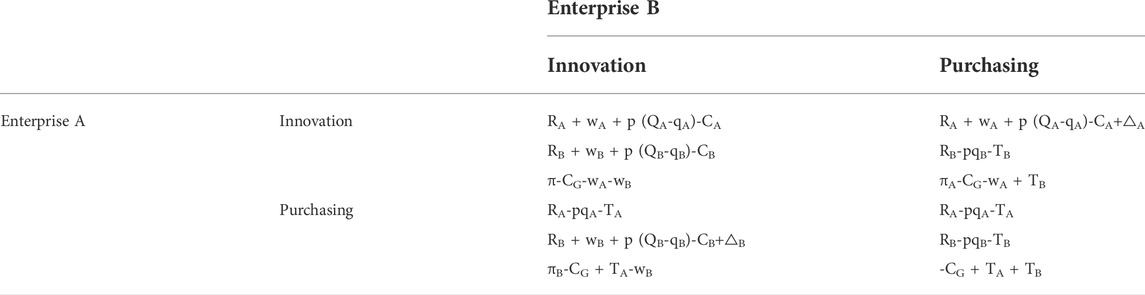
TABLE 1. Government chooses a strict regulation of the payment matrix.
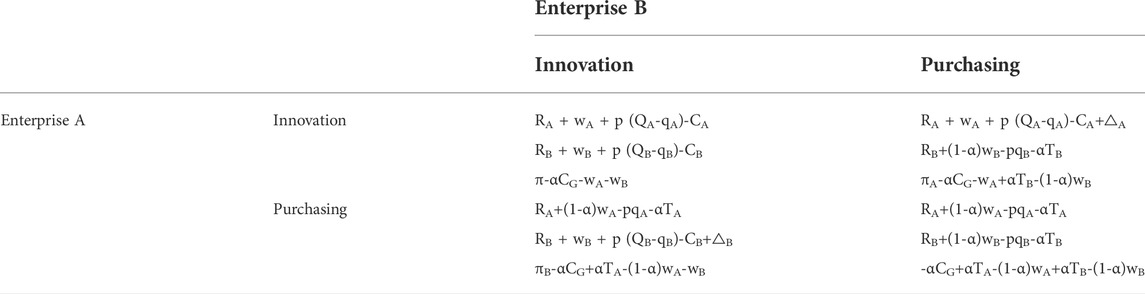
TABLE 2. Government chooses a lenient regulation of the payment matrix.
As shown in the aforementioned tables, the expected payoffs of enterprise A based on the strategies of innovation and purchasing are EAx and EA1−x, respectively. The average expected payoff is EA.
The expected government payoffs based on the strict regulation and loose regulation strategies are EGz and EG1−z, respectively. The average expected payoff is EG.
According to the evolutionary game theory, the replication dynamic equation of enterprise A, enterprise B, and the government can be obtained from Eqs 1–9:
The influence of the probability of the adoption of innovative strategies of enterprises A and B on their stable equilibrium strategies can be described by Eqs 13, 14:
Proposition 1. x rises as y falls, and y rises as x falls, that is., when one enterprise adopts innovation, the other has a tendency to choose purchasing.Proof: let yA = [△A+(z+α-zα) (wA+TA)+pQA-CA]/△A. When y>yA, dF(x)/dx|x = 0<0, the evolutionary stability strategy of enterprise A is x = 0, and all enterprises A have a tendency to buy carbon emission rights. When y = yA, dF(x)/dx≡0, the evolutionary stability strategy of enterprise A is x = 1, and all enterprises A have a tendency to select innovation. When y<yA, dF(x)/dx|x = 1<0, the evolutionary stability strategy of enterprise A is x = 1, and all enterprises A have a tendency to choose innovation. The last statement is self-evident according to its symmetry.
Proposition 2. x and y both increase as z increases, that is, when the government adopts a strict regulation, both enterprises A and B have a tendency to purchase carbon emission rights.Proof: let zA = [-α(wA+TA)-pQA+CA-(1-y)△A]/[(1-α) (wA+TA)]. The remainder of the proof is similar to that of Proposition 1 and is therefore omitted.
Proposition 3. when enterprise i obtains a government incentive and satisfies α(wi+Ti)>Ci-pQi, regardless of which strategy is adopted by enterprise j (j≠i) and the government, enterprise i has a tendency to adopt innovation. When enterprise i obtains the government incentive to satisfy (z+α-zα) (wi+Ti)>Ci-pQi, regardless of which strategy is adopted by enterprise j, enterprise i has a tendency to adopt innovative strategies. When enterprise i obtains a total incentive to satisfy △i+wi+Ti<Ci-pQi, regardless of which strategy is adopted by enterprise j and the government, enterprise i has a tendency to adopt a purchasing strategy. When the total incentive obtained by enterprise i satisfies △i+(z+α-zα) (wi+Ti)<Ci-pQi, regardless of which strategy is adopted by enterprise j, enterprise i has a tendency to adopt a purchasing strategy.Proof: due to symmetry, the four statements that hold for enterprise A are sufficient. 1) When α (wA+TA)>CA-pQA, (z+α-zα) (wA+TA)+pQA-CA+(1-y)△A>0 holds true for any y and z, and the evolutionary stability strategy of enterprise A is x = 1. 2) When (z+α-zα) (wA+TA)>CA-pQA, (z+α-zα) (wA+TA)+pQA-CA+(1-y)△A>0 for any arbitrary y constant is established, and the evolutionary stability strategy of enterprise A is x = 1. 3) When △A+wA+TA<CA-pQA, (z+α-zα) (wA+TA)+pQA-CA+(1-y)△A<0 holds true for any y and z, and the evolutionary stability strategy of enterprise A is x = 0. 4) When △A+(z+α-zα) (wA+TA)<CA-pQA, (z+α-zα) (wA+TA)+pQA-CA+(1-y)△A<0 for arbitrary y is constant, and the evolutionary stability strategy of enterprise A is x = 0.
The influence of the probability of the adoption of a strict regulatory strategy by the government on its stable equilibrium strategy is described by Eq. 15:
Proposition 4. z increases as x and y decrease, that is, when both enterprises A and B innovate, the government has a tendency to loosen its supervision.Proof: the proof is similar to that of Proposition 1 and is therefore omitted.
Proposition 5. when the regulatory cost of the government satisfies CG>wA+TA+wB+TB, regardless of which strategy is adopted by enterprises A and B, the government has a tendency to adopt a lenient regulatory strategy. When the regulatory cost of the government satisfies CG<(1-y) (wB+TB), regardless of which strategy is adopted by enterprise A, the government has a tendency to adopt a strict regulatory strategy. When the regulatory cost of the government satisfies CG<(1-x) (wA+TA), regardless of which strategy is adopted by enterprise B, the government has a tendency to adopt a strict regulatory strategy.Proof: the proof is similar to that of Proposition 3 and is therefore omitted.
From Eqs 10–12, the equations of the replication dynamic system of the three-group game, involving enterprise A, enterprise B, and the government, can be obtained. By solving these equations, we can obtain the following 15 equilibrium points:
E1 = (0,0,0); E2 = (1,0,0); E3 = (0,1,0); E4 = (0,0,1); E5 = (1,1,0);
E6 = (1,0,1); E7 = (0,1,1); E8 = (1,1,1);
E9 = (0, (wA+TA+wB+TB-CG)/(wB+TB), [CB-α(wB+TB)-pQB-△B]/(1-α) (wB+TB));
E10 = (1, (wB+TB-CG)/(wB+TB), [CB-α(wA+TA)-pQB]/(1-α) (wB+TB));
E11 = ((wA+TA+wB+TB-CG)/(wA+TA), 0, [CA-α(wA+TA)-pQA-△A]/(1-α) (wA+TA));
E12 = ((wA+TA-CG)/(wA+TA), 1, [CA-α(wA+TA)-pQA]/(1-α) (wA+TA));
E13 = ([α(wB+TB)+pQB+△B-CG]/△B, [α(wA+TA)+pQA+△A-CG]/△A, 0).
E14 = ((wB+TB+pQB+△B-CG)/△B, (wA+TA+pQA+△A-CG)/△A, 1),
E15 = ([(CA-pQA) (wB+TB)-(CB-pQB) (wA+TA)-△ACG+(wA+TA) (△A+△B)]/(wA+TA) (△A+△B),
(CB-pQB) (wA+TA)-(CA-pQA) (wB+TB)-△BCG+(wB+TB) (△A+△B)]/(wB+TB) (△A+△B),(CB-pQB) (wA+TA)△A+(CA-pQA)
(wB+TB)△B-△A△BCG-α(wA+TA) (wB+TB) (△A+△B)]/(1-α) (wA+TA) (wB+TB) (△A+△B).
The Jacobian matrix of the equations of the replication dynamic system is as follows:
among which, ∂F(x)/∂x = (1-2x)[(z+α-zα) (wA+TA)+pQA-CA+(1-y)△A].∂F(x)/∂y = -x(1-x)△A.∂F(x)/∂z = x(1-x) (1-α) (wA+TA).∂F(y)/∂x = -y(1-y)△B.∂F(y)/∂y = (1-2y)[(z+α-zα) (wB+TB)+pQB-CB+(1-x)△B].∂F(y)/∂z = y(1-y) (1-α) (wB+TB).∂F(z)/∂x = -z(1-z) (1-α) (wA+TA).∂F(z)/∂y = -z(1-z) (1-α) (wB+TB).∂F(z)/∂z = (1-2z) (1-α)[-CG+(1-x) (wA+TA)+(1-y) (wB+TB)].
According to the method proposed by Friedman (1991), when the real parts of the eigenvalues of Eq. 16 are all negative, the corresponding equilibrium point is ESS. Due to parameter uncertainty, the stability of the aforementioned equilibrium point is further analyzed in the following paragraphs.
Proposition 6. In any case, E8 = (1,1,1) is not an ESS; that is, if enterprises A and B choose to innovate at the same time, then the government choosing strict supervision is considered an unstable strategy.
Proof: the Jacobian matrix of E8 = (1,1,1) is a diagonal matrix, and its eigenvalues are -α(wA+TA)-pQA+CA, -α(wB+TB)-pQB+CB, and (1-α)CG. Moreover, E8 = (1,1,1) is not an ESS since (1-α)CG>0.
Proposition 7. (I) When CA-pQA<α(wA+TA) and CB-pQB<α(wB+TB), E5 = (1,1,0) is an ESS.(II) When CA-pQA<α(wA+TA), α(wB+TB)<CB-pQB<α(wB+TB)+△B, and CG>max{wA+TA,wB+TB}, E2 = (1,0,0) is an ESS.(III) When CB-pQB<α(wB+TB), α(wA+TA)<CA-pQA<α(wA+TA)+△A, and CG>max{wA+TA,wB+TB}, E3 = (0,1,0) is an ESS.(IV) When CA-pQA>wA+TA+△A, CB-pQB>wB+TB+△B, and CG<wA+TA+wB+TB, E4 = (0,0,1) is an ESS.(V) When CA-pQA<α(wA+TA), CB-pQB>wB+TB+△B, and CG<wB+TB, E6 = (1,0,1) is an ESS.(VI) When CA-pQA>wA+TA+△A, CB-pQB<α(wB+TB), and CG<wA+TA, E7 = (0,1,1) is an ESS.(VII) When wA+TA+△A>CA-pQA>wA+TA, CB-pQB>wB+TB+△B, and CG<min{wA+TA, wB+TB}, E6 = (1, 0, 1) is an ESS.(VIII) When CA-pQA > wA + TA+△A, wB + TB+△B > CB-pQB > wB + TB, and CG < min{wA + TA,wB + TB}, E7 = (0,1,1) is an ESS.Proof: under the conditions of (I)–(VIII), only E1–E8 satisfy 0 ≤ x ≤ 1, 0 ≤ y ≤ 1, and 0 ≤ z ≤ 1. Therefore, the eigenvalues of (4-4) are as follows:
λ1 = (1-2x)[(z+α-zα) (wA + TA)+pQA-CA+(1-y)△A].
λ2 = (1-2y)[(z+α-zα) (wB + TB)+pQB-CB+(1-y)△B].
λ3 = (1-2z) (1-α)[-CG+(1-x) (wA + TA)+(1-y) (wB + TB)].
Under the aforementioned conditions, the symbols of the eigenvalues that correspond to each equilibrium point are shown in Table 3. Moreover, the proof is completed in Table 3.
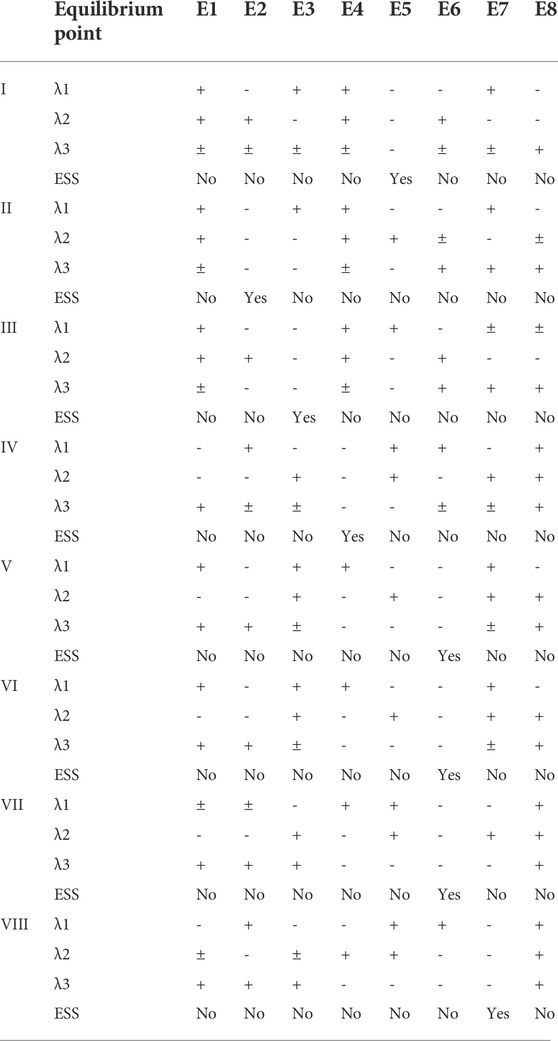
TABLE 3. Symbols of eigenvalues that correspond to I, II, III, IV, V, VI, VII, and VIII.
Proposition 8. E8=(1,1,0) is an ESS if and only if CA-pQA<α(wA + TA) and CB-pQB<α(wB + TB). Moreover, E8=(1,1,0) is a unique ESS.Proof: based on Proposition 7 and Table 3, sufficiency and uniqueness are self-evident. Regarding necessity, it is noted that the eigenvalues of (4-4) at E8 are -[α(wA + TA)+pQA-CA], -[α(wB + TB)+pQB-CB], and -(1-α)CG. Therefore, necessity can be demonstrated by Friedman’s method.
From the aforementioned theoretical analysis, for the further study of the path of evolution for different types of enterprises and the government in the carbon emission trading market, market data are used to visualize the dynamic behavior of both sides of the game. According to carbon emission trading market data from China, as of 31 December 2021, 2,162 carbon emission companies were included, with total emissions of 4.5 billion tonnes, a quota transaction volume of 179 million tonnes, and a quota transaction value of 7.661 billion yuan. For the ratio of the quota turnover to quota transaction volume, the estimated transaction price is 42.80 yuan/tonne. For calculational convenience, the initial value of P in this article is 40 yuan/tonne.
When considering the strategy choice between different enterprise types, assuming enterprise A to be a large enterprise and enterprise B to be a small enterprise, and assuming the technological innovation input‒output ratio of A to be better than that of B, the emission reduction of enterprise A is better than that of enterprise B when the innovation costs of both enterprises are the same. With reference to the Implementation Plan for the Setting and Allocation of Total National Carbon Emission Trading Quotas for 2019–2020 (power generation sector), it is assumed that the initial emissions of enterprises A and B are 50,000 and 10,000 tonnes of carbon dioxide, respectively. It is then assumed that carbon emission reduction through innovation is 60,000 tonnes for enterprise A and 15,000 tonnes for enterprise B following innovations. The innovation input for the emission reduction of 10,000 tonnes of carbon dioxide per year for enterprise A is assumed to be 10 million, and for the emission reduction of 0.5 million tonnes of carbon dioxide per year, it is 6 million for enterprise B.
With reference to the Measures for Promoting Green and Low-carbon Development of the Guangzhou High-Tech Zone, Guangzhou Development Zone, a subsidy of 500 yuan per tonne of standard coal is given based on energy savings. Following conversion, a subsidy of 200 yuan per tonne is given to companies that are able to reduce their carbon dioxide emissions by over 500 tonnes per year. With reference to the Guidance Catalogue of Comprehensive Administrative Law Enforcement Matters for Ecological Environmental Protection (2020 Edition), this study imposes penalties on those enterprises that conduct pseudo-innovation of twice the amount of the subsidies. China currently has strict supervision of its carbon emission market, so the initial value of α is set to 0.8. Table 4 shows the initial data.
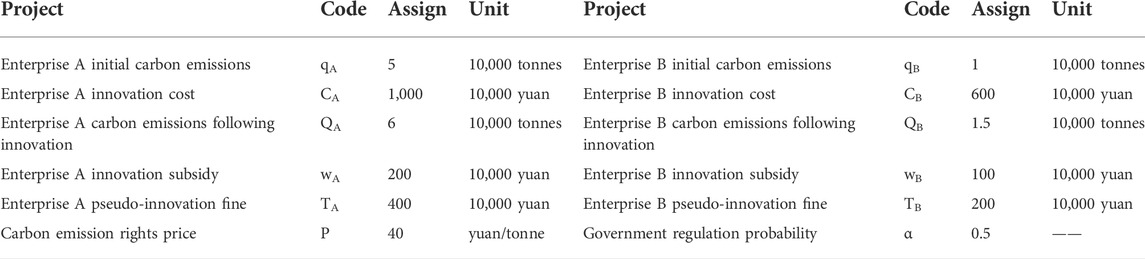
TABLE 4. Initial values.
According to the theoretical analysis, the choice of equilibrium strategies for the government and different enterprise types is dependent on their respective costs and benefits, but with different parameters, the equilibrium strategy choice is also different. This study uses MATLAB software to simulate the data, and the main results are presented in the following section.
Scenario 1: IV is the initial state. Based on the initial data from Table 4, when △A<160 and △B<240, let △A = 100 and △B = 200, and assuming supervision cost CG = 200, IV is satisfied. Therefore, there is only one ESS in E1 and E4; enterprises A and B have significant innovation losses, and neither enterprise makes the choice to innovate. The government chooses strict supervision, and its stabilization strategy is (0, 0, 1) (as shown in Figure 1).
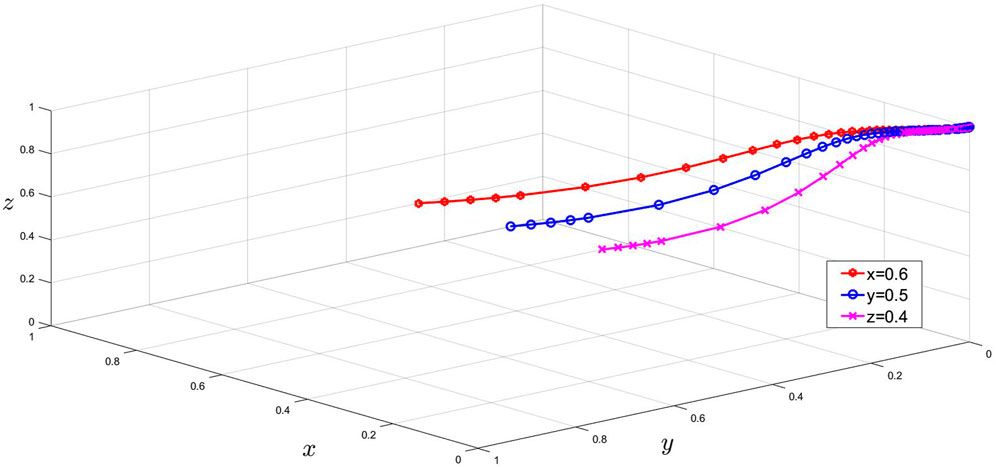
FIGURE 1. Evolutionary trajectory of the three-group game under condition IV.
Scenario 2: the price of carbon trading in China is currently approximately 80 yuan, so when it increases from 40 to 80, assuming that △B = 300, CG = 700, and α = 0.9, II is satisfied, and E2 is an ESS. The government chooses lenient supervision, enterprise A chooses innovation, and enterprise B chooses to purchase carbon emission rights, and thus the stabilization strategy is (1, 0, 0) (as shown in Figure 2).
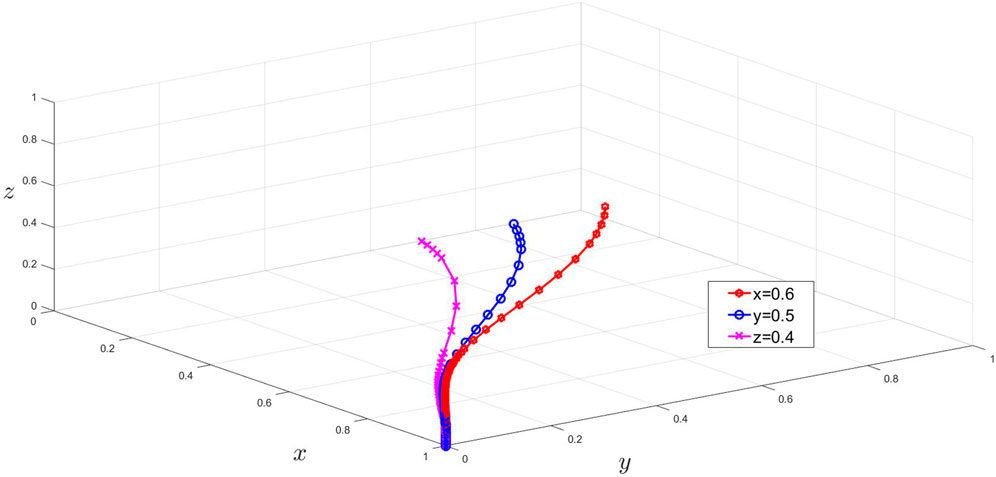
FIGURE 2. Evolutionary trajectory of the three-group game under condition II.
Scenario 3: with the other conditions remaining unchanged, as the carbon trading price continues increasing, when p = 300 yuan, it is assumed that α = 0.8. At this point, I is satisfied, and E5 is an ESS. The government chooses a loose regulation, enterprises A and B both choose innovation, and thus the stabilization strategy is (1, 1, 0) (as shown in Figure 3).
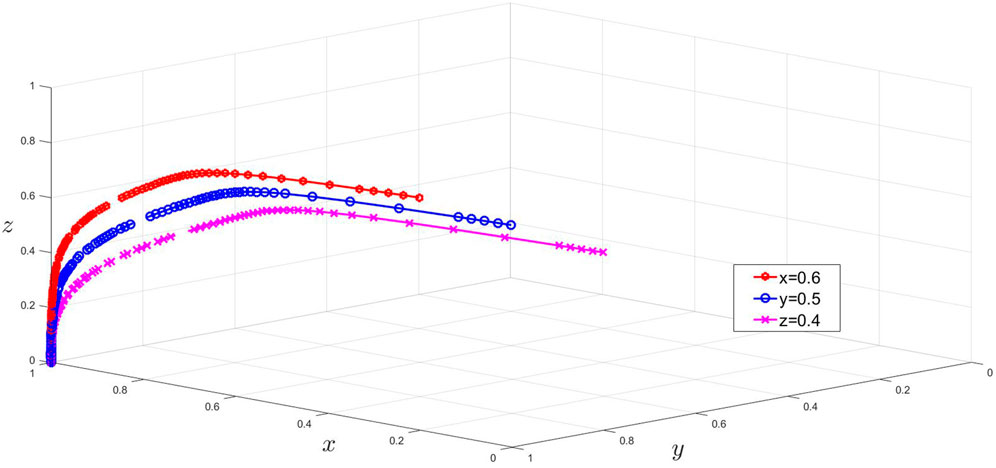
FIGURE 3. Evolutionary trajectory of the three-group game under condition I.
From the data simulation, it can be seen that as the carbon trading price increases, large enterprise A is able to compensate for its innovation loss by selling its carbon emission rights through technological innovation, and its strategy changes from purchasing to innovating (Figures 1, 2). As the carbon trading price continues to increase, enterprises A and B choose technological innovation and compensate for their innovation costs by obtaining benefits from the carbon trading market. Therefore, enterprises A and B choose innovation (Figures 1–3). In addition, the simulation results indicate that for large enterprises with high input‒output innovation, such as enterprise A, increasing the purchase price to obtain more benefits is quite easy, and in such a situation, enterprises have a greater inclination to choose technological innovation. However, enterprise B, with low input–output innovation, chooses technological innovation only when the carbon trading price is quite high.
Scenario 4: when the carbon price remains unchanged, p = 40, and when green technology innovation provides additional benefits for enterprises A and B, such as △A = 200, △B = 200, and CG = 200, VII is satisfied, and E6 is an ESS. The government chooses strict supervision, enterprise A selects innovation, and enterprise B chooses to buy carbon emission rights. The stabilization strategy is (1, 0, 1) (as shown in Figure 4).
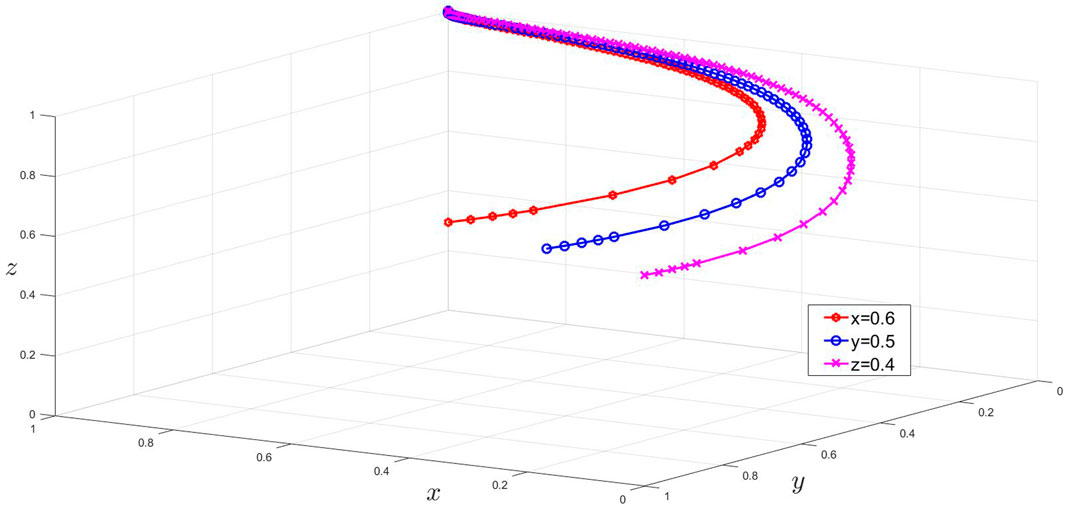
FIGURE 4. Evolutionary trajectory of the three-group game under condition Ⅶ.
Scenario 5: based on Scenario 4, when the additional income of enterprises A and B continues to decrease, assuming that △A = 100, △B = 400, p = 40, and CG = 200, VIII is satisfied, and E7 is an ESS. The government chooses strict supervision, enterprise B selects innovation, and enterprise A chooses to buy carbon emission rights. The stabilization strategy is (0, 1, 1) (as shown in Figure 5).
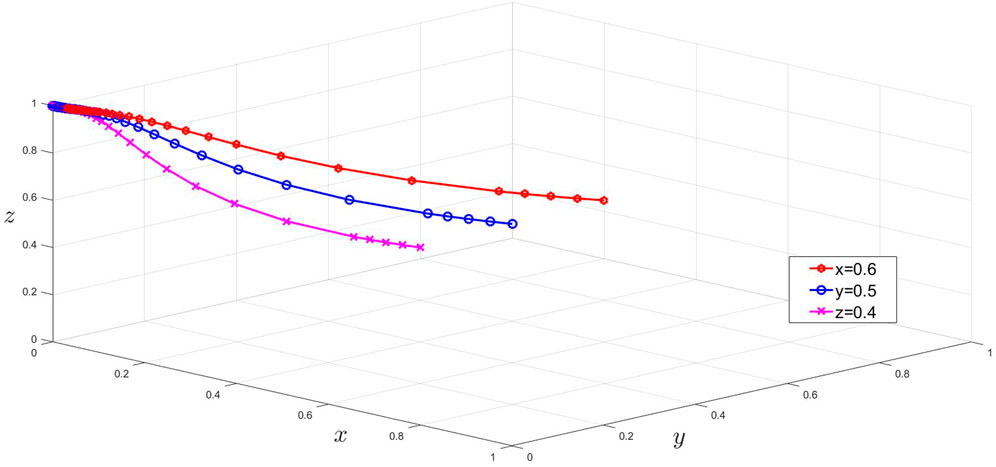
FIGURE 5. Evolutionary trajectory of the three-group game under condition Ⅷ.
The additional benefits brought about by technological innovation to the enterprise refer to the value or benefits created by green technology innovation for the enterprise, including a good reputation and word of mouth. When an enterprise expands its additional income through innovation, its strategic choice in terms of the innovation strategy it selects is affected. When enterprise A chooses to innovate and the additional benefits it attains increase, its stabilization strategy is to switch from carbon purchases to technological innovation (Figures 1, 4). Similarly, when enterprise B obtains additional income through innovation, it also chooses a technological innovation strategy (Figures 1, 5).
Scenario 6: the price of carbon trading in China is approximately 80 yuan, and when p = 80, assuming that △B = 100, CG = 200, and α = 0.9, V is satisfied. The government chooses strict supervision, enterprise B chooses to buy carbon emission rights, and enterprise A chooses to innovate. The stabilization strategy is (1, 0, 1) (as shown in Figure 6).
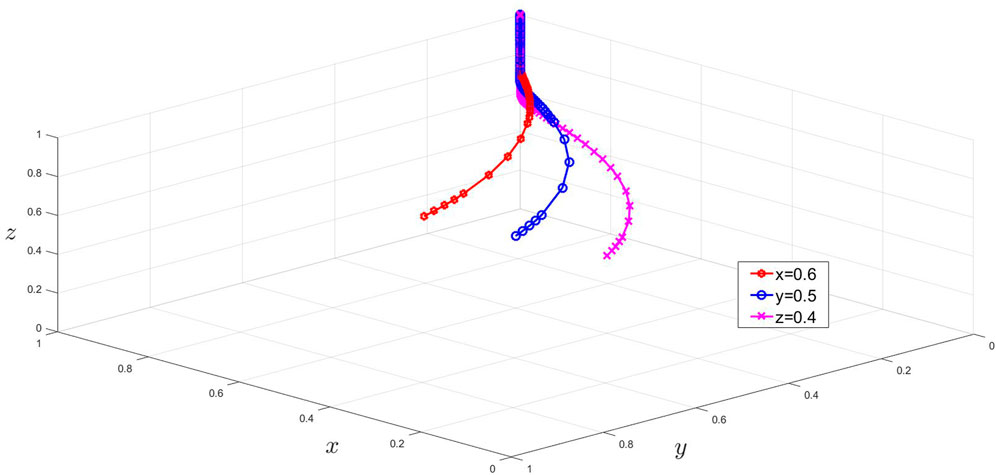
FIGURE 6. Evolutionary trajectory of the three-group game under condition Ⅴ(a).
Regulatory costs significantly impact the choice of stabilization strategy by the government. From the simulation results, it can be seen that when the regulatory cost is low, the government chooses lenient regulation (see Figure 1). However, as the cost of supervision increases, the supervision strategy of the government changes from strict to lenient supervision (see Figure 2). The higher the probability of supervision, such as α = 0.8, the greater the government’s tendency to be strict (see Figure 3).
Scenario 7: under IV conditions, when WA increases to 1,000 and TA increases to 2,000, assuming that α = 0.5, V is satisfied, and E5 is an ESS. The government chooses strict supervision, enterprise A chooses innovation, and enterprise B chooses to purchase carbon emission rights. The stabilization strategy is (1, 0, 1) (as shown in Figure 7).
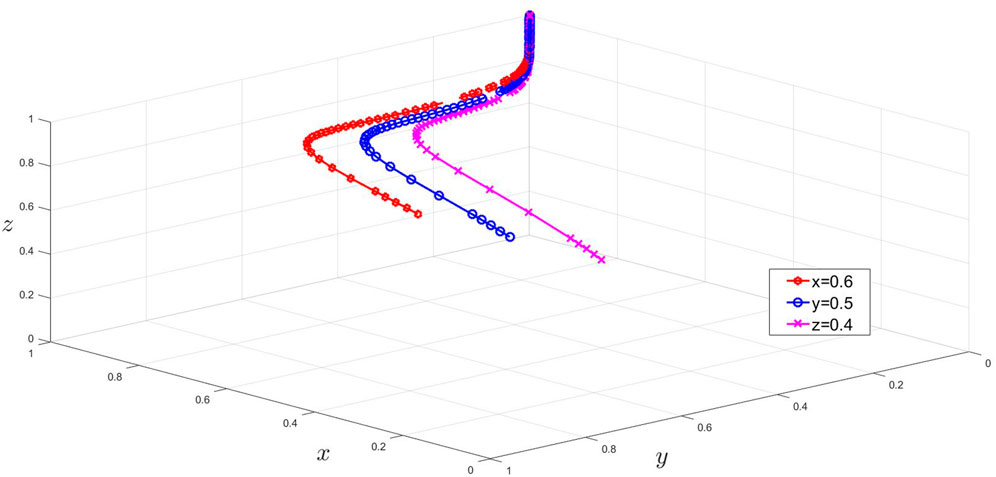
FIGURE 7. Evolutionary trajectory of the three-group game under condition Ⅴ(b).
Scenario 8: under IV conditions, when WB increases to 1,000 and TB increases to 2,000, assuming that α = 0.5, VI is satisfied, and E5 is an ESS. The government chooses strict supervision, enterprise A chooses to purchase carbon emission rights, and enterprise B chooses technological innovation. The stabilization strategy is (0, 1, 1) (as shown in Figure 8).
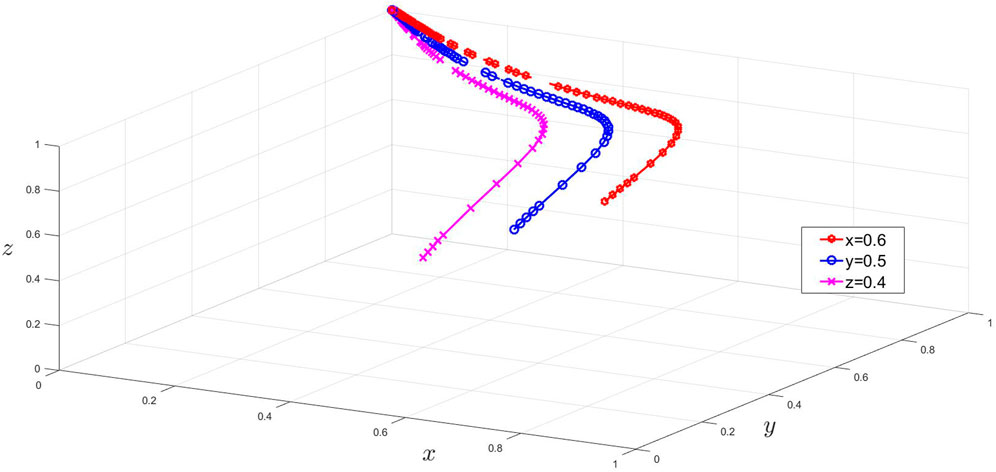
FIGURE 8. Evolutionary trajectory of the three-group game under condition Ⅵ.
In this study, innovation incentives include innovation subsidies and fines for instances of pseudo-innovation. Innovation incentives significantly impact stabilization strategies. From the simulation results, it can be seen that when the innovation incentive increases, enterprises tend to choose technological innovation strategies. When the innovation incentive of enterprise A is greater than its innovation investment, its stabilization strategy is to change from carbon purchases to technological innovation (Figures 1, 7). Similarly, when the innovation incentive of enterprise B exceeds its innovation incentives, it also selects a technological innovation strategy (Figures 1, 8). In comparison to large enterprise A, enterprise B has high innovation costs and low innovation benefits. If the government chooses to adopt a one-size-fits-all approach to carbon emissions, it is generally disadvantageous to small companies, which leads them to choose to purchase carbon emission rights in the carbon trading market rather than to carry out technological innovation strategies. However, this strategy is not conducive to low-carbon development and impacts the realization of the “dual carbon” goal.
The simulation results in Figures 1–3 show that with the increase in carbon prices, different types of enterprises gradually choose green technology innovation and that the government’s regulatory cost gradually decreases. When the carbon price is meager, different enterprises cannot obtain benefits or make up for innovation investment through green technology innovation, and thus no enterprises choose technological innovation. At this time, the government must increase its supervision to reduce emissions. When the carbon price rises, large enterprises can benefit from green technology innovation, and thus they increase R&D investment and promote green technology innovation to achieve the goal of emission reduction; at this time, due to the high cost of innovation, small enterprises choose to purchase carbon emission rights to achieve emission reduction requirements. When the carbon price continues to rise to the point where small enterprises can also benefit from green technology innovation or make up for the cost of innovation, all enterprises choose technological innovation to reduce emissions, and the government cannot adopt a loose supervision strategy. Thus, regulatory costs can be saved. In other words, the government can reduce regulatory costs and promote green technology innovation by regulating carbon prices, thereby reducing emissions. The simulation results in Figures 2, 6 also show that under the premise that all other conditions remain unchanged, the government’s regulatory strategy is affected by regulatory costs. If the government’s regulatory costs are too high, then it often chooses a loose regulation, while if its regulatory costs are low, then it chooses a strict regulation.
The simulation results in Figures 1, 4, 5 show that under the premise that all other conditions remain unchanged, the additional benefits brought about by green technology innovation to enterprises also impact enterprises’ strategic choices. If the additional value created by green technology innovation for the enterprise can cover its innovation investment, then it increases its investment in green technology research and development to obtain more economic benefits. At the same time, when any company cannot adopt a green technology innovation strategy, the government must choose strict supervision to supervise the completion of the company’s emission reduction task. Interestingly, the aforementioned analysis shows that the government still needs to play a regulatory role in promoting corporate green technology innovation by adding additional benefits. More importantly, how to best increase the additional benefits created by green technology innovation is also an essential part of the government regulation. The government needs to create an environment that respects innovation and provides a foundation for innovation so that corporate innovation can be recognized and respected by consumers. Consumers can obtain better value from corporate green innovation and thus can use additional benefits to promote the corporate innovation effect.
The simulation results of Figures 1, 7, 8 show that the innovation incentive mechanism has an important impact on the equilibrium strategy choice of enterprises. When the government’s innovation incentives to enterprises can make up for or exceed innovation investment, enterprises choose green technology innovation. However, due to the different innovation costs of enterprises, the government should formulate appropriate innovation incentive mechanisms to meet the needs of different types of enterprises. For example, due to the high cost of green technology innovation and insufficient infrastructure, the government needs to increase innovation compensation for small enterprises. In contrast, for large enterprises, their facilities are complete, and innovation has become a scale benefit, so their innovation cost is relatively small when the government’s subsidy is appropriately reduced. In short, the government’s incentives for the green technology innovation of enterprises should prevent any potential losses caused by a “one-size-fits-all” policy to the interests of particular enterprises. However, due to the profit-seeking nature of enterprises, some choose “short-term greenery” or innovation “standard” to obtain innovation subsidies, which is contrary to the original intention of the government in setting incentive policies. Therefore, the government needs to increase its supervision and punishment to prevent corporate speculation.
With the help of the carbon emission trading market, the government can comprehensively take measures such as regulating carbon prices, conducting innovation incentives, and imposing regulatory penalties to guide enterprises to innovate green technologies, promote green development, and achieve the “dual carbon” goal. In addition, the aforementioned simulation results, from both theoretical and practical perspectives, verify the Porter hypothesis; that is, designing appropriate environmental regulations can promote green technology innovation among enterprises.
Based on the dual orientation of the carbon emission trading market, this study considers the carbon emission trading behavior of different enterprise types, constructs a three-party evolutionary game model involving enterprise A, the government, and enterprise B, and simulates the data of the carbon emission trading market. Through the visual analysis of the evolution path of each participant, the game stability strategy of each participant in different scenarios is obtained, which provides viable suggestions for enterprise green technology innovation and government supervision. This research reached the following conclusions:
1) With carbon prices, the additional benefits of technological innovation and innovation incentives have a significant impact on corporate strategy choices. When the technological innovation benefits of an enterprise can compensate for its innovation costs, it is considered to have a preference for innovation. The simulation results demonstrate that when other conditions remain constant, a higher carbon price leads to greater additional benefits through innovation and that a higher innovation incentive results in more technological innovation to compensate for the innovation investment of the enterprise, resulting in the enterprise having a tendency to select an innovation strategy.
2) Enterprises with different innovation inputs and outputs choose different strategies under the same conditions. A large enterprise with low innovation costs can find it easier to compensate for its innovation costs through the carbon emission trading market and has a preference for technological innovation. Compared to enterprise A, small enterprise B has high innovation input and low output, with a tendency to purchase carbon emission rights in the carbon market.
3) The penalty cost of supervision and pseudo-innovation helps prevent pseudo-innovation behavior such as the “short-term greenery” of enterprises. However, the cost of the government regulation has an effect on its choice of a regulatory strategy. When the cost of supervision is too high, the government chooses lenient supervision, and when the cost of supervision is low, it chooses stricter supervision. The higher the penalty for pseudo-innovation is, the more companies have a tendency to adopt technological innovation, thereby avoiding the pseudo-innovation behavior. In addition, the simulation results of different scenarios show that the Porter hypothesis is valid both theoretically and reasonably.
Based on the research results, in combination with the development of the carbon emission trading market and the game strategies of the government and enterprises, this study proposes the following suggestions:
1) The government should increase the construction of innovation infrastructure and build a basic platform for enterprise green technology innovation. Moreover, the development of industrial clusters should be improved, the degree of industrial agglomeration should be enhanced, the construction of parks should be accelerated, infrastructure for enterprises to implement innovation should be provided, enterprise costs should be effectively reduced, and the development of green technology innovation should be promoted. For small enterprises, the cost of innovation is relatively high. Based on the innovation basic platform and industrial clusters provided by the government, the innovation cost can be greatly reduced, and the technology spillover effect of industrial clusters can be brought into play, thereby enhancing the innovation power of small enterprises.
2) The price mechanism of the carbon trading market should be improved. The carbon emission rights trading market encourages enterprises mainly to enhance the internal motivation of low-carbon emission reduction through the carbon price adjustment mechanism to achieve emission reduction. In the future, enterprises will be encouraged to choose green technology innovation. On the one hand, in the early stage of the development of the carbon emission rights trading market, the carbon trading price is relatively low. The government can introduce innovative incentive policies such as tax and fee reduction and innovation subsidies to promote the green technology innovation of enterprises and improve the low carbon emission technical emission reduction effect. On the other hand, when the carbon emission trading market is mature, the price of carbon emissions is relatively high, and the government can reduce innovation subsidies to reduce government expenses, which can also promote the green technology innovation of enterprises.
3) The government should fully consider the characteristics of different types of enterprises, implement differentiated innovation incentives, and prevent a “one-size-fits-all” policy from potentially affecting type-B enterprises. Small enterprises tend to invest more in innovation. If the government adopts a “one-size-fits-all” innovation subsidy policy, then it is usually more beneficial to large enterprises with lower innovation costs, which may cause such enterprises to choose technological innovation, while small enterprises may choose the strategy of carbon market purchase, which is not conducive to the low-carbon development of all enterprises. Therefore, the government needs to give more preferential innovation compensation to small enterprises with higher innovation costs.
4) The government should use supervision flexibly, combine dynamic supervision and dynamic punishment, and avoid the situation of the “pseudo-innovation” of enterprises. Profit-seeking companies often choose to speculate to increase their profits. Some enterprises choose superficial innovation or “standard” behaviors to obtain government incentives for green innovation. Pseudo-innovation behaviors such as “short-term greenery” are not conducive to the government’s promotion of low-carbon development. Therefore, the government should strengthen its supervision, increase its punishments, force enterprises to choose green technology innovation, and put an end to the behavior of enterprises “frauding subsidies.”
Although this study aims to analyze the equilibrium strategy choices of the government and enterprises with different innovation costs in the carbon emission trading market, there are still some limitations. First, this study considers only the types of firms with different innovation costs and does not include consumers in the model. In practice, consumers have a certain influence in regulating the “pseudo-innovation” of enterprises and reducing the costs associated with government supervision. Second, although the simulation data for this study are mainly from the carbon trading market, the selection of data, such as those on innovation subsidies and fines, is subject to a certain degree of subjectivity. Because the data on different provinces and cities are different, only representative areas can be selected for this research. Therefore, future work can further optimize these two issues and thus improve upon this study.
The original contributions presented in the study are included in the article/Supplementary Material; further inquiries can be directed to the corresponding author.
BC: conceptualization, data curation, formal analysis, project administration, software, writing–original draft, and writing–review and editing. ZS: data curation, formal analysis, methodology, supervision, validation, writing–original draft, and writing–review and editing. SY: funding acquisition, supervision, and writing–review and editing. TL: Writing–review and editing.
This work was supported by the Philosophy and Social Science Research Project of Hubei Provincial Department of Education (No.21Y241).
The authors declare that the research was conducted in the absence of any commercial or financial relationships that could be construed as a potential conflict of interest.
All claims expressed in this article are solely those of the authors and do not necessarily represent those of their affiliated organizations, or those of the publisher, the editors, and the reviewers. Any product that may be evaluated in this article, or claim that may be made by its manufacturer, is not guaranteed or endorsed by the publisher.
Bian, C., Chu, Z. P., and Sun, Z. L. (2021). A policy simulation analysis on the effects of environmental regulation on enterprise's green innovation in technology. J. Industrial Technol. Econ. 40 (7), 12–22. doi:10.3969/j.issn.1004-910X.2021.07.002
Braun, E., and Wield, D. (1994). Regulation as a means for the social control of technology. Technol. Analysis Strategic Manag. 6 (3), 259–272. doi:10.1080/09537329408524171
Cai, W. G., and Li, G. P. (2018). The drivers of eco-innovation and its impact on performance: Evidence from China. J. Clean. Prod. 176, 110–118. doi:10.1016/j.jclepro.2017.12.109
Cao, A. H., Han, B. T., and Qi, A. T. (2011). The dynamic analysis between government and enterprise in low-carbon economy. Ecol. Econ. 3, 74–78. https://wh.cnki.net/article/detail/STJJ201103014.
Chen, H., Wei, K. C., Liao, W. C., Lin, Y. Y., Feng, L. Y., et al. (2022). Prognostic value of an APOBEC3 deletion polymorphism for glioma patients in Taiwan. J. Neurosurg. 5, 1–13. doi:10.3171/2022.7.JNS2250
Chen, X. H., Wang, Y., and Li, X. H. (2021). Research on green technology transformation strategy of inter-regional enterprises under environmental regulation based on evolutionary game theory. Syst. Engineering-Theory Pract. 41 (7), 1732–1749. doi:10.12011/SETP2019-2040
Dong, Z. Q., and Wang, H. (2021). Urban wealth and green technology choice. Econ. Res. J. 56 (4), 143–159. https://kns.cnki.net/kcms/detail/detail.aspx?FileName=JJYJ202104010&DbName=CJFQ2021.
Fan, D., Fu, J. W., and Wang, W. G. (2022). How does carbon emission trading influence firm’s total factor productivity? Syst. Engineering-Theory Pract. 42 (3), 591–603. doi:10.12011/SETP2021-1298
Fang, G. C., He, Y., and Tian, L. X. (2021). Evolutionary game analysis of government and enterprises carbon-reduction under the driven of carbon trading. Chin. J. Manag. Sci. 12, 1–12. doi:10.16381/j.cnki.issn1003-207x.2021.1401
Friedman, D. (1991). Evolutionary games in economics. Econometrica 5 (7), 637–666. doi:10.2307/2938222
Hammoudeh, S., Lahiani, A., Nguyen, D. K., and Sousa, R. M. (2015). An empirical analysis of energy cost pass-through to CO2 emission prices. Energy Econ. 49, 149–156. doi:10.1016/j.eneco.2015.02.013
Jaffe, A. B., Newell, R. G., and Stavins, R. N. (2004). A tale of two market failures: Technology and environmental policy. Ecol. Econ. 54 (2), 164–174. doi:10.1016/j.ecolecon.2004.12.027
Jiang, H. D., Liu, L. J., Dong, K., and Fu, Y. W. (2022a). How will sectoral coverage in the carbon trading system affect the total oil consumption in China? A CGE-based analysis. Energy Econ. 110, 105996. doi:10.1016/j.eneco.2022.105996
Jiang, H. D., Purohit, P., Liang, Q. M., Dong, K., and Liu, L. J. (2022b). The cost-benefit comparisons of China's and India's NDCs based on carbon marginal abatement cost curves. Energy Econ. 109, 105946. doi:10.1016/j.eneco.2022.105946
Johnstone, N., Ha, I., Poirier, J., Hemar, M., and Michel, C. (2012). Environmental policy stringency and technological innovation: Evidence from survey data and patent counts: Evidence from survey data and patent counts. Appl. Econ. 44 (17), 2157–2170. doi:10.1080/00036846.2011.560110
Ley, M., Stucki, T., and Woerter, M. (2016). The impact of energy prices on green innovation. Energy J. 37 (1), 41–75. doi:10.5547/01956574.37.1.mley
Liang, Y. R., and Xu, J. Z. (2020). Research on incentive policy optimization of enterprise ecological innovation driving system. Chin. J. Manag. Sci. 5, 1–11. doi:10.16381/j.cnki.issn1003-207x.2021.2118
Lu, J., Yan, Y., and Wang, T. X. (2021). The microeconomic effects of green credit policy-from the perspective of technological innovation and resource reallocation. China Ind. Econ. 1, 174–192. doi:10.19581/j.cnki.ciejournal.2021.01.010
Porter, M. E., and Vander Linde, C. (1995). Green and competitive: Ending the stalemate. Harv. Bus. Rev. 73 (5), 120–134. https://hbr.org/1995/09/green-and-competitive-ending-the-stalemate.
Qi, S. Z., and Zhang, Z. Y. (2019). EU ETS, EUA allocation and renewable energy technological innovation. World Econ. Stud. 9, 12–21. doi:10.13516/j.cnki.wes.2019.09.009
Ren, S. G., Zheng, J. J., Liu, D. H., and Chen, X. H. (2019). Does emissions trading system improve firm’s total factor productivity-evidence from Chinese listed companies. China Ind. Econ. 5, 5–23. doi:10.19581/j.cnki.ciejournal.2019.05.001
Ren, X. H., Duan, K., Tao, L., Shi, Y., and Yan, C. (2022b). Carbon prices forecasting in quantiles. Energy Econ. 108, 105862. doi:10.1016/j.eneco.2022.105862
Ren, X. H., Li, Y., Qi, Y., and Duan, K. (2022c). Asymmetric effects of decomposed oil-price shocks on the EU carbon market dynamics. Energy 254, 124172. doi:10.1016/j.energy.2022.124172
Ren, X. H., Li, Y., Shahbaz, M., Dong, K., and Lu, Z. (2021). Climate risk and corporate environmental performance: Empirical evidence from China. Sustain. Prod. Consum. 30, 467–477. doi:10.1016/j.spc.2021.12.023
Ren, X. H., Li, Y., yan, C., Wen, F., and Lu, Z. (2022d). The interrelationship between the carbon market and the green bonds market: Evidence from wavelet quantile-on-quantile method. Technol. Forecast. Soc. Change 179, 121611. doi:10.1016/j.techfore.2022.121611
Ren, X. H., Zhang, X., Yan, C., and Gozgor, G. (2022a). Climate policy uncertainty and firm-level total factor productivity: Evidence from China. Energy Econ. 113, 106209. doi:10.1016/j.eneco.2022.106209
Shang, B., Du, X. Y., and Huang, T. Z. (2021). Market incentive-oriented environmental regulation and the pattern selection of enterprises' green technology innovation. Soft Sci. 35 (5), 78–84+92. doi:10.13956/j.ss.1001-8409.2021.05.12
Shao, L. M., Gao, Y. Q., and Wang, S. (2018). Environmental regulation and green behavior choice of resource-based enterprises: “Reverse transformation” or “regulation capture”. J. Hohai Univ. (Philosophy Soc. Sci. 20 (06), 62–68. doi:10.3876/j.issn.16714970.2018.06.010
Simon, H. A. (1990). Invariants of human behavior. Annu. Rev. Psychol. 41 (1), 1–20. doi:10.1146/annurev.ps.41.020190.000245
Tang, X., and Hu, A. G. (2018). Achieve innovative and ecological modernization: Tunneling through the environmental kuznets curve. China Popul. Resour. Environ. 28 (5), 1–7. doi:10.12062/cpre.20180204
Tao, F., Zhao, J. Y., and Zhou, H. (2021). Does environmental regulation improve the quantity and quality of green innovation-evidence from the target responsibility system of environmental protection. China Ind. Econ. 2, 136–154. doi:10.19581/j.cnki.ciejournal.2021.02.016
Wan, L. L., and Lu, Y. (2015). Can the regulation of environmental pollution emission cap reduce enterprises pollution emissions effectively? An analysis on dynamic model of game between government and enterprises. East China Econ. Manag. 29 (9), 85–89. doi:10.3969/j.issn.1007-5097.2015.09.014
Wang, B., Wu, Y. R., Zhang, W., and Zhang, J. Q. (2022). Green technology innovation path and policy paradigm transformation under the back ground of “dual carbon” goals. Sci. Manag. Res. 40 (2), 2–6. doi:10.19445/j.cnki.15-1103/g3.2022.02.001
Wang, C. M., and Li, J. (2019). An evaluation of regional green innovation performance in China and its spatial-temporal differences based on the panel data of inter-provincial industrial enterprises from 2005 to 2015. Sci. Res. Manag. 40 (6), 29–42. doi:10.19571/j.cnki.1000-2995.2019.06.004
Wang, H. Q., and Zhang, Y. (2020). Trade structure upgrading, environmental regulation and green technology innovation in different regions of China. China Soft Sci. 2, 174–181. doi:10.3969/j.issn.1002-9753.2020.02.016
Wang, M. Y., and Li, Y. M. (2021a). Equilibrium and stability of green technology innovation system with multi-agent participation. Chin. J. Manag. Sci. 29 (3), 59–70. doi:10.16381/j.cnki.issn1003-207x.2019.0203
Wang, M. Y., and Li, Y. M. (2021b). Market regulation, product consumption choice and enterprise green technological innovation. J. Industrial Eng. Eng. Manag. 35 (0), 44–54. doi:10.13587/j.cnki.jieem.2021.02.005
Wang, P., and Liu, S. Q. (2022). Evolutionary game study of green technology innovation under market oriented mechanism considering the additional utility of consumers to green products. Econ. Problems 1, 67–77. doi:10.16011/j.cnki.jjwt.2022.01.009
Wei, L. L., and Ren, L. Y. (2021). Can carbon emissions trading promote enterprise green technological innovation-based on the perspective of carbon price. Lanzhou Acad. J. 7, 91–110. doi:10.3969/j.issn.1005-3492.2021.07.006
Wu, X. P., Gao, M., Guo, S. H., and Rashid, M. (2019). Environmental and economic effects of sulfur dioxide emissions trading pilot scheme in China: A quasi-experiment. Energy & Environ. 30 (7), 1255–1274. doi:10.1177/0958305x19843104
Xu, J., and Cui, J. B. (2020). Low carbon cities and firms’ green technological innovation. China Ind. Econ. 12, 178–196. doi:10.19581/j.cnki.ciejournal.2020.12.008
Xu, L., Ma, Y. G., and Wang, X. F. (2022). Study on environmental policy selection for green technology innovation based on evolutionary game: Government behavior vs. Public participation. Chin. J. Manag. Sci. 30 (3), 30–42. doi:10.16381/j.cnki.issn1003-207x.2020.1786
Yang, C. J., Liu, B., and Bi, K. X. (2020). The impact of FDI spillover on the evolution of green innovation path in industrial enterprises-based on evolutionary game model. Manag. Rev. 32 (12), 146–155. doi:10.14120/j.cnki.cn11-5057/f.20191127.003
Yu, Y. Z., Sun, P. B., and Xuan, Y. (2020). Do constraints on local governments' environmental targets affect industrial transformation and upgrading? Econ. Res. J. 55 (8), 57–72. https://kns.cnki.net/kcms/detail/detail.aspx?dbcode=CJFD&dbname=CJFDLAST2020&filename=JJYJ202008005&uniplatform=NZKPT&v=x7X5dmdiedO9Htlk-9V44-QAMUf4Zylk6sJtfw9iHgTI0vuykEjZz4L3R88TDyWm
Zhang, C. Y. (2020). Does market mechanism can achieve “double dividend”? A natural experiment based on emission trading system. China Soft Sci. 2, 94–107. doi:10.3969/j.issn.1002-9753.2020.02.009
Zhang, Z. Q., Zhang, T., and Feng, D. F. (2022). Study on regional differences, dynamic evolution and convergence of carbon emission intensity in China. J. Quantitative Tech. Econ. 39 (4), 67–87. doi:10.13653/j.cnki.jqte.2022.04.001
Zhao, L., Wen, F., and Wang, X. (2020). Interaction among China carbon emission trading markets: Nonlinear granger causality and time-varying effect. Energy Econ. 3, 104901–105104. doi:10.1016/j.eneco.2020.104901
Zhu, J., Xu, Z. Y., and Liu, W. Z. (2022). China’s regional green technological innovation and realization path based on asymmetric innovation theory. China Popul. Resour. Environ. 32 (2), 128–139. http://www.jqte.net/sljjjsjjyj/ch/reader/view_abstract.aspx?flag=1&file_no=20220404&journal_id=sljjjsjjyj.
Keywords: the trading market of carbon emission rights, green technology innovation, evolutionary game, data simulation, stabilization strategy
Citation: Cui B, Shui Z, Yang S and Lei T (2022) Evolutionary game analysis of green technology innovation under the carbon emission trading mechanism. Front. Environ. Sci. 10:997724. doi: 10.3389/fenvs.2022.997724
Received: 19 July 2022; Accepted: 26 September 2022;
Published: 17 October 2022.
Edited by:
Zeeshan Fareed, Huzhou University, ChinaReviewed by:
Xiaohang Ren, Central South University, ChinaCopyright © 2022 Cui, Shui Yang and Lei. This is an open-access article distributed under the terms of the Creative Commons Attribution License (CC BY). The use, distribution or reproduction in other forums is permitted, provided the original author(s) and the copyright owner(s) are credited and that the original publication in this journal is cited, in accordance with accepted academic practice. No use, distribution or reproduction is permitted which does not comply with these terms.
*Correspondence: Sen Yang, MjE0OTA0ODE0QHFxLmNvbQ==; Tianyi Lei, dHlyYXkxOTkyQDE2My5jb20=
†These authors have contributed equally to this work and share first authorship
Disclaimer: All claims expressed in this article are solely those of the authors and do not necessarily represent those of their affiliated organizations, or those of the publisher, the editors and the reviewers. Any product that may be evaluated in this article or claim that may be made by its manufacturer is not guaranteed or endorsed by the publisher.
Research integrity at Frontiers
Learn more about the work of our research integrity team to safeguard the quality of each article we publish.