- 1Institute of Forest Resource Information Techniques, Chinese Academy of Forestry, Beijing, China
- 2Key Laboratory of Forestry Remote Sensing and Information System, NFGA, Beijing, China
As a typical form of land degradation, karst rocky desertification seriously restricts the development of the regional social economy and seriously threatens the living environment of residents. Fractional vegetation cover (fVC) and bare rock fraction (fBR) are important indicators to identify and evaluate rocky desertification. However, it is a great challenge to obtain fVC and fBR due to the complex terrain and fragmentation of karst rocky desertification areas. In this study, comparisons between Sentinel-2A Multispectral Instrument (Sentinel-2), Landsat-8 Operational Land Imager (Landsat-8), and GF-6 Wide Field View (GF-6) sensors for retrieving fVC and fBR are presented. The multiple endmember spectral mixture analysis (MESMA) and measured spectral dates were used to overcome the limitations of Spectral mixture analysis (SMA). Subsequently, fVC and fBR were validated using root mean square error (RMSE), mean absolute error (MAE), and coefficient of determination (R2). The results showed that: 1) Sentinel-2 performed best in estimating fVC and obtained the highest accuracy (R2 = 0.6259, root mean square error = 0.1568, mean absolute error = 0.1215), followed by GF-6 and Landsat 8; in the extraction of the fBR, the performance was relatively the same, and the implementation of Sentinel-2 was also the best (R2 = 0.4911, root mean square error = 0.0714, mean absolute error = 0.0539), followed by GF-6 and Landsat 8. 2) Sentinel-2 images have higher resolution, the narrowest band range, and the most significant number of bands, which can better extract information about fVC and fBR in rocky desertification areas. 3) For the three optical sensors, the spatial resolution of the images is more important to extract the information of fVC and fBR in the rocky desertification areas. 4) In general, the extraction accuracy of fBR is not as good as that of fVC. The complicated ecological and geological environment of decertified areas has more influence on the effect of extraction of the fBR. 5) The Sentinel-2 achieves high accuracy for both fVC and fBR under different-level application scenarios. It thus has great potential for application in rocky desertification information extraction.
1 Introduction
Rocky desertification is one of China’s three major land degradation issues (Yue et al., 2011a). It is also the primary ecological problem in karst areas, restricting regional social and economic development and seriously threatening the living conditions of residents (Wang and Li, 2007). The poverty-stricken population is concentrated in China’s karst rocky desertification areas, and the contradiction between man and land is very prominent. Long-term unreasonable land use in resource development and economic development has resulted in intense soil erosion, vegetation degradation, and large areas of exposed bedrock (Wang et al., 2004). Studies have shown that fVC and fBR are highly correlated with rocky desertification (Li and Wu, 2015). FVC and fBR are not only important indicators of karst rocky desertification but also essential elements for investigating, researching, and assessing karst rocky desertification. (Yue et al., 2013).
The remote sensing technology has substantial capability to estimate fVC and fBR accurately. Rocky desertification areas, however, often experience a high degree of landscape heterogeneity, surface fragmentation, staggered ground object distribution, and highly severe mixed-pixel effects in remote sensing images, making this work challenging (Yue et al., 2011a). Xiong et al. (2013) used the vegetation index (NDVI), the complete spectral index of rocky desertification (KRDSI) and the lignin-cellulose absorption index (LCA). The results show that Hyperion hyperspectral images can retrieve vegetation information more efficiently. However, the accuracy of fBR information extraction is low since the different spectral characteristics and erosion degrees of different carbonate rocks. Xia et al. (2006) proposed the concept of a “vegetation line” based on the vector space analysis of the multidimensional spectrum. This study normalized the distances of the rocky desertification image elements to “vegetation lines” in the multidimensional vector space with different degrees of desertification and achieved objective and stable results on the degree of rocky desertification. Based on the spectral absorption characteristics, the Karst Rocky Desertification Synthesis Index (KRDSI) was developed by Yue et al. (2011b), which can directly extract the remote sensing evaluation factors of rocky desertification. However, the accuracy of extracting fBR is low. Pei et al. (2018) first proposed a new karst bare-rock index (KBRI), which can effectively distinguish exposed bedrock from other typical strata. Nevertheless, the rocky desertification evaluation index includes a variety of characteristics. It is challenging to analyze rocky desertification effectively through vegetation or rock information alone. In studying karst rocky desertification information extraction, we must consider fVC and fBR. However, the same object with different spectrums and different objects with the same spectrum make this work challenging.
From a mechanistic point of view, the essence of rocky desertification information extraction is mixed pixel decomposition (Xia et al., 2006). The SMA method assumes that the endmembers are spatially and temporally invariant, so it cannot explain natural materials’ typical temporal and spatial-spectral variability. (Roberts et al., 1992; Somers et al., 2011). The MESAM method takes complete account of the variability of endmembers, allows the number and type of endmembers to vary on a per-pixel basis, and selects different combinations of endmembers to extend SMA (Roberts et al., 1998). The MESAM method overcomes the SMA limit for all pixels modelled by the same endmember. Quintano et al. (2017) accurately mapped burn severity in Mediterranean countries using the MESMA method. Based on the MESMA method, Mudereri et al. (2021) used Sentinel-2 data to estimate and map weed abundance in African ecosystems in a wide-area landscape with high accuracy.
With the development of space remote sensing technology, the spatial, spectral and temporal resolution of remote sensing satellites has been increased, and multi-source remote sensing data has been continuously enriched, providing a reliable data source for monitoring and evaluating karst rocky desertification. Therefore, we selected three major in-orbit multispectral satellites with varying spatial and spectral resolutions, Sentinel-2, GF-6, and Landsat 8. We thoroughly compared each performance with fVC and fBR estimation using MESMA. This study aims to bring new insights for comparing fVC and fBR retrieval of Sentinel-2, GF-6, and Landsat 8 in karst rocky desertification areas. Furthermore, the study provides technical support and scientific data reference for monitoring, evaluating and managing rocky desertification in southwest China.
2 Materials and methods
2.1 Study area
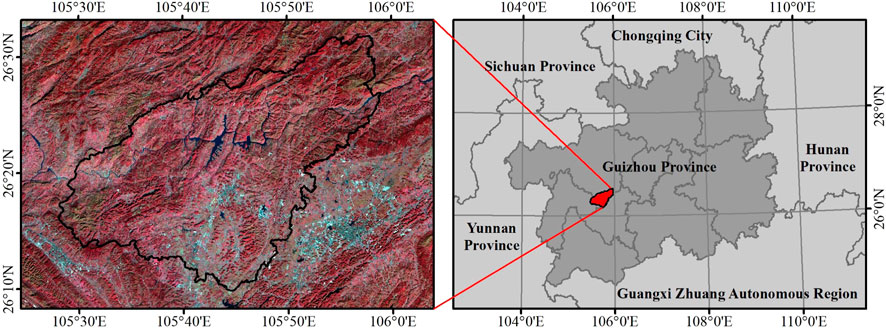
The study area is in Puding County, Anshun City, Guizhou Province, located in the west-central part of Guizhou Province (Figure 1), between longitude 105°27′49″-105°58′51″ east and latitude 16°26′36″-26°31′42″ north (Liu et al., 2011). It is located in the hinterland of central Guizhou. The altitude is between 1,042 and 1,846 m. The terrain is high in the south and north and low in the middle, tilting from the south and north to the Sancha River Valley. The topography of Puding County is mainly hilly and mountainous, showing a staggered distribution of platform, mountain, and basin Bazi. Karst landforms dominate the county, and developing karst landforms is typical. The karst area accounts for 84.27% of the county’s total area, with complete evolution types, noticeable regional differences, and serious rocky desertification. Puding County is under a pleasant climate, a subtropical plateau monsoon, a humid climate, and a mild climate throughout the year. The average temperature is 15.1°C; the average annual precipitation is 1,378.2°mm; the annual average sunshine time is 1,164.9 h; and the frost-free period is 301°days (Chen et al., 2005). The soil is mainly limestone soil developed from limestone. Due to developing karst, river water leakage in a limestone area is severe. Because of the wide distribution and development of karst landforms in the study area (Qin et al., 2014), the fragile ecosystem, and the typical rocky desertification area in the Yunnan-Guizhou Plateau, it was chosen as the experimental area of this study (Figure 2).
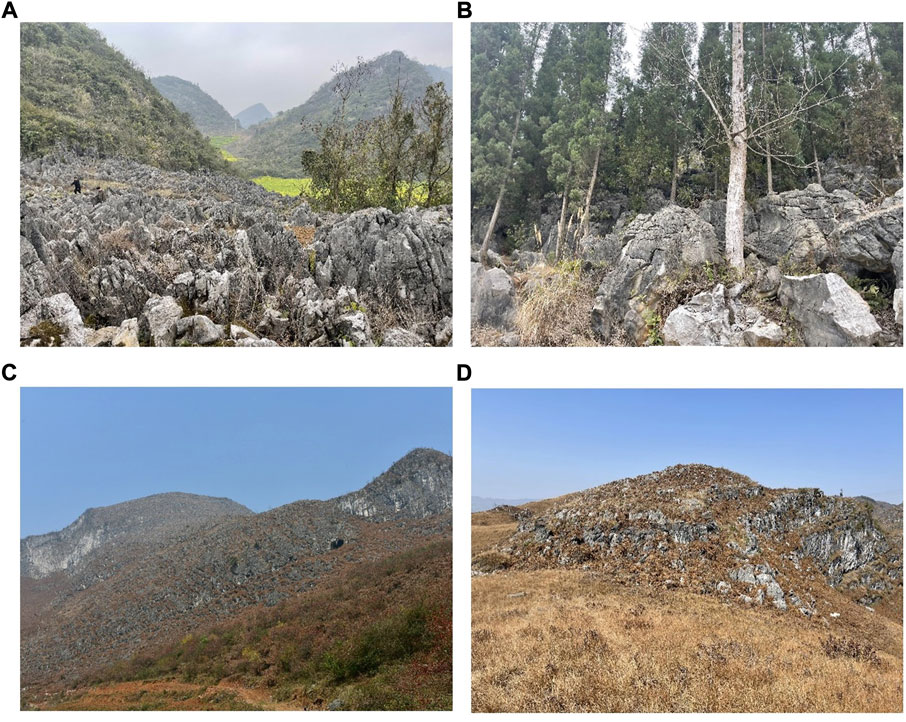
FIGURE 2. Photos of Karst Rocky Desertification Landscape in Puding County. (A) Farmland rocky desertification landscape. (B) Rocky desertification landscape under the forest (C) Rocky desertification landscape on the hillside (D) Rocky desertification landscape on top of a mountain.
2.2 Satellite data and preprocess
2.2.1 Sentinel-2
The Sentinel-2 optical data contains three red edge bands sensitive to vegetation identification. Images of Sentinel-2, a Level-1C product used in the study, have been downloaded from the Sentinels Science Data Center (https://scihub.copernicus.eu/). The Sen2Cor tool was used for atmospheric correction and topographic correction. Our study used only 10 m and 20 m bands (https://gisgeography.com/sentinel-2-bands-combinations/).
2.2.2 GF-6
The GF-6 satellite is China’s first multispectral remote sensing satellite with a red-edge band equipped with a high-resolution camera and a wide-range camera. The GF-6 data (http://sasclouds.com/chinese/satellite/chinese/gf6) and its calibration coefficients can be provided and queried from the website of the China Center for Resources Satellite Data and Application (http://www.cresda.com/). The GF-6 data needed radiometric correction, atmospheric correction, and orthophoto correction, and the GF-6 data were topographically normalized using the C-correct methods (Teillet et al., 1982) with the help of the GDEM V2 DEM provided by the United States Geological Survey (USGS) (https://earthexplorer.usgs.gov/).
2.2.3 Landsat 8
Landsat 8 data (https://www.usgs.gov/landsat-missions/landsat-8) was provided by the USGS. Landsat 8 data are LandsatCollection2 products and require only conversion of scale factors.
The GF-6 and Landsat 8 data were co-registered with the Sentinel-2 data with a registration error of fewer than 0.5 pixels. Finally, the vector files of the study area were used to mask the three remote sensing image data.
2.3 Field survey data
2.3.1 Validation data
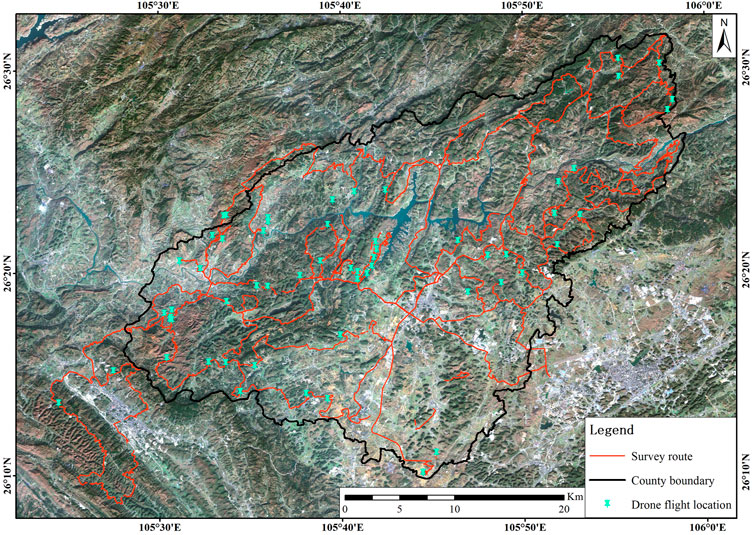
According to the vegetation phenological characteristics of the study area, the research team carried out a field investigation and obtained more detailed fVC, fBR, and measured data such as the spectrum of typical ground objects in Puding County, Anshun City, Guizhou Province from February 28 to 15 March 2022. Based on road accessibility and rocky desertification typicality, we photographed 61 typical areas with drones. The survey route and unmanned aerial vehicle (UAV) flight area distribution are shown in Figure 3.
After the drone data was processed by DJJ Terra software, the validation information of fVC and fBR was obtained through random forest classification. Taking the center point of the remote sensing image pixel as the benchmark, the UAV classification result within 1.5 times the image resolution is used as the verification data for the corresponding pixel to reduce the error of data registration (Sentinel-2 corresponds to coverage within 30m, GF-6 corresponds to coverage within 24m, and Landsat 8 corresponds to coverage within 45 m). Finally, we obtained 285 samples as validation data for estimating fVC and fBR.
2.3.2 Measured spectral data
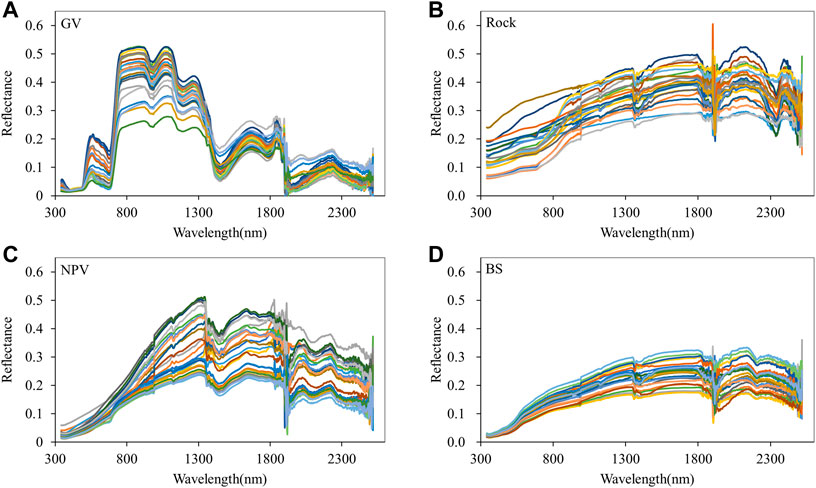
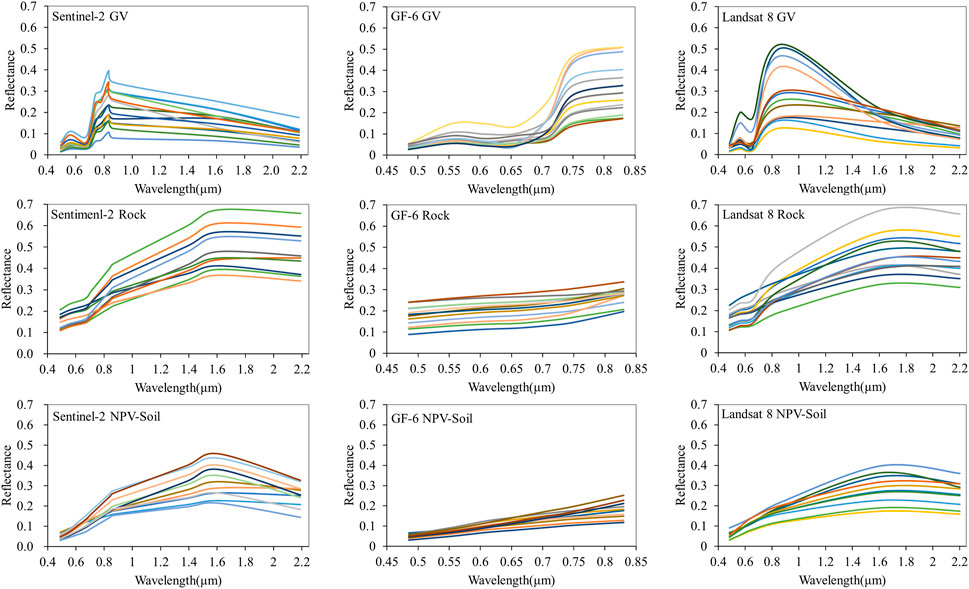
All spectrums were made under cloud-free conditions. Given the abundance of highly variable green vegetation (GV), bare rock (BR), bare soil (BS) and nonphotosynthetic vegetation (NPV) in Puding County, their spectral properties were thoroughly investigated to acquire the most generalizable endmember dataset. Spectra were collected with an SVC HR-1024i full-range (350–2500 nm) spectroradiometer. All measurements were collected within 2 hours of local solar noon on clear sky days. The sensor was held 1 m above the top of the target object surface in a vertically downward position. The spectroradiometer was calibrated to a white reference target ahead of each measurement. The field-measured spectral library is shown in Figure 4.
Based on the spectral response function of the satellite sensor, the field spectra were resampled to the satellite image bands (Eq. 1), where Ri is the simulated reflectance, fi (λ) is the spectral response function at λ wavelength band ith, r(λ) is the field observed reflectance at λ wavelength, and λmin and λmax represents the bandwidth of the band ith.
The spectral data collected in the field needs to be resampled from three data sources so that the center wavelength and the number of bands corresponding to the endmember database data are consistent with the center wavelength and the number of bands of the image to be unmixed.
2.4 Methods
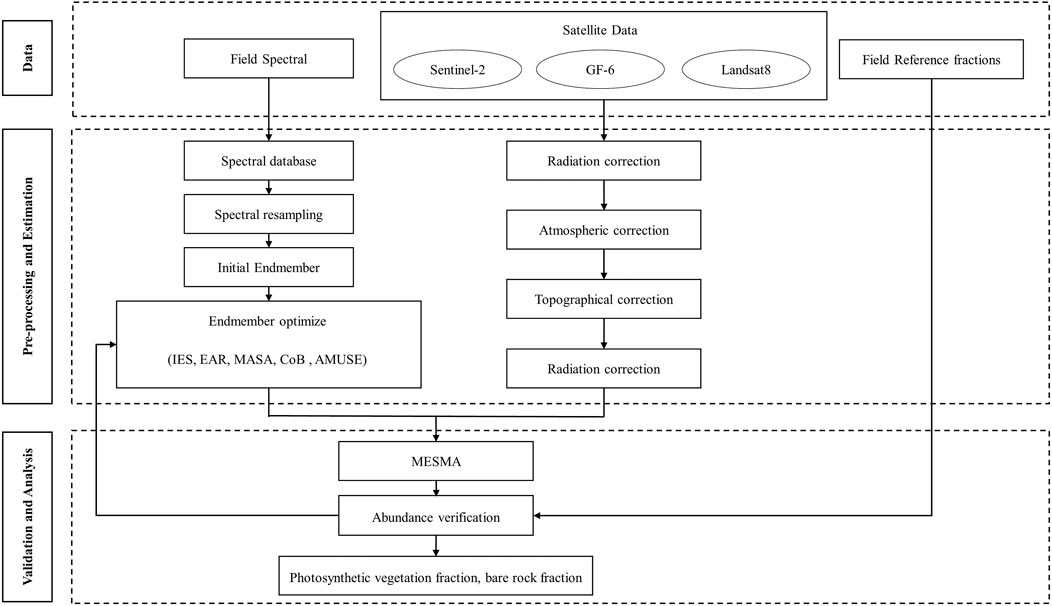
Three commonly used multi-spectral sensors were compared to retrieve the fVC and fBR in karst rocky desertification regions by employing the MESMA model, with an emphasis on the implications of additional spectral bands, various spatial resolutions, and appropriate endmember identification. Field spectra data for GV, BR, BS and NPV were collected to provide endmember spectra. The UAV classification images were used to collect field-measured data for fVC and fBR, which were then used as a validation dataset for assessing the performance of different models. The flowchart of this study is shown in Figure 5.
2.4.1 Selection of optimal endmembers
IES (Iterative Endmember Selection) (Schaaf et al., 2011; Roth et al., 2012) was used to identify the subset of spectral libraries that provided the best class separation based on the RMSE-based kappa coefficient by removing redundant spectra, reducing the size of a given spectral library. The method iteratively adds and removes endmembers from the subset until the kappa coefficient no longer improves.
EAR (Endmember Average RMSE) allows each spectrum in a class to model all other spectra using a linear SMA and then selects the spectrum with the smallest root mean square error as the endmember. EARs are more sensitive to spectral differences (Dennison and Roberts, 2003). The formula for calculating EAR is:
where a represents a type of endmember, n represents the number of endmembers in this type of endmember set, ai is a spectral curve in this type of endmember, and the spectrum is represented by the smallest EAR that can best represent this type of endmember.
MASA (Minimum Average Spectral Angle) (Dennison et al., 2004) is similar to the EAR in that it aims to select the spectrum with the best average fit in the class. The best MASA candidates yield the lowest average spectral angle. MASA is more sensitive to spectral differences in dark objects. The spectral angular distance formula is
where ai, aj represent two spectral vectors,
MASAi is the average value of the spectral angle of the spectrum i in a certain category to simulate other spectra of its category. The spectrum with the smallest MASA was selected as the candidate endmember spectrum for this class.
CoB (Count-based endmember selection) was first proposed by Roberts et al. (2003). The number of spectra that have been modelled overall for the class is stored in the metric in_CoB. And the highest in_CoB value is chosen as the best model. The total number of spectra modelled outside the class is reserved in the metric out_CoB., and high values indicate severe confusion between classes (Clark, 2005). CoBI is the ratio of in_CoB to out_CoB, with the denominator multiplied by the number of spectra within the class. Therefore, high CoBI and high in_CoB represent a wise choice. A high CoBI and moderately low in_CoB might also be a good candidate since it captures the uniqueness of class member, even if it is underrepresented in the library. Low values of CoBI are acceptable only when paired with high in_CoB.
AMUSES (Automated Multiple Signal Classification and Spectral Separability Based Endmember Selection Technique) adopted a spectral separability measure to control better the entire process (Degerickx et al., 2017). The method first applies brightness normalization to the original spectral library and images to reduce the effect of brightness during endmember selection (Wu, 2004). The distance from each library spectrum to the image is computed using MUSIC (Iordache et al., 2013).
Finally, visual inspection of spectral shape and overlap between classes across the entire spectrum allowed for the evaluation of class separability. We calculated the union of the endmembers selected by the IES, EAR, CoB, MASA, and AMUSE methods, to enhance the diversity and representativeness of the endmember library.
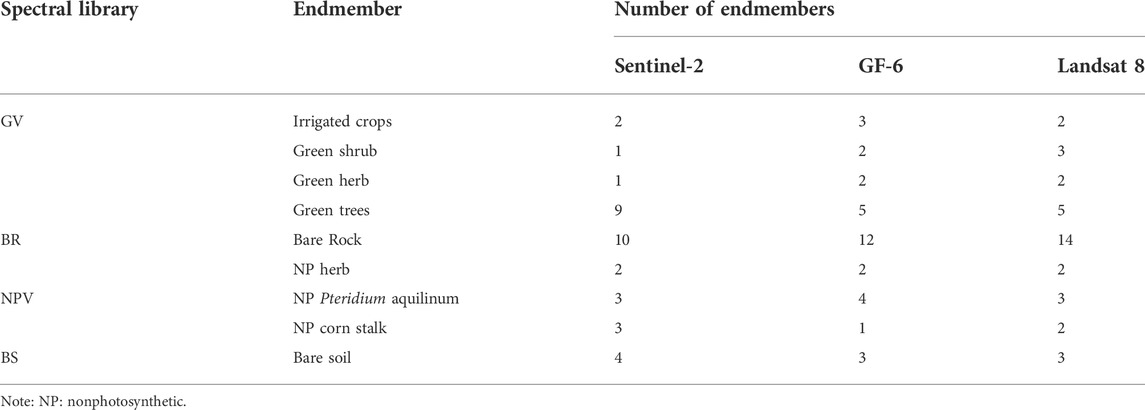
In this study, four endmember libraries were used: GV, BR, NPV and BS, in combination to obtain relatively accurate estimates of fVC and fBR. As shown in Table 1, herbs, shrubs, trees, and farmland crops are all represented in the vegetation endmember library. The BR endmember library is derived from field-measured BR from multiple sites. The NPV endmember library includes members of the following types: nonphotosynthetic herbaceous plants, Pteridium Aquilinum from field measurements, and nonphotosynthetic corn stover from agricultural fields. The BS endmember spectral is derived from field-measured BS from multiple sites.
2.4.2 Unmixing
The MESMA is an extension of linear spectral unmixing that requires a more extensive spectral library than SMA to better handle the effects of endmembers variability in the abundance estimation step (Roberts et al., 1998). MESMA overcomes the limitations of SMA by requiring models to satisfy minimum fit, score, and residual constraints while simultaneously testing multiple models for each image pixel. The MESMA procedure can be summarized as follows: 1) The traditional SMA was used to estimate the fVC and fBR for each of the three remote sensing data based on the endmember library obtained by the above methods; 2) for each pixel in the remote sensing image, try all types of endmember combinations; 3) the model with the best fit, i.e., the model with the lowest RMSE in reconstructing the original pixels (Roberts et al., 1998).
Similar to Roberts and Quattrochi (2012) and Powell and Roberts, 2008, we used the following selection criteria: minimum and maximum permissible scores −0.05 and 1.05, respectively; maximum permissible shade score of 0.8; and maximum allowable RMSE score of 0.025. When multiple models meet the criteria, the model with the lowest RMSE is chosen. Therefore, we used MESMA (Crabbé et al., 2020) to decompose Sentinel-2, GF-6, and Landsat8 images into four endmembers: GV, BR and NPV-BS and shade.
2.4.3 Accuracy evaluation
To quantitatively evaluate the accuracy of model decomposition, several metrics are introduced in this paper, including root mean square error (RMSE), mean absolute error (MAE), and coefficient of determination (R2). These evaluation metrics are widely used in model evaluation research, and their mathematical expressions are as follows:
where n is the total number of samples;
3 Results
3.1 Endmember library characteristics
Spectral libraries were established using field-measured spectra. Specifically, we measured the following spectra in the field: GV, BR, BS and NPV. All spectra were resampled into the bands of Sentinel-2, GF-6 and Landsat 8, respectively, before use. We found it difficult to distinguish between BS and NPV spectral after resampling into the Sentinel-2, GF-6 and Landsat 8 bands. Therefore, following Li et al. (2016) and Okin et al. (2013), we combined NPV and BS endmember into a spectral library to reduce the errors in the spectral fitting. In this study, NPV and BS were combined into NPV-BS.
As shown in Figure 6, in the visible and near-infrared spectrum, a “peak and valley” in the green and near-infrared bands and a “valley” in the red band can be observed for Sentinel-2 and Landsat 8, which have typical spectral features of healthy vegetation. Compared to Sentinel-2, GF-6 and Landsat 8, has lower peaks and troughs in green and red bands due to its broadband range, which limits its ability to capture the spectral characteristics of terrestrial objects to some degree. Sentinel-2 exhibits a distinct and delicate variation characteristic in the visible near-red band. This capability improves Sentinel-2’s ability to detect vegetation and offers excellent potential for vegetation-type refinement. In the vegetation spectral profiles of Sentinel-2, GF-6 and Landsat 8, although exhibiting some degree of difference in vegetation spectral characteristics, the red-edge image phenomenon is apparent and differs significantly from the spectral profiles of BR and NPV-BS. Therefore, the GV can be distinguished from the BR and NPV-BS. In the wavelength range of the three sensors, the reflectance of BR is usually higher in all wavelength bands and shows an increasing trend in the band range of both Sentinel-2 and Landsat 8. There is a weak trough in the red band of Sentinel-2 and Landsat 8 and a decreasing trend after reaching an extreme value near 1.6 μm. However, GF-6 is no longer available after the NIR band, and BR in the GF-6 band range exhibit a monotonic increasing trend but with a low slope. At the same time, the sensor could not capture the acceptable variation characteristics of BR in the visible and near-infrared wavelength bands due to the broad wavelength range of GF-6. The reflectance of NPV may be higher or lower than that of BS due to the influence of NPV type, humidity, and degree of decomposition (Ji et al., 2020). Therefore, it is sometimes difficult to distinguish between NPV and BS. In Figure 6, the NPV-BS-spectrogram shows the conclusion above. The endmember spectra in the wavelength range of the three sensors can effectively distinguish among VC, BR, and NPV-BS depending on the characteristics of different endmember types. In any case, selecting the best endmember combination is crucial for spectral separation (Li et al., 2016). Figure 6 depicts the characteristics and spatial variations of the endmember spectra from Sentinel-2, GF-6, and Landsat 8. In terms of the internal variability of endmembers, the spectra of GV, BR and NPV-BS have a certain degree of variability, which is consistent with the high landscape heterogeneity in rocky desertification areas.
3.2 Fraction estimation
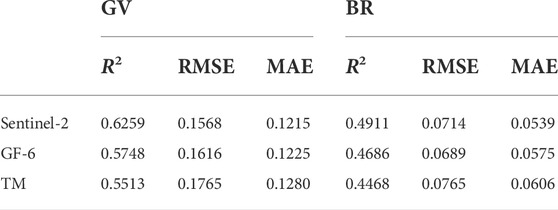
Figure 7 shows the final fVC and fBR images obtained in the study area. To the naked eye, the spatial distribution of fVC and fBR in Puding County are well congruent with the early 2022 field observations. To assess the fVC and fBR, R2, RMSE, and MAE were calculated. Table 2 shows the validation accuracy results.
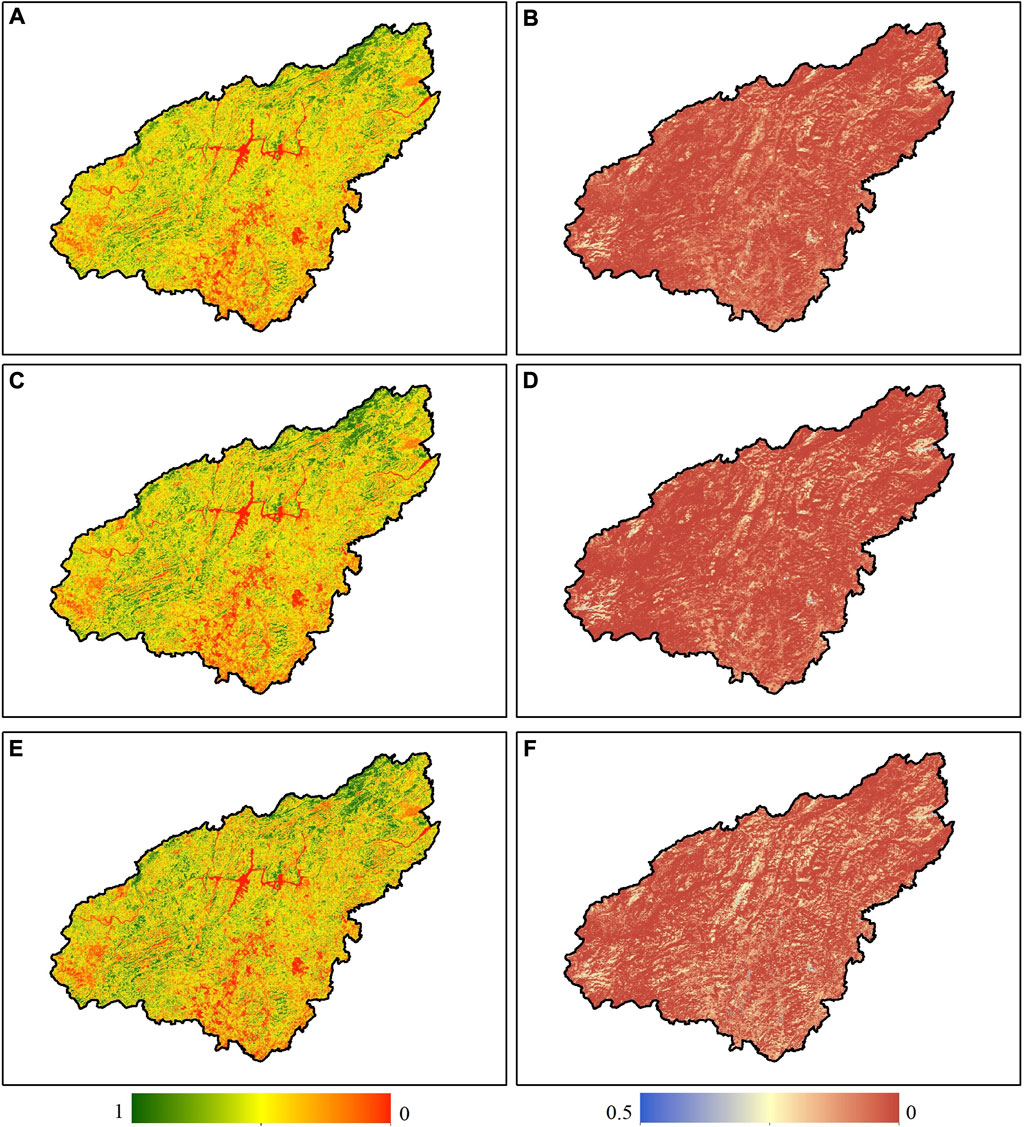
FIGURE 7. fVC and fBR estimation based on Sentinel-2, GF-6, and Landsat 8. (A) fVC of Sentinel-2; (B) fBR of Sentinel-2 and, (C) fVC of GF-6, (D) fBR of Sentinel-2; (E) fVC of Landsat eight and, (F) fBR of Landsat 8.
For the estimation of fVC, Sentinel-2 has the highest R2 value of 0.6259, the lowest RMSE of 0.1568, and MAE of 0.1215, according to the evaluation metrics. Although we avoided the unmixing error by resampling the 10 m band to 20 m from the 10 m and 20 m band data of Sentinel-2, we still discovered that Sentinel-2 fVC images include more delicate texture information. Sentinel-2 has three red-edge bands. As shown in Figure 6, these three red-edge bands are situated close to the junction of the NIR band and red light at the beginning, peak and end of the rapidly changing region of the vegetation spectrum. Moreover, the band range of Sentinel-2 is the narrowest and more targeted. Therefore, Sentinel-2 has the highest fVC extraction accuracy, followed by GF-6 coming in second. GF-6 has two red edge bands and one yellow border band, with the two red border bands being close to the positions of RE-1 and RE-2 of Sentinel-2 and having the highest resolution (16 m); however, because of its broadband range, GF-6 has a slightly lower estimation accuracy for fVC than Sentinel-2. Landsat 8 has no red-edge bands and relatively low resolution, which significantly reduces the estimation accuracy of fVC.
In a comprehensive comparison, Sentinel-2 has the highest estimation accuracy of vegetation cover; Landsat 8 has a lower estimation accuracy. Moreover, it is evident from the analysis that the resolution of satellite images plays a more critical role in estimating vegetation cover in karst rocky desertification areas.
In the field survey, fBR was at most about 30% where we could reach and probably higher where we could not reach. The fBR estimates for the study area based on Sentinel-2, GF-6, and Landsat 8 data are all within 0.5.
For fBR estimation, Sentinel-2 has the highest R2 value and the lowest MAE value regarding evaluation metrics. Although the RMSE value of Sentinel-2 is slightly higher than that of GF-6, considering the evaluation metrics and the validation scatter plot, Sentinel-2 has the highest extraction accuracy. Figure 6 shows that the reflectance of BR increases with an increasing wavelength outside the NIR band, while the reflectance of vegetation decreases. The shortwave infrared (SWIR) band is preferable for identifying BR and minerals. Though the GF-6 lacks these bands and information, it still has superior accuracy to Landsat 8. So, we understood that the deciding factors are not featured bands sensitive to BR. The desired feature information can be extracted if the feature information has a sufficient degree of difference in the image bands. For example, the BR endmember library of GF-6 has no unique trend variation in its band range. However, enough discriminative difference with the GV and NPV-BS endmember libraries allows for relative accuracy of fBR extraction by GF-6.
The distribution of estimated and measured values in Figure 8 shows that the dispersion of estimated and measured values tends to decrease with increasing fBR for Sentinel-2, GF-6, and Landsat 8. It may be because a lower fBR is more likely to receive interference from topography and other features, resulting in higher uncertainty in the estimated values.
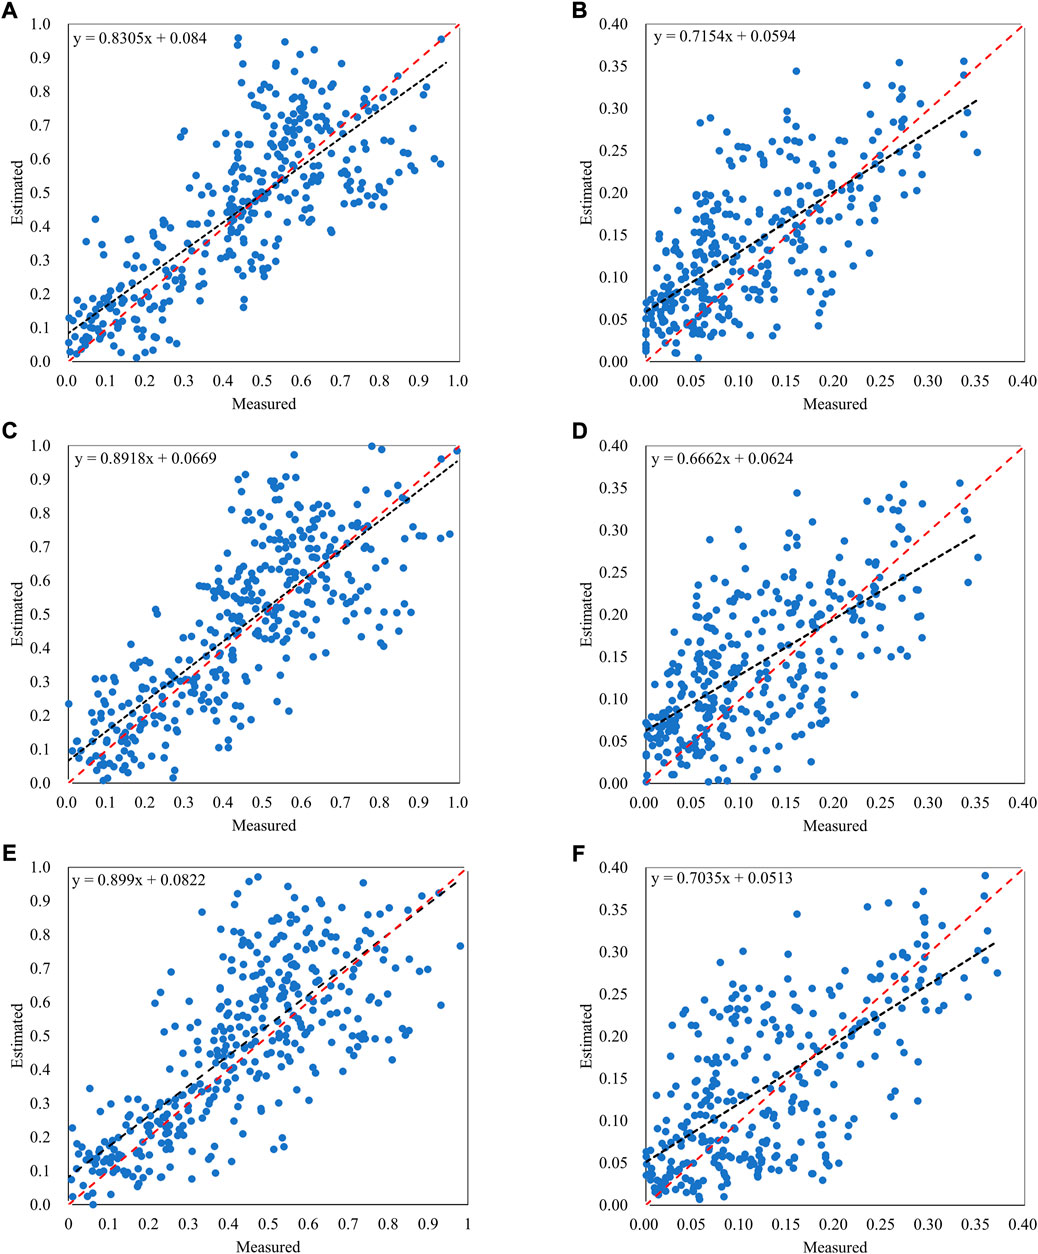
FIGURE 8. fVC and fBR estimation accuracy validation against field samples. (A) fVC of Sentinel-2, (B) fBR of Sentinel-2, (C) fVC of GF-6, (D) fBR of GF-6, (E) fVC of Landsat 8, (F) fBR of Landsat 8.
3.3 Different application scenarios
This study counted the information extraction accuracy of three sensors under different vegetation cover levels and explored different sensor data application scenarios.
As seen in Table 3, at the fVC level of 0–0.2, the extraction accuracy of Sentinel-2 is the highest, followed by Landsat 8, and the extraction accuracy of GF-6 is the lowest; at the fVC level of 0.2–0.4, the extraction accuracy of Sentinel-2 is the highest, followed by GF-6, and the extraction accuracy of Landsat 8 is the lowest; at the fVC level of 0.4–0.6, the extraction accuracy of Sentinel-2 is the highest, followed by GF-6, and the extraction accuracy of Landsat 8 is the lowest; at the fVC level of 0.6–0.8, the extraction accuracy of GF-6 is the highest, followed by Sentinel-2, and the extraction accuracy of Landsat 8 is the lowest; at the fVC level of 0.8–1.0, the extraction accuracy of Sentinel-2 is the highest, followed by GF-6, and the extraction accuracy of Landsat 8 is the lowest.
As seen in Table 4, at the fBR level of 0–0.1, the extraction accuracy of Sentinel-2 is the highest, followed by Landsat 8, and the extraction accuracy of GF-6 is the lowest; at the fBR level of 0.1–0.2, the extraction accuracy of Sentinel-2 is the highest, followed by GF-6, and the extraction accuracy of Landsat 8 is the lowest; at the fBR level of 0.2–0.3, the extraction accuracy of Sentinel-2 is the highest, f followed by GF-6, and the extraction accuracy of Landsat 8 is the lowest; at the fBR level of 0.3–0.4, the extraction accuracy of Sentinel-2 is the highest, followed by GF-6, and the extraction accuracy of Landsat 8 is the lowest.
Through experimental comparison and analysis, Sentinel-2 obtains high information extraction accuracy in all level scenes. At the fVC 0–0.1 and fBR 0–0.1 levels, the information extraction accuracy of GF-6 is lower than that of Landsat 8. This may be because the target information is weaker and more likely to receive the influence of other characteristic radiation, reflection, and other factors. GF-6 has a wide range of bands and no sensitive bands of BR, leading to a weaker accuracy in extracting weak information. With the improvement of fVC and fBR levels, the extraction accuracy of GF-6 has been improved to some extent.
Through the comparison of the study, Sentinel-2 achieves high accuracy for both fVC and fBR under different level application scenarios. It thus has great potential for application in rocky desertification information extraction.
3.4 Spatial distribution characteristics
The spatial distribution characteristics of fVC and fBR were analyzed using the most accurate Sentinel-2 estimation results. Figures 9, 10 show the spatial distribution of fVC and fBR obtained in the study area. The spatial distribution of fVC and fBR in Puding County is consistent with field observations at the beginning of 2022.
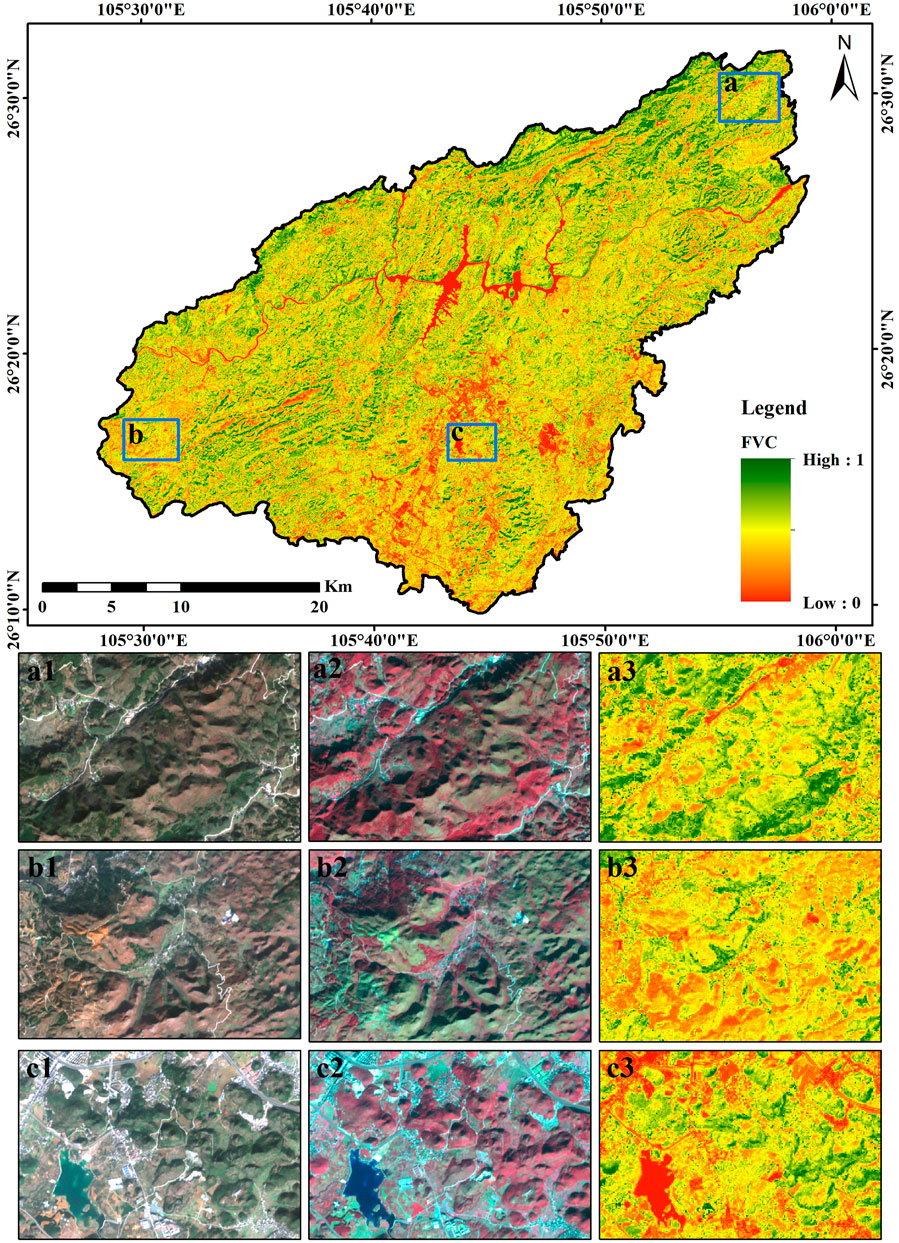
FIGURE 9. Spatial distribution map of fVC based on Sentinel-2. (*1 true-color, *2 stand false-color, *3 fVC)
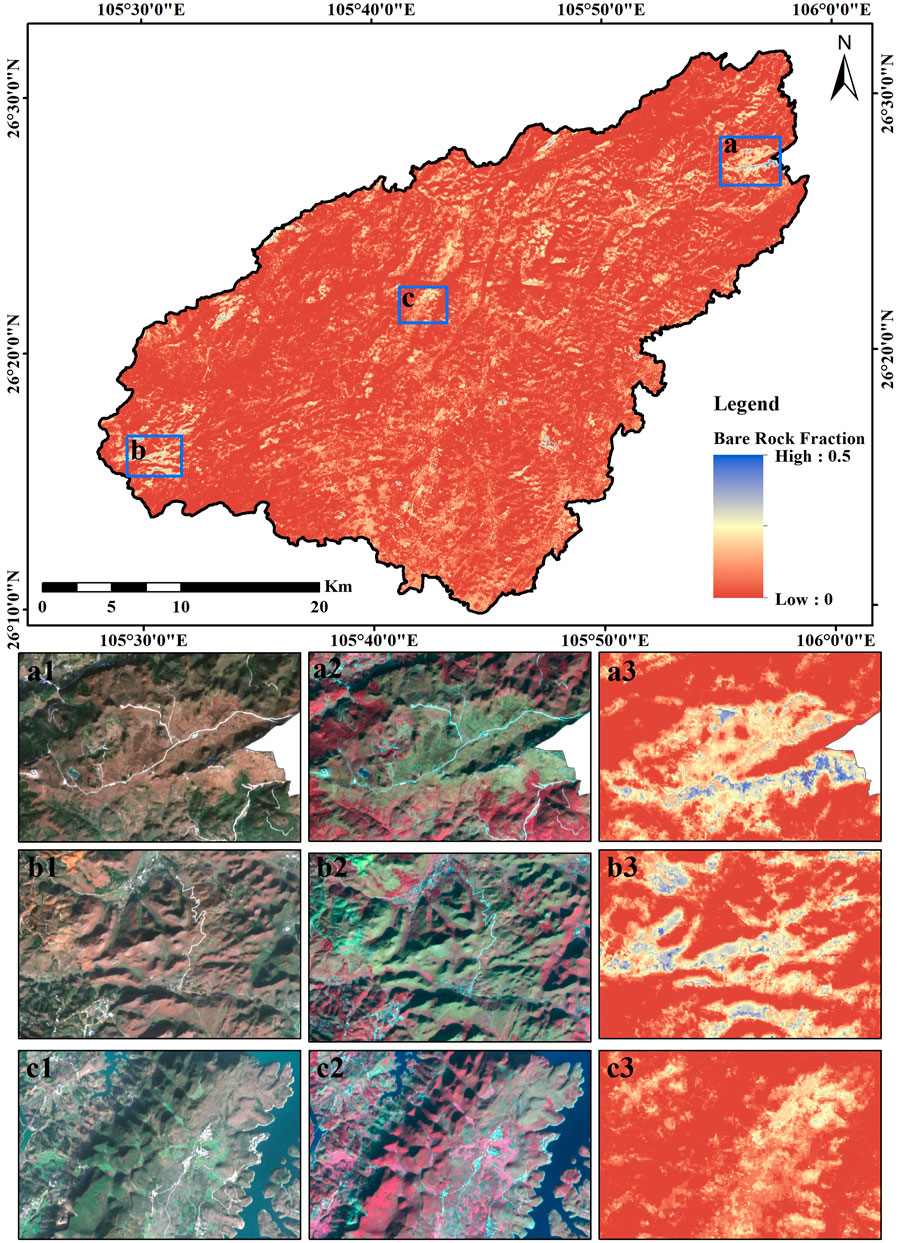
FIGURE 10. Spatial distribution map of fBR based on Sentinel-2. (*1 true-color, *2 stand false-color, *3 fBR)
Puding County is naturally divided into the north and south parts of the Sancha River Valley. Figure 9 shows that the areas with high fVC are mainly distributed in the northern part of the Sancha River Valley, with the best fVC in the northeastern part. The fVC is higher in the higher elevation areas south of the Three Forks River; the fVC is lower in the western area and the lowest in the southern area. Through the analysis, we can see that the economic development is weaker, and the vegetation is better protected in places with higher altitudes, more restricted topography and relatively poor transportation conditions.
Puding County is naturally divided into the north and south parts of the Sancha River Valley. Figure 9 shows that areas with high fVC are mainly distributed in the northern part of the Sancha River Valley. And fVC in the southern area is relatively low. Overall, vegetation is better protected in areas with higher elevations, complex topography, and relatively poor transportation conditions. In contrast, in areas where cities and villages are concentrated, the area has gentle terrain, convenient transportation, a relatively concentrated population, and high intensity of land use, resulting in lower fVC.
Puding County is a typical rocky desertification study area. BR are common throughout the county. As depicted in Figure 10, most of the BR areas are on steep slopes and around cultivated land. Combined with the knowledge of local exemplary BR in the field survey, severe BR is closely related to human production activities. The main exposed areas of natural BR are usually located on steeply broken surfaces, and projected surfaces are usually covered with ferns and mosses.
4 Discussion
Due to the high surface complexity, broken features, and high spatiotemporal heterogeneity of the karst area in southwest China, remote sensing images often contain mixed pixels and the same object having a discrete spectrum. Rocky desertification as a significant ecological problem has been perplexing this region. How to accurately characterize fVC and fBR in this region is a difficult point. The traditional linear spectral unmixing method for the inversion of typical ground abundance cannot meet experimental accuracy. It can be challenging to obtain the critical indicators for evaluating karst rocky desertification. As a result, in this work, the results of fVC and fBR estimates from Sentinel-2, GF-6, and Landsat 8 satellite data were compared using the MESMA method to explore better decomposition strategies and more suitable data sources.
(1) Endmember selection is crucial for successfully applying mixed pixel decomposition technology. The endmember library’s size, accuracy, and decomposition efficiency will be directly affected by the selected approach, which will be varied. Each pixel in the MESMA method needs to be unmixed with various endmember models to find the best endmember model. Hence, MESMA requires much time. Considering the particularity of high surface complexity, fragmentation, and high spatiotemporal heterogeneity in karst rocky desertification areas, we sacrifice the computational efficiency of the model to a certain extent and join the endmembers selected by IES, EAR, CoB, MASA, and AMUSE methods to participate in the final mixed decomposition. The union of the endmembers selected by the above methods is used to enhance the richness and diversity of the spectral library.
(2) In this study, the Sentinel-2 data and Landsat 8 data were taken on 13 January 2021, while the GF-6 data were taken on 15 January 2021. The seasonal variation in the data can be ignored. However, the establishment of the verification data in the experiment comes from the first 10 days of March 2022, which is distinct from the experimental data. The BR spectrum remains relatively stable, while the vegetation spectrum may vary seasonally. Several reasons may lead to errors, such as image registration errors, ensemble errors or coverage too low to be detected, and substantial spectral similarity between different features. Additionally, the topography of the study area varies greatly, and the shadows of tall features such as mountains will also affect the accuracy and comparability of information extraction.
(3) In this paper, although the MESMA algorithm considers the endmember variability in spectral unmixing, which increases the accuracy of abundance inversion to some extent, the spatial information is not considered in the spectral unmixing analysis. In practice, the study of regional features cannot be viewed as a single pixel, only considering that the spectral information is one-sided, and the spatial continuity problem needs to be considered. Future research will be discussed in depth on how to add spatial information to the MESMA.
(4) Although GF-6 does not have the SWIR band, which is sensitive to BR and minerals, it still has better accuracy for fBR estimating. Therefore, we believe that even if there are no sensitive bands, the required feature information can still be extracted during the feature information extraction process, given that the bands of the feature information in the image can be distinguished to a certain extent.
(5) The spatial distribution of fVC and fBR in the study area is related to the extent of human economic activity. To a certain extent, the constraint of topography and rivers hinders human production activities and positively protects vegetation, and improves rocky desertification. And we will quantify them in future studies.
5 Conclusion
Based on Sentinel-2, GF-6, and Landsat 8 data, the MESMA method was applied to extract fVC and fBR from the karst rocky desertification areas in Puding County, Guizhou Province, China. FVC and fBR were validated using RMSE, MAE, and R2. The results showed that: 1) Sentinel-2 images have higher resolution, the narrowest band range, and the most significant number of bands when compared to GF-6 and Landsat 8, allowing for better information extraction of FVC and fBR in rocky desertification areas. 2) The comparison results of GF-6 and Landsat 8 prove the importance of spatial resolution for estimating fBR in rocky desertification areas. The sensitivity to BR sensitive feature bands is not a decisive factor. The required fBR information can still be extracted if the feature information has a sufficient degree of difference in the image bands. 3) The accuracy of fBR extraction is inferior to fVC, mainly related to the complex geological ecology of rocky desertification areas. The scattered distribution of BR makes this work challenging, and so does the spectral variability between different types of carbonate rocks and within the same category. 4) The Sentinel-2 achieves high accuracy for both fVC and fBR under different level application scenarios. It thus has great potential for application in rocky desertification information extraction. 5) The MESMA method, to some extent, overcomes the problems of high heterogeneity, surface fragmentation, and highly severe pixel mixing effects in remote sensing images of rocky desertification areas and achieves accurate fVC and fBR information.
Data availability statement
The raw data supporting the conclusion of this article will be made available by the authors, without undue reservation.
Author contributions
Conceptualization, YL and BS; methodology, YL; validation, BW; formal analysis, YL and BS; investigation, YL, BW, WS, ZY, TG; resources, ZG; data curation, ZY; writing—original-draft preparation, YL; writing—review and editing, YL and BS; visualization, ZY and TG; supervision, BS; project administration, ZG; funding acquisition, ZG. All authors have read and agreed to the published version of the manuscript.
Funding
This research was funded by the National Science and Technology Major Project of China’s High Resolution Earth Observation System (Project Number: 21-Y30B02-9001-19/22) and within the ESA-MOST China Dragon five Cooperation (ID:59313).
Acknowledgments
We thank Wei Meng of Guizhou Forestry Survey and Planning Institute for his full support and cooperation in the field survey and essential data collection. We thank Qinbin Yu, School of Environment, Resources and Development, Department of Development and Sustainable Development, Asian Institute of Technology (AIT), for her help in the language of the article. We also thank the journal editors and reviewers for their comments and efforts on this article.
Conflict of interest
The authors declare that the research was conducted in the absence of any commercial or financial relationships that could be construed as a potential conflict of interest.
Publisher’s note
All claims expressed in this article are solely those of the authors and do not necessarily represent those of their affiliated organizations, or those of the publisher, the editors and the reviewers. Any product that may be evaluated in this article, or claim that may be made by its manufacturer, is not guaranteed or endorsed by the publisher.
References
Chen, H. Y., Chen, B., and Chen, B. (2005). Lothologic characteristics of houzhai karst small vally, puding, Guizhou Province. Gui Zhou Geol. 33 (04), 284–288. doi:10.3969/j.issn.1000-5943.2005.04.013
Clark, M. L. (2005). An assessment of hyperspectral and lidar remote sensing for the monitoring of tropical rain forest trees. Santa Barbara: University of California.
Crabbé, A. H., Somers, B., Roberts, D. A., Halligan, K., Dennison, P., and Dudley, K. (2020). MESMA QGIS plugin Version 1.0.8. [Software]. Available from: https://bitbucket.org/kul-reseco/mesma (accessed on April 11, 2022).
Degerickx, J., Okujeni, A., Iordache, M., Hermy, M., van der Linden, S., and Somers, B. (2017). A novel spectral library pruning technique for spectral unmixing of urban land cover. Remote Sens. 9 (6), 565. doi:10.3390/rs9060565
Dennison, P. E., Halligan, K. Q., and Roberts, D. A. (2004). A comparison of error metrics and constraints for multiple endmember spectral mixture analysis and spectral angle mapper. Remote Sens. Environ. 93 (3), 359–367. doi:10.1016/j.rse.2004.07.013
Dennison, P. E., and Roberts, D. A. (2003). Endmember selection for multiple endmember spectral mixture analysis using endmember average RMSE. Remote Sens. Environ. 87, 123–135. doi:10.1016/s0034-4257(03)00135-4
Iordache, M., Bioucas-Dias, J. M., Plaza, A., and Somers, B. (2013). MUSIC-CSR: Hyperspectral unmixing via multiple signal classification and collaborative sparse regression. IEEE Trans. Geosci. Remote Sens. 52 (7), 4364–4382. doi:10.1109/tgrs.2013.2281589
Ji, C. C., Li, X. S., Wei, H. D., and Li, S. K. (2020). Comparison of different multispectral sensors for photosynthetic and non-photosynthetic vegetation-fraction retrieval. Remote Sens. 12 (1), 115. doi:10.3390/rs12010115
Li, S., and Wu, H. G. (2015). Mapping karst rocky desertification using Landsat 8 images. Remote Sens. Lett. 6 (9), 657–666. doi:10.1080/2150704x.2015.1070315
Li, X. S., Zheng, G. X., Wang, J. Y., Ji, C., Sun, B., and Gao, Z. (2016). Comparison of methods for estimating fractional cover of photosynthetic and non-photosynthetic vegetation in the Otindag Sandy Land using GF-1 wide-field view data. Remote Sens. 8 (10), 800. doi:10.3390/rs8100800
Liu, Y. G., Liu, C. C., Wei, Y. Z., Liu, Y. G., and Guo, K. (2011). Species composition and community structure at different vegetation successional stages in Puding, Guizhou Province, China. Chin. J. Plant Ecol. 35 (10), 1009–1018.
Mudereri, B. T., Abdel-Rahman, E. M., Dube, T., Niassy, S., Khan, Z., Tonnang, H. E., et al. (2021). A two-step approach for detecting Striga in a complex agroecological system using Sentinel-2 data. Sci. Total Environ. 762, 143151. doi:10.1016/j.scitotenv.2020.143151
Okin, G. S., Clarke, K. D., and Lewis, M. M. (2013). Comparison of methods for estimation of absolute vegetation and soil fractional cover using MODIS normalized BRDF-adjusted reflectance data. Remote Sens. Environ. 130, 266–279. doi:10.1016/j.rse.2012.11.021
Pei, J., Wang, L., Huang, N., Geng, J., Cao, J., and Niu, Z. (2018). Analysis of landsat-8 OLI imagery for estimating exposed bedrock fractions in typical karst regions of southwest China using a karst bare-rock index. Remote Sens. 10 (9), 1321. doi:10.3390/rs10091321
Powell, R. L., and Roberts, D. A. (2008). Characterizing variability of the urban physical environment for a suite of cities in Rondonia, Brazil. Earth Interact. 12 (13), 1–32. doi:10.1175/2008ei246.1
Qin, L. Y., Bai, X. Y., Wang, S. J., Zhou, D. Q., Luo, G. J., Zhang, S. Y., et al. (2014). Landscape pattern evolution of typical karst plateau in Puding, Guizhou during last 40 Years. Chin. J. Ecol. 33 (12), 3349–3357. doi:10.13292/j.1000-4890.2014.0299
Quintano, C., Fernandez-Manso, A., and Roberts, D. A. (2017). Burn severity mapping from Landsat MESMA fraction images and land surface temperature. Remote Sens. Environ. 190, 83–95. doi:10.1016/j.rse.2016.12.009
Roberts, D. A., Smith, M. O., Sabol, D. E., Adams, J. B., and Ustin, S. (1992). “Mapping the spectral variability in photosynthetic and non-photosynthetic vegetation, soils and shade using AVIRIS,”. Summaries 3rd annual JPL airborne geoscience workshop (Pasadena, CA: AVIRIS), Vol 1, 38–40.
Roberts, D. A., Gardner, M., Church, R., Ustin, S., Scheer, G., and Green, R. O. (1998). Mapping chaparral in the Santa Monica Mountains using multiple endmember spectral mixture models. Remote Sens. Environ. 65, 267–279. doi:10.1016/s0034-4257(98)00037-6
Roberts, D. A., Dennison, P. E., Gardner, M. E., Hetzel, Y., Ustin, S., and Lee, C. (2003). Evaluation of the potential of hyperion for fire danger assessment by comparison to the airborne visible/infrared imaging spectrometer. IEEE Trans. Geosci. Remote Sens. 41 (6), 1297–1310. doi:10.1109/tgrs.2003.812904
Roberts, D. A., and Quattrochi, D. A. (2012). Synergies between VSWIR and TIR data for the urban environment: An evaluation of the potential for the Hyperspectral Infrared Imager (HyspIRI) Decadal Survey mission. Remote Sensing of Environment 117, 83–101.
Roth, K. L., Dennison, P. E., and Roberts, D. A. (2012). Comparing endmember selection techniques for accurate mapping of plant species and land cover using imaging spectrometer data. Remote Sens. Environ. 127, 139–152. doi:10.1016/j.rse.2012.08.030
Schaaf, A. N., Dennison, P. E., Fryer, G. K., Roth, K. L., and Roberts, D. A. (2011). Mapping plant functional types at multiple spatial resolutions using imaging spectrometer data. GIScience Remote Sens. 48 (3), 324–344. doi:10.2747/1548-1603.48.3.324
Somers, B., Asner, G. P., Tits, L., and Coppin, P. (2011). Endmember variability in spectral mixture analysis: A review. Remote Sens. Environ. 115 (7), 1603–1616. doi:10.1016/j.rse.2011.03.003
Teillet, P. M., Guindon, B., and Goodenough, D. G. (1982). On the slope-aspect correction of multispectral scanner data. Can. J. Remote. Sens. 8 (2), 84–106. doi:10.1016/j.rse.2011.03.003
Wang, S. J., and Li, Y. B. (2007). Problems and development trends about researches on karst rocky desertification. Adv. Earth Sci. 22 (06), 573–582. doi:10.3321/j.issn.1001-8166.2007.06.003
Wang, S. J., Liu, Q. M., and Zhang, D. F. (2004). Karst rocky desertification in southwestern China: Geomorphology, land use, impact, and rehabilitation. Land Degrad. Dev. 15 (2), 115–121. doi:10.1002/ldr.592
Wu, C. (2004). Normalized spectral mixture analysis for monitoring urban composition using ETM+ imagery. Remote Sens. Environ. 93 (4), 480–492. doi:10.1016/j.rse.2004.08.003
Xia, X. Q., Tian, Q. J., and Du, F. L. (2006). Retrieval of rock-desertification degree from multi-spectral remote sensing images. J. Remote Sens. 4 (10), 469–474. doi:10.11834/jrs.20060470
Xiong, Y., Yue, Y. M., and Wang, K. L. (2013). Comparative study of indicator extraction for assessment of karst rocky desertification based of hyperion and AETER images. Bull. Soil Water Conservation 33 (03), 186–190. doi:10.13961/j.cnki.stbctb.2013.03.006
Yue, Y. M., Wang, K. L., Liu, B., Li, R., Zhang, B., Chen, H., et al. (2013). Development of new remote sensing methods for mapping green vegetation and exposed bedrock fractions within heterogeneous landscapes. Int. J. Remote Sens. 34 (14), 5136–5153. doi:10.1080/01431161.2013.787500
Yue, Y. M., Wang, K. L., Zhang, B., Liu, B., Chen, H., and Zhang, M. (2011a). Uncertainty of remotely sensed extraction of information of karst rocky desertification. Adv. Earth Sci. 26 (3), 266–274. doi:10.11867/j.issn.1001-8166.2011.03.0266
Keywords: fractional vegetation cover, fraction bare rock, multiple endmember spectral mixture analysis, karst rocky desertification, sentinel-2, GF-6 WFV, landsat 8 OLI
Citation: Li Y, Sun B, Gao Z, Su W, Wang B, Yan Z and Gao T (2022) Extraction of rocky desertification information in karst area by using different multispectral sensor data and multiple endmember spectral mixture analysis method. Front. Environ. Sci. 10:996708. doi: 10.3389/fenvs.2022.996708
Received: 18 July 2022; Accepted: 10 October 2022;
Published: 07 November 2022.
Edited by:
Huikyo Lee, NASA Jet Propulsion Laboratory (JPL), United StatesCopyright © 2022 Li, Sun, Gao, Su, Wang, Yan and Gao. This is an open-access article distributed under the terms of the Creative Commons Attribution License (CC BY). The use, distribution or reproduction in other forums is permitted, provided the original author(s) and the copyright owner(s) are credited and that the original publication in this journal is cited, in accordance with accepted academic practice. No use, distribution or reproduction is permitted which does not comply with these terms.
*Correspondence: Bin Sun, c3VuYmluQGlmcml0LmFjLmNu
 Yifu Li
 Bin Sun
 Zhihai Gao1,2