- 1State Key Laboratory of Hydrology-Water Resources and Hydraulic Engineering, Hohai University, Nanjing, China
- 2Nanjing Hydraulic Research Institute, State Key Laboratory of Hydrology-Water Resources and Hydraulic Engineering, Nanjing, China
- 3College of Energy and Environmental Engineering, Hebei University of Engineering, Handan, China
- 4PowerChina Jiangxi Electric Power Design Institute Co., Nanchang, China
The processes of soil freezing-thawing lead to soil water and heat movement in cold regions, which significantly influences the hydrological and energy cycles in the soil-plant-atmosphere system. This study presents a soil water content coupled with heat transfer model based on physical processes of water and heat movement in frozen soil. The model was calibrated and validated using the measured data of soil temperature and frost and thaw depth at 19 stations in and around the Three-River Source Region of China. The results show that the frozen soil model could capture the processes of soil freezing-thawing processes well at this region. The relationship between model parameters and climate and vegetation factors was analyzed using the observation data and remote sensing data obtained from MODIS, and results showed that the parameter c which represents the soil properties has a good correlation with longitude and vegetation coverage. A multi-regression model was established to estimate the model parameters in regions without observation data and its determination coefficient R2 was 0.82. The mean relative error between calibration and inversion parameters of 19 stations is 6.29%. Thus, the proposed method can be applied to cold regions without observation data to obtain the parameters and simulated the soil freezing-thawing processes.
1 Introduction
The area of frozen soil accounts approximately 60% of the Northern Hemisphere in the winter (Zhang et al., 1999). Frozen soil processes play an important role in the land surface hydrological and energy cycles in cold regions by altering soil hydraulic and thermal characteristics. The processes of soil water freezing delay the winter cooling of the land surface, while the processes of soil water thawing delay the summer warming of the land surface (Poutou et al., 2004). The spatial distribution of frozen soil at early spring melt season exerts significant influences on spring runoff generation.
The presence of ice in the soil reduces the infiltration capacity, which leads to a higher percentage of snowmelt and spring precipitation being partitioned into surface runoff and thus influences the hydrological cycles (Cherkauer and Lettenmaier, 2003; Jiang et al., 2013; Orakoglu et al., 2016). It also influences the timing of spring runoff and the amount of soil moisture (Koren et al., 1999). In the late 1960s, researchers began to study the basic processes of soil freezing. According to the experimental study by Hoekstra (Hoekstra, 1966), water transferred from the unfrozen zone to the frozen zone when the soil temperature was below a freezing point and then the soil was frozen. The first coupled frozen soil model was developed by Harlan (1971), and most of the other frozen soil models were established on the basis of Harlan’s theories (Sheppard et al., 1978; Taylor and Luthin, 1978; Fukuda, 1980; Fukuda et al., 1987). In recent years, more attention has been paid to the frozen soil processes and hydrological cycles in cold regions, especially on the Qinghai-Tibet Plateau. Due to its unique geographical location with high latitude, the frozen soil is more sensitive to climate change and surface conditions (Jiang et al., 2016; Sun et al., 2020; Sheng et al., 2021). In the past 30 years, global warming had led to a 0.2°C increase in the frozen soil temperature on the Qinghai-Tibet Plateau, and the thickness of frozen soil is projected to decrease in the next 100 years (Wang et al., 2001; Gao et al., 2003; Du et al., 2012). After analyzing the relationship between maximum frozen depth and accumulated negative temperatures, Hao. (2013) found a significant linear correlation between the maximum accumulated negative temperatures and the maximum frozen depth, and established an empirical relationship to estimate the maximum frozen depth in the Yellow River Source Region. Xia et al. (2011) simulated the soil freezing and thawing on the northeast Tibetan Plateau by using the land-surface model CLM3.0 and results showed that the trend of freezing and thawing processes could be simulated well, and the simulation of freezing was better than that of thawing in general. Yin et al. (2010) applied the SHAW model in alpine steppe on the Tibetan Plateau and showed that the model performed well. However, most of frozen soil models applied on the Qinghai-Tibet Plateau focus more on the freezing-thawing processes and consider less on the interactions between heat transfer and water movement.
Another development of frozen soil models is to optimize the frozen soil parameterization scheme in land surface models (LSMs). By introducing the super cooled soil water and a fractional permeable area, Niu and Yang (2006) modified the frozen soil scheme in Community Land Model version 2.0 (CLM2.0) and improved the monthly runoff and terrestrial water storage change in cold-region river basins. Using soil matric potential to define maximum liquid water content when the soil temperature was below the freezing point, Luo et al. (2009) improved a frozen soil parameterization scheme in CoLM and the simulated soil liquid water content and soil temperatures were significantly improved. Liu. (2015) optimized the frozen parameterization scheme of CoLM model and simulated the frozen soil processes in the Naqu area on the Qinghai-Tibet Plateau. The results showed that the modified models capture the characteristics of the soil freezing-thawing processes better.
The active layer of frozen ground is a rock and soil layer that is frozen in winter and thawed in summer in the crustal surface every year. And it is highly sensitive to climate and environmental change. The processes of frozen soil active layer freezing and thawing lead to the movement of soil water, which significantly influences hydrological processes, water resources, agriculture, and environment in cold regions. Understanding the water and heat transfer processes of active layer in these areas is highly important for a better understanding of the water and energy cycles.
However, due to the sparse meteorological station networks in the cold regions, previous studies mostly focused on the processes at point or local scale with observation data. In regions without observation data, model parameters could not be obtained. In this paper, we obtained frozen soil model parameters that calibrated by observation data of 19 stations in the Three-River Source Region. Based on analyzing the relationship between model parameters and climate and vegetation factors, we tried to establish a model to obtain the parameters in regions without observation data. The results of this work will provide a method to study coupling of the frozen soil water-heat and hydrological cycles in the cold regions without observation data.
2 Research area
The name of Three-River Source Region (TRSR) indicates that it is source region of three rivers including Yellow River, Yangtze River and Lancang River. It is located in central part of the Qinghai-Tibetan Plateau (Figure 1), which covers a territory about 297,000 km2 and is well known as the “Roof of the World”. The areas of the Yellow River Source Region (YeSR), the Yangtze River Source Region (YaSR), and the Lancang River Source Region (LcSR) are 116,000 km2 (39%), 128,000 km2 (43.2%), and 53,000 km2 (17.8%), respectively (Liu et al., 2008; Zhang et al., 2012; Liang et al., 2013; Yuan et al., 2015). This region is also called ‘water tower of China’ as 49% of water in Yellow River, 15% of water in Lancang River and 25% of water in Yangtze River originate from here (Tang, 2003; Liu et al., 2012; Zhang et al., 2013).
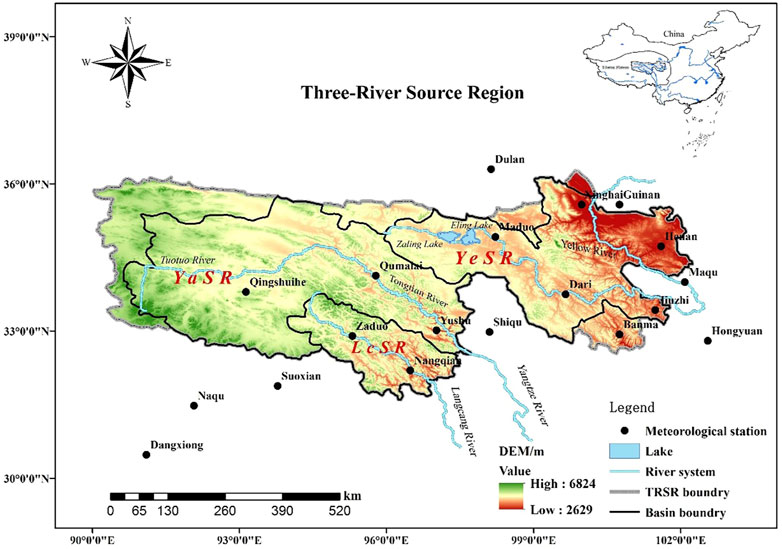
FIGURE 1. Geographical overview and spatial distribution of meteorological stations in the Three-River Source Region (TRSR) of Tibetan Plateau, China.
The general climate in TRSR is cold and dry, and characterized by the typical plateau continental climate (Yi et al., 2011; Xiang et al., 2013). The average annual air temperature of TRSR ranges from −5.4 to 4.2°C (Xu et al., 2011; Luo et al., 2016; Yu et al., 2022). The maximum mean monthly temperature is in July with a range of 6.4°C–13.2°C in July, and the minimum mean monthly temperature is in January from −6.6°C to −13.8°C (Wang et al., 2005).
The average annual precipitation ranges from 770 mm in the southeast to 260 mm in the northwest, and approximately 75% of the total precipitation occurred during the rainy season (June to September) (Li et al., 2009; Xiang et al., 2013). The average annual sunlight hours and evaporation ranges from 2300 to 2900 h and 730–1700 mm, respectively. Cumulative annual solar radiation fluctuates from 5500 to 6800 MJ/m2 (Liu, 2010).
TRSR has a special structure of the natural environment, diverse ecosystem types and species diversity of unique, in which some types of vegetation, such as coniferous forest, shrub, alpine meadow, alpine grassland, alpine sparse vegetation, distribute from southeast to northwest (Li et al., 2011). TRSR has the largest alpine wetland ecosystem in the world, and abundant rivers, lakes, mountain snow and glacier resources, therefore it plays an important role in providing water resources for industry, agriculture and domestic water use in downstream (Liu et al., 2014; Tong et al., 2014). The permafrost and seasonal frozen soil distributed in 75% area of this region (Jiang and Zhang, 2016). Due to the sensitivity of active layer to temperature, the ecosystem in this region is highly fragile. The global warming and the increasing of human activities in recent decades have contributed to glaciers retreat, the rising snow line, grassland degradation, and the decline in water conservation capacity, and further pose a serious threat to the ecosystem in TRSR (Shao et al., 2013; Yu et al., 2020).
3 Mathematical models
3.1 Model description
This study simulated the processes of soil freezing and thawing and coupled water-heat movement based on Harlan’s model. Comparing water movement in frozen soil to that in unsaturated soil, Harlan firstly developed a coupled model to analyze water and heat movement in frozen soil under some hypotheses (Harlan, 1971; Harlan, 1973). Subsequently, a numerical model that adopted the finite difference method was derived by Kung and Steenhuis (1986) to simulate soil water and heat movement. This model overcame limitations in description of water flux for a partly frozen soil in Harlan’s model. Based on Harlan’s theories, Taylor, Sheppard, Fukuda, et al. (Sheppard et al., 1978; Taylor and Luthin, 1978; Fukuda, 1980; Fukuda et al., 1987) analyzed and improved Harlan’s model or developed their own models.
3.2 The frozen soil water-heat movement model and parameters
Soil water movement for the processes of soil freezing and thawing was described by Richards equation as follows:
where
In this paper, due to lack of available soil data in TRSR, the unsaturated hydraulic conductivity and the diffusivity of frozen soil are given as the following empirical formulas respectively (Lei et al., 1988; Hao et al., 2009):
where D1, D2, K1 and K2 are parameters, D1 = 226.4, D2 = 8.4, K1 = 0.9, K2 = 10.87 (Lei et al., 1988; Hao et al., 2009); θs is saturated water content (
For partially frozen soil, hydraulic conductivity and diffusivity are adjusted by the following formulas respectively (Taylor and Luthin, 1978; Lei et al., 1988):
where
The one-dimensional heat flux equation of frozen soil is given by:
where
Volumetric heat capacity,
where
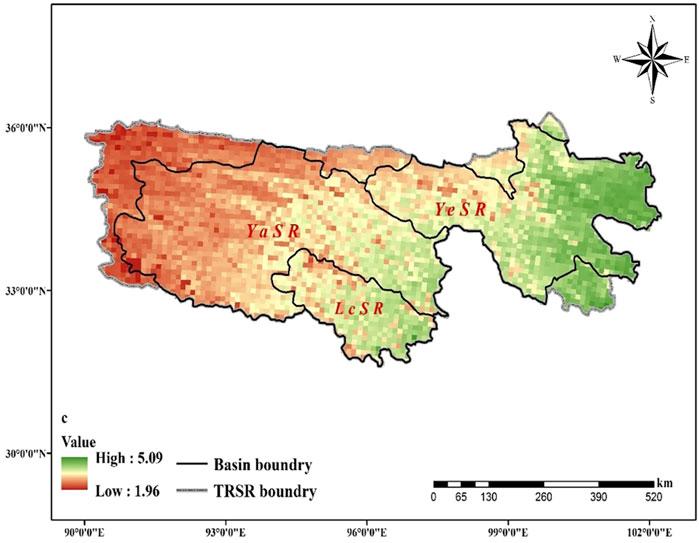
where c is a parameter about the soil properties and varies with the sand and clay content, which is mainly influenced by the regional climate including long term average temperature and precipitation and land cover. It also exhibits an obvious vertical distribution which could be characterized by latitude-longitude and elevation. As an important parameter in frozen soil water-heat movement model, this paper established a multiple regression model between c and factors that significantly correlated with it (i.e. climate characteristics, vegetation characteristics and geographical characteristics). After that, the multiple regression model was applied to calculate the spatial distribution of c in TRSR for simulating the processes of soil freezing and thawing. The calculation were conducted at a resolution of 1 km by 1 km to match the vegetation coverage and MODIS LST data.
Soil thermal conductivity is highly complex because it is not only related to the proportion of the components, but also related to the structure and shape of soil components and other factors. Considering this, in this paper, an empirical formula was used for estimation of soil thermal conductivity (Shi et al., 1998).
where
In the processes of soil freezing and thawing, the connection between water and heat movement of frozen soil is mainly reflected in the dynamic equilibrium of water content and soil subzero temperature, namely a one-one correspondence exists between the soil subzero temperature and water content. Therefore, the connecting equation is written as (Shang et al., 1997):
where
However, due to the different initial water content and the hysteresis effect of soil water retention characteristics, the relationship between water content and subzero temperature is not a one-to-one correspondence single value function. In this paper, the relationship is given as the following empirical formula (An et al., 1987):
Due to the nonlinearity of soil water-heat movement basic equations, the anisotropy of soils and the complexity of the initial and boundary conditions, a numerical simulation method instead of analytical methods was generally used to solve these equations. In this paper, the finite difference method was used to numerically simulate the water–heat coupled movements.
Using a central difference scheme, Equations 1, 6 can be transferred respectively as follows:
where subscript i is the ith soil layer, superscript k is the number of computation time intervals in a time step. The coefficients of αi, βi, γi, hi, Ai, Bi, Ci and Di can be calculated from initial conditions of soil temperature and water content.
Equations 12 and 13 are all in a set of tridiagonal equations, which can be solved by a chasing method. The time step was set as 1 day and the spatial step was 0.01 m. So, on the basis of certain initial and boundary conditions, the numerical solution of water and heat coupled movement in frozen soil can be obtained.
4 Data and method
4.1 Meteorological data
The data were collected from 19 meteorological stations in and around TRSR. The station information is presented in S1, and the geographical location of the stations is shown in Figure 1. The data includes daily air temperature, precipitation, frozen depth, thawed depth, surface temperature and soil temperatures at 5, 10, 15, 20 and 40 cm depth from 1 January 2006 to 31 December 2008, and the missing data were obtained by linear interpolation.
4.2 Vegetation coverage
The index of vegetation coverage was used to analyze the geographical law of parameters c in TRSR. The parameter c in the coupled model relates to the soil properties, and experiments showed that Normalized Difference Vegetation Index (NDVI) is sensitive to the change of soil properties (Baret and Guyot, 1991; Fang and Tian, 1998). NDVI is a comprehensive reflection of the vegetation types, form and growth status in the unit pixel and its value depends on vegetation coverage and leaf area index (LAI) and other factors, thus providing a measure of vegetation coverage (Carlson and Ripley, 1997). The NDVI data were acquired from NASA (https://ladsweb.nascom.nasa.gov).
A dimidiate pixel model, which is a simplified linear spectral unmixing method, was used to calculate fractional vegetation coverage (FVC) due to its simplicity in principle and form (Ivits et al., 2013). Many studies examined this model by theoretical method and applied research (Leprieur et al., 1994; QI et al., 2000; Zribi et al., 2003). An assumption of the model is that a pixel contains only two elements of vegetation and soil, which can be represented as follows:
where NDVI used in this study was organized at 1 km by 1 km spatial resolution with a 16-days time interval from Moderate-resolution Imaging Spectroradiometer (MODIS).
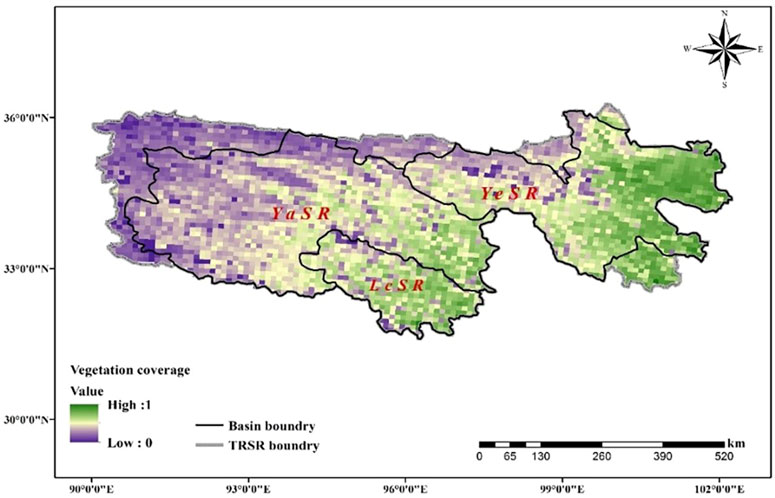
Figure 2 shows the spatial distribution of FVC that used in this study, i.e. the mean value of 12 months from July 2006 to June 2007 in the TRSR, with the vegetation coverage gradually deteriorating from southeast to northwest. The cover in the east of YeSR represent the highest (60%–90%) in TRSR. The vegetation coverage in the LcSR, southeast YaSR and southwest YeSR are relatively high (40%–60%). However, the vegetation coverage was relatively low and generally below 40% in the northwestern YeSR and west of YaSR.
4.3 MODIS LST
Land surface temperature (LST) from MODIS were used as the input data in the frozen soil water-heat model in this study. It plays an important role in material exchange and energy balance between the surface and the atmosphere, and it is a key variable in the study of land surface physical processes at regional and global scale (Wang et al., 2012). Due to the large area of missing pixels of daily MODIS LST product in TRSR, we used the MYD11A2 product with 1 km spatial resolution. This product provides 8-days LST data recovered by the spilt-window algorithm. The empty pixels of MYD11A2 product were filtered from its neighbors by using the spline interpolation. Then we used the liner interpolation method to obtain the daily LST data in TRSR.
The MODIS/AQUA LST products provide two instantaneous observations every day, and the overpass times are in 1:30a.m. and 1:30p.m. In this paper, the daily land surface temperature was estimated by the average of daytime LST and nighttime LST that are respectively closed to the minimum and maximum temperature in a day (Geerts, 2003).
4.4 Statistical analysis of simulation results
The model performance is evaluated by correlation coefficient r, Nash-Sutcliffe efficiency coefficient NSE and the root mean square error RMSE. The methods of calculating r, NSE and RMSE are shown as follows:
Where N is the number of sample;
5 Results and discussion
5.1 Analyze on the processes of frozen soil freezing and thawing
In TRSR, Jiuzhi and Maduo are the typical stations in the processes of soil freezing and thawing. Figure 3 shows that the processes can be divided into four stages.
1) Unstable freezing phase. In this phase, the soil temperatures periodically decrease to less than 0°C with the air temperatures fluctuate around 0°C, which makes the shallow-layer soil periodically experience freezing and thawing. When the negative accumulated temperature is higher than 0°C and the shallow-layer soil is always frozen in the daytime.
2) Freezing phase. In this phase, the air temperatures are always below 0°C. As the air temperatures drop, the freezing depth increases continuously. When the freezing layer temperature reaches the lowest temperature during the freezing period, this phase ends and enters the stable freezing phase.
3) Stable freezing phase. In this phase, the temperatures will stay above 0°C in the daytime, but the nighttime temperatures are still below 0°C. The soil freezing depth has reached the maximum and then remains stable.
4) Thawing phase. As the air temperature continues to rise, the thawing layer thickens gradually. However, because the nighttime temperatures are still below 0°C, the shallow-layer soil is still frozen in the nighttime. Due to the solar radiation and geothermal, the frozen soil begins to thaw bidirectionally until it disappears.
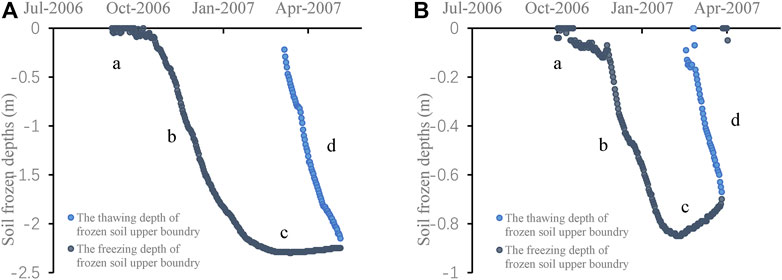
FIGURE 3. The processes of frozen soil freezing and thawing at Maduo station (A) and Jiuzhi station (B) from 1 July 2006 to 30 June 2007.
5.2 Model calibration and verification
Model calibration and verification were carried out at 19 stations in and around TRSR by comparing simulated and observed freezing depths and soil temperatures. The observation data were separated into two periods, 1 July 2006-30 June 2007 and 1 July 2007-30 June 2008, for model calibration and verification, respectively. The calibration results are shown in Table 1.
Taking Xinghai and Dari stations for examples, NSE values for the soil freezing depths were 0.92 and 0.75 during the calibration period, respectively. The NSE for the daily soil temperatures at the Xinghai station for 5, 10, 15, 20, 40 cm were 0.98, 0.98, 0.98, 0.97 and 0.94, respectively. The NSE for the daily soil temperatures at the Dari station for 5, 10, 15, 20, 40 cm were 0.98, 0.99, 0.99, 0.99 and 0.95, respectively.
During the verification period, the r, NSE and RMSE values for simulation of freezing depths of 19 meteorological stations are presented in Table 2. Table 2 shows that the lowest Nash-Sutcliffe efficiency coefficient NSE and correlation coefficient r in simulated freezing depths at Maduo station (Figure 4B) are 0.4 and 0.73, respectively. The highest NSE and r at Zaduo station (Figure 4A) are 0.94 and 0.97, respectively. The average values of NSE and r are 0.89 and 0.77, respectively. It is proved that the model can capture the characteristics of the soil freezing-thawing processes well.
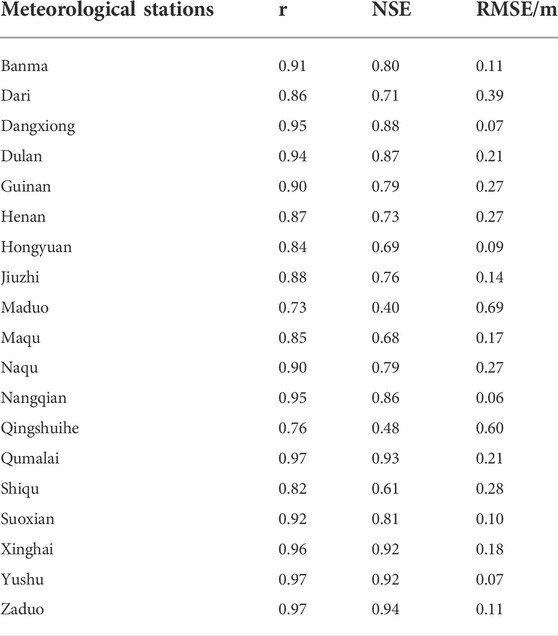
TABLE 2. Correlation coefficient r, Nash-Sutcliffe efficiency coefficient NSE and RMSE between simulated and observed freezing depths during the verification period.
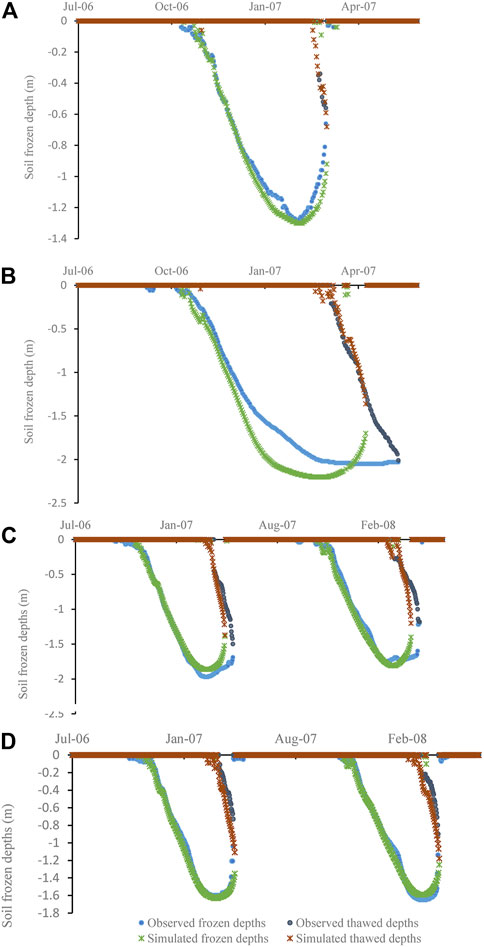
FIGURE 4. The simulated and observed frozen and thawed depths at Zaduo station (A) and Maduo station (B) from 1 July 2007 to 30 June 2008, Dari station (C) and Xinghai station (D) from 1 July 2006 to 30 June 2008.
The simulated and observed frozen depths at Dari and Xinghai stations during the period from 1 July 2006 to 30 June 2008 are shown in Figure 4. The simulation of frozen depths is more accurate than the thawed depths. The simulated and observed daily soil temperatures at Dari station for 5, 10, 15, 20 and 40 cm are shown in Figures 5A–E. The r and NSE values between observed and simulated soil temperatures at Dari station for 5, 10, 15, 20 and 40 cm are all above 0.98 and 0.95, respectively (Figures 5F–J). The RMSE for the five layers is less than 1.52°C (Figures 5F–J). Therefore, the simulated values agreed well with the observed values.
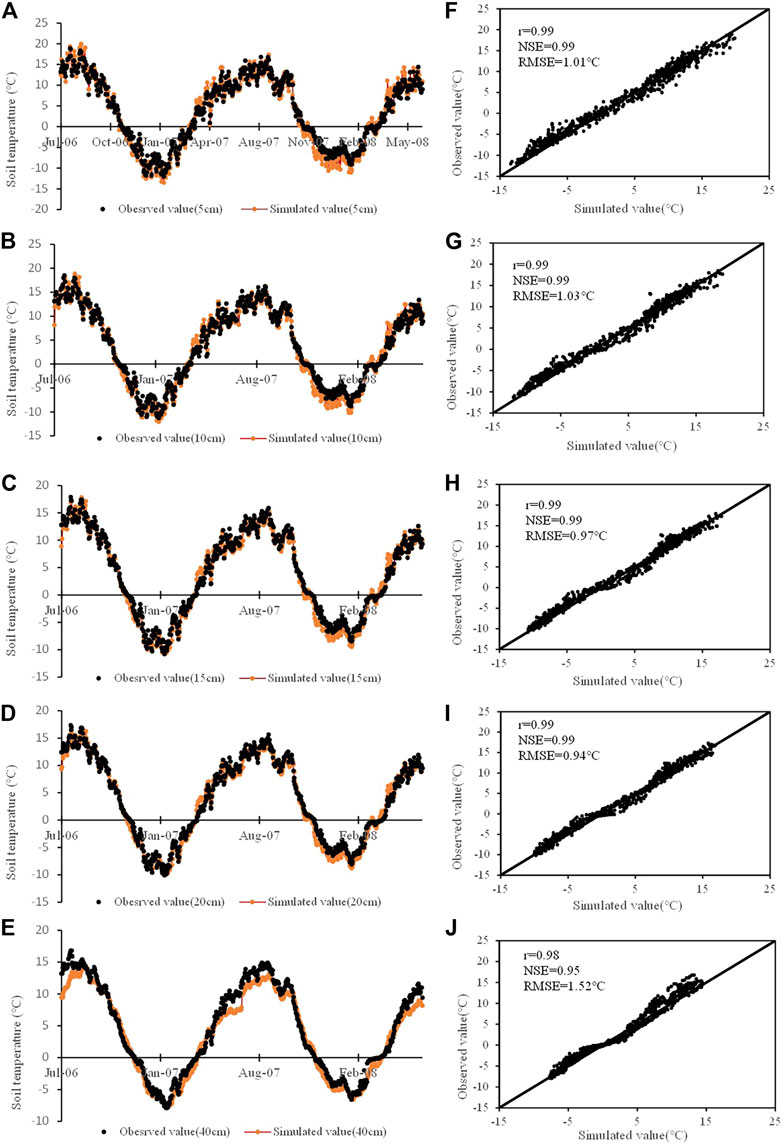
FIGURE 5. At Dari from 1 July 2006 to 30 June 2008: (A–E) daily soil temperatures at 5, 10, 15, 20 and 40cm, (F–J) correlation between the simulation and observation daily soil temperatures at 5, 10, 15, 20 and 40 cm.
5.3 The analysis of geographical law of parameters
5.3.1 Correlation analysis
Model parameter c is an important factor affecting water movement and solutes transport. Hence, correlation analysis using stepwise regression was performed between parameter c and the climate characteristics (annual mean air temperature and annual mean precipitation), vegetation characteristics (vegetation coverage), geographical characteristics (longitude, latitude and altitude) and model parameters.
Figure 6 shows that model parameter c has a positive correlation with longitude, annual mean precipitation, and vegetation coverage. The model parameter c has a better correlation with longitude (Figure 6A, r = 0.75) and vegetation coverage (Figure 6F, r = 0.80) than annual mean precipitation. This is because the longitudinal zonality of soil and the status of vegetation comprehensively reflect soil texture, organic content, and soil moisture content.
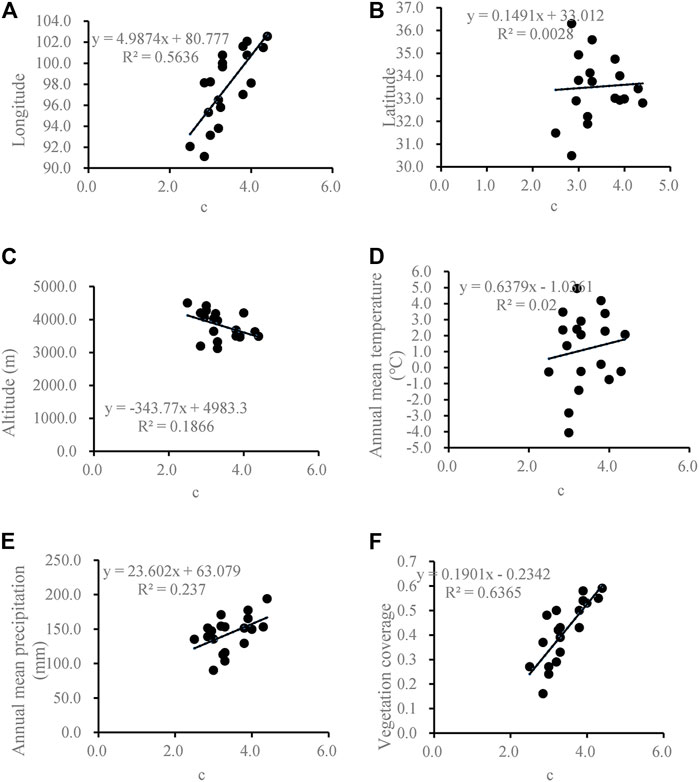
FIGURE 6. Correlation between model parameter and (A) longitude, (B) latitude, (C) altitude, (D) annual mean temperature, (E) annual mean precipitation, (F) vegetation coverage.
Apart from Suoxian and Dari, a multi-regression equation is established and its determination coefficients R2 is 0.82 under 99% significance test.
where Lon is longitude, FVC is vegetation coverage.
The reliability of the equation was verified before applying the inversion parameters obtained from the above equation to the model in regions. Parameters, inversion parameters and relative error at 19 meteorological stations are shown in Table 3. The highest relative error at Zaduo is 17.77%, the lowest relative error at Dulan is 1.05% and the mean relative error of 19 stations is 6.29%. For examples, the relative errors of Suoxian and Dari are 6.84% and 10.64%, respectively (Table 3). During 1 July 2007 to 30 June 2008, the processes of the soil freezing and thawing simulated by using the inversion parameters are compared with the actual freezing and thawing processes (Figure 7). The correlation coefficient r, Nash-Sutcliffe efficiency coefficient NSE and root mean square error RMSE at Dari are 0.81, 0.67 and 0.37°C, respectively (Figure 7A). At Suoxian, the r, NSE and RMSE values are 0.89, 0.77 and 0.10°C, respectively (Figure 7B). By comparison, the simulation results by using the inversion parameters agree with observed values. Therefore, the method proposed is reliable and can be applied to other regions. The spatial distribution map of c in TRSR is shown in Figure 8.
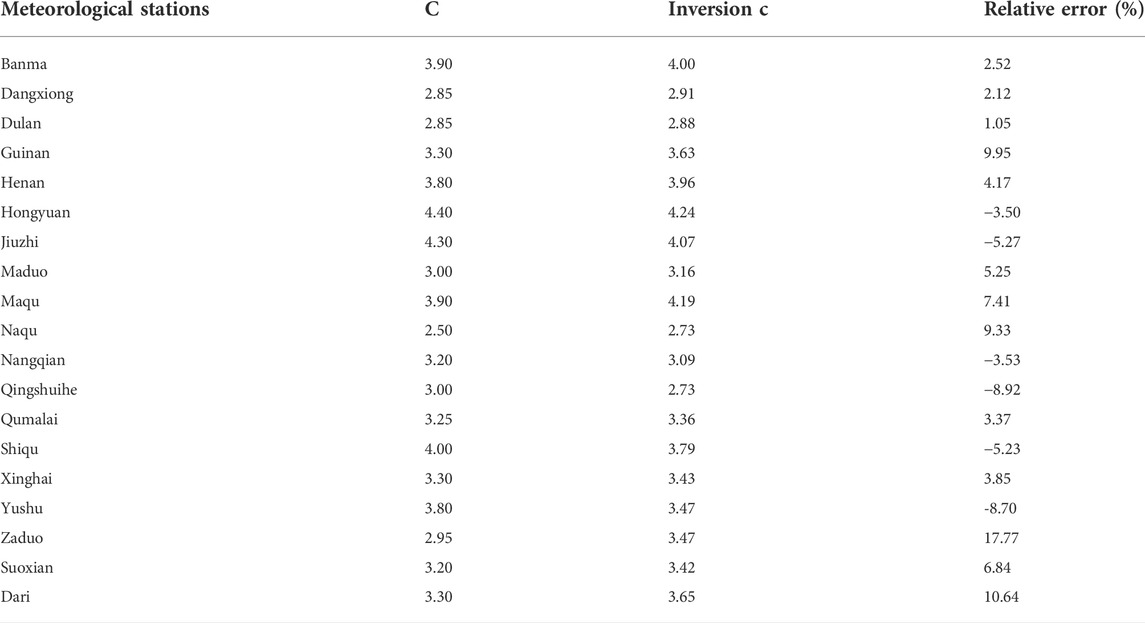
TABLE 3. Parameters, inversion parameters and relative error of 19 stations in and around TRSR. Inversion parameters are calculated by regression Eq. 17.
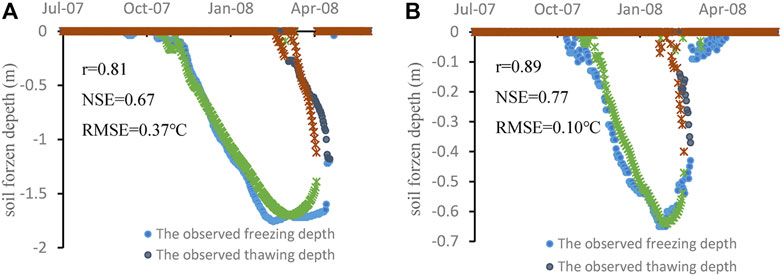
FIGURE 7. The simulated by using the inversion parameters and observed freezing and thawing processes at Dari station (A) and Suoxian station (B) from 1 July 2007 to 30 June 2008. At Dari, r, NSE and RMSE are 0.81, 0.67 and 0.37°C, respectively. At Suoxian, r, NSE and RMSE are 0.89, 0.77 and 0.10°C, respectively.
5.3.2 The simulation of the processes of soil freezing and thawing in TRSR
The soil freezing and thawing are simulated using the inversion parameters calculated by Equation 14 and MODIS daily land surface temperature data from 1 July 2006 to 30 June 2007 in TRSR. Figure 9A, Figure 9B and Figure 9C show the frozen depths in TRSR in January1st 2007, 1 February 2007 and 1 March 2007, respectively. The frozen depths increase from southeast to northwest generally (Figure 9). On January1st 2007 and 1 February 2007, the frozen depths range from 1.13 to 4.10 m (Figure 9A) and 1.21–4.89 m (Figure 9B), respectively. In the east of YeSR and south of LcSR, the frozen depths are below 2 m. In 1 March 2007, the frozen depths range from 0 to 3.12 m and there is almost no frozen soil in the south of LcSR (Figure 9C).
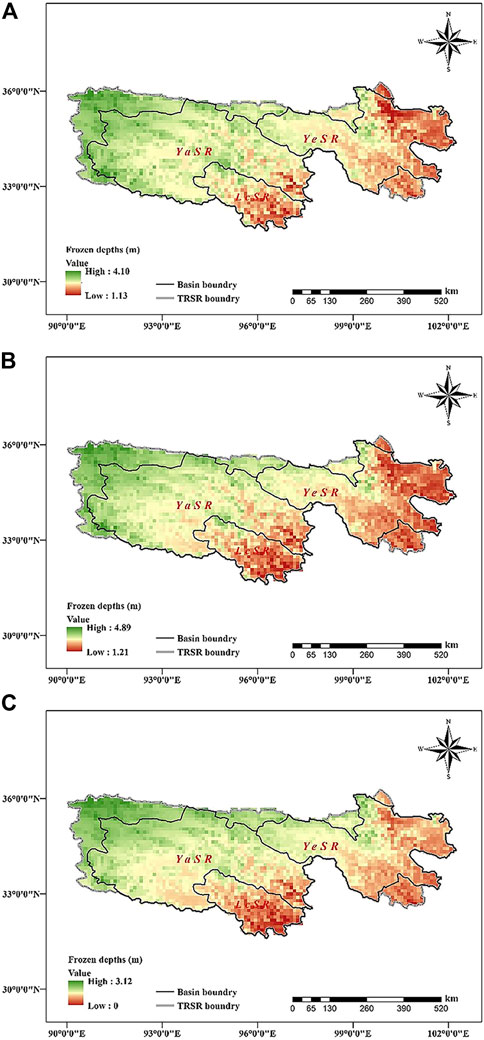
FIGURE 9. Spatial distribution of frozen depths in the TRSR in (A) 1 January 2007, (B) 1 February 2007 and (C) 1 March 2007.
6 Conclusion
In the cold region, water resources, hydrology and ecosystem are significantly influenced by climate change. The simulation of active soil depths and soil temperatures can help us better understand the soil freezing and thawing processes. Based on Harlan’s model, a soil water content coupled with heat transfer model was presented in this paper. Measured data of soil temperature and active soil depths at 19 stations in and around the Three-River Source Region of China were collected for model calibration (1 July 2006-30 June 2007) and verification (1 July 2007 to 30 June 2008). The results showed that the simulated freezing depths and soil temperatures agreed well with the observed values. However, the other factors, e.g. solar radiation, humidity, ground water et al. are not considered in this model, which is the reason that the simulation of thawing processes are not better than freezing processes (Figure 4). During the verification period, the average Nash-Sutcliffe efficiency coefficient NSE and correlation coefficient r in simulated freezing depths at 19 stations are 0.89 and 0.77, respectively. The r and NSE values between observed and simulated soil temperatures at Dari station for 5, 10, 15, 20 and 40 cm are all above 0.98 and 0.95, respectively.
After the correlation analysis between model parameters and the climate characteristics (annual mean air temperature and annual mean precipitation), vegetation characteristics (vegetation coverage) and geographical characteristics (longitude, latitude and altitude), a multi-regression model was established to estimate the model parameters in regions without observation data and its determination coefficient R2 was 0.82. The model parameter c has a better correlation with longitude (r = 0.75) and vegetation coverage (r = 0.80). The mean relative error of 19 stations between calibration and inversion parameters are 6.29%. The simulation results by using the inversion parameters are in good agreement with observed values. However, more geographical parameters should be considered to do correlation analysis to find significant factors. The results showed that the method proposed in this paper can be applied to cold regions without observation data to obtain the parameters and simulated the soil freezing-thawing processes.
Data availability statement
The raw data supporting the conclusions of this article will be made available by the authors, without undue reservation.
Author contributions
The authors’ individual contributions to the paper are listing as follows: QJ: Conceptualization, Software, Writing—Original Draft, Project administration, Funding acquisition RZ: Writing—Review and Editing GW: Supervision WH: Methodology, Formal analysis, QW: Writing—Original Draft, Visualization YL: Visualization WW: Data Curation.
Funding
This work was supported by the National Key R&D Program of China (Grant No. 2021YFC3201104); National Natural Science Foundation of China (Grant No. 52179013, U2240217, and 92047301); the Belt and Road Special Foundation of the State Key Laboratory of Hydrology-Water Resources and Hydraulic Engineering (Grant No. 2020491111).
Conflict of interest
Author WW was employed by the company PowerChina Jiangxi Electric Power Design Institute Co.
The remaining author declares that the research was conducted in the absence of any commercial or financial relationships that could be construed as a potential conflict of interest.
Publisher’s note
All claims expressed in this article are solely those of the authors and do not necessarily represent those of their affiliated organizations, or those of the publisher, the editors and the reviewers. Any product that may be evaluated in this article, or claim that may be made by its manufacturer, is not guaranteed or endorsed by the publisher.
Supplementary material
The Supplementary Material for this article can be found online at: https://www.frontiersin.org/articles/10.3389/fenvs.2022.996701/full#supplementary-material
References
An, W. D., Chen, X. B., and Wu, Z. W. (1987). Numerical simulation analysis of heat and mass transfer under a cannel in freezing. J. Glaciol. Geocryol. 9 (1), 35–46.
Baret, F., and Guyot, G. (1991). Potentials and limits of vegetation indices for LAI and APAR assessment. Remote Sens. Environ. 35 (2-3), 161–173. doi:10.1016/0034-4257(91)90009-u
Carlson, T. N., and Ripley, D. A. (1997). On the relation between NDVI, fractional vegetation cover, and leaf area index. Remote Sens. Environ. 62 (3), 241–252. doi:10.1016/s0034-4257(97)00104-1
Cherkauer, K. A., and Lettenmaier, D. P. (2003). Simulation of spatial variability in snow and frozen soil. J. Geophys. Res. 108 (D22), 2003JD003575–1675. doi:10.1029/2003jd003575
De Vries, D. A., and Van Wijk, W. R. (1963). Physics of plant environment. Environmental control of plant growth 5, 69.
Du, J., Jian, J., Hong, J. C., Lu, H. Y., and Chen, D. M. (2012). Response of seasonal frozen soil to climate change on Tibet Region from 1961 to 2010. J. Glaciol. Geocryol. 34 (3), 512–521.
Fang, H. L., and Tian, Q. J. (1998). A review of hyperspectral remote sensing in vegetation monitoring. Remote Sens. Technol. Appl. 13 (1), 62–69.
Fukuda, M., Kinosita, S., and Nakagawa, S. (1987). Numerical analysis of frost heaving based upon the coupled heat and water flow model. Low Temp. Sci. ser. a Phys. Sci. 45, 83–97.
Fukuda, M., Orhun, A., and Luthin, J. N. (1980). Experimental studies of coupled heat and moisture transfer in soils during freezing. Cold Regions Sci. Technol. 3 (2-3), 223–232. doi:10.1016/0165-232x(80)90028-2
Gao, R., Wei, Z. G., and Dong, W. J. (2003). International variation of the beginning data and the ending data of soil freezing in the Tibetan Plateau. J. Glaciol. Geocryol. 25 (1), 49–54.
Geerts, B. (2003). Empirical estimation of the monthly-mean daily temperature range. Theor. Appl. Climatol. 74, 145–165. doi:10.1007/s00704-002-0715-3
Hao, Z. C. (2013). Estimation method for maximum frozen depth of seasonal frozen soil in Source Region of the Yellow River. Water Resour. Power 31 (5), 73–76.
Hao, Z. C., Zhang, X. P., Zhang, L. L., Wang, L., and Shi, X. L. (2009). Numerical simulation of the change of frozen soil in source regions of the Yellow River under climate warming. J. Heilongjiang Hydraulic Eng. 36 (3), 100–104.
Harlan, R. L. (1973). Analysis of coupled heat-fluid transport in partially frozen soil. Water Resour. Res. 9 (5), 1314–1323. doi:10.1029/wr009i005p01314
Harlan, R. L. (1971). Water transport in frozen and partially frozen porous media. Proc. Can. Hydrol. Symp. 1 (8), 109–129.
Hoekstra, P. (1966). Moisture movement in soils under temperature gradients with the cold-side temperature below freezing. Water Resour. Res. 2, 241–250. doi:10.1029/wr002i002p00241
Ivits, E., Cherlet, M., Sommer, S., and Mehl, W. (2013). Addressing the complexity in nonlinear evolution of vegetation phenological change with time-series of remote sensing images. Ecol. Indic. 26, 49–60. doi:10.1016/j.ecolind.2012.10.012
Jiang, C., and Zhang, L. B. (2016). Ecosystem change assessment in the Three-River headwater region, China: Patterns, causes, and implications. Ecol. Eng. 93, 24–36. doi:10.1016/j.ecoleng.2016.05.011
Jiang, P., Gautam, M. R., Zhu, J., and Yu, Z. (2013). How well do the GCMs/RCMs capture the multi-scale temporal variability of precipitation in the Southwestern United States?. J. Hydrol. 479, 75–85.
Jiang, P., Yu, Z., Gautam, M. R., Yuan, F., and Acharya, K. (2016). Changes of storm properties in the United States: Observations and multimodel ensemble projections. Glob Planet Change 142, 41–52.
Koren, V., Schaake, J., Mitchell, K., Duan, Q. Y., Chen, F., and Baker, J. M. (1999). A parameterization of snowpack and frozen ground intended for NCEP weather and climate models. J. Geophys. Res. 104 (D16), 19569–19585. doi:10.1029/1999jd900232
Kung, S. K. J., and Steenhuis, T. S. (1986). Heat and moisture transfer in a partly frozen nonheaving soil. Soil Sci. Soc. Am. J. 50, 1114–1122. doi:10.2136/sssaj1986.03615995005000050005x
Lei, Z. D., Shang, S. H., and Yang, S. X. (1988). Soil hydrodynamics. Beijing, China: Tsinghua University Press.
Leprieur, C., Verstraete, M. M., and Pinty, B. (1994). Evaluation of the performance of various vegetation indices to retrieve vegetation cover from AVHRR data. Remote Sens. Rev. 10 (4), 265–284. doi:10.1080/02757259409532250
Li, H. X., Liu, G. H., and Fu, B. J. (2011). Response of vegetation to climate change and human activity based on NDVI in the Three-River Headwaters region. Acta Ecol. Sin. 31 (19), 5495–5504.
Li, S. C., Li, D. L., Zhao, P., and Zhang, G. Q. (2009). The climatic characteristics of vapor transportation in rainy season of the origin area of three rivers in Qinhai-Xizang Plateau. Acta Meteorol. Sin. 67 (4), 591–598.
Liang, L. Q., Li, L. J., Liu, C. M., and Cuo, L. (2013). Climate change in the Tibetan plateau three rivers source region: 1960-2009. Int. J. Climatol. 33, 2900–2916. doi:10.1002/joc.3642
Liu, G. S., Wang, G. X., and Zhang, W. (2012). Research on climate and runoff variation characteristics in the Three-River Headwater Region. Resour. Environ. Yangtze Basin 21 (3), 302–309.
Liu, H. (2015). Simulation of the freezing-thawing processes at nagqu area over qinghai-xizang plateau. Plateau Meteorol. 34 (3), 676–683.
Liu, J. Y., Xu, X. L., and Shao, Q. Q. (2008). Grassland degradation in the “Three-River headwaters” region, Qinghai province. J. Geogr. Sci. 18, 259–273. doi:10.1007/s11442-008-0259-2
Liu, X. D. (2010). Study on information extraction and the dynamic monitoring of grassland coverage in three river source area. Acta Agrestia Sin. 18 (2), 154–159.
Liu, X., Zhang, J., Zhu, X., Pan, Y., Liu, Y., Zhang, D., et al. (2014). Spatiotemporal changes in vegetation coverage and its driving factors in the Three-River Headwaters Region during 2000-2011. J. Geogr. Sci. 24, 288–302. doi:10.1007/s11442-014-1088-0
Luo, S. Q., Fang, X., Lyu, S., Ma, D., Chang, Y., Song, M., et al. (2016). Frozen ground temperature trends associated with climate change in the Tibetan Plateau Three River Source Region from 1980 to 2014. Clim. Res. 67, 241–255. doi:10.3354/cr01371
Luo, S. Q., Lv, S. H., and Zhang, Y. (2009). Development and validation of the frozen soil parameterization scheme in Common Land Model. Cold Regions Sci. Technol. 55, 130–140. doi:10.1016/j.coldregions.2008.07.009
Niu, G. Y., and Yang, Z. L. (2006). Effects of frozen soil on snowmelt runoff and soil water storage at a continental scale. J. Hydrometeorol. 7, 937–952. doi:10.1175/jhm538.1
Orakoglu, M. E., Liu, J. K., and Tutumluer, E. (2016). Frost depth prediction for seasonal freezing area in Eastern Turkey. Cold Regions Sci. Technol. 124, 118–126. doi:10.1016/j.coldregions.2015.12.012
Pang, Q. Q., Li, S. X., Wu, T. H., and Zhang, W. G. (2006). Simulated distribution of active layer depths in the frozen ground regions of Tibetan plateau. J. Glaciol. Geocryol. 28 (3), 390–395.
Poutou, E., Krinner, G., Genthon, C., and Noblet-Ducoudré, N. D. (2004). Role of soil freezing in future boreal climate change. Clim. Dyn. 23 (6), 621–639. doi:10.1007/s00382-004-0459-0
Qi, J., Marsett, R. C., Moran, M. S., and Goodrich, D. C. (2000). Spatial and temporal dynamics of vegetation in the San Pedro River basin area. Agric. For. Meteorology 105 (1-3), 55–68. doi:10.1016/s0168-1923(00)00195-7
Shang, S. H., Lei, Z. D., and Yang, S. X. (1997). Numerical simulation improvement of coupled moisture and heat transfer during soil freezing. J. Tsinghua Univ. (Sci Tech) 37, 62–64.
Shao, Q. Q., Jiyuan, L., Lin, H., Jiangwen, F., Xinliang, X., and Junbang, W. (2013). Integrated assessment on the effectiveness of ecological conservation in sanjiangyuan national nature reserve. Geogr. Res. 32, 1945–1956.
Sheng, N. N., Ju, Q., and Dun, Z. J. C. (2021). Permafrost variation characteristics and its relationship with temperature in Yellow River. South-to-North Water Transfers Water Sci. Technol. 19 (5), 843–852. (in Chinese).
Sheppard, M. W., Key, B., and Loch, J. (1978). Development and testing of a computer model for heat and mass flow in freezing soils. Proc. 3rd Int. Conf. Permafr. 1, 76–81.
Shi, C. L., Yu, J. M., and Jin, Z. Q. (1998). Numerical simulation of water and heat transfer during soil freezing and thawing in the situation of saturated soil. Chin. J. Agrometeorology 19 (4), 21–26.
Sun, A., Yu, Z., Zhou, J., Acharya, K., Ju, Q., Xing, R., et al. (2020). Quantified hydrological responses to permafrost degradation in the headwaters of the Yellow River (HWYR) in High Asia. Sci. Total Environ. 712, 135632. doi:10.1016/j.scitotenv.2019.135632
Tang, X. P. (2003). Basic ecological characteristics of the three-rivers' source area and design of the nature reserve. For. Resour. Manag. 1, 38–44.
Taylor, G. S., and Luthin, J. N. (1978). A model for coupled heat and moisture transfer during soil freezing. Can. Geotech. J. 18, 548–555. doi:10.1139/t78-058
Tong, L. G., Xu, X. L., Fu, Y., and Li, S. (2014). Wetland changes and their responses to climate change in the “Three-River headwaters” region of China since the 1990s. Energies 7, 2515–2534. doi:10.3390/en7042515
Wang, B. B., Ma, Y. M., and Ma, W. Q. (2012). Estimation of land surface temperature retrieved from EOS/MODIS in Naqu area over Tibetan Plateau. J. Remote Sens. 16 (6), 1289–1298.
Wang, C. H., Dong, W. J., and Wei, Z. G. (2001). The feature of seasonal frozen soil in Qinghai-Tibet Plateau. Acta Geogr. Sin. 56 (5), 523–531.
Wang, Q. J., Lai, D. Z., Jing, Z. C., Shi-Xiong, L. I., and Shi, H. L. (2005). The resources, ecological environment and sustainable development in the source regions of the Yangtze, Huanghe and Yalu Tsangpo Rivers. J. Lanzhou Univ. Nat. Sci. 41 (4), 50–55.
Xia, K., Luo, Y., and Li, W. P. (2011). Simulation of freezing and melting of soil on the northeast Tibetan Plateau. Chin. Sci. Bull. 43 (20), 2145–2155. doi:10.1007/s11434-011-4542-8
Xiang, X. H., Wu, X. L., Wang, C. H., Chen, X., and Shao, Q. X. (2013). Influences of climate variation on thawing-freezing processes in the northeast of Three-River Source Region China. Cold Regions Sci. Technol. 86, 86–97. doi:10.1016/j.coldregions.2012.10.006
Xu, W. X., Gu, S., Zhao, X., Xiao, J., Tang, Y., Fang, J., et al. (2011). High positive correlation between soil temperature and NDVI from 1982 to 2006 in alpine meadow of the Three-River Source Region on the Qinghai-Tibetan Plateau. Int. J. Appl. Earth Observation Geoinformation 13, 528–535. doi:10.1016/j.jag.2011.02.001
Yi, X. S., Yin, Y. Y., Li, G. S., and Peng, J. T. (2011). Temperature variation in recent 50 Years in the Three-River headwaters region of Qinghai province. Acta Agrestia Sin. 66 (11), 1451–1465.
Yin, Z. F., Ouyang, H., and Chen, X. (2010). Simulating soil freezing and thawing of temperate desert ecosystem on the Qinghai-Tibet Plateau. Procedia Environ. Sci. 2 (9), 476–485. doi:10.1016/j.proenv.2010.10.052
Yu, Y., Zhao, W., Martinez-Murillo, J. F., and Pereira, P. (2020). Loess Plateau: From degradation to restoration. Sci. Total Environ. 738, 140206.
Yu, Y., Zhu, R., Ma, D., Liu, D., Liu, Y., Gao, Z., et al. (2022). Multiple surface runoff and soil loss responses by sandstone morphologies to land-use and precipitation regimes changes in the Loess Plateau, China. CATENA 217, 106477.
Yuan, F. F., Berndtsson, R., Zhang, L., Uvo, C. B., Hao, Z., Wang, X., et al. (2015). Hydro climatic trend and periodicity for the source region of the Yellow River. J. Hydrol. Eng. 20 (10), 05015003. doi:10.1061/(asce)he.1943-5584.0001182
Zeng, X. B., Dickinson, R. E., Walker, A., Shaikh, M., DeFries, R. S., and Qi, J. (2000). Derivation and evaluation of global 1-km fractional vegetation cover data for land modeling. J. Appl. Meteor. 39 (6), 826–839. doi:10.1175/1520-0450(2000)039<0826:daeogk>2.0.co;2
Zhang, T., Barry, R. G., Knowles, K., Heginbottom, J. A., and Brown, J. (1999). Statistics and characteristics of permafrost and ground ice distribution in the Northern Hemisphere. Polar Geogr. Palm. Beach. 23 (2), 147–168. doi:10.1080/10889370802175895
Zhang, Y. Y., Zhang, S. F., Xia, J., and Hua, D. (2013). Temporal and spatial variation of the main water balance components in the three rivers source region, China from 1960 to 2000. Environ. Earth Sci. 68, 973–983. doi:10.1007/s12665-012-1800-2
Zhang, Y. Y., Zhang, S. F., Zhai, X. Y., and Xia, J. (2012). Runoff variation and its response to climate change in the three rivers source region. J. Geogr. Sci. 22 (5), 781–794. doi:10.1007/s11442-012-0963-9
Keywords: frozen soil, soil freezing-thawing processes, soil temperature, active soil depth, cold regions
Citation: Ju Q, Zhang R, Wang G, Hao W, Wang Q, Liu Y and Wang W (2022) Simulating the freezing-thawing processes based on MODIS data in the Three-River Souce Region, China. Front. Environ. Sci. 10:996701. doi: 10.3389/fenvs.2022.996701
Received: 18 July 2022; Accepted: 10 August 2022;
Published: 12 September 2022.
Edited by:
Yang Yu, Beijing Forestry University, ChinaReviewed by:
Dong An, Lund University, SwedenXiaofan Zeng, Huazhong University of Science and Technology, China
Copyright © 2022 Ju, Zhang, Wang, Hao, Wang, Liu and Wang. This is an open-access article distributed under the terms of the Creative Commons Attribution License (CC BY). The use, distribution or reproduction in other forums is permitted, provided the original author(s) and the copyright owner(s) are credited and that the original publication in this journal is cited, in accordance with accepted academic practice. No use, distribution or reproduction is permitted which does not comply with these terms.
*Correspondence: Qin Ju, anVxaW5AaGh1LmVkdS5jbg==
 Qin Ju
 Rongrong Zhang1
 Guoqing Wang
 Yanli Liu