 Weisi Zhang1,2*
 Tao Zhang1
- 1Logistics Research Center, Shanghai Maritime University, Shanghai, China
- 2School of Management, Fudan University, Shanghai, China
This article studies a two-period, closed-loop supply chain (CLSC) with manufacturer or retailer recycling. It establishes a model analysis framework to analyze pricing optimization strategies and the channel-mode selection of electric vehicle batteries and considers manufacturer recycling and retailer recycling scenarios. When a retailer recycles, it needs to invest capital to build its recycling channel and so suffers from capital constraints. For this reason, retailers consider bank loans or trade-credit financing from manufacturers. This work explores a two-stage, CLSC pricing strategy that considers consumers’ preferences for remanufactured products and recycling rates, and it investigates financing channels for capital-constrained retailers. It analyzes optimal equilibrium strategies in three modes and compares the recycling and financing modes. Through numerical examples, it analyzes the effects of value preference rates and recycling rates of remanufactured products on supply chain profits, product demand, and model selection. The results show that the recycling rate can effectively incentivize the demand for new products in the first period. For any remanufactured product recycling cost, the manufacturer’s profit is most significant in the retailer-recycling bank financing model, and the retailer’s profit is largest in the manufacturer recycling model. As the consumer preference rate for remanufactured products increases, the demand for new products in the second stage decreases and the demand for remanufactured products increases. The retailer recycling trade-credit financing from the manufacturer model gives the largest profit to the retailer when the preference rate is significant or when the preference rate is low with a moderate recycling rate.
1 Introduction
Carbon neutrality has become a global objective since 2019 and is entering a period of accelerated development. Countries that account for 75% of the global GDP and 65% of carbon emissions have announced carbon neutrality targets. The Chinese government has committed to reaching peak carbon emissions by 2030 and aims to achieve carbon neutrality by 2060. The core of this dual carbon goal is to fully transform the current fossil-fuel-based energy supply and consumption system into low-carbon and zero-carbon systems; vigorous clean energy development is therefore the primary measure of reducing carbon emissions.
In 2019, China’s transportation sector accounted for about 10% of the total emissions of the national energy system, of which road traffic accounted for about 80% of the carbon emissions of the entire transportation sector. The reduction of emissions in the transportation sector is of great significance to the domestic 3060 policy1. As the primary means of land transportation, fuel-consuming vehicles have become one of the primary sources of greenhouse gases. Therefore, the vigorous development of low-emission or even zero-carbon-emission electric vehicles (EVs) has become the core of the carbon reduction strategy in the transportation sector and a key focus area for achieving the carbon-neutral goal of energy savings and emission reduction.
China’s EV sales increased from 331,000 units in 2015 to 3,521,000 units in 2021, with a compound annual growth rate of 48.3%2. However, when an EV battery’s capacity decays to around 80%, it must be replaced (Zhu et al., 2020). At present, the average service life of an EV battery is about 5–8 years; it can be inferred that the batteries of early promoted EVs in China are entering their end-of-life periods. With the vigorous promotion of EVs in recent years, sales volumes have achieved high growth, and it is expected that existing batteries will be retired on a large scale in the next 2–3 years. The need for recycling of retired batteries is therefore becoming urgent (Zhao et al., 2022). However, large-scale retired EV batteries can cause environmental pollution and resource waste when improperly handled, even though EVs contribute to carbon emission reduction (Gu et al., 2021). Therefore, the recycling of EV batteries has become an urgent and contested topic, sparking extensive discussions from the academic and business communities.
This research is mainly motivated by the EV industry in China. The battery is one of the three core components of new EVs and accounts for about 40% of the entire cost of the vehicle. Data show that China’s EV batteries are expected to be retired by 2025, with nearly 8 million tons accumulated. How to deal with retired batteries has become an imminent development problem for the new EV industry. Under the “double carbon” target, battery recycling has become a new industrial windfall. Process innovation in EV batteries affects remanufacturing (Chai et al., 2021). With process innovation implemented by the supplier or manufacturer, Tesla uses a closed-loop battery recycling process that successfully recycles up to 92% of the battery’s raw materials, significantly reducing greenhouse gas emissions 3. Furthermore, with the rapid development of information technology, Internet-based online channels have been established that allow recycling companies to buy used products from third parties and repurchase them directly through these channels (Matsui, 2022). In addition to their differences in recycling channels, manufacturer, retailer, and third-party recycling processes are also considered in the reverse recycling channel (Zheng et al., 2021). Manufacturers sell batteries to end consumers through retailers at 4S stores. Moreover, used batteries for recycling can be collected directly from manufacturers or retailers and then centrally resold to manufacturers because retailers are closer to consumers. Hence, this process has the advantage of recycling (Sun et al., 2022). EV batteries are generally eligible for recycling when their power capacity drops to 70%–80%, and those with high-quality classifications can be secondarily used through quality and safety inspections in advance of remanufacturing; government subsidies are usually awarded to encourage the secondary use of batteries (Gu et al., 2021). In a two-period, closed-loop supply chain (CLSC) with remanufacturing, manufacturers set prices for new products in the first period, then collect used products for remanufacture and set the prices for both products in the second period (Tang et al., 2022). However, if the retired batteries are not properly collected and disposed of, they not only pollute the natural environment but also represent a huge waste of resources. Therefore, although the recycling of EV batteries is beneficial to sustainable development, their recycling and remanufacturing also raise some new problems.
Several studies have focused on the area of the CLSC, which combines environmental considerations with traditional supply-chain network design through the collection of used products and associated activities (Ghahremani Nahr et al., 2020). Unlike conventional supply chains, CLSCs include recycling and remanufacturing; product recycling is a key component of their sustainable development strategies. Bui et al. (2021) published a data-driven literature review of sustainable supply-chain management trends toward ambidexterity and disruption. Most of the existing research tends to focus on selecting channels. Zhao and Mu (2021) established a two-period CLSC model with single and double sales channels. Fathollahi-Fard et al. (2021) presented the first CLSC network design for a dual-channel, multi-product, multi-cycle approach under uncertainty in the tire industry. Genc and De Giovanni (2017) studied the influence of sales competition in positive and reverse channels and showed the effect of eliminating double marginalization on market results and on the game between enterprises at supply chain nodes. Much existing research and analysis exists on the price reference effect of the dynamic pricing strategy of the CLSC. For example, Asghari et al. (2022a) focused on pricing and advertising decisions in a CLSC network. They developed an advertising planning strategy that considers different elasticity effects. Wang et al. (2018) formed a two-period CLSC for manufacturers and recyclers and discussed the influence of government incentives and punishment mechanisms on the manufacturer. Ramani and De Giovanni (2017) introduced an advertising strategy through which they found manufacturers to supplement their pricing strategies and actively stimulate demand for both new and old products. Unlike the above study, our model integrates the forward and reverse periods of nodal supply-chain enterprises and discusses the influence of consumer utility and recycling factors on the profits of their two-period CLSCs. In this research, we focus on a two-stage, CLSC pricing strategy for batteries. Although some studies have discussed recycling channels or capital constraints (Ding and Wan, 2020; Ji et al., 2022), issues with combining the preference rate of remanufactured products with the recycling rate for a two-stage CLSC decision remain unclear. Consumers choose to purchase in the first or second period. Depending on the utility level, some of the new products sold in the first period are recycled and remanufactured at the end of the period, and the latest and remanufactured products in the second period have a competitive relationship with the products from the first period. These characteristics mean that our study has an original theoretical contribution.
In industry practice, battery recycling is a social and environmental issue that must be solved. It is indispensable in promoting the sustainable development of the renewable-energy vehicle industry. According to statistics from the China Automotive Battery Industry Innovation Alliance, the level of batteries installed in vehicles in China has shown a trend of gradual improvement in recent years. As of November 2021, China’s monthly level of established vehicle batteries has reached 20.82 Gwh, a record high. After batteries are recycled, in principle, they are primarily utilized in other fields and continue to retain their energy storage value. However, due to certain technology and market problems, the gradient utilization is mostly in the initial and pilot stages. Generally, when a battery drops to 80% of its capacity, it enters the retirement stage for recycling and direct disassembly for remanufacturing4. In December 2021, the number of “whitelist” enterprises engaged in the battery recycling business expanded to 475. The introduction of industry policies and regulatory systems has paved the way for the peaceful development of high-quality enterprises engaged in the battery recycling business. The battery recycling industry covers a wide area and has a long industrial chain. Relevant policies encourage enterprises to enter the battery recycling industry while putting forward higher capital strength requirements. In addition to the need for a sound system of laws and regulations, a comprehensive recycling system is also key to battery recycling. Battery recycling is still in the early stages of exploration. According to the implementation of the extended producer responsibility system, the car manufacturer is the main body responsible for the recycling of automotive batteries. In addition, most automotive battery recycling also includes the dealer within a more complete channel system. However, the consumers pursue utility maximization, the enterprises aim at profit maximization, and the capital-constrained retailer seeks the optimal financing strategy. Each may prefer a different sustainable strategy based on cost-benefit trade-offs.
Based on these challenges of the two-period CLSC for EV batteries described above, this study aims to explore pricing strategies for the two-period CLSC under different recycling models and to identify financial channel options for capital-constrained retailers. Specifically, we seek to answer the following questions:
1) How does recycling rate affect product demand in the first and second periods of the three models (MR, RRB, RRM)?
2) How do consumer preference rates for remanufactured products affect recycling channel selection for EV batteries and financing strategies for capital-constrained retailers?
3) When does the capital-constrained retailer participate in recycling, and does the optimal financing strategy influence both recycling rate and consumer preference rate for remanufactured products?
To answer these questions, this study built a two-period CLSC, with new products sold in the first period, followed by recycling and remanufacturing. The second period conducts competitive sales of new products and remanufactured products. Based on recycling subjects and capital-constrained retailer financing approaches, we analyzed three research scenarios: manufacturer recycling (MR), retailer recycling bank loans (RRB), and trade credit financing from the manufacturer (RRM). We compared and analyzed the three models to investigate their effects on recycling rate, on consumer preference rates for remanufactured products, and on the equilibrium outcomes. Optimal pricing and financing access are given.
The main contributions of this study are as follows. First, it explores a two-stage, CLSC pricing strategy, considering consumers’ preferences for remanufactured products and recycling rates. To the best of our knowledge, our work is the first attempt to combine the preference rate of remanufactured products with the recycling rate for a two-stage, CLSC decision analysis. Second, our study differs from the existing literature on recycling channels (Xie et al., 2018; He et al., 2019; Wei et al., 2019; Fathollahi-Fard et al., 2021; Zhao and Mu, 2021; Zheng et al., 2021; Matsui, 2022; Zhang et al., 2022), which consider manufacturer recycling, retailer recycling, and third-party recycling. Since third-party recycling is equivalent to outsourcing recycling operations, it does not affect the results of the decision analysis. Our focus on manufacturer and retailer recycling channel models better reflects the reality of developing a two-period CLSC. Finally, unlike existing studies, this paper investigates the choices of financing channels for capital-constrained retailers, as retailers face capital pressure when recycling. Based on previous SME bank financing strategies, this paper proposes that the retailer obtain trade credit financing from the manufacturer, which expands their financing channels.
The rest of this paper is organized as follows. Section 2 briefly reviews the related literature. Section 3 introduces the notation, assumptions, and model structure. Section 4 describes the selection of recycling models and financing in the retailer supply chain. Section 5 discusses the influence of each factor on the supply chain using an example. Section 6 concludes by providing management insights and discussing limitations and future research directions. All the proofs are detailed in the Supplementary Appendix.
2 Literature review
Our work explores financing options for capital-constrained retailers, the optimal choice of operation of supply chain firms, and demand analysis. Thus, the related literature can be divided into three main research streams: CLSC networks, recycling remanufacturing, and supply-chain finance.
2.1 Closed-loop supply chain networks
In general, CLSC network design involves collecting, sorting, repairing, refurbishing, or remanufacturing products and appropriately disposing of them. Tavana et al. (2022) considered an integrated multi-objective mixed-integer linear programming model to design sustainable CLSC networks. Diabat and Jebali (2021) addressed the problem of deterministic multi-product and multi-period CLSC network designs for durable products, considering take-back legislation. To address efficiency issues in a sustainable CLSC networks, Moheb-Alizadeh et al. (2021) developed a stochastic, integrated, multi-objective, mixed-integer, nonlinear programming model, in which sustainability outcomes, as well as the efficiency of facility resource utilization, are considered in the design of a sustainable supply chain network. Lotfi et al. (2021) explored a robust, risk-aware, resilient, and sustainable CLSC network design to tackle demand fluctuation in situations such as the COVID-19 pandemic. Because models proposed for supply chain network design are complex and include numerous parameters, researchers often struggle to select an appropriate multi-objective approach for solving complex supply chain network design problems. Khorshidvand et al. (2021) proposed a new nonlinear programming model based on the sensitivity of the return rate to green quality and the customers’ maximum tolerance while demands are uncertain. Golpîra and Javanmardan (2021, 2022) formulated a risk-based, robust mixed-integer linear program using a scenario-based conditional value-at-risk to address demand uncertainty. In addition, the decision system is constructed based on the relationships between upstream and downstream companies in a CLSC, such as centralized and decentralized decision models. Zhao et al. (2022) studied optimal pricing strategies for EV batteries in decentralized and centralized decision-making. Asghari et al. (2022b) examined a mathematical model of the decentralized model and all possible coalition forms. By analyzing and comparing the optimal decisions in decentralized and centralized cases, Zhao et al. (2022) found that the CLSC cannot achieve coordination. Establishing an effective recycling system for spent batteries is a critical task. Zhang et al. (2022) investigated the recycling mode selection and the carbon abatement decision in a CLSC of EV batteries under the carbon cap-and-trade policy. Zhao and Ma (2022) constructed a three-party game supply chain model to analyze the impact of the external environment on the supply chain and on a new coordination contract.
2.2 Recycling and remanufacturing
As consumers become more aware of environmental protection, the importance of recycling and remanufacturing used products has become increasingly important and has reached a social consensus (Guo et al., 2019). Remanufacturing, an environmentally friendly production method, is a series of processes that re-commercialize used products and parts as new products (Lee et al., 2017). In addition, Xie et al. (2018) proposed that supply-chain operation strategies consider different recycling models and patent licensing under government subsidies, analyzing various actors’ differences and benefits. Salehi-Amiri et al. (2021) developed new mixed-integer linear programming for CLSC networks, taking forward and reverse flow premises into account to meet the needs of different markets. Hazen et al. (2017) stated that the main reason remanufacturing does not reach its full potential is the consumer’s negative perception of the quality of the remanufactured product. However, we also found a common problem in the literature on reverse logistics inventory models, namely that there are two extremes of inventory strategies: “dispose of all” and “recycle all” (El Saadany et al., 2013). Yang et al. (2020) conducted an in-depth analysis of recycling mode choices for a remanufacturing supply chain, under total volume constraints, to show that remanufacturing can effectively increase the level of carbon reduction and improve the profits of the manufacturer and the retailer. When faced with multiple recycling channels for second-hand products, consumers may choose online recycling services provided by third-party platforms for convenience (He et al., 2019). By analyzing the performance of a two-period remanufacturing supply chain with dual recycling channels, Wei et al. (2019) found that dual-collecting competition significantly impacts the supply chain.
2.3 Supply-chain finance
Supply-chain finance is becoming more prominent in practice, attracting more and more the attention of researchers. Dekkers et al. (2020) evaluated the supply chain and financial integration theory concepts of agency theory, network theory, transaction cost economics, and social exchange theory as the theoretical framework of the supply-chain financial phenomenon. Due to banks’ strict risk controls and low credit ratings, small and medium enterprises often face challenges in obtaining bank financing. Many studies have confirmed that supply-chain financing benefits supply-chain enterprises and medium-sized enterprises in the supply chain. In recent years, supply-chain finance has become an effective way to alleviate the financing difficulties of small- and medium-sized enterprises by utilizing the integrity of the supply chain and relying on core enterprises to promote their financing (Huang et al., 2020). In studying the misunderstanding of supply-chain financing and its stabilizing effect, Zhang et al. (2019) found that supply-chain financing is effective and has no impact on enterprises’ capital performance and inventory management efficiency. Xiao et al. (2017) analyzed coordination needs in the contract coordination of capital-constrained supply chains and designed a new revenue-sharing contract to coordinate the supply chain. In addition, there is extensive literature on innovation in the supply-chain finance model (Huang et al., 2019; Qin et al., 2020; Yoo et al., 2021). The integration of optimized financing strategies enhances the resilience of the supply chain. For example, Ji et al. (2022) found that a hybrid credit model (including green credit financing from banks and partial early repayment from retailers) could ease the financing pressure on capital-constrained suppliers. Mondal and Giri (2022) found that introducing cost sharing and revenue sharing under cost-sharing contracts could increase the level of greening and the execution of the supply chain and that government subsidies could effectively increase sales by increasing the level of product greening. Recently, some literature has examined capital-constrained supply chains under supply uncertainty (Li et al., 2017; Ding and Wan, 2020). At the same time, some studies have compared loans within the supply chain with bank financing, highlighting the superiority of funding within the supply chain. Wetzel and Hofmann (2019) analyzed the higher profit maximization level of leading supply-chain partners with capital constraints and differentiated payment strategies for upstream and downstream supply-chain partners. Yan and Sun (2013) studied coordination issues in the capital-constrained supply chain, when bank financing and limited credit are available, and showed that appropriately limited credit financing schemes could achieve supply-chain coordination. In the case of uncertain supply, financing from upstream suppliers is necessary to promote suppliers’ production (Martin and Hofmann, 2019).
Table 1 shows a summary and comparison of this paper with related studies. The abovementioned scholars have studied problems in the two-period CLSC driven by external intervention, such as government incentive mechanisms, third-party and dual platforms, and the trade-offs of business models. However, our model integrates the forward and reverse periods of supply-chain enterprises and discusses the influences of consumer utility and recycling factors on the profits of supply-chain enterprises in the two-period CLSC. At the same time, while most research from the perspective of product recycling discusses recycling channels, little considers the combination of recycling and remanufacturing. Finally, this study primarily considers the construction of two financing modes (bank financing and trade-credit financing from the manufacturer) under the influence of capital constraint when the retailer undertakes the majority of recycling, and it conducts a comparative analysis of the effects of the two financing modes on the economic benefits of the supply chain.
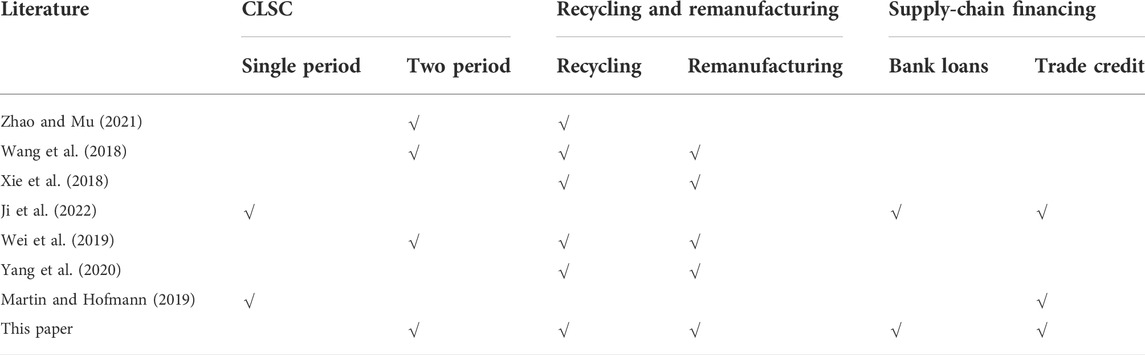
TABLE 1. Summary and comparison of this paper with related studies.
3 Model
This section considers the two-period CLSC for EV batteries and access to financing for the capital-constrained retailer. First, EV battery recycling is divided into two periods. New battery manufacturing and sales activities are carried out in the first period. In the second period, recycled batteries are remanufactured and sold competitively with the new products. Second, this section considers the problem of supply-chain economic benefits and capital constraints. There are three research scenarios: manufacturer recycling (MR), retailer recycling bank loans (RRBs), and retailer-recycling trade credit financing from the manufacturer (RRM). Finally, we develop these models using the Stackelberg game, in which the manufacturer is the leader, and the retailer is the follower. The model structure is shown in Figure 1.
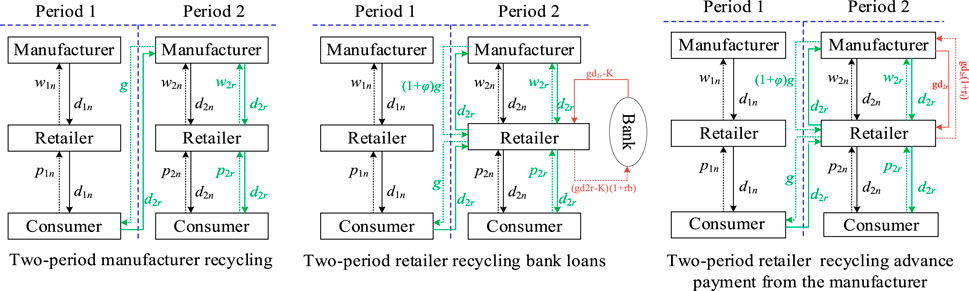
FIGURE 1. Structure diagram of the two-period CLSC.
3.1 Symbols and descriptions
This paper constructs a two-period decision-making model for the CLSC. In the first period, the manufacturer uses new materials to produce new products. The total cost of making a new product is
Assuming a market size of 1, the utility of the first consumer buying the new product is
Based on the analysis above, the demand for the second period of remanufactured products is
We specifically summarize the model parameters and decision variables in Table 2 We denote player i’s profit as
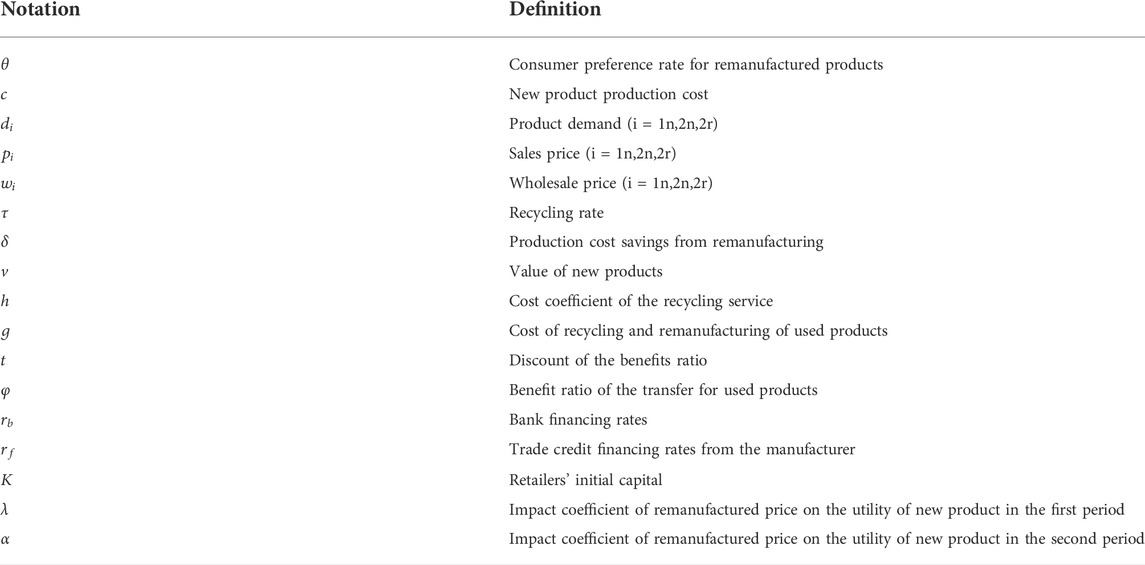
TABLE 2. Summary of notations.
3.2 Structure of the model
In this subsection, we primarily discuss the two recycling models, manufacturer and retailer recycling, and compare the effects of the two models on the supply chain (manufacturer and retailer) profits. The model structure is shown in Figure 1.
Profit function of the first period:
where
Profit function of the second period:
When the manufacturer conducts the recycling, the manufacturer’s profit in the second stage can be expressed as:
When a retailer carries out the recycling, the retailer’s profit in the second period can be expressed as:
where
4 Models and decisions
In each of the two periods, the manufacturer is the leader, and the retailer is the follower. In other words, the decision can be divided into four periods; the decision sequence is shown in Figure 2 For practical and modeling purposes, this paper made the assumptions that 1) the retailer and manufacturer are neutral and rational, and both want to maximize their expected profits, and 2) there is no information asymmetry between supply-chain agents (manufacturer and retailer).
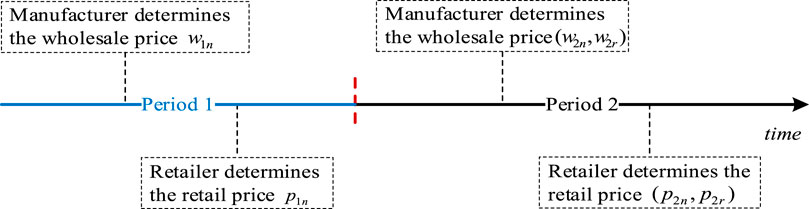
FIGURE 2. Decision sequence diagram.
4.1 Manufacturer recycling
Manufacturer recycling (MR) earns a portion of the profit by providing recycled products through recycling and remanufacturing activities. Here only the retailer plays the role of sales in the sales process to obtain sales profit.
The following formula can express the profit function of the manufacturer and retailer.
The first period:
The second period:
Lemma 1. In the MR model, there is a unique equilibrium. The equilibrium results are as follows:
This study does not consider the influence of uncertain factors introduced by the sales and remanufacturing process. Therefore, the sales volume of the second period of recycled products is taken as the demand of consumers, and the following expression can be obtained through calculation:
As game leader, the manufacturer sets the wholesale price of the second period of new products and recycled products
According to the market-clearing mechanism, we can obtain the equilibrium selling price set by the retailer
4.2 Retailer recycling
In retailer recycling, the retailer carries out the first period of the new product sales, the second period of new product sales, and the second period of recycling and sales activities. The manufacturer produces the first and second periods of products and conducts the remanufacturing activities of recycled products. In the retailer recycling process, the cost to the retailer of reclaiming the first-period product from the consumer and sending it to the manufacturer for remanufacturing is
4.3 Bank financing
Retailer recycling bank loans (RRBs), assuming that there is no trade credit financing from the manufacturer and that the retailer has certain fixed available funds
Based on the above description, it is possible to obtain the second-period profit of the manufacturer and the retailer, which can be expressed as follows.
Lemma 2. In the RRB mode, there is a unique balance. The equilibrium results are as follows:
Based on the above sales price of the second period of products, the following expression of the demand for the second period of new products and remanufactured products
Therefore, the wholesale price can be obtained by substituting the above demand expression with the manufacturer expression
As in the MR model (4.1), the equilibrium results are summarized as Lemma 2.
4.4 Manufacturer financing
With retailer recycling trade credit financing from the manufacturer (RRM), assuming that a bank loan is not available and the retailer’s own capital is insufficient to meet its second period of recycling products, it is bound to limit how much it can recycle, as this affects sales and revenue for the retailer and manufacturer. As a result, the manufacturer may be willing to provide trade credit financing to the retailer to support recycling. But when the manufacturer decides to pay in advance, it requests a discount
The price at which the retailer recycles the product sold first to the manufacturer for remanufacturing is:
Thus, bringing the parameters into their expression yields the following manufacturer retailer profits:
Lemma 3. In the RRM model, there is a unique equilibrium. The equilibrium results are as follows:
This study does not consider the impact of possible uncertainties in the sales and remanufacturing process. Therefore, the sales volume of recycled products in the second period is taken as the demand of consumers, and the following expression can be obtained through calculation:
As leader of the game, the manufacturer sets the wholesale price of new products and recycled products in the second period
Similarly, the equilibrium results are summarized as Lemma 3.
4.5 Properties analysis
Proposition 1. This paper focuses on product demand analysis and supply-chain enterprise model selection. With the increase in the recycling rate of remanufactured products, the demand for remanufactured products increases with different growth trends. Its mathematics can be expressed as
Proposition 2. As the consumer preference rate for remanufactured products
Proposition 3. The manufacturer’s two-period profit decreases with increasing
Proposition 4. With increasing recycling,
5 Numerical study
In this section, numerical analysis is implemented through research and investigation of Tesla and Contemporary Amperex Technology Co. Limited (CATL), related public data such as wind, and reports on battery recycling6. The section follows the usual assumptions of several existing studies [14, 24, 32]. It then analyzes the influences of parameters on the equilibrium results, compares and analyzes optimal strategies under the three models, and explores model selection under multiple factors. To ensure more realistic data analysis results, this study set the following parameters. For simplicity, we normalized the data,
5.1 Demand analysis and pricing decision
This section demonstrates the impacts of consumer preference rates for remanufactured products, recycling and remanufacturing costs, and used battery recycling rates on market demand and manufacturer profits, which influence manufacturers’ recycling mode choices.
Product recycling rate has a positive impact on the first period of products. As the recycling rate increases, the demand for the first period of products also increases. This finding is consistent with Figure 3. The reason is that the increased recycling rate mainly depends on the consumer preference rate for remanufactured products, thus increasing the consumer’s desire to buy during the first-product sales period. The recycling of new EV batteries after declining user utilization or declining product performance reduces the risk of purchasing the first period of the product for consumers and promotes user utility, thereby increasing consumer demand for the product. Therefore, an increase in the battery recycling rate can effectively improve the need for the first period of products and promote the economic benefits of new EV battery enterprises while reducing the cost of use for consumers.
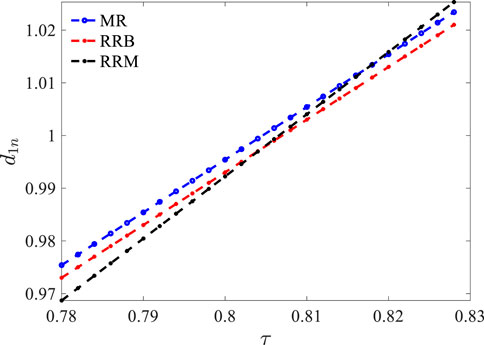
FIGURE 3. Impact of product recycling rate on product demand of the first period.
When the consumer preference rate for remanufactured products increases, the demand for new and remanufactured products in the second period shows different trends under the three models (MR, RRB, and RRM). The need for new products decreases in the second period, and conversely, the demand for remanufactured products increases in the second period (see Figure 4).
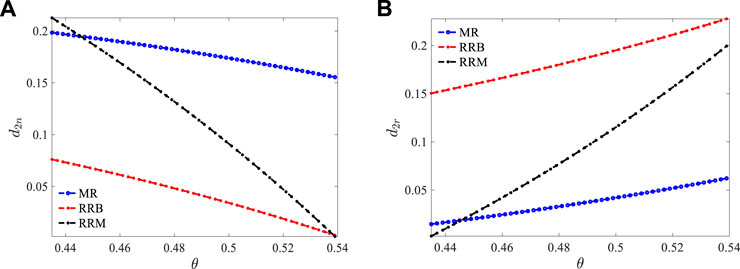
FIGURE 4. Impact of consumer preference rate for remanufactured products on demand. (A) Impact of preference rates on demand for new products in the second period. (B) Impact of preference rates on demand for remanufactured products in the second period.
As
The above provides a profit comparison between manufacturer and retailer under three models. The results show that the manufacturer can maximize profits under the retailer’s bank loan collection model. However, for retailers, not participating in recycling can maximize profits (see Figure 5). Therefore, as the dominant supply chain manufacturer, the manufacturer will inevitably choose to increase the production of the second period of remanufactured products and reduce the production, research, and development of the second period of new products to improve its economic benefits and reduce its risk rate. For this reason, the manufacturer needs to invest a large amount of money in producing recycled products. Hence, they are more willing to entrust recycling activities to retailers and to encourage retailers to borrow money from banks. The profit curve for the retailer is shown in Figure 5(d). Under the influence of the cost of recycling and remanufacturing used products, the profit curve is opposite that of the manufacturer when comparing the three modes, but the profit curve trend is unchanged. Thus, retailers and manufacturers have different optimal model choices.
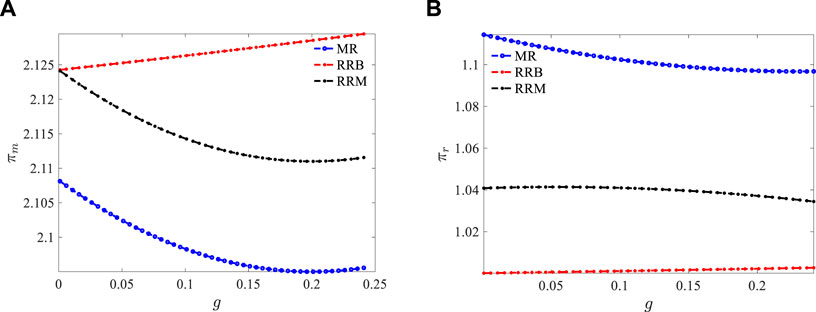
FIGURE 5. Impact of recycling costs on profits under the three models. (A) The impact of recovery costs on manufacturers’ profits. (B) The impact of recovery costs on retailers’ profits
5.2 Selection of retailer model
In this summary, consider the influence of recycling
It is important to note that the recycling rate of batteries for new EVs and the rate of consumer preference for the valuation of remanufactured products influence retailers’ choice of model. However, the cost of recycling and remanufacturing used products does not influence retailers’ choices. As shown in Figure 6, when both
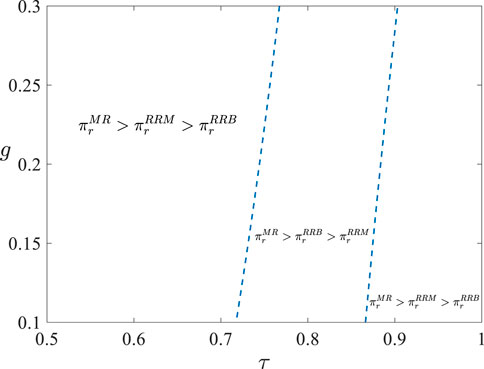
FIGURE 6. Impact of recycling rate and recycling cost on the retailer’s profit.
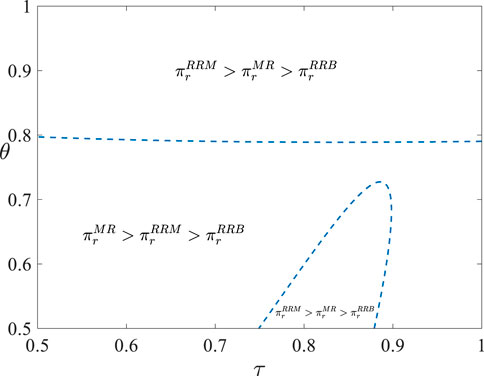
FIGURE 7. Impact of recycling rate and consumer preference rate for remanufactured products on the retailer’s profit.
The reasons are as follows: first, the recycling rate is high, and the retailer can obtain high economic benefits from the recycling process only by reverse selling to the manufacturer. However, when consumers have a low preference rate for the remanufactured products, the sales volume of remanufactured products is affected, thus affecting the retailer’s profits in the sales link. Therefore, for the retailer, when
Based on the analysis in this section, our research finds that recycling rate affects the demand for the second period of the product and plays a specific role in promoting the demand for products of the first period. The need for products of the first and second periods plays a role in mutual promotion via the recycling rate. When consumers have a low preference rate for the valuation of remanufactured products, manufacturers do not participate in recycling. They are willing to entrust the retailer to complete the recycling activities, and it is most beneficial to the manufacturer for the retailer to borrow money from banks. In addition, if the recycling rate is high and consumers have a relatively low preference rate for remanufactured product valuation, or if consumers have a very high preference rate for remanufactured product valuation, the retailer will choose a retailer to recycle the manufacturer’s prepayment financing. With the combination of recycling rate and the cost of recycling and remanufacturing used products, bank loan financing is optimal for capital-constrained retailer recycling when the recycling rate is high (
6 Conclusion
The wide application of EVs has promoted the development of transportation modes. However, recycling EV batteries is an urgent problem to be solved by EV enterprises. This study uses consumer preference rates for the second period of remanufactured products and the impact of cell recycling on the supply chain of EVs as critical factors. It establishes an analytical framework composed of manufacturer and retailer to examine the manufacturer’s pricing decisions and the retailer’s optimal model choice. The supply chain’s demand analysis and model selection are analyzed by equilibrium solutions under the MR, RRB, and RRM models.
Based on our model analysis and numerical results, this study has the following theoretical and management implications: the recycling rate can effectively incentivize the demand for new products in the first period. For any remanufactured product’s recycling cost, the manufacturer’s profit is most significant in the retailer recycling bank financing model, and the retailer’s profit is most effective in the manufacturer recycling model. As the consumer preference rate for remanufactured products increases, the demand for new products in the second stage decreases while the demand for remanufactured products increases. The RRM model gives the most significant profit to the retailer when the preference rate is substantial or when the preference rate is low with a moderate recycling rate.
This study has some limitations, which provide potential directions for future research. Firstly, for the simplicity of the model and ease of analysis, this paper only considers the impacts of consumer preference rate and recycling rate for remanufactured products on the pricing decision of EV batteries; the quality of recycled products and ladder processing are also important issues worthy of study. Secondly, this paper extends the single-stage CLSC to construct a two-stage CLSC, a certain innovation as far as we know. However, ours is still a static game model, and a multi-stage dynamic optimization model is also important for research to explore. Finally, while retailers are mostly SMEs, and thus suffers from capital constraints when starting recycling businesses, manufacturers may also face capital constraints when facing shocks such as the COVID-19 epidemic and economic recessions. The issue of multiple capital-constrained subjects and multiple financing channels is therefore also an important future research direction.
Data availability statement
The original contributions presented in the study are included in the article/Supplementary Material. Further inquiries can be directed to the corresponding author.
Author contributions
Conceptualization, WZ and TZ; methodology, WZ; software, TZ; validation, WZ and TZ; writing—original draft preparation, TZ; writing—review and editing, WZ and TZ; supervision, WZ; funding acquisition, WZ. All authors have read and agreed to the published version of the manuscript.
Funding
This research was funded by Ministry of Education of Humanities and Social Science Project (No. Z20208023), China Postdoctoral Science Foundation (No. 2022M710811).
Acknowledgments
The authors thank the editor and anonymous reviewers for their numerous constructive comments and encouragement that significantly improved our paper.
Conflict of interest
The authors declare that the research was conducted in the absence of any commercial or financial relationships that could be construed as a potential conflict of interest.
Publisher’s note
All claims expressed in this article are solely those of the authors and do not necessarily represent those of their affiliated organizations, or those of the publisher, the editors, and the reviewers. Any product that may be evaluated in this article, or claim that may be made by its manufacturer, is not guaranteed or endorsed by the publisher.
Supplementary material
The Supplementary Material for this article can be found online at: https://www.frontiersin.org/articles/10.3389/fenvs.2022.996009/full#supplementary-material
Footnotes
1Eastern Jincheng Industry Research: The New Track of New Energy Vehicles under the “3060” Double Carbon Target (October 26, 2021)
2Dongguan Securities-Lithium Battery Industry Battery Recycling Special Report: The Imperative, Blue Ocean Opportunities (March 31, 2022)
3https://insideevs.com/news/525965/tesla-battery-recycling-no-waste/
4https://pdf.dfcfw.com/pdf/H3_AP202109061514548345_1.pdf
5Workers’ Daily (May 17, 2022, 07 edition)
6https://pdf.dfcfw.com/pdf/H3_AP202103251476026177_1.pdf?1616667917000.pdf
References
An, S., Li, B., Song, D., and Chen, X. (2021). Green credit financing versus trade credit financing in a supply chain with carbon emission limits. Eur. J. Operational Res. 292 (1), 125–142. doi:10.1016/j.ejor.2020.10.025
Asghari, M., Afshari, H., Mirzapour Al-e-hashem, S. M. J., Fathollahi-Fard, A. M., and Dulebenets, M. A. (2022a). Pricing and advertising decisions in a direct-sales CLSC. Comput. Industrial Eng. 171, 108439. doi:10.1016/j.cie.2022.108439
Asghari, T., Taleizadeh, A. A., Jolai, F., and Moshtagh, M. S. (2022b). Cooperative game for coordination of a green CLSC. J. Clean. Prod. 363, 132371. doi:10.1016/j.jclepro.2022.132371
Bui, T. D., Tsai, F. M., Tseng, M. L., Tan, R. R., Yu, K. D. S., and Lim, M. K. (2021). Sustainable supply chain management towards disruption and organizational ambidexterity: A data driven analysis. Sustain. Prod. Consum. 26, 373–410. doi:10.1016/j.spc.2020.09.017
Chai, J., Qian, Z., Wang, F., and Zhu, J. (2021). Process innovation for green product in a closed loop supply chain with remanufacturing. Ann. Oper. Res., 1–25. doi:10.1007/s10479-020-03888-y
Chen, X., and Lin, B. (2021). Towards carbon neutrality by implementing carbon emissions trading scheme: Policy evaluation in China. Energy Policy 157, 112510. doi:10.1016/j.enpol.2021.112510
Dekkers, R., de Boer, R., Gelsomino, L. M., de Goeij, C., Steeman, M., Zhou, Q., et al. (2020). Evaluating theoretical conceptualisations for supply chain and finance integration: A scottish focus group. Int. J. Prod. Econ. 220, 107451. doi:10.1016/j.ijpe.2019.07.024
Diabat, A., and Jebali, A. (2021). Multi-product and multi-period closed loop supply chain network design under take-back legislation. Int. J. Prod. Econ. 231, 107879. doi:10.1016/j.ijpe.2020.107879
Ding, W., and Wan, G. (2020). Financing and coordinating the supply chain with a capital-constrained supplier under yield uncertainty. Int. J. Prod. Econ. 230, 107813. doi:10.1016/j.ijpe.2020.107813
El Saadany, A. M., Jaber, M. Y., and Bonney, M. (2013). How many times to remanufacture? Int. J. Prod. Econ. 143 (2), 598–604. doi:10.1016/j.ijpe.2011.11.017
Fathollahi-Fard, A. M., Dulebenets, M. A., Hajiaghaei–Keshteli, M., Tavakkoli-Moghaddam, R., Safaeian, M., and Mirzahosseinian, H. (2021). Two hybrid meta-heuristic algorithms for a dual-channel CLSC network design problem in the tire industry under uncertainty. Adv. Eng. Inf. 50, 101418. doi:10.1016/j.aei.2021.101418
Genc, T. S., and De Giovanni, P. (2017). Trade-in and save: A Two-period CLSC game with price and technology dependent returns. Int. J. Prod. Econ. 183, 514–527. doi:10.1016/j.ijpe.2016.07.012
Ghahremani Nahr, J., Pasandideh, S. H. R., and Niaki, S. T. A. (2020). A robust optimization approach for multi-objective, multi-product, multi-period, closed-loop green supply chain network designs under uncertainty and discount. J. industrial Prod. Eng. 37 (1), 1–22. doi:10.1080/21681015.2017.1421591
Golpîra, H., and Javanmardan, A. (2021). Decentralized decision system for CLSC: A bi-level multi-objective risk-based robust optimization approach. Comput. Chem. Eng. 154, 107472. doi:10.1016/j.compchemeng.2021.107472
Golpîra, H., and Javanmardan, A. (2022). Robust optimization of sustainable CLSC considering carbon emission schemes. Sustain. Prod. Consum. 30, 640–656. doi:10.1016/j.spc.2021.12.028
Gu, X., Zhou, L., Huang, H., Shi, X., and Ieromonachou, P. (2021). EV battery secondary use under government subsidy: A CLSC perspective. Int. J. Prod. Econ. 234, 108035. doi:10.1016/j.ijpe.2021.108035
Guo, J., He, L., and Gen, M. (2019). Optimal strategies for the CLSC with the consideration of supply disruption and subsidy policy. Comput. Industrial Eng. 128, 886–893. doi:10.1016/j.cie.2018.10.029
Hazen, B. T., Boone, C. A., Wang, Y., and Khor, K. S. (2017). Perceived quality of remanufactured products: Construct and measure development. J. Clean. Prod. 142, 716–726. doi:10.1016/j.jclepro.2016.05.099
He, Q., Wang, N., Yang, Z., He, Z., and Jiang, B. (2019). Competitive collection under channel inconvenience in CLSC. Eur. J. Operational Res. 275 (1), 155–166. doi:10.1016/j.ejor.2018.11.034
Huang, J., Yang, W., and Tu, Y. (2020). Financing mode decision in a supply chain with financial constraint. Int. J. Prod. Econ. 220, 107441. doi:10.1016/j.ijpe.2019.07.014
Huang, S., Fan, Z. P., and Wang, X. (2019). Optimal operational strategies of supply chain under financing service by a 3PL firm. Int. J. Prod. Res. 57 (11), 3405–3420. doi:10.1080/00207543.2018.1534017
Ji, J., Tang, D., and Huang, J. (2022). Green credit financing and emission reduction decisions in a retailer-dominated supply chain with capital constraint. Sustainability 14 (17), 10553. doi:10.3390/su141710553
Khorshidvand, B., Soleimani, H., Sibdari, S., and Esfahani, M. M. S. (2021). A hybrid modeling approach for green and sustainable CLSC considering price, advertisement and uncertain demands. Comput. Industrial Eng. 157, 107326. doi:10.1016/j.cie.2021.107326
Lee, C. M., Woo, W. S., and Roh, Y. H. (2017). Remanufacturing: Trends and issues. Int. J. Precis. Eng. Manuf. -Green. Tech. 4 (1), 113–125. doi:10.1007/s40684-017-0015-0
Li, J. C., Zhou, Y. W., and Huang, W. (2017). Production and procurement strategies for seasonal product supply chain under yield uncertainty with commitment-option contracts. Int. J. Prod. Econ. 183, 208–222. doi:10.1016/j.ijpe.2016.10.019
Lotfi, R., Sheikhi, Z., Amra, M., AliBakhshi, M., and Weber, G. W. (2021). Robust optimization of risk-aware, resilient and sustainable CLSC network design with Lagrange relaxation and fix-and-optimize. Int. J. Logist. Res. Appl., 1–41. doi:10.1080/13675567.2021.2017418
Martin, J., and Hofmann, E. (2019). Towards a framework for supply-chain finance for the supply side. J. Purch. Supply Manag. 25 (2), 157–171. doi:10.1016/j.pursup.2018.08.004
Matsui, K. (2022). Optimal timing of acquisition price announcement for used products in a dual-recycling channel reverse supply chain. Eur. J. Operational Res. 300 (2), 615–632. doi:10.1016/j.ejor.2021.08.010
Moheb-Alizadeh, H., Handfield, R., and Warsing, D. (2021). Efficient and sustainable CLSC network design: A two-stage stochastic formulation with a hybrid solution methodology. J. Clean. Prod. 308, 127323. doi:10.1016/j.jclepro.2021.127323
Mondal, C., and Giri, B. C. (2022). Investigating strategies of a green CLSC for substitutable products under government subsidy. J. Industrial Prod. Eng. 39 (4), 253–276. doi:10.1080/21681015.2021.1974962
Qin, J., Han, Y., Wei, G., and Xia, L. (2020). The value of advance payment financing to carbon emission reduction and production in a supply chain with game theory analysis. Int. J. Prod. Res. 58 (1), 200–219. doi:10.1080/00207543.2019.1671626
Ramani, V., and De Giovanni, P. (2017). A two-period model of product cannibalization in an atypical CLSC with endogenous returns: The case of DellReconnect. Eur. J. Operational Res. 262 (3), 1009–1027. doi:10.1016/j.ejor.2017.03.080
Salehi-Amiri, A., Zahedi, A., Akbapour, N., and Hajiaghaei-Keshteli, M. (2021). Designing a sustainable CLSC network for walnut industry. Renew. Sustain. Energy Rev. 141, 110821. doi:10.1016/j.rser.2021.110821
Sun, Q., Chen, H., Long, R., Li, Q., and Huang, H. (2022). Comparative evaluation for recycling waste batteries with different collection modes based on Stackelberg game. J. Environ. Manag. 312, 114892. doi:10.1016/j.jenvman.2022.114892
Tang, J., Li, B. Y., Li, K. W., Liu, Z., and Huang, J. (2020). Pricing and warranty decisions in a two-period CLSC. Int. J. Prod. Res. 58 (6), 1–17. doi:10.1080/00207543.2019.1683246
Tavana, M., Kian, H., Nasr, A. K., Govindan, K., and Mina, H. (2022). A comprehensive framework for sustainable CLSC network design. J. Clean. Prod. 332, 129777. doi:10.1016/j.jclepro.2021.129777
Wang, W., Ding, J., and Sun, H. (2018). Reward-penalty mechanism for a two-period CLSC. J. Clean. Prod. 203, 898–917. doi:10.1016/j.jclepro.2018.08.211
Wang, Z., and Wu, Q. (2021). Carbon emission reduction and product collection decisions in the CLSC with cap-and-trade regulation. Int. J. Prod. Res. 59 (14), 4359–4383. doi:10.1080/00207543.2020.1762943
Wei, J., Wang, Y., Zhao, J., and Gonzalez, E. D. S. (2019). Analyzing the performance of a two-period remanufacturing supply chain with dual collecting channels. Comput. Industrial Eng. 135, 1188–1202. doi:10.1016/j.cie.2018.12.063
Wetzel, P., and Hofmann, E. (2019). Supply-chain finance, financial constraints and corporate performance: An explorative network analysis and future research agenda. Int. J. Prod. Econ. 216, 364–383. doi:10.1016/j.ijpe.2019.07.001
Xiao, S., Sethi, S. P., Liu, M., and Ma, S. (2017). Coordinating contracts for a financially constrained supply chain. Omega 72, 71–86. doi:10.1016/j.omega.2016.11.005
Xie, J., Zhang, W., Liang, L., Xia, Y., Yin, J., and Yang, G. (2018). The revenue and cost sharing contract of pricing and servicing policies in a dual-channel CLSC. J. Clean. Prod. 191, 361–383. doi:10.1016/j.jclepro.2018.04.223
Yan, N., and Sun, B. (2013). Coordinating loan strategies for supply-chain financing with limited credit. Or Spectr. 35 (4), 1039–1058. doi:10.1007/s00291-013-0329-4
Yang, L., Hu, Y., and Huang, L. (2020). Collecting mode selection in a remanufacturing supply chain under cap-and-trade regulation. Eur. J. Operational Res. 287 (2), 480–496. doi:10.1016/j.ejor.2020.04.006
Yoo, S. H., Choi, T. Y., and Kim, D. (2021). Integrating sourcing and financing strategies in multi-tier supply chain management. Int. J. Prod. Econ. 234, 108039. doi:10.1016/j.ijpe.2021.108039
Zhang, C., Tian, Y. X., and Han, M. H. (2022). Recycling mode selection and carbon emission reduction decisions for a multi-channel CLSC of EV battery under cap-and-trade policy. J. Clean. Prod. 375, 134060. doi:10.1016/j.jclepro.2022.134060
Zhang, T., Zhang, C. Y., and Pei, Q. (2019). Misconception of providing supply-chain finance: Its stabilising role. Int. J. Prod. Econ. 213, 175–184. doi:10.1016/j.ijpe.2019.03.008
Zhao, C., Wang, D., Younas, A., and Zhang, B. (2022). Coordination of CLSC considering loss-aversion and remanufactured products quality control. Ann. Oper. Res., 1–24. doi:10.1007/s10479-022-04619-1
Zhao, L., and Mu, Z. (2021). Channel strategies for the two-period CLSC with E-commerce. Mathematics 9 (11), 1271. doi:10.3390/math9111271
Zhao, S., and Ma, C. (2022). Research on the coordination of the battery echelon utilization supply chain considering recycling outsourcing. J. Clean. Prod. 358, 131922. doi:10.1016/j.jclepro.2022.131922
Zhao, X., Peng, B., Zheng, C., and Wan, A. (2022). CLSC pricing strategy for EV batteries recycling in China. Environ. Dev. Sustain. 24 (6), 7725–7752. doi:10.1007/s10668-021-01755-9
Zheng, B., Chu, J., and Jin, L. (2021). Recycling channel selection and coordination in dual sales channel CLSCs. Appl. Math. Model. 95, 484–502. doi:10.1016/j.apm.2021.02.022
Keywords: two-period, closed-loop supply chain, supply-chain financing, recycling and remanufacturing, mode selection
Citation: Zhang W and Zhang T (2022) Recycling channel selection and financing strategy for capital-constrained retailers in a two-period, closed-loop supply chain. Front. Environ. Sci. 10:996009. doi: 10.3389/fenvs.2022.996009
Received: 05 August 2022; Accepted: 30 September 2022;
Published: 21 October 2022.
Edited by:
Xu Tian, Shanghai Jiao Tong University, ChinaReviewed by:
Maxim A. Dulebenets, Florida Agricultural and Mechanical University, United StatesHêriş Golpîra, Islamic Azad University, Sanandaj Branch, Iran
Ming Lang Tseng, Asia University, Taiwan
Copyright © 2022 Zhang and Zhang. This is an open-access article distributed under the terms of the Creative Commons Attribution License (CC BY). The use, distribution or reproduction in other forums is permitted, provided the original author(s) and the copyright owner(s) are credited and that the original publication in this journal is cited, in accordance with accepted academic practice. No use, distribution or reproduction is permitted which does not comply with these terms.
*Correspondence: Weisi Zhang, d3N6aGFuZ0BzaG10dS5lZHUuY24=