 Yuan Li
 Kun Shi
 Yunlin Zhang2,3
 Guangwei Zhu
 Yulong Guo
- 1School of Tourism and Urban & Rural Planning, Zhejiang Gongshang University, Hangzhou, China
- 2Taihu Laboratory for Lake Ecosystem Research, State Key Laboratory of Lake Science and Environment, Nanjing Institute of Geography and Limnology, Chinese Academy of Sciences, Nanjing, China
- 3University of Chinese Academy of Sciences, Beijing, China
- 4College of Resources and Environmental Sciences, Henan Agricultural University, Zhengzhou, China
- 5Jiangsu Collaborative Innovation Center of Regional Modern Agriculture & Environmental Protection, Huaiyin Normal University, Huaian, China
Long-term lake surface water temperature (LSWT) products are valuable for understanding the responses of lake ecosystems to climate warming and for proposing suitable policies to protect lake ecosystems. Here, using Landsat satellite data and various in situ data, we documented 36 years (1986–2021) of spatiotemporal variations in LSWT in Lake Qiandaohu, a subtropical deep-water lake in China, and explored the potential driving factors of these variations. We validated the performances of the practical single-channel (PSC) algorithm, the generalized single-channel algorithm and the Landsat Level 2 land surface temperature product on Lake Qiandaohu with long-term in situ buoy data. Overall, the PSC algorithm had the best performance, with a mean absolute percent error (MAPE) of 7.5% and root mean square difference (RMSE) of 1.7°C. With 36 years of Landsat data and the PSC algorithm, the spatiotemporal variations in LSWT were constructed. The Landsat-derived 36-year mean LSWT in Lake Qiandaohu ranged from 18.2 to 23.1°C, with a mean value of 20.2°C. The northeast and southwest subsegments had the minimum (19.7°C) and maximum (20.6°C) mean LSWT values, respectively. The spatial variations in LSWT could be explained in part by the water depth. From 1986 to 2021, a significant warming trend was observed in Lake Qiandaohu, with a warming rate of 0.07°C/year. The warming rate of Lake Qiandaohu was faster than that of the local air temperature (warming rate = 0.04°C/year). The LSWT warming in Lake Qiandaohu can mainly be attributed to the warming air temperatures. Lake warming has increased the thermal stability in Lake Qiandaohu and has had negative impact on the lake ecosystem. Our work highlights the importance of using satellite data to understand the responses of lake ecosystems to climate change.
1 Introduction
The Lake surface water temperature (LSWT), a critical lake physical variable, is an indicator of climate change (Adrian et al., 2009; Woolway et al., 2020) and can provide insight into water quality (Yang et al., 2018), lake thermal structures (O'Reilly et al., 2003; Coats et al., 2006; Kraemer et al., 2015) and lake ecosystem processes (Verburg et al., 2003; Winslow et al., 2017). In the context of global warming, LSWTs have warmed in many lakes and reservoirs over the past several decades (Schneider and Hook, 2010; O'Reilly Catherine et al., 2015). For example, the summertime LSWT in Lake Superior increased by 2.5°C from 1979 to 2006 (Austin and Colman, 2007). Lake Baikal has experienced LSWT warming over the past 60 years and the LSWT has increased by 1.21°C since 1946 (Hampton et al., 2008). The LSWT in Lake Tahoe increased from1970 to 2002 at an average rate of 0.015°C/year (Coats et al., 2006). Lake warming may promote cyanobacterial growth (Huisman et al., 2018), deteriorate the water quality (Yang et al., 2018), increase the strength and duration of thermal stratification (Arhonditsis et al., 2004; Zhang Y. et al., 2014) and reduce the oxygen content in the water column (Elçi, 2008).
To understand the impacts of climate change on lakes, protect the water quality and propose effective lake management measures, it is crucial to accurately monitor LSWTs, characterize spatiotemporal LSWT variation, and identify the potential driving forces of LSWTs. In situ LSWT measurements mainly come from ship-based and buoy monitoring data, which can provide accurate LSWT data but tend to have spatial representative limitations. In addition, long-term historic in situ LSWT data are rare. Satellite-inferred LSWT data have the ability to retrospectively examine spatiotemporal variations in LSWT with fine spatial and temporal resolutions. Thus, LSWTs have been remotely estimated from different satellite data using various LSWT retrieval algorithms (Becker and Daw, 2005; Schneider et al., 2009; Yang K. et al., 2019; Liu et al., 2019; Najwa et al., 2019; Xie et al., 2022). Among the various satellite data available, Landsat-series data have advantages in long-term data availability and fine spatial resolutions. Thus, Landsat data are suitable for documenting long-term LSWT variations. Besides, the Landsat land surface temperature product derived from Landsat series data has provided by the United States Geological Survey (USGS) in recent years. The Landsat land surface products are widely used to monitoring physical environment and natural resources, and are considered as a useful land surface temperature product (Duan et al., 2021).
On the other hand, many LSWT remote estimating algorithms, including the radiative transfer equation (RTE) algorithm (Coll et al., 2012), the generalized single-channel (GSC) algorithm (Jiménez-Muñoz and Sobrino, 2003; Jimenez-Munoz et al., 2009), the practical single-channel (PSC) algorithm (Wang et al., 2019), the mono-window (MW) algorithm (Qin et al., 2001) and the split window (SW) algorithm (Jimenez-Munoz and Sobrino, 2008), have been widely used to extract LSWTs from satellite imagery (Debnath et al., 2018; Najwa et al., 2019; Vanhellemont, 2020). The RTE algorithm retrieves LSWTs from a single thermal infrared band using a radiative transfer model with inputs of atmospheric profiles. However, accurately estimating atmospheric profiles is difficult for certain study areas at specific times (Li et al., 2013). Similarly, the difficulty in using the MW algorithm is accurately estimating the atmospheric transmittance and mean atmospheric temperature (Sobrino et al., 2004). To reduce the dependency on atmospheric parameters, the SW algorithm was developed. The SW algorithm retrieves LSWTs from two thermal infrared bands and does not require that any atmospheric parameters are input. Unfortunately, the SW algorithm is not suited to Landsat-series data because 1) the Landsat 4, 5 and 7 satellites only have one thermal infrared band and 2) the thermal infrared band 11 in Landsat 8 is affected by stray light and is not recommended for LSWT retrievals (Montanaro et al., 2014). Compared to the RTE, MW and SW algorithms, the GSC and PSC algorithms are more practical for remotely estimating LSWTs (Wang et al., 2019). For the GSC and PSC algorithms, only one atmospheric parameter, the atmospheric water vapor content, is needed as an input, and this parameter can be easily obtained from various open-source products.
The long-term temporal LSWT variations and its influencing factors vary among different lakes (O'Reilly Catherine et al., 2015). Previous studies have focused mainly on midlatitude oligotrophic and eutrophic lakes (Coats et al., 2006; Austin and Colman, 2007; Hampton et al., 2008; Najwa et al., 2019). However, few studies have revealed the spatiotemporal variations in the LSWT and related factors in subtropical, oligotrophic-to-mesotrophic human-made lakes. Thus, it is necessary to explore the spatiotemporal variations in the LSWT and related influencing factors in subtropical, oligotrophic-to-mesotrophic human-made lakes. Lake Qiandaohu is a subtropical, oligotrophic-to-mesotrophic, artificial lake (Li et al., 2020). In addition to the flood control and hydropower generation functions provided by this lake, Lake Qiandaohu is an important drinking water source, fish-farming site and tourism attraction (Li et al., 2020). Thus, Lake Qiandaohu plays a crucial role in regional aquatic ecology protection and social and economic development. However, Lake Qiandaohu has encountered several aquatic environmental problems in recent years (Zhang Y. et al., 2014; Li et al., 2020). Given that the LSWT is a sentinel of lake ecosystems, it is important to investigate the spatiotemporal variations in the LSWT and in the related influencing factors in Lake Qiandaohu.
The aims of our study are to 1) evaluate the performances of the GSC algorithm, PSC algorithm and the Landsat land surface temperature product in retrieving LSWTs on Lake Qiandaohu; 2) retrospectively examine the spatiotemporal variations in LSWT from 1986 to 2021 with Landsat satellite data; 3) analyze the potential influencing factors of the spatiotemporal LSWT variations and 4) discuss the implications of LSWT variations on the thermal structure of the lake.
2 Data and methods
2.1 Study area
The largest artificial freshwater lake in East China (water area = 580 km2, water volume = 178.4 × 10⁸ m3), Lake Qiandaohu (118°35′E-119°15′E, 29°20′N-29°50′N), is deep, monomictic, and oligotrophic-to-mesotrophic lake that, as a centralized drinking water source, supplies drinking water to more than 15 million people (Figure 1) (Li et al., 2020). Lake Qiandaohu has many small tributaries and more than 1,000 small islands distributed throughout the lake. As an artificial lake built in 1959, Lake Qiandaohu contains three types of water zones, including the riverine zone, transition zone and lacustrine zone (Li et al., 2017). The riverine zone has three lake segments, including the northwest segment (NW), northeast segment (NE) and southwest segment (SW) (Figure 1). The transition zone and lacustrine zone are the central segment (C) and southeast segment (SE), respectively (Figure 1).
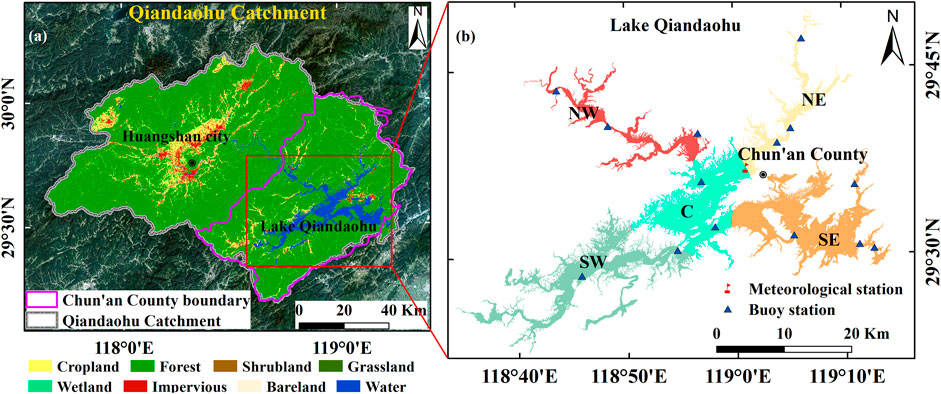
FIGURE 1. Location and land cover and land use types of the Qiandaohu catchment (A) and the spatial distributions of buoys and meteorological station in Lake Qiandaohu (B).
Over the past several decades, the climate and land use conditions in Lake Qiandaohu and its catchment have experienced significant changes (Li et al., 2020). The local air temperatures displayed an increasing trend from 1960 to 2016 at an increasing rate of 0.13°C/decade (Li et al., 2020). The Qiandaohu catchment has a basin area of 11452.5 km2, and approximately 80% of this area is covered by forests and grasslands (Li et al., 2020). The impervious land area in the Qiandaohu catchment has displayed a rapidly increasing trend over the past several decades (Li et al., 2020). Huangshan city, located in the upstream region of the Qiandaohu catchment, had a population of 148.85 × 10⁴ people and a gross domestic product (GDP) of 850.4 × 10² million Chinese yuan (CNY) in 2020 and is a famous tourism attraction. Chun’an County, where Lake Qiandaohu is located, had a population of 45.62 × 10⁴ people and a GDP of 240.62 × 10² CNY in 2020. Huangshan city and Chun’an County account for approximately 92% of the area of the Qiandaohu catchment and contribute more than 90% of the GDP of the Qiandaohu catchment.
2.2 In situ LSWT data
There are 14 buoys deployed in Lake Qiandaohu and these buoys cover the whole lake and different water types (Figure 1). At each buoy station, a YSI EXO2 7-channel multiparameter sonde (YSI Inc., Yellow Springs, OH) was equipped and used to measure the water temperature; the water temperature at a depth of 0.5 m below the water surface was used to validate various Landsat-derived LSWT products (Liu et al., 2015; Najwa et al., 2019). The temporal resolution of the water temperature measurements of the four buoys was 4 hours, and the measuring times were 00:00, 04:00, 08:00, 12:00, 16:00 and 20:00 every day. The other ten buoys measured the water temperature every half hour. LSWT data were collected from 1 February 2016, to 31 October 2020. Thus, the in situ LSWT data measured at 10:30 and 12:00 were considered quasi-synchronous LSWT data because the overpass time of the Landsat satellite over Lake Qiandaohu was approximately at 10:30 a.m. local time. A total of 220 in situ LSWT data were matched with cloud-free Landsat images.
2.3 Landsat series data collection and preprocessing
A 36-year Landsat dataset (1986–2021), including Landsat 5, 7 and 8 collection 1 Level 1 Tier 1 raw data, was collected to document the spatiotemporal variations in LSWT. A total of 1,061 Landsat images were obtained from Google Earth Engine (GEE). The spatial resolution of the thermal infrared band in Landsat series data is approximately 100 m, but these data were resampled herein to 30 m. Landsat Level 1 Tier 1 data are intercalibrated across different sensors and are suitable for long-term pixel-level analyses (Li et al., 2020). All the Landsat images were visually checked; 181 Landsat images were totally covered by clouds, and 880 valid Landsat images were used to remotely estimate the LSWTs. The temporal distribution of the utilized Landsat images is displayed in Supplementary Figure S1.
Three preprocessing procedures were conducted on the Landsat-series imageries, including cloud masking, radiometric calibration and water-land boundary masking. Pixels containing clouds or cloud shadows were masked with the Fmask algorithm (Zhu and Woodcock, 2012). The Landsat-series data was radiometrically calibrated with the GEE function ee. Algorithms.Landsat.calibratedRadiance. The retrieved LSWTs could exhibit relatively large uncertainties in the boundary region of Lake Qiandaohu due to the effect of mixed water-land pixels. Thus, one pixel at the water-land boundary was masked to reduce the uncertainties in the remote LSWT estimations (Li et al., 2022). The Landsat-series data preprocessing was performed in the GEE platform. Landsat 7 Enhanced Thematic Mapper Plus data affected by stripes were not used to retrieval LSWT to reduce uncertainties.
2.4 LSWT retrieval algorithms and landsat land surface temperature product
We selected the PSC algorithm (Wang et al., 2019), GSC algorithm (Jiménez-Muñoz and Sobrino, 2003; Jimenez-Munoz et al., 2009; Jiménez-Muñoz et al., 2014) and Landsat land surface temperature product to retrieve LSWTs and evaluate the performances of these algorithms over Lake Qiandaohu.
For the PSC algorithm, LSWTs were calculated using the following two equations:
where λ is the effective wavelength, B (LSWT) is the radiance of Planck corresponding to LSWT, c1 and c2 are 1.19104 × 10⁸ W. μm4•m−2•sr−1 and 1.43877 × 104 μm K., respectively, ε is the water surface emissivity with ε = 0.9926 (Vanhellemont, 2020), w is the atmospheric water vapor content and Lsen is the at-sensor radiance. In our study, λ is the effective wavelength of Landsat 5 Band 6, Landsat 7 Band 6 and Landsat 8 Band 10. The ai values (i = 0, 1, … , 7) corresponding to Landsat 5, 7 and 8 were taken from Wang et al. (2019).
For the GSC algorithm, LSWTs were calculated using the following four equations:
where λ is the effective wavelength, Lsen is the at-sensor radiance, Tsen is the at-sensor brightness temperature, ε is the water surface emissivity, c2 = 1.43877 × 104 μm K., K1 and K2 are two constant values obtained from the Landsat metadata files, and φi (i = 1, 2, 3) is an atmospheric function that can be modeled with the atmospheric water vapor content using a second-order polynomial. The equation used to calculate φi (i = 1, 2, 3) from the atmospheric water vapor content is displayed below:
where cij (i = 1, 2, 3; j = 1, 2, 3) are constant values taken from Jimenez-Munoz et al. (2009) and Jiménez-Muñoz et al. (2014) and w is the atmospheric water vapor content. Here, the atmospheric water vapor content data were obtained from the water vapor dataset provided in National Centers for Environmental Prediction/National Center for Atmospheric Research Reanalysis Data from the GEE platform. The values of λ and ε were same to that used in the PSC algorithm.
In recent years, the USGS has provided a Landsat land surface temperature product in the Landsat collection 2 level 2 Tier 1 data. These Landsat land surface temperature products have been validated in many regions around the world and have achieved well-accepted performances (Malakar et al., 2018; Duan et al., 2021). Landsat-based LSWT data were derived from the PSC algorithm, the GSC algorithm and the Landsat land surface temperature product in the GEE platform.
2.5 Auxiliary data
To analyze the potential factors influencing the long-term spatiotemporal variations in LSWT identified on Lake Qiandaohu, meteorological data, socioeconomic data and land-cover data were collected. Meteorological data measured at the Chun’an meteorological station (119°01′E, 29°37′N), including daily mean air temperature (°C), rainfall (mm), wind speed (m/s), air pressure (hPa), relative humidity (%) and sunshine duration (h) data, were collected from 1985 to 2021 and downloaded from the National Meteorological Information Center (http://data.cma.cn/). The population and GDP (CNY) data of Chun’an County from 1985 to 2021 were collected from the Zhejiang statistical yearbook (http://data.cnki.net/Yearbook). Land-cover data of Chun’an County with a 30-m spatial resolution from 1985 to 2020 were obtained from the Data Sharing and Service Portal (https://data.casearth.cn/en/). This land-cover product contains 29 land-cover types and has a 5-year temporal resolution (Zhang et al., 2021). Impervious surface area (ISA) (km2) data were extracted from the land-cover product.
2.6 Statistical analyses
2.6.1 Analysis of the spatiotemporal variations in LSWT
Spatially, the variations in LSWT were described at whole-lake scale and lake-segment scale; temporally, the variations in LSWT were described at seasonal and monthly scale. Four statistical values, mean, minimum, maximum and standard deviation, were used to elucidate the spatial and temporal variations in LSWT. Two steps were performed to calculate the spatiotemporal variations in LSWT. First, the Landsat-derived LSWTs were averaged at spatial and temporal scales using the corresponding valid Landsat images. Furthermore, the values of minimum, maximum, mean and standard deviation were extracted from the averaged LSWT. The spatiotemporal variations in LSWT were performed in ENVI (version 5.3) and ArcGIS (version 10.6).
In our study, monotonic increasing or decreasing LSWT trends over the past 36 years were detected with Mann-Kendall (MK) tests (Mann, 1945; Kendall, 1948). In these tests, if the statistic variable Z is positive, it indicates that the LSWT displayed a linear increasing trend (Li et al., 2020). Otherwise, a linear decreasing trend is observed if Z is negative. Furthermore, the slope of the linear LSWT trend was measured by Sen’s slope (Sen, 1968). Sen’s slope estimator is a useful index for analyzing long-term trends in hydrological and meteorological data (Gocic and Trajkovic, 2013). Sen’s slope is more accurate than traditional linear regression, especially for nonnormally distributed data. In addition, Sen’s slope is insensitive to outlier data (Yang Q. et al., 2019). Finally, the linear trend in the long-term LSWT data was displayed using a linear model with Sen’s slope and its corresponding intercept. The MK test and Sen’s slope were calculated in R (version 4.2.0), and statistical significance was defined when p < 0.05. Therefore, four types of long-term LSWT trends were classified, including significantly increased, nonsignificantly increased, significantly decreased and nonsignificantly decreased trends.
2.6.2 Analysis of the driving forces of the long-term LSWT trend
Eight variables, including the annual GDP and POP in Chun’an County, annual mean air temperature (AT), annual mean wind speed (WS), annual mean relative humidity (RH), annual mean air pressure (AP), annual accumulated sunshine duration (SSD) and annual accumulated rainfall (RF), were selected as independent variables to elucidate the potential driving forces of the obtained long-term LSWT trend. Stepwise regression and the Akaike information criterion (AIC) estimator were used to select the best model for predicting the long-term LSWT trend. The best model was selected only if the model had the lowest AIC value and the model’s p value was less than 0.05. The proportion of variance in lake warming explained by the variables in the selected model was determined by analysis of variance (ANOVA) (Tao et al., 2015). Stepwise regression analysis and ANOVA were performed in R with the step function in the stats package.
3 Results
3.1 Validation of various landsat-derived LSWT products
The matched in situ LSWT data ranged from 10.93 to 33.0°C, with a mean value of 20.66°C, and covered four seasons. The Landsat-based LSWT data derived from the PSC algorithm, GSC algorithm and Landsat land surface temperature product were validated with buoy observations (Figure 2). The performances of these Landsat-derived LSWT products were evaluated with the mean absolute percent error (MAPE) and root mean square difference (RMSE). The PSC-derived LSWT product showed the best performance, with an MAPE value of 7.5% and RMSE value of 1.7°C. The Landsat land surface temperature product had the largest RMSE value (2.0°C). Specifically, the GSC-derived LSWTs (MAPE = 10.1%, RMSE = 1.9°C) and Landsat land surface temperature product (MAPE = 9.6%, RMSE = 1.8°C) had better accuracies than the PSC-derived LSWT (MAPE = 10.5%, RMSE = 1.9°C) when the in situ LSWT ranged from 10 to 20°C. When the in situ LSWTs were larger than 20°C, the PSC-derived LSWT data showed the best performance (MAPE = 4.8%, RMSE = 1.5°C). In addition, the GSC-derived LSWT and Landsat land surface temperature product underestimated and overestimated the LSWT, respectively, when the in situ LSWTs were larger than 30°C (Figure 2). Therefore, the PSC algorithm was selected to retrieve LSWTs in Lake Qiandaohu.
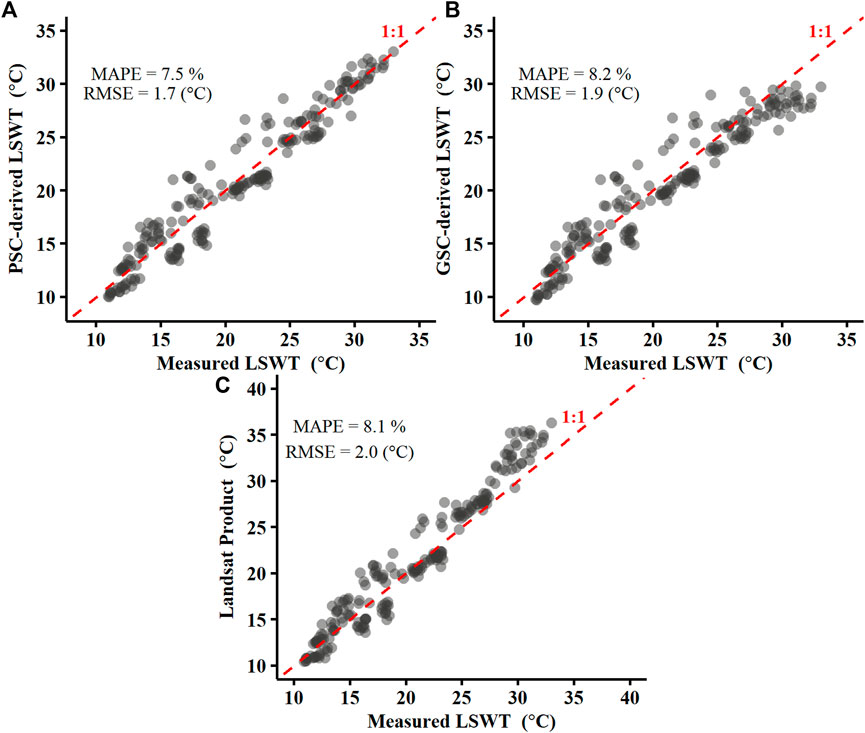
FIGURE 2. Validation results of Landsat-based LSWT data derived from the PSC algorithm (A), GSC algorithm (B) and Landsat land surface temperature product (C).
3.2 Spatial LSWT variations
The LSWTs derived from 880 Landsat images were averaged to elucidate the spatial LSWT variations in Lake Qiandaohu (Figure 3). Furthermore, the minimum, maximum, mean and standard deviation 36-year averaged LSWTs were calculated at the whole-lake scale and lake-segment scale. Overall, the 36-year averaged LSWT had a mean value of 20.2°C, with values ranging from 18.2 to 23.1°C. Specifically, the mean Landsat-derived LSWTs in the C segment, NE segment, NW segment, SE segment and SW segment were 20.2°C, 19.7°C, 20.0°C, 20.1 and 20.6°C, respectively. Thus, a clear upward trend in LSWT was displayed from the NE segment to the SW segment. However, the spatial LSWT variation from the NW segment to the SE segment was relatively stable. Moreover, the minimum standard deviation LSWT values were observed in the C segment and SE segment (0.3°C), while the maximum standard deviation LSWT was observed in the NW segment (0.4°C).
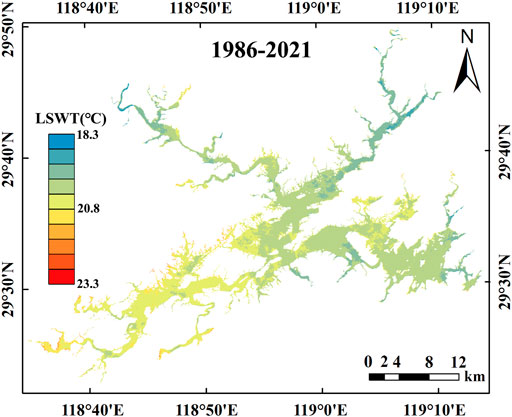
FIGURE 3. 36-year (1986–2021) averaged LSWTs in Lake Qiandaohu.
3.3 Seasonal LSWT variations
The Landsat-derived LSWTs were averaged at the seasonal and monthly scales (Figures 4, 5). The Lake Qiandaohu LSWTs clearly had seasonal variations, with the minimum seasonal mean value recorded in winter (December to February) (11.1 ± 0.6°C) and the maximum value recorded in summer (June to August) (27.9 ± 0.5°C). At the lake-segment spatial scale, the minimum seasonal mean LSWT values occurred in the NE segment (10.6 ± 0.7°C) and SW segment (10.6 ± 0.5°C) in winter, whereas the maximum seasonal mean LSWT occurred in the NW segment (28.2 ± 0.4°C) in summer. In addition, the minimum and maximum mean LSWTs in different seasons occurred in different segments (Supplementary Figure S2). For example, in winter, the NE segment and SW segment had the minimum mean LSWTs, while the SE segment (11.5 ± 0.5°C) had the maximum mean LSWT. However, the C segment (27.7 ± 0.3°C) and NW segment (28.2 ± 0.4°C) had the minimum and maximum mean LSWTs in summer, respectively.
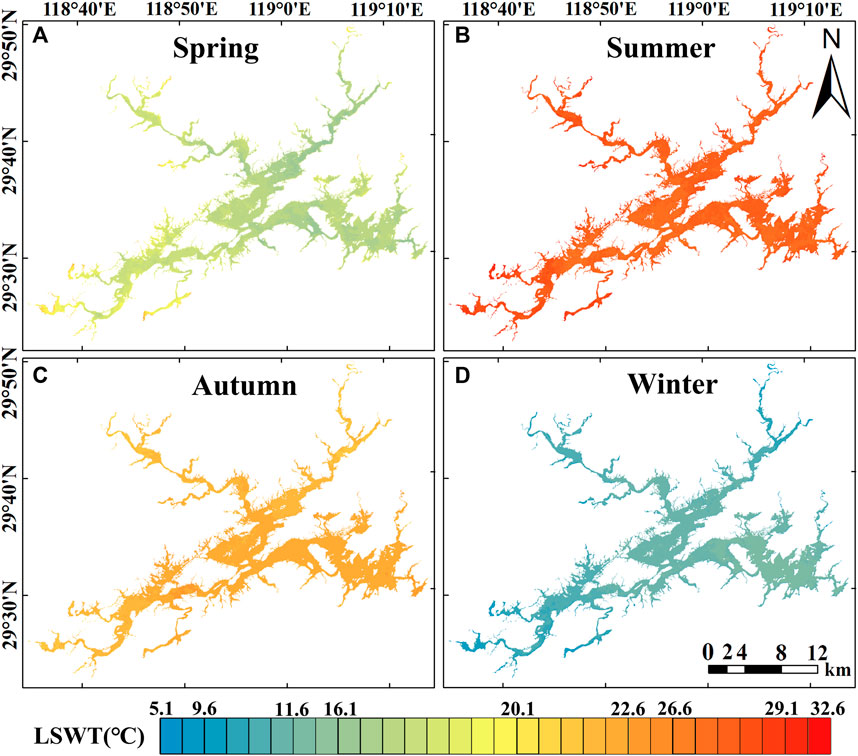
FIGURE 4. Spring (A), summer (B), autumn (C) and winter (D) averaged LSWTs in Lake Qiandaohu.
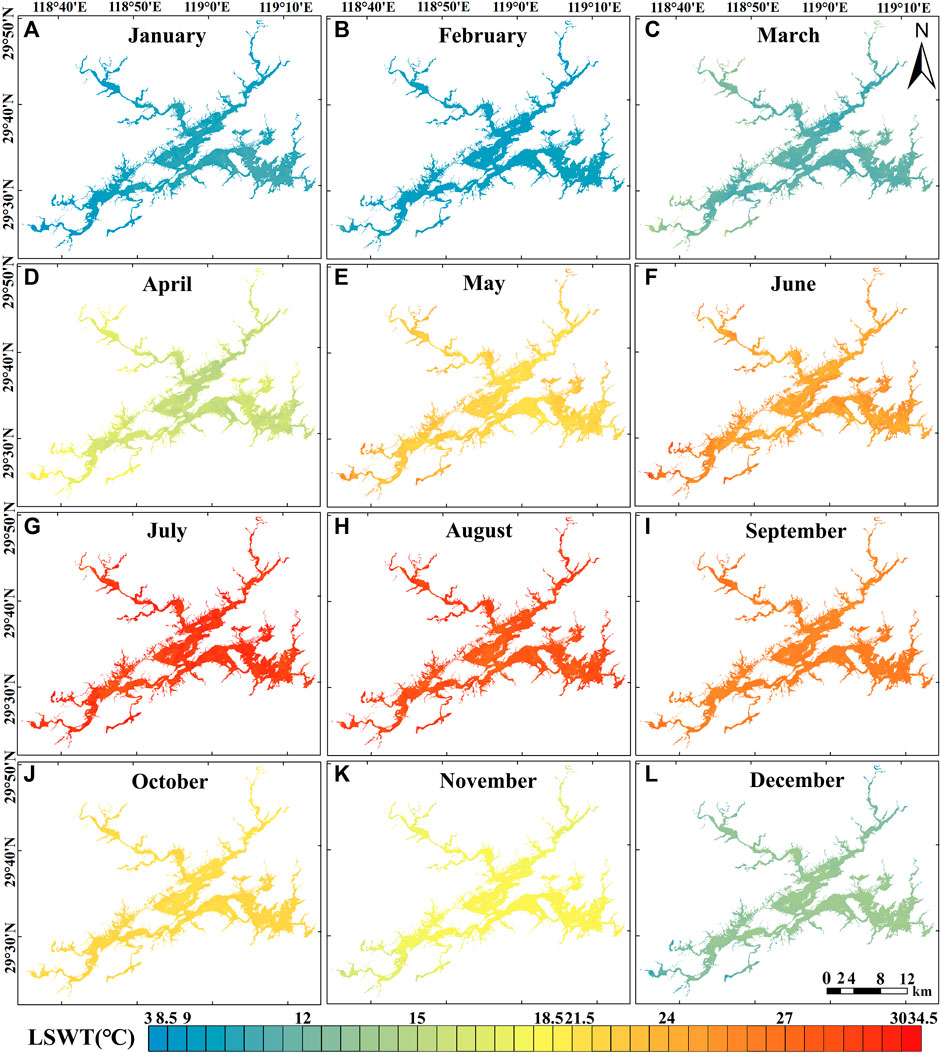
FIGURE 5. Monthly averaged LSWT in Lake Qiandaohu from 1986 to 2021. (A–L) represent January to December, respectively.
The monthly mean LSWTs in Lake Qiandaohu had minimum and maximum values in February (9.4 ± 0.4°C) and July (29.1 ± 0.5°C), respectively. The monthly LSWT distribution in the lake segments was similar to that in the whole lake except for the SW segment. In the SW segment, the minimum and maximum mean LSWTs occurred in January (9.1 ± 0.8°C) and July (28.9 ± 0.6°C), respectively.
3.4 Long-term LSWT trend
The Landsat-derived LSWTs were averaged at the annual scale to display the interannual variation (Supplementary Figure S3) and long-term trend in LSWT (Figure 6). The annual averaged LSWT in Lake Qiandaohu ranged from 17.1 ± 1.4°C in 1987 to 25.1 ± 1.3°C in 1994. The peak of annual averaged LSWT in the C segment (24.9°C), NE segment (24.5°C), NW segment (24.5°C), SE segment (24.6°C) and SW segment (26.4°C) were observed in 1994. Meanwhile, the lowest annual averaged LSWT in the C segment (17.5°C), NE segment (16.8°C), NW segment (15.8°C), SE segment (17.1°C) and SW segment (15.5°C) occurred in 1987, 2003, 1993, 1986 and 1993, respectively.
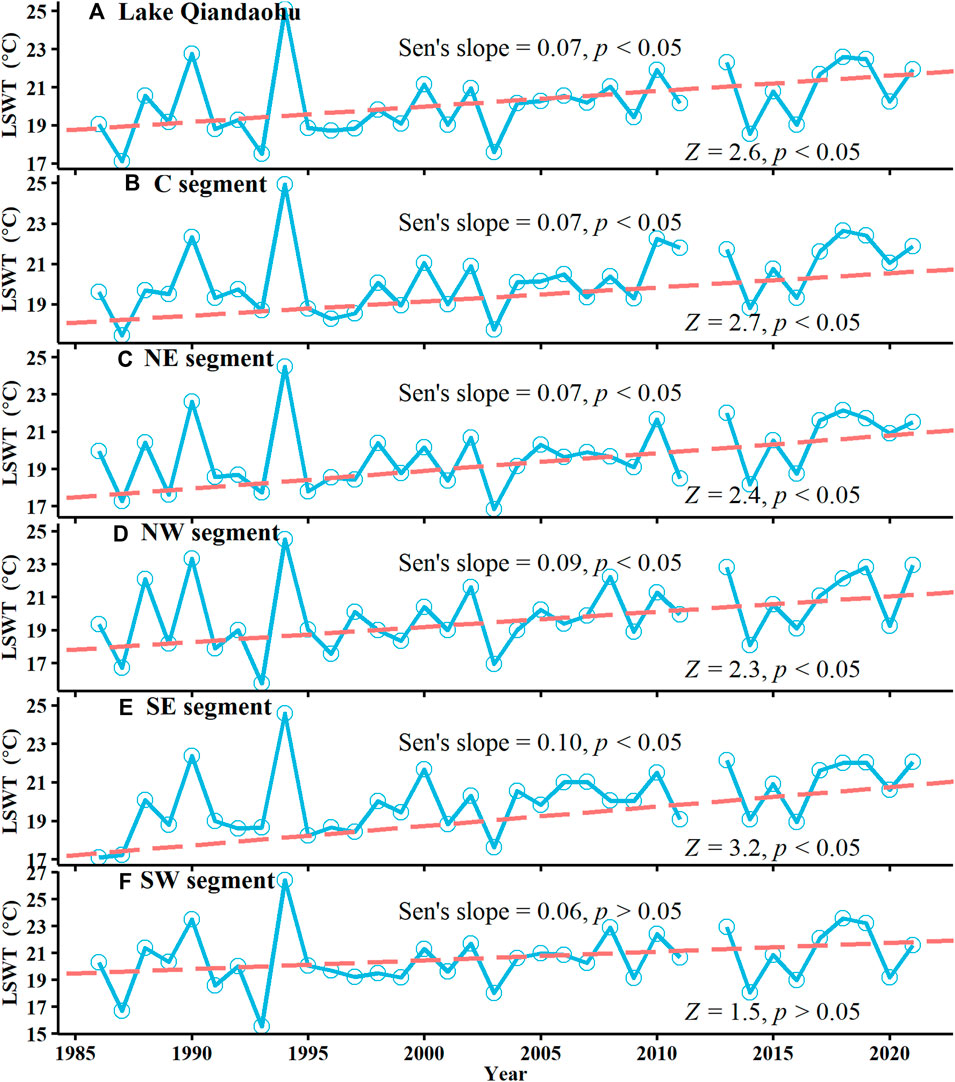
FIGURE 6. Long-term LSWT trends in Lake Qiandaohu (A), the C segment (B), NE segment (C), NW segment (D), SE segment (E) and SW segment (F).
Overall, a significant increasing trend in the LSWT in Lake Qiandaohu was observed with a Z value of 2.6 at the 95% confidence level. Similarly, significant increasing trends were also observed in the C segment (Z = 2.7, p < 0.05), NE segment (Z = 2.4, p < 0.05), NW segment (Z = 2.3, p < 0.05) and SE segment (Z = 3.2, p < 0.05). The long-term LSWT trend in the SW segment was increasing with a Z value of 1.5, but this trend was statistically nonsignificant. Specifically, the mean LSWT increased annually by 0.07°C from 1986 to 2021 in Lake Qiandaohu and increased by approximately 2.5°C from 1986 to 2021. The magnitude of the annual increment in the mean LSWT in the whole lake was equal to the annual increments in the C segment and NE segment but less than the annual increments in the NW segment (Sen’s slope = 0.09°C/year) and SE segment (Sen’s slope = 0.10°C/year). The minimum magnitude of the mean LSWT change slope was observed in the SW segment (Sen’s slope = 0.06°C/year), but this slope was statistically nonsignificant.
Approximately 65.6%, 34.2% and 0.3% of the area of Lake Qiandaohu displayed significant increases, nonsignificant increases and nonsignificant decreases in the LSWT over the past 36 years, respectively (Figure 7A). Specifically, all segments displayed warming trends except the SW segment, and approximately 1.0% of the area of the SW segment displayed a nonsignificant decreasing trend in the LSWT. Significant LSWT warming trends were identified in 80.2%, 65.9%, 45.5%, 94.8% and 25.3% of the C, NE, NW, SE and SW segments, respectively. In addition, the magnitude of these trends exhibited clear spatial heterogeneity (Figure 7B). For example, approximately 19.8% of the area of the SE segment had warming rates larger than 0.1°C/year, whereas this was observed in only 1.4% of the area of the C segment.
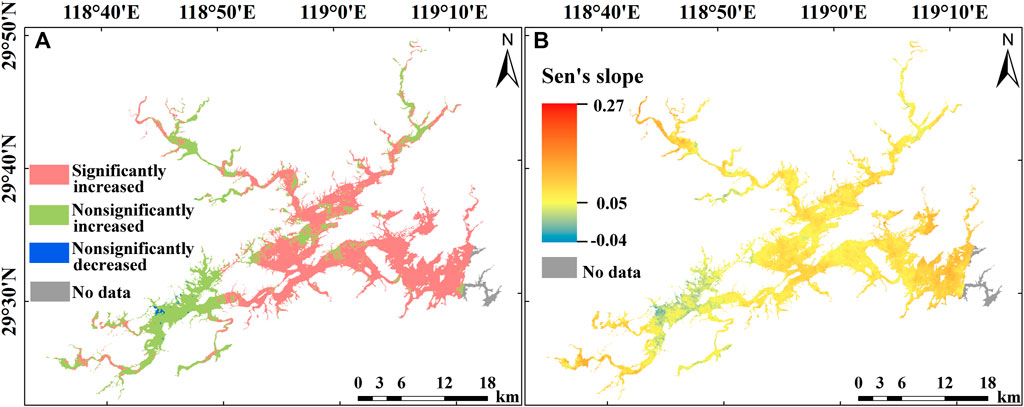
FIGURE 7. Spatial distribution of the long-term LSWT trend (A) and its magnitude (B) in Lake Qiandaohu.
4 Discussion
4.1 Driving force for spatial variation in LSWT
Water depth is a critical parameter that impacts LSWT dynamics due to its ability to regulate the amplitude and the spatial variation in LSWT (Becker and Daw, 2005). For example, relatively high daytime LSWTs were observed in East Lake Taihu due to the low water depth and long, narrow shape of this segment (Liu et al., 2015). Lake Qiandaohu is a deep lake, and the water depth of Lake Qiandaohu has clear spatial variations (Figure 8). Specifically, the lacustrine zone and the riverine zone have the highest (46.8 m) and lowest (32.7 m) mean water depths, respectively. Among the three riverine segments, the SW segment and NW segment have the minimum (30.6 m) and maximum (34.9 m) mean water depths, respectively. The 36-year averaged LSWT was significantly negatively correlated with the water depth (R2 = 0.08, p < 0.001) (Figure 8). This result implied that relatively shallow areas have higher LSWTs than relatively deep areas, which could be attributed to shallow areas being easier to heat with solar radiation than deeper areas. Becker and Daw (2005) found that shallow depth areas are strongly impacted by solar radiation and inflow water. Therefore, the shallowest segment, the SW segment, had the largest 36-year averaged LSWT. In addition, the shallow depth areas are mainly distributed in the riverine zone, which usually has relatively low water clarity (Li et al., 2020). Low water clarity can reduce the light penetration depth, trap heat in the surface water and, finally, increase the LSWT (Read and Rose, 2013). Therefore, spatial LSWT variations could be attributed in part to the water depth.
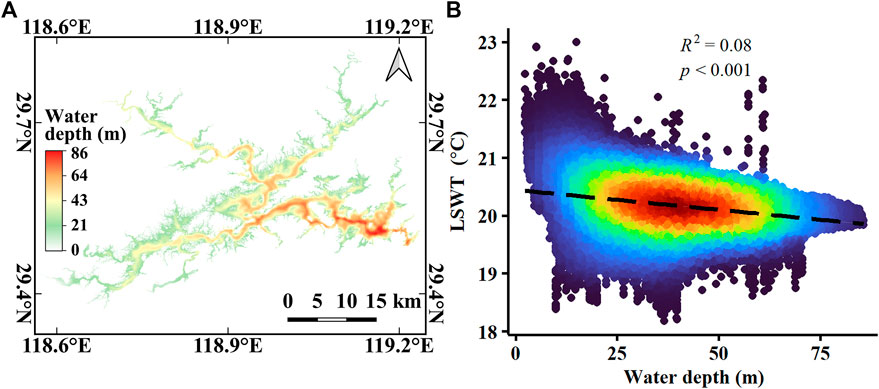
FIGURE 8. Water depths of Lake Qiandaohu (A) and scatter plot of the relationship between the water depth and 36-year averaged LSWT (B).
4.2 Driving force of LSWT warming
The social and economic environment in Chun’an County and the physical environment in Lake Qiandaohu experienced profound changes from 1985 to 2021 (Figure 9). Over the past 37 years, Chun’an County has experienced a rapid urbanization process. The POP, GDP and ISA in Chun’an County increased from 42.72×10⁴, 2.7×10⁸ CNY and 11.21 km2 to 45.62×10⁴, 255.17×10⁸ CNY and 39.78 km2, respectively. On the other hand, significant long-term trends in climatic factors were observed in Lake Qiandaohu over this period (Figure 9). For example, the AT in Lake Qiandaohu displayed a significant increasing trend (Z = 4.6, p < 0.05), with a Sen’s slope of 0.04°C/year, and increased by approximately 1.5°C over the past 37 years. In contrast, the SSD and AP in Lake Qiandaohu displayed significant decreasing trends, with Sen’s slope of −5.1 h/year and −0.02 hPa/year, respectively.
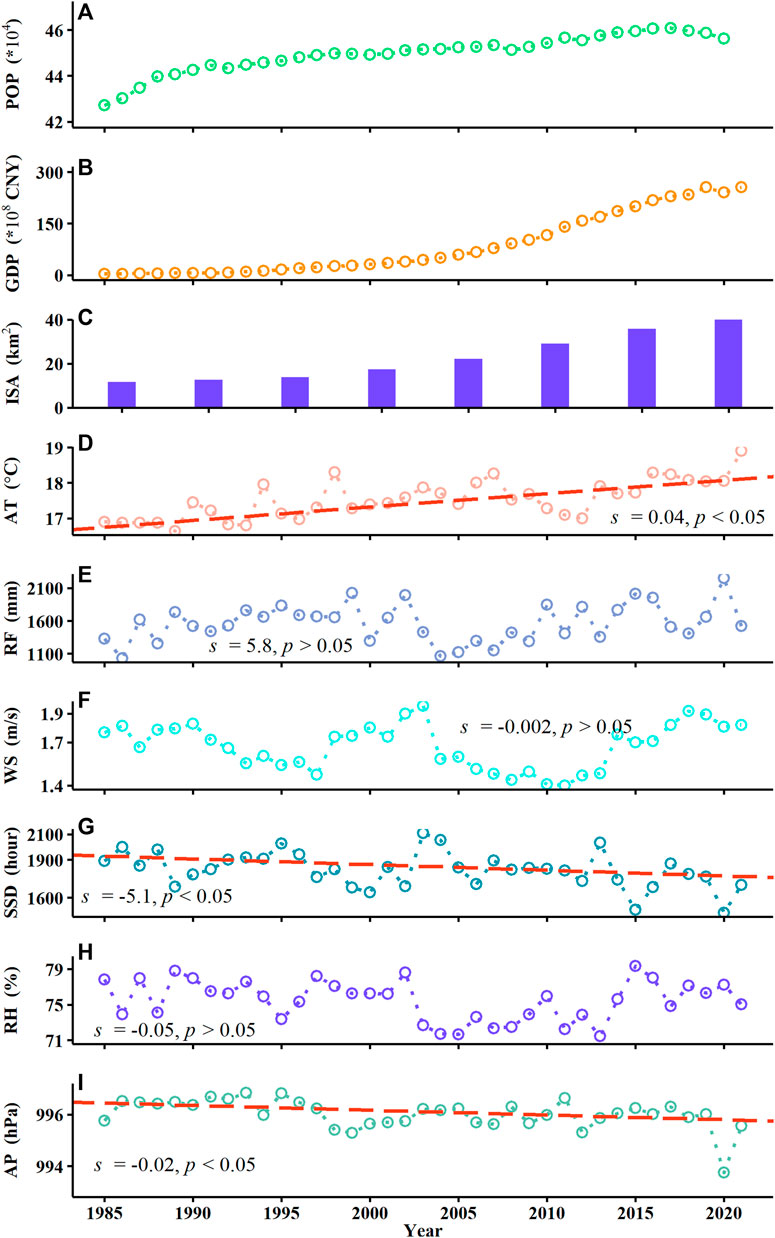
FIGURE 9. Long-term (1985–2021) changes in POP (A), GDP (B) and ISA (C), AT (D), RF (E), WS (F), SSD (G), RH (H) and AP (I). s represents the Sen’s slope.
Many potential drivers for warming LSWTs have been explored including the AT (Zhang G. et al., 2014; Piccolroaz et al., 2018), RF (Wan et al., 2018), WL (Zhang G. et al., 2014), water clarity (Rose et al., 2016), lake-specific morphology (water depth, water area, water storage) (Becker and Daw, 2005; Xie et al., 2022) and land use and land cover (Tan et al., 2020). Among these factors, the AT is widely considered a main driving factor for LSWT warming (Fink et al., 2014). For example, the LSWT warming recorded in Lake Baikal (Hampton et al., 2008), Lake Superior (Austin and Colman, 2008), Lake Ladoga (Naumenko et al., 2006), 11 lakes in the Yunnan-Guizhou Plateau (Yang et al., 2020) and 31 lakes in the Tibetan Plateau (Zhang G. et al., 2014) could be primarily attributed to increased ATs. In Lake Qiandaohu, the long-term LSWT trend is consistent with the long-term AT trend; both of these variables exhibit significant upward trends. The annual mean Landsat-derived LSWT was significantly correlated with the annual mean daily AT (r = 0.43, p < 0.05). The relatively low strength of the correlation between LSWT and AT could be attributed to the spatial and temporal differences between Landsat data and in situ meteorological data. At the daily temporal scale, a strong and significant correlation was observed between the mean Landsat-derived LSWT in Lake Qiandaohu and the mean AT (r = 0.95, p < 0.05). This result implied that AT is one of the main driving factors affecting LSWT warming in Lake Qiandaohu.
The potential effects of human and climatic factors on long-term LSWT variations were analyzed with stepwise regression (Table 1). Overall, AT was found to be the dominant factor affecting LSWT warming in Lake Qiandaohu, and explained 87.35% of the variance in the LSWT warming. In addition, AT is the main driving factor affecting LSWT warming in each subsegment of the lake except the C segment. GDP was the main contributor to the LSWT variations in the C segment and explained 83.88% of the variance in the LSWT warming. These results indicate that human activities have a stronger impact on the LSWTs in urban areas than in other areas. The C segment is spatially nearest to Chun’an County among the five lake segments. With the increased GDP over the past 30 years, the ISA and population in Chun’an County displayed upward trends (Figure 9). Under the background of rapid urbanization and population growth, the urban heat island effect increased, which may have increased the LSWTs. Our results are consistent with the factors affecting LSWT warming in urban lakes. For example, the expansion of ISA and increased population were found to be the main driving forces affecting LSWT warming in Lake Dianchi and Lake Qilu (Yang K. et al., 2019). Xu et al. (2013) found that ISA had a larger impact on the land surface temperature variation in Xiamen City than other land cover types, such as water and vegetation.
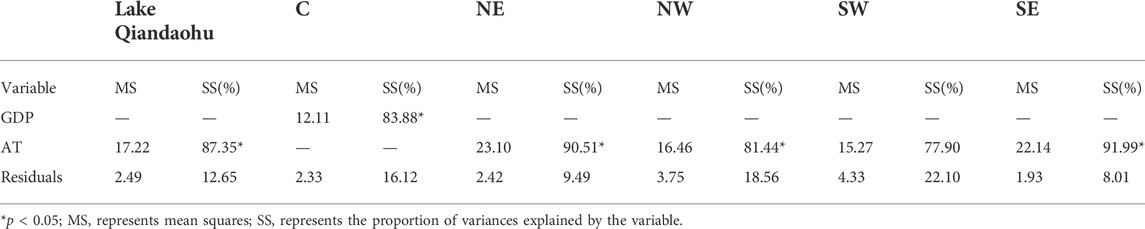
TABLE 1. Stepwise regression analysis results of the impacts of human and climatic factors on LSWT warming in Lake Qiandaohu and in each subsegment of the lake.
In addition to the AT and GDP, the decreasing water clarity is another potential driving force affecting LSWT warming. Water clarity can influence underwater light attenuation, vertical heat partitioning and outward heat fluxes (Rinke et al., 2010; Read and Rose, 2013; Rose et al., 2016). For example, the water clarity in Lake Crystal significantly decreased at a rate of 2.2%/year from 1981 to 2011. The LSWT warming in Lake Crystal was accelerated by the decreasing water clarity (Rose et al., 2016). Lakes with declining water clarity trends could experience surface water heating more easily and face larger outward heat fluxes (Pilla et al., 2018). In addition, the lake temperatures in deep-water lakes are more sensitive to water clarity changes (Gorham, 1964; Rose et al., 2016). Li et al. (2020) reported that water clarity in Lake Qiandaohu declined approximately 0.2 m from 1986 to 2016. The significant decreasing water clarity trend could partially contribute to the LSWT warming in Lake Qiandaohu.
4.3 Implications for the lake thermal structure
Many lakes and reservoirs worldwide have warmed over the past several decades, with varied warming rates (Schneider and Hook, 2010; O'Reilly Catherine et al., 2015; Xie et al., 2022). From 1986 to 2021, the LSWTs of Lake Qiandaohu displayed a significant increasing trend, with a warming rate of 0.07°C/year. This significant LSWT warming trend in Lake Qiandaohu is consistent with the trends identified in many lakes worldwide (O'Reilly Catherine et al., 2015). found that the LSWT change rates of 235 lakes globally ranged from −0.07°C/year to 0.13°C/year from 1985 to 2009 and displayed clear spatial variations. Lake Michigan and Lake Huron have shown significant warming trends from 1976 to 2006, with warming rates of 0.065°C/year and 0.086°C/year, respectively (Austin and Colman, 2007; Fink et al., 2014). It is notable that the warming rate of the LSWTs in Lake Qiandaohu was faster than the warming rate of AT in Chun’an County over the past 36 years Woolway and Merchant (2017) found that the LSWT warming rates in deep lakes more easily exceed those of regional ATs. In addition, changes in water clarity (Rose et al., 2016) and the timing of stratification (Austin and Colman, 2007) could also explain the different warming trends between the LSWT and AT.
Two linear models have been developed to estimate the thermocline depth (TD) and thermocline thickness (TT) from surface (0–2 m) water temperature (T) data in Lake Qiandaohu (Zhang Y. et al., 2014). Specifically, the TD has a significant negative relationship with T during the weakening period of stratification (July-February) (TD = -1.68×T+55.66, R2 = 0.94); the TT has a significant positive relationship with T (TT = 1.29×T-13.19, R2 = 0.91). Over the past 36 years, the LSWTs increased by 2.5°C based on the warming rate of 0.07°C/year. Thus, there was an approximately 4.2-m decrease in the TD during the weakening period of stratification and a 3.2-m increase in the TT according to these two linear models. Zhang Y. et al. (2014) found that the AT and T increased by 1.2 and 0.8°C from 1951 to 2012, resulting in a 1.4-m TD decrease during the weakening period of stratification and a 1.1-m TT increase. Compared to the results derived from Zhang Y. et al. (2014), our results may reflect uncertainty in overestimating the TD and TT changes. In our study, the TD and TT were calculated from the Landsat-derived LSWTs (water temperatures at 0.5 m below the water surface), which could be higher than the mean water temperature over the 0–2-m range. In addition, Zhang Y. et al. (2014) established an empirical linear model between the AT and T with in situ measurements, and this model indicated that every 1°C increase in the AT could result in an approximately 0.729°C increase in T. However, our study revealed that the LSWT has a faster warming rate than the AT. Therefore, the above two reasons could result in larger TD and TT estimates than the results of Zhang Y. et al. (2014).
In addition to the decreased TD and increased TT, the stratification timing would advance with LSWT warming (Lee et al., 2012; Zhang Y. et al., 2014). Woolway and Merchant (2017) investigated 144 lakes worldwide and found that the start date of lake stratification and the length of the stratification period were significantly negatively and positively correlated with the mean surface AT, respectively. On the other hand, an earlier lake stratification start date would amplify the LSWT response to the AT (Austin and Colman, 2007; Woolway and Merchant, 2017). With increased thermal stability, many problems in aquatic ecosystems have been observed, including increases in the frequency and area of algal blooms, changes in the composition of functional phytoplankton and decreases in primary productivity (Zhu et al., 2019). Therefore, understanding the amplification of LSWTs to ATs and quantitatively estimating of the spatial and temporal variations in the thermal structure could help policy-makers design efficiency measures to protect aquatic ecosystems.
5 Conclusion
The LSWT products derived for Lake Qiandaohu from the PSC algorithm, GSC algorithm and Landsat Level 2 data were validated with long-term buoy data, and the PSC algorithm showed the best performance, with an MAPE value of 7.5% and RMSE value of 1.7°C. With 36 years of Landsat data and the PSC algorithm, we retrospectively examined the spatial and temporal LSWT variations in Lake Qiandaohu. Spatially, the 36-year mean LSWT in Lake Qiandaohu was 20.2°C, and the NE and SW segments had the minimum (19.7°C) and maximum (20.6°C) mean LSWT values, respectively. Temporally, a significant upward LSWT trend was observed, with a warming rate of 0.07°C/year. Specifically, approximately 65.6% of the area of Lake Qiandaohu displayed a significantly increasing LSWT trend over the past 36 years. The spatial variations in LSWT could be explained in part by the water depth. The warming LSWTs in Lake Qiandaohu were main attributed to the warming AT. Based on the LSWT warming rate, the TD decreased by 4.2 m and the TT increased by 3.2 m over the past 36 years.
In this work, we analyzed spatiotemporal LSWT variations, elucidated the response of LSWT to AT and quantitatively estimated the changes in TD and TT; our results could be useful for local authorities in making policies to protect the health of aquatic ecosystems under global warming. Our findings highlight the importance of using satellite data to reveal the historic variations in and potential driving forces of LSWTs.
Data availability statement
The original contributions presented in the study are included in the article/Supplementary Material, further inquiries can be directed to the corresponding author.
Author contributions
YL: writing, data analysis; KS, YZ, and GZ: project idea, writing, supervision; YG, HL, and CD: data analysis.
Funding
This research was supported by the National Natural Science Foundation of China (Grant numbers 41922005, 42071333, 41830757, and 42001296), the Scientific Instrument Developing Project of the Chinese Academy of Sciences (Grant number YJKYYQ20200071) and the NIGLAS Foundation (E1SL002).
Acknowledgments
The authors thank Linmin Zhang, Gezhi Mei, and Jiacheng Wang for the help in data preprocessing. We thank the United States Geological Survey for providing the Landsat series data.
Conflict of interest
The authors declare that the research was conducted in the absence of any commercial or financial relationships that could be construed as a potential conflict of interest.
Publisher’s note
All claims expressed in this article are solely those of the authors and do not necessarily represent those of their affiliated organizations, or those of the publisher, the editors and the reviewers. Any product that may be evaluated in this article, or claim that may be made by its manufacturer, is not guaranteed or endorsed by the publisher.
Supplementary material
The Supplementary Material for this article can be found online at: https://www.frontiersin.org/articles/10.3389/fenvs.2022.995862/full#supplementary-material
References
Adrian, R., O'Reilly, C. M., Zagarese, H., Baines, S. B., Hessen, D. O., Keller, W., et al. (2009). Lakes as sentinels of climate change. Limnol. Oceanogr. 54 (2), 2283–2297. doi:10.4319/lo.2009.54.6_part_2.2283
Arhonditsis, G. B., Brett, M. T., DeGasperi, C. L., and Schindler, D. E. (2004). Effects of climatic variability on the thermal properties of Lake Washington. Limnol. Oceanogr. 49 (1), 256–270. doi:10.4319/lo.2004.49.1.0256
Austin, J. A., and Colman, S. M. (2007). Lake Superior summer water temperatures are increasing more rapidly than regional air temperatures: A positive ice-albedo feedback. Geophys. Res. Lett. 34 (6), L06604. doi:10.1029/2006GL029021
Austin, J., and Colman, S. (2008). A century of temperature variability in Lake Superior. Limnol. Oceanogr. 53 (6), 2724–2730. doi:10.4319/lo.2008.53.6.2724
Becker, M. W., and Daw, A. (2005). Influence of lake morphology and clarity on water surface temperature as measured by EOS ASTER. Remote Sens. Environ. 99 (3), 288–294. doi:10.1016/j.rse.2005.09.003
Coats, R., Perez-Losada, J., Schladow, G., Richards, R., and Goldman, C. (2006). The warming of lake Tahoe. Clim. Change 76 (1), 121–148. doi:10.1007/s10584-005-9006-1
Coll, C., Caselles, V., Valor, E., and Niclòs, R. (2012). Comparison between different sources of atmospheric profiles for land surface temperature retrieval from single channel thermal infrared data. Remote Sens. Environ. 117, 199–210. doi:10.1016/j.rse.2011.09.018
Debnath, M., Syiemlieh, H. J., Sharma, M. C., Kumar, R., Chowdhury, A., and Lal, U. (2018). Glacial lake dynamics and lake surface temperature assessment along the Kangchengayo-Pauhunri Massif, Sikkim Himalaya, 1988–2014. Remote Sens. Appl. Soc. Environ. 9, 26–41. doi:10.1016/j.rsase.2017.11.002
Duan, S.-B., Li, Z.-L., Zhao, W., Wu, P., Huang, C., Han, X.-J., et al. (2021). Validation of Landsat land surface temperature product in the conterminous United States using in situ measurements from SURFRAD, ARM, and NDBC sites. Int. J. Digital Earth 14 (5), 640–660. doi:10.1080/17538947.2020.1862319
Elçi, Ş. (2008). Effects of thermal stratification and mixing on reservoir water quality. Limnology 9 (2), 135–142. doi:10.1007/s10201-008-0240-x
Fink, G., Schmid, M., Wahl, B., Wolf, T., and Wüest, A. (2014). Heat flux modifications related to climate-induced warming of large European lakes. Water Resour. Res. 50 (3), 2072–2085. doi:10.1002/2013WR014448
Gocic, M., and Trajkovic, S. (2013). Analysis of changes in meteorological variables using Mann-Kendall and Sen's slope estimator statistical tests in Serbia. Glob. Planet. Change 100, 172–182. doi:10.1016/j.gloplacha.2012.10.014
Gorham, E. (1964). Morphometric control of annual heat budgets in temperate lakes. Limnol. Oceanogr. 9 (4), 525–529. doi:10.4319/lo.1964.9.4.0525
Hampton, S. E., Izmest'Eva, L. R., Moore, M. V., Katz, S. L., Dennis, B., and Silow, E. A. (2008). Sixty years of environmental change in the world's largest freshwater lake – lake Baikal, Siberia. Glob. Chang. Biol. 14 (8), 1947–1958. doi:10.1111/j.1365-2486.2008.01616.x
Huisman, J., Codd, G. A., Paerl, H. W., Ibelings, B. W., Verspagen, J. M. H., and Visser, P. M. (2018). Cyanobacterial blooms. Nat. Rev. Microbiol. 16 (8), 471–483. doi:10.1038/s41579-018-0040-1
Jimenez-Munoz, J. C., Cristobal, J., Sobrino, J. A., Soria, G., Ninyerola, M., Pons, X., et al. (2009). Revision of the single-channel algorithm for land surface temperature retrieval from landsat thermal-infrared data. IEEE Trans. Geosci. Remote Sens. 47 (1), 339–349. doi:10.1109/TGRS.2008.2007125
Jiménez-Muñoz, J. C., and Sobrino, J. A. (2003). A generalized single-channel method for retrieving land surface temperature from remote sensing data. J. Geophys. Res. 108 (22), 2003JD003480. doi:10.1029/2003JD003480
Jiménez-Muñoz, J. C., Sobrino, J. A., Skoković, D., Mattar, C., and Cristóbal, J. (2014). Land surface temperature retrieval methods from Landsat-8 thermal infrared sensor data. IEEE Geosci. Remote Sens. Lett. 11 (10), 1840–1843. doi:10.1109/LGRS.2014.2312032
Jimenez-Munoz, J., and Sobrino, J. A. (2008). Split-Window coefficients for land surface temperature retrieval from low-resolution thermal infrared sensors. IEEE Geosci. Remote Sens. Lett. 5 (4), 806–809. doi:10.1109/LGRS.2008.2001636
Kraemer, B. M., Anneville, O., Chandra, S., Dix, M., Kuusisto, E., Livingstone, D. M., et al. (2015). Morphometry and average temperature affect lake stratification responses to climate change. Geophys. Res. Lett. 42 (12), 4981–4988. doi:10.1002/2015GL064097
Lee, H. W., Kim, E. J., Park, S. S., and Choi, J. H. (2012). Effects of climate change on the thermal structure of lakes in the Asian Monsoon Area. Clim. Change 112 (3), 859–880. doi:10.1007/s10584-011-0233-3
Li, Y., Shi, K., Zhang, Y., Zhu, G., Qin, B., Zhang, Y., et al. (2022). Remote sensing of column-integrated chlorophyll a in a large deep-water reservoir. J. Hydrology 610, 127918. doi:10.1016/j.jhydrol.2022.127918
Li, Y., Shi, K., Zhang, Y., Zhu, G., Zhang, Y., Wu, Z., et al. (2020). Analysis of water clarity decrease in Xin’anjiang Reservoir, China, from 30-Year Landsat TM, ETM+, and OLI observations. J. Hydrology 590, 125476. doi:10.1016/j.jhydrol.2020.125476
Li, Y., Zhang, Y., Shi, K., Zhu, G., Zhou, Y., Zhang, Y., et al. (2017). Monitoring spatiotemporal variations in nutrients in a large drinking water reservoir and their relationships with hydrological and meteorological conditions based on Landsat 8 imagery. Sci. Total Environ. 599-600, 1705–1717. doi:10.1016/j.scitotenv.2017.05.075
Li, Z.-L., Tang, B.-H., Wu, H., Ren, H., Yan, G., Wan, Z., et al. (2013). Satellite-derived land surface temperature: Current status and perspectives. Remote Sens. Environ. 131, 14–37. doi:10.1016/j.rse.2012.12.008
Liu, B., Wan, W., Xie, H., Li, H., Zhu, S., Zhang, G., et al. (2019). A long-term dataset of lake surface water temperature over the Tibetan Plateau derived from AVHRR 1981–2015. Sci. Data 6 (1), 48. doi:10.1038/s41597-019-0040-7
Liu, G., Ou, W., Zhang, Y., Wu, T., Zhu, G., Shi, K., et al. (2015). Validating and mapping surface water temperatures in lake Taihu: Results from MODIS land surface temperature products. IEEE J. Sel. Top. Appl. Earth Obs. Remote Sens. 8 (3), 1230–1244. doi:10.1109/JSTARS.2014.2386333
Malakar, N. K., Hulley, G. C., Hook, S. J., Laraby, K., Cook, M., and Schott, J. R. (2018). An operational land surface temperature product for landsat thermal data: Methodology and validation. IEEE Trans. Geosci. Remote Sens. 56 (10), 5717–5735. doi:10.1109/TGRS.2018.2824828
Mann, H. B. (1945). Nonparametric tests against trend. Econometrica 13 (3), 245–259. doi:10.2307/1907187
Montanaro, M., Gerace, A., Lunsford, A., and Reuter, D. (2014). Stray light artifacts in imagery from the landsat 8 thermal infrared sensor. Remote Sens. 6 (11), 10435–10456. doi:10.3390/rs61110435
Najwa, S., Ali, F., Mariano, B., Claudia, G., Bruno, J. L., Kamal, S., et al. (2019). Lake surface temperature retrieval from Landsat-8 and retrospective analysis in Karaoun Reservoir, Lebanon. J. Appl. Remote Sens. 13 (4), 1–14. doi:10.1117/1.JRS.13.044505
Naumenko, M., Guzivaty, V., and Karetnikov, S. (2006). “Climatic trends of the water surface temperature in Lake Ladoga during ice-free periods,” in Doklady Earth Sciences (New York: Springer Nature BV), 750.()
O'Reilly Catherine, M., Sharma, S., Gray Derek, K., Hampton Stephanie, E., Read Jordan, S., Rowley Rex, J., et al. (2015). Rapid and highly variable warming of lake surface waters around the globe. Geophys. Res. Lett. 42 (24), 10773–10781. doi:10.1002/2015GL066235
O'Reilly, C. M., Alin, S. R., Plisnier, P.-D., Cohen, A. S., and McKee, B. A. (2003). Climate change decreases aquatic ecosystem productivity of Lake Tanganyika, Africa. Nature 424 (6950), 766–768. doi:10.1038/nature01833
Piccolroaz, S., Healey, N. C., Lenters, J. D., Schladow, S. G., Hook, S. J., Sahoo, G. B., et al. (2018). On the predictability of lake surface temperature using air temperature in a changing climate: A case study for Lake Tahoe (U.S.A.). Limnol. Oceanogr. 63 (1), 243–261. doi:10.1002/lno.10626
Pilla, R. M., Williamson, C. E., Zhang, J., Smyth, R. L., Lenters, J. D., Brentrup, J. A., et al. (2018). Browning-related decreases in water transparency lead to long-term increases in surface water temperature and thermal stratification in two small lakes. J. Geophys. Res. Biogeosci. 123 (5), 1651–1665. doi:10.1029/2017JG004321
Qin, Z., Karnieli, A., and Berliner, P. (2001). A mono-window algorithm for retrieving land surface temperature from Landsat TM data and its application to the Israel-Egypt border region. Int. J. Remote Sens. 22 (18), 3719–3746. doi:10.1080/01431160010006971
Read, J. S., and Rose, K. C. (2013). Physical responses of small temperate lakes to variation in dissolved organic carbon concentrations. Limnol. Oceanogr. 58 (3), 921–931. doi:10.4319/lo.2013.58.3.0921
Rinke, K., Yeates, P., and Rothhaupt, K.-O. (2010). A simulation study of the feedback of phytoplankton on thermal structure via light extinction. Freshw. Biol. 55 (8), 1674–1693. doi:10.1111/j.1365-2427.2010.02401.x
Rose, K. C., Winslow, L. A., Read, J. S., and Hansen, G. J. A. (2016). Climate-induced warming of lakes can be either amplified or suppressed by trends in water clarity. Limnol. Oceanogr. Lett. 1 (1), 44–53. doi:10.1002/lol2.10027
Schneider, P., Hook, S. J., Radocinski, R. G., Corlett, G. K., Hulley, G. C., Schladow, S. G., et al. (2009). Satellite observations indicate rapid warming trend for lakes in California and Nevada. Geophys. Res. Lett. 36 (22), L22402. doi:10.1029/2009GL040846
Schneider, P., and Hook, S. J. (2010). Space observations of inland water bodies show rapid surface warming since 1985. Geophys. Res. Lett. 37 (22). doi:10.1029/2010GL045059
Sen, P. K. (1968). Estimates of the Regression Coefficient Based on Kendall's Tau. J. Am. Stat. Assoc. 63 (324), 1379–1389. doi:10.1080/01621459.1968.10480934
Sobrino, J. A., Jiménez-Muñoz, J. C., and Paolini, L. (2004). Land surface temperature retrieval from LANDSAT TM 5. Remote Sens. Environ. 90 (4), 434–440. doi:10.1016/j.rse.2004.02.003
Tan, J., Yu, D., Li, Q., Tan, X., and Zhou, W. (2020). Spatial relationship between land-use/land-cover change and land surface temperature in the Dongting Lake area, China. Sci. Rep. 10 (1), 9245. doi:10.1038/s41598-020-66168-6
Tao, S., Fang, J., Zhao, X., Zhao, S., Shen, H., Hu, H., et al. (2015). Rapid loss of lakes on the Mongolian Plateau. Proc. Natl. Acad. Sci. U. S. A. 112 (7), 2281–2286. doi:10.1073/pnas.1411748112
Vanhellemont, Q. (2020). Automated water surface temperature retrieval from Landsat 8/TIRS. Remote Sens. Environ. 237, 111518. doi:10.1016/j.rse.2019.111518
Verburg, P., Hecky Robert, E., and Kling, H. (2003). Ecological Consequences of a Century of Warming in Lake Tanganyika. Science 301 (5632), 505–507. doi:10.1126/science.1084846
Wan, W., Zhao, L., Xie, H., Liu, B., Li, H., Cui, Y., et al. (2018). Lake surface water temperature change over the Tibetan Plateau from 2001 to 2015: a sensitive indicator of the warming climate. Geophys. Res. Lett. 45 (20), 177–111. doi:10.1029/2018GL078601
Wang, M., Zhang, Z., Hu, T., and Liu, X. (2019). A practical single-channel algorithm for land surface temperature retrieval: application to Landsat series data. J. Geophys. Res. Atmos. 124 (1), 2018JD029330–316. doi:10.1029/2018JD029330
Winslow, L. A., Read, J. S., Hansen, G. J. A., Rose, K. C., and Robertson, D. M. (2017). Seasonality of change: Summer warming rates do not fully represent effects of climate change on lake temperatures. Limnol. Oceanogr. 62 (5), 2168–2178. doi:10.1002/lno.10557
Woolway, R. I., Kraemer, B. M., Lenters, J. D., Merchant, C. J., O’Reilly, C. M., and Sharma, S. (2020). Global lake responses to climate change. Nat. Rev. Earth Environ. 1 (8), 388–403. doi:10.1038/s43017-020-0067-5
Woolway, R. I., and Merchant, C. J. (2017). Amplified surface temperature response of cold, deep lakes to inter-annual air temperature variability. Sci. Rep. 7 (1), 4130. doi:10.1038/s41598-017-04058-0
Xie, C., Zhang, X., Zhuang, L., Zhu, R., and Guo, J. (2022). Analysis of surface temperature variation of lakes in China using MODIS land surface temperature data. Sci. Rep. 12 (1), 2415. doi:10.1038/s41598-022-06363-9
Xu, H., Lin, D., and Tang, F. (2013). The impact of impervious surface development on land surface temperature in a subtropical city: Xiamen, China. Int. J. Climatol. 33 (8), 1873–1883. doi:10.1002/joc.3554
Yang, K., Yu, Z., and Luo, Y. (2020). Analysis on driving factors of lake surface water temperature for major lakes in Yunnan-Guizhou Plateau. Water Res. 184, 116018. doi:10.1016/j.watres.2020.116018
Yang, K., Yu, Z., Luo, Y., Yang, Y., Zhao, L., and Zhou, X. (2018). Spatial and temporal variations in the relationship between lake water surface temperatures and water quality - A case study of Dianchi Lake. Sci. Total Environ. 624, 859–871. doi:10.1016/j.scitotenv.2017.12.119
Yang, K., Yu, Z., Luo, Y., Zhou, X., and Shang, C. (2019a). Spatial-temporal variation of lake surface water temperature and its driving factors in Yunnan-Guizhou Plateau. Water Resour. Res. 55 (6), 4688–4703. doi:10.1029/2019WR025316
Yang, Q., Huang, X., and Tang, Q. (2019b). The footprint of urban heat island effect in 302 Chinese cities: Temporal trends and associated factors. Sci. Total Environ. 655, 652–662. doi:10.1016/j.scitotenv.2018.11.171
Zhang, G., Yao, T., Xie, H., Qin, J., Ye, Q., Dai, Y., et al. (2014a). Estimating surface temperature changes of lakes in the Tibetan Plateau using MODIS LST data. J. Geophys. Res. Atmos. 119 (14), 8552–8567. doi:10.1002/2014JD021615
Zhang, X., Liu, L., Chen, X., Gao, Y., Xie, S., and Mi, J. (2021). GLC_FCS30: global land-cover product with fine classification system at 30 m using time-series Landsat imagery. Earth Syst. Sci. Data 13 (6), 2753–2776. doi:10.5194/essd-13-2753-2021
Zhang, Y., Wu, Z., Liu, M., He, J., Shi, K., Wang, M., et al. (2014b). Thermal structure and response to long-term climatic changes in Lake Qiandaohu, a deep subtropical reservoir in China. Limnol. Oceanogr. 59 (4), 1193–1202. doi:10.4319/lo.2014.59.4.1193
Zhu, S., Ptak, M., Choiński, A., and Wu, S. (2019). Exploring and quantifying the impact of climate change on surface water temperature of a high mountain lake in Central Europe. Environ. Monit. Assess. 192 (1), 7. doi:10.1007/s10661-019-7994-y
Keywords: lake surface water temperature, Landsat, Lake Qiandaohu, thermal structure, Google Earth engine
Citation: Li Y, Shi K, Zhang Y, Zhu G, Guo Y, Li H and Du C (2022) Warming lake surface water temperatures in Lake Qiandaohu, China: Spatiotemporal variations, influencing factors and implications for the thermal structure. Front. Environ. Sci. 10:995862. doi: 10.3389/fenvs.2022.995862
Received: 16 July 2022; Accepted: 01 August 2022;
Published: 24 August 2022.
Edited by:
Sijia Li, Northeast Institute of Geography and Agroecology (CAS), ChinaReviewed by:
Shenglei Wang, Aerospace Information Research Institute (CAS), ChinaDehua Mao, Northeast Institute of Geography and Agroecology (CAS), China
Copyright © 2022 Li, Shi, Zhang, Zhu, Guo, Li and Du. This is an open-access article distributed under the terms of the Creative Commons Attribution License (CC BY). The use, distribution or reproduction in other forums is permitted, provided the original author(s) and the copyright owner(s) are credited and that the original publication in this journal is cited, in accordance with accepted academic practice. No use, distribution or reproduction is permitted which does not comply with these terms.
*Correspondence: Kun Shi, a3NoaUBuaWdsYXMuYWMuY24=