 Yang Zhang1,2
 Ying Jing
94% of researchers rate our articles as excellent or good
Learn more about the work of our research integrity team to safeguard the quality of each article we publish.
Find out more
ORIGINAL RESEARCH article
Front. Environ. Sci., 09 September 2022
Sec. Land Use Dynamics
Volume 10 - 2022 | https://doi.org/10.3389/fenvs.2022.994860
This article is part of the Research TopicTowards Sustainable Urban Development: Use of Geographic Big Data for Spatial PlanningView all 25 articles
The civil aviation industry plays an important role in advancing interregional socio-economic development. Investigating the competitiveness of civil aviation airports (CAAs) from the tempo-spatial change perspective aids in the optimization of airport layout towards balanced and coordinated regional development. This research assesses the overall competitiveness of 86 CAAs in 11 provinces or provincial-level municipalities of the Yangtze River Economic Belt (YREB) from 2009 to 2019 by the entropy weight approach, then characterizes their spatial-temporal evolution via Moran index of spatial auto-correlation analysis, and finally explores their dynamic changing tendency of the spatial variability based on Theil index measurement and decomposition. The findings are concluded: 1) From 2009 to 2019, the overall competitiveness of civil aviation airports is dramatically improved and an evidently hierarchical system is formed at the provincial level, with the spatial pattern of “strong in the east and west, weak in the middle”. 2) The global Moran indexes of civil aviation airport competitiveness in 2009, 2014, and 2019 are negative, indicating that superior and inferior airports are likely to be spatially clustered. 3) The local Moran Indexes show that the spatial agglomerations of civil aviation airports tend to be more evident in the recent decade. The high-high competitiveness clusters lie in the Yangtze River Delta Economic Zone for the long run, transforming from “Shanghai-Hangzhou” high-competitiveness pole to “Shanghai-Hangzhou-Nanjing” and further extending to central Jiangsu. Civil aviation airports in provincial capitals and secondary cities have formed clusters of high-low competitiveness. Moreover, clusters of low-low competitiveness stretch from the Yunnan-Guizhou Plateau to cities in the middle reaches of the Yangtze River. 4) The interprovincial Theil indexes of civil aviation airport competitiveness fluctuate, with the discrepancy increasing and then decreasing.
Since the founding of the People’s Republic of China in 1949, China’s civil aviation industry (CCAI) has been developing rapidly and playing a key role in the national economic system. In particular, market-oriented construction since the reform and opening-up in 1978 has brought new opportunities to CCAI. This has made CCAI achieve rapid development in many aspects, such as air transportation, fleet size, regulation construction, route layout, etc. As an essential node of civil aviation, the airport is the key carrier of the structure and function of the civil aviation network, the window of a country for international exchange and cooperation, and an essential bridge for a regional economy to participate in international labor division. After more than 40 years of growth since the reform and opening up, CCAI has become the world’s second largest air transportation system after the United States (Liang et al., 2016). To better meet the needs of China’s socio-economic development, how to further accelerate airport construction and optimize airport layout has become a vital issue in the development of CCAI. Airport competitiveness is a quantitative standard of the overall capability of airports, which reflects the ability of airports to reasonably integrate and optimize the use of internal and external resources facing market competition. It is also an important indicator to measure the prospects of airports and formulate scientific tactics for the development of airports (Wen et al., 2022). On this basis, exploring the competitiveness and spatial-temporal evolution of airports enables aviation authorities to understand airports’ strengths and weaknesses, formulate scientific development strategies, improve their advantages continuously, optimize airport layout, strengthen airport operation and management, and promote the development of regional economy and civil aviation industry.
The Yangtze River Economic Belt (YREB) is a vital national strategic development region in China (Liu and Xia, 2020; Yu et al., 2020; Peng and Xu, 2021). As an international economic region connecting home and abroad, YREB plays an essential role in coordinating both regions along the Yangtze River and part of coastal border regions in China (Zhang et al., 2021). At the 2020 Symposium on Promoting the Development of the YREB, China’s General Secretary Jinping Xi pointed out that the transport system, especially the air transport network, is a significant driving force in creating a new height for the opening-up of YREB (Lu et al., 2022). Moreover, the air transportation network contributes to inland opening, regional coordination, and high-quality integration development of the Yangtze River Economic Belt (YREB) and the Belt and Road Initiative (BRI). On this basis, building a well-developed aviation network has become one of the critical tasks of constructing a comprehensive three-dimensional transport system in YREB (Pei et al., 2021). As the fundamental component of an air carrier, the airport provides site support. The airport acts as a center for passengers’ transit, departure, and arrival in the air transportation network. Due to the geographically strategic position, YREB promotes the synergistic development among the cities in its upper, middle, and lower reaches by exploring the spatial-temporal patterns of civil aviation airports (CAAs).
The airport competitiveness evaluation facilitates optimizing the spatial layout of airport clusters in YREB (Zhang et al., 2022). Previous studies on evaluating airport competitiveness have mostly been conducted from a global, national, or single airport perspective (Zeng et al., 2012; Cui et al., 2013; Jiang et al., 2013; Spaina et al., 2014; Ishizuka, 2014; Cui et al., 2017; Tang and Li, 2019; Wei et al., 2019; Choi, 2020; Liang et al., 2020; Moura et al., 2020; Qin, 2020; He et al., 2021). Some scholars explored the competitiveness of airports by various econometric methods such as factor analysis, principal component analysis, hierarchical analysis, DEA, fuzzy comprehensive evaluation, and entropy weight method, emphasizing the symbiosis between transportation and economic development and the importance of hub airports for local and regional economic development (MacKinnon et al., 2008; Liang et al., 2016). Previous studies related to airport competitiveness focus on three major aspects: 1) designing the evaluation index system (Zeng et al., 2012; Tang and Li, 2019; Qin, 2020); 2) empirical evaluation of single airport competitiveness (Jiang et al., 2013; Luo et al., 2020; He et al., 2021) and 3) influence factors or formation mechanism (Ishizuka, 2014; Choi, 2020; Moura et al., 2020).
In designing the evaluation index system of airport competitiveness, Sarkis (2000) used data envelopment analysis to assess the operations of 44 major U.S. airports based on four resource input indicators (i.e., airport operating costs, the population of airport employees, gates, and runways) and five output indicators (i.e., operating revenues, passenger traffic, commercial and general aviation movements, and total cargo traffic efficiency). Based on big system cybernetics, Zhang et al. (2012) construct an evaluation index system (e.g., passenger throughput, number of navigable cities, geographical location, and airspace conditions) for regional multi-airport coordinated development in the Yangtze River Delta region. Chao and Yu, 2013 developed a quantitative evaluation model to analyze the air cargo competitiveness of 10 major airports in Asia-Pacific from different dimensions (air carrier capacity, airport facilities and operations, and economic development). Liang et al. (2016) designed a systematic evaluation method to evaluate the competitiveness of 42 airports in China by the entropy weight, grey correlation, principal component, and cluster analysis by constructing 30 airport competitiveness evaluation indexes from two dimensions: airport development and location conditions with 30 indexes concerning seven significant factors (i.e., facility construction, operation scale, management efficiency, urban passenger and cargo distribution, urban traffic development, geographic condition, and government support). The above evaluation index systems provide a reference for constructing the evaluation index of CAAs competitiveness in YREB.
In empirically evaluating the competitiveness of each airport, Park (1997) assessed the geographical characteristics, access systems, environmental impacts, airline operating conditions, regional development, availability of planning implementation, socio-economic impacts, and airport charges of eight major airports in East Asia by a fuzzy language approach. Wu and Wu (2005) established an AHP evaluation system to compare the strengths and weaknesses of the five major airports in Asia-Pacific and proposed some improvement measures for Shanghai Pudong Airport. Cui et al. 2013a proposed the IDCQGA-BP algorithm to evaluate the competitiveness of eight airports in the Yangtze River Delta from 2011 to 2015. Huynh et al. (2020) measure the efficiency of major airports in Southeast Asia to compare and analyze the competitiveness of these airports in regional development through a two-stage method. Sydorenko et al. (2021) assess the competitiveness of the production infrastructure of international airports in the global aviation market by the comprehensive situational model. The main purpose of creating and implementing an evaluation system is to facilitate the successful implementation of the competitiveness management functions of the production infrastructure of international airports in the global aviation market.
In analyzing the influencing factors of airport competitiveness, Pels et al. (2003) constructed nested logit models to study competition among airports in the San Francisco Bay Area and revealed that access time is vital in competition among airports in this region. McLay and Reynolds, 2006 studied the economic impact caused by the new initiative of introducing terminal competition at Dublin Airport. In addition to being closely related to the regional economy, geographic and demographic factors, market structure, social factors, and air transport market maturity are also important factors closely related to airport development (Demirsoy, 2012). Zietsman and Vanderschuren (2014) surveyed the airport development stakeholders and found that socio-economic development, urban planning, transportation improvement and efficiency, environmental protection, and financial capacity all influenced airport development and operations, with socio-economic development as the most influential factor. Cui et al. 2013b, 2016) constructed an index system of airport competitiveness from four aspects (i.e., regional development, production factors, demand conditions, and supporting industries) and studied the dynamic formation mechanism of airport competitiveness based on 25 airports in China from 2006 to 2010 by structural equation modelling and system dynamics methods and found that the two most important factors affecting airport competitiveness, namely, airport investment and urban research development investment.
Based on the above analysis, for the airport competitiveness evaluation, scholars have chosen various methods and a sound index system. These studies basically cover the operational scale, connectivity, service quality level, operation management, economic efficiency, and development environment of airports and provide some theoretical references. However, the current relevant research also has certain shortcomings. Firstly, in the comprehensive empirical evaluation of airport competitiveness, more attention is paid to all airports within countries or large hub airports in geographically adjacent areas. Rare research is conducted on the airport competitiveness in important economic regions within one country, e.g., the YREB in China. Secondly, studies on the evaluation of airport competitiveness or its influencing factors are mainly carried out from the time scale, which can only clarify the level of competition and positive and negative influencing factors of airports within a specific time range. Still, they cannot meet the needs of coordinated development, mutual promotion of airports in a certain area, and balanced airport layout. The spatial autocorrelation approach helps to solve the above problems and has been widely used in various research fields to explore the dynamic characteristics of regional differences and spatial structures (Liu et al., 2017; Jin et al., 2018; Jing et al., 2018; Cui et al., 2021; Zhang et al., 2021). Compared with traditional data ranking of different airports’ competitiveness on the time scale, spatial auto-correlation analysis reveals the regional structure of spatial variables. It is an important indicator to test whether the attribute values of a certain element are correlated with the attribute values of its adjacent spatial units (Zhao et al., 2012; Darand et al., 2017; Hu et al., 2020; Chen., 2021). Adopting spatial auto-correlation analysis in evaluating airport competitiveness helps observe the interdependence of all airports in YREB in a specific spatial range; meanwhile, it can explore the interaction of a single airport with other airports within a certain spatial unit. Although it has advantages in regional airport coordination and layout optimization, few studies on the competitiveness analysis of CAAs have adopted this method. Therefore, this paper aims to comprehensively evaluate the competitiveness of civil aviation airports (CAAs) in the Yangtze River Economic Belt (YREB) from the lens of tempo-spatial dynamics towards the orderly and coordinated development in YREB.
The Yangtze River has a total length of 6,300 km and a watershed area of 180 km2, accounting for about 1/5 of the country’s total area. With various terrain types (i.e., plateaus, mountains, rivers, lakes, and basins), it runs through most of China’s eastern, central and western regions, spanning the subregions of Three Gradient Terrains of China (TGTC). The Yangtze River flows from upstream to downstream through the Qinghai-Tibet Plateau, the Yunnan-Guizhou Plateau, the Sichuan Basin, and the middle and lower reaches of the Yangtze River Plain, creating various natural sceneries with mountains, seashores, rivers, canyons, and lakes, etc. As a significant national strategic development region, the YREB promotes the coordinated development of East, Central, and West China. This area stretches from Shanghai in East China to Yunnan in West China, connecting 43 cities in 11 provinces or provincial-level municipalities along the Yangtze River (except Qinghai and Tibet), with 1,482,300 km2, accounting for 15.44% of the national territorial area. According to the Statistical Communiqué of the People’s Republic of China on the 2021 National Economic and Social Development released by China’s National Bureau of Statistics and the statistical communiqué of the 11 provinces or provincial-level municipalities in YREB, China’s GDP was 114.37 trillion yuan, while the regional GDP of YREB reached 53.02 trillion yuan in 2021, nearly half of China’s total economy. YREB is the region with the fastest economic development and the area with the highest potential for future economic growth in China. With the implementation of the national strategy of developing YREB, the region has been given the new strategic mission of being the main battlefield of ecological priority and green development, the main artery of smoothing domestic and international circulation, and the main force of leading high-quality economic development.
YREB contains three major economic zones, namely the Yangtze River Delta Economic Zone (Shanghai, Zhejiang, Anhui, Jiangsu), the Middle Yangtze River Economic Zone (Hubei, Hunan, Jiangxi), and the Chengdu-Chongqing Economic Zone (Sichuan, Chongqing, Yunnan, Guizhou), shown in Figure 1. The above three economic zones are developed areas in China with a large population, rich tourism resources, and frequent internal and international exchanges contributing to the rapid development of transportation in YREB. At the same time, transportation is also a vital factor in promoting the regional economy. As China’s opening-up highland, YREB’s civil aviation transportation is playing a power source, which is mutually promotive with regional development (Sun et al., 2018). By the end of 2019, a total of 86 CAAs were opened in this study area, accounting for 36.1% of the national CAAs, which completed 567 million passenger trips, 7,956,400 tons of cargo and mail throughput, and 4,780,400 landings and takeoffs. Concerning the spatial distribution density at the city level, the average number of airports in the upstream, midstream, and downstream cities are respectively 0.83, 0.56, and 0.39, with the upstream region taking the lead. However, concerning airport hierarchy, 14 of 28 high-level airports in the YREB are located in the Yangtze River Delta Zone, accounting for 60.9% of the total number, while airports in the middle and upper reaches of YREB are 6 and 8, accounting for 37.5 and 20.5% respectively. The Yangtze River Delta Zone has an outstanding advantage in airport quality (Bian et al., 2020).
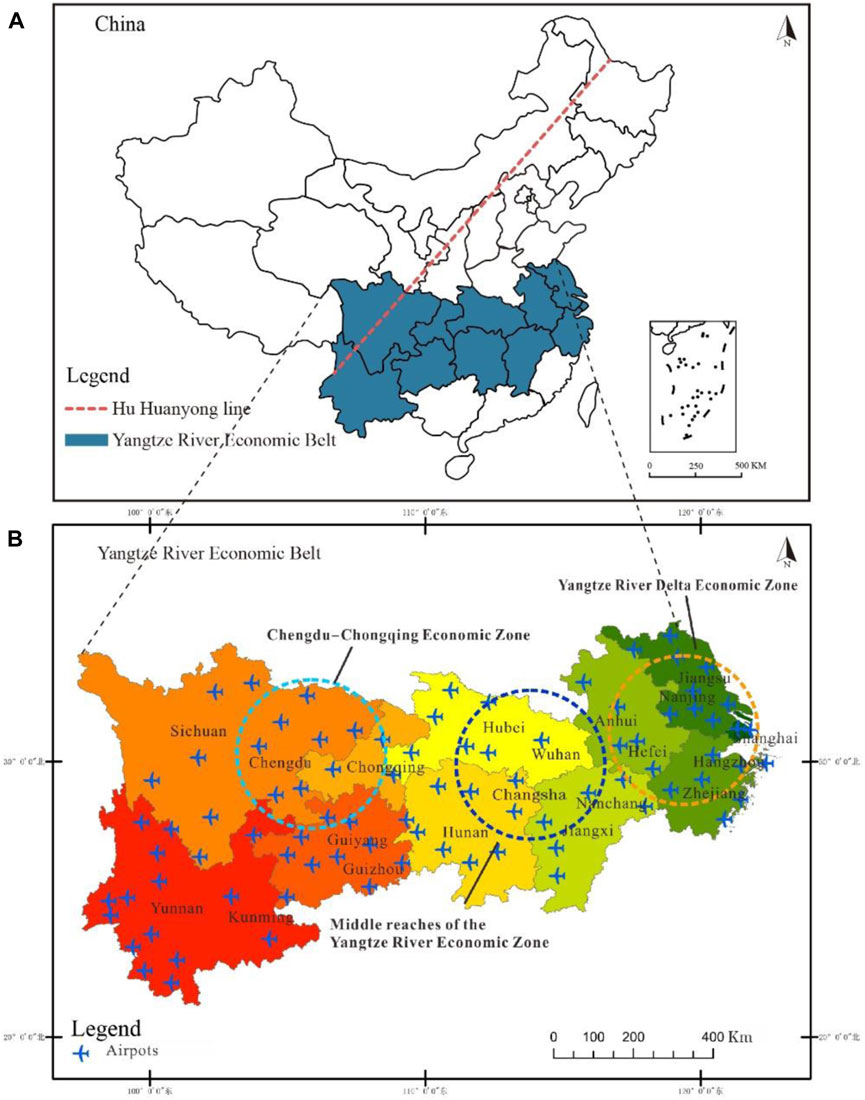
FIGURE 1. Study site.: (A) China; (B) the Yangtze River Economic Belt.
This study targets 86 CAAs in 11 provinces or provincial-level municipalities of YREB. ArcGIS 10.6 is used to draw the spatial structure map required for the study, whose base map data are selected from the National Basic Geographic Database of the National Basic Geographic Information Center of the Ministry of Natural Resources. In this study, nine specific indexes were selected, namely, the passenger throughput, cargo and mail throughput, takeoffs and landing movements, the number of international routes, the number of domestic routes, the number of navigable cities, the grade of airports, the area of terminal buildings and the number of airplane slots. The data of passenger throughput, cargo, and mail throughput, and landing and takeoff sorties are obtained from the Production Bulletin of Civil Aviation Airports in 2011, 2016, and 2020; the data of international and domestic routes indicators are obtained from the official websites of CAAs; and the data of takeoffs and landing movements, the number of navigable cities, the grade of airports, the area of terminal buildings and the number of airplane slots are from Baidu encyclopedia website.
The spatial-temporal patterns of 86 airports’ competitiveness in YREB are studied by the following methods.
The entropy weighting method is an objective assignment method to determine the weight of indicators (Stoyanets et al., 2020). To reflect the competitiveness level of CAAs in YREB, the raw data are processed by deviation standardization. Then the index weights are determined with the entropy weighting method to obtain a comprehensive index of CAAs’ competitiveness (Xiong and Wang, 2018; Liang et al., 2019; Wang et al., 2020; Liu et al., 2021; Pan et al., 2021). The first step is the dimensionless processing of data. Because the nine indicators selected in the study are consistent with the meaning of the competitiveness representation of CAAs. All of them are positive indicators, and Equations 1, 2 are used to standardize the data.
In the above Equations
The second step is to calculate the indicators after standardization to derive the comprehensive index of each indicator in the comprehensive benefit evaluation. The specific equations are as follows.
In Equation 3,
Spatial autocorrelation analysis is a quantitative description of the state of spatial association of geographical data between things. The result is either correlated, random, or insignificant by calculating spatial autocorrelation indices (Liu et al., 2017; Chen, 2021).
This study chooses the global Moran index and local LISA to measure the spatial agglomeration characteristics of CAAs. The global spatial auto-correlation mainly tests the overall spatial correlation of all CAAs in YREB. In contrast, the local LISA mainly tests a single CAA’s local spatial distribution correlation and agglomeration. The equations are as follows (Jin et al., 2018; Carracedo, 2021; Kim and Song, 2021).
In Equation 5,
The Theil index, also known as the Theil coefficient or short for Theil, was first proposed by Theil and Henri in 1967. It is often used to quantitatively describe the equilibrium of economic development and income distribution (Klophaus and Lauth, 2022). Though both Theil index and local spatial autocorrelation can reflect inter-regional disparity, their differences exist. First, the local spatial autocorrelation analysis characterizes the disparity at the spatial scale, while Thiel index presents the disparity from a statistical view. Second, the former focuses on the competitiveness differences of 86 specific airports in YREB from a micro perspective, while the latter focus on the competitiveness differences at a macro level, that is, among the three major economic zones (i.e., the Yangtze River Delta Economic Zone, the Middle Yangtze River Economic Zone, and the Chengdu-Chongqing Economic Zone). Therefore, this research selects the Theil index to measure the difference in the CAAs’ competitiveness in YREB. The equations are as follows.
In Equations 7–9, Ii/I represents the ratio of the composite index sum within a region to the composite index sum within all areas. Ni/N represents the ratio of the number of airports in a region to the number of airports in all regions. Iij represents the composite index of province j in region i. Nij represents the number of airports in province j in region i. Tb, Tw, and TP represent the Thayer index of inter-regional differences, intra-regional differences, and overall inter-provincial differences.
After specifying the weights, the comprehensive index of CAAs’ competitiveness in YREB is calculated by the entropy weighting method. As shown in Table 1 and Figure 2, the sum of the comprehensive evaluation indexes in 2009, 2014, and 2019 are 4.88, 5.89, and 20.245, respectively. The comprehensive competitiveness of CAAs in YREB has increased significantly in the past 10 years. It is also found that in the comprehensive index of airport competitiveness of both the overall region of the Yangtze River Economic Belt and each single airport, the growth rate of competitiveness from 2009 to 2014 is much smaller than that from 2014 to 2019. The growth rate in the first 5 years is less than 50%, and the growth rate in the next 5 years is more than two times. The reason is that, on the one hand, due to the difficulty and periodicity of airport construction, there are fewer major changes in the short term, but more significant changes in the long term; on the other hand, the development plan for YREB has evolved from “promotion” to “in-depth promotion” and then to “comprehensive promotion” at the three symposiums on the development of the YREB held by China’s General Secretary Xi Jinping in 2016, 2018 and 2020 respectively. Such high-level progressive planning has brought more political benefits and better development prospects. As shown in Figure 2, the competitiveness layout of CAAs in YREB is featured as “strong in the east and west, weak in the middle” (Jin et al., 2018). The coastal cities in YREB have the most competitive CAAs, consolidating the leading position of the Yangtze River Delta airport cluster. In 2019, the Yangtze River Delta region possesses seven 10-million-passenger-throughput airports (i.e., Shanghai Pudong, Shanghai Hongqiao, Nanjing Lukou, Hangzhou Xiaoshan, Hefei Xinqiao, Wenzhou Longwan, and Ningbo Lishe International Airports), completing a total of 248 million passenger throughput which is much higher than the second-placed Beijing-Tianjin-Hebei airport cluster of 145 million passengers. In terms of future development, metropolitan areas will become the main form of city cluster competition and cooperation. In addition, airport cluster competition and cooperation will expand from central cities and single airports to metropolitan area airport systems, which features a highly mature stage of development of city clusters and airport clusters. Sichuan and Yunnan CAAs in the upstream are the second most competitive. Benefiting from the well-developed domestic route network and the rich tourism resources in the southwest, Sichuan and Yunnan airports in the upstream region are the second most competitive. By 2019, the Chengdu-Chongqing airport cluster had become the following “potential stock” after the three world-class airport clusters in Beijing-Tianjin-Hebei, Yangtze River Delta, and Guangdong-Hong Kong-Macao. Although the overall competitiveness of the airport in the central region is the weakest, it plays the role of linking the east with the west as well as communicating between the north and the south. The airport development of the central region is expected to boost by building a “dual hub” system for passengers and cargo, relying on the original characteristics of air cargo.
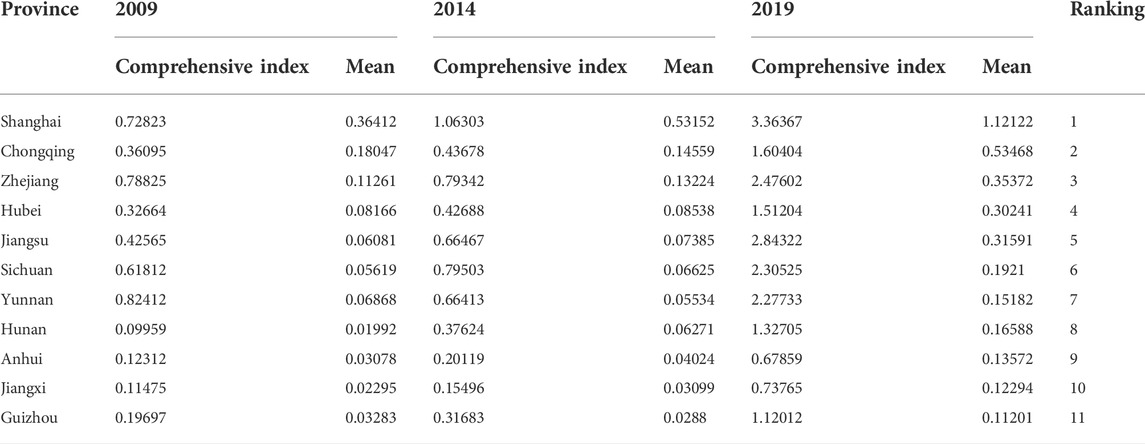
TABLE 1. Provincial ranking of the CAAs comprehensive index in YREB.
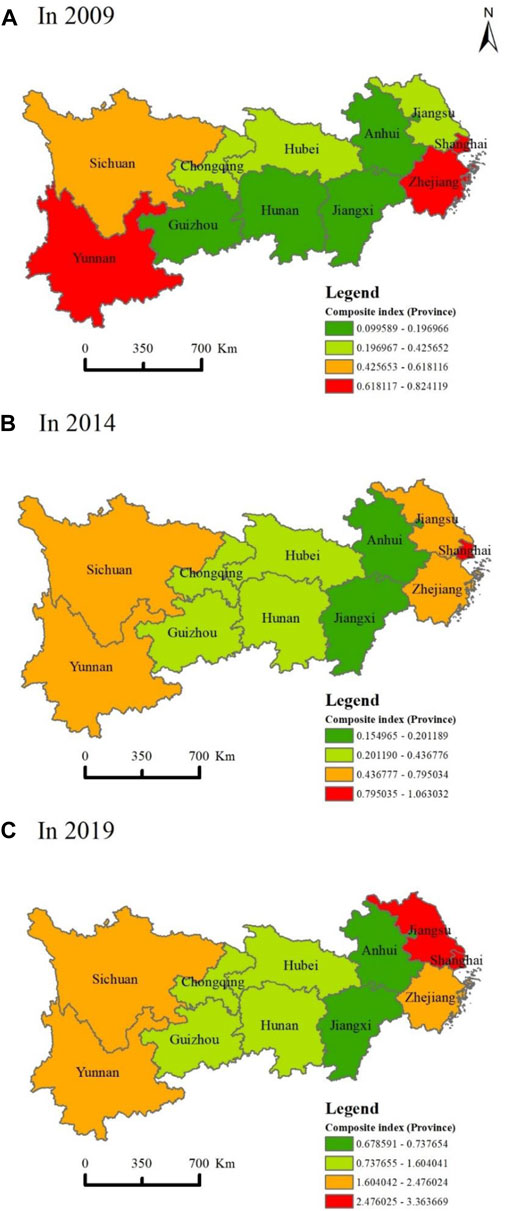
FIGURE 2. Provincial-level comprehensive index of CAAs in YREB: (A) 2009; (B) 2014; (C) 2019.
The CAAs in YREB has formed a relatively distinct hierarchical structure at both provincial and municipal level. First, the comprehensive competitiveness of CAAs in Shanghai and Zhejiang has long been in the lead. The huge demand for civil aviation carriers is indispensable from solid economic strength, superior foreign trade location, and the high consumption level of residents. Second, the overall competitiveness of Sichuan, Jiangsu, and Yunnan is also high, but the trends in the decade vary. CAAs in Yunnan occupied a prominent position because other transport modes were initially restricted due to the complex and rugged geographical conditions. However, with economic development and technological breakthroughs, the competitiveness of CAAs is gradually weakening as other transportation modes are improving. Jiangsu is located on the eastern coast, with a superior location adjacent to Shanghai, with a substantial economic radiating effect.
Moreover, the expansion of airports such as Nanjing Lukou Airport has laid the foundation for domestic and foreign trade and an open economy. Therefore, its comprehensive competition has increased significantly, which is second subsequent to Shanghai in 2019. Furthermore, Sichuan has been in a steady development stage for a long time since 2009. Third, the competitiveness of CAAs in Chongqing, Hubei, Guizhou, and Hunan is at a medium-to-low level. Except for Hunan, the improvement of capacity supply due to the conversion, expansion, and construction of Changsha Huanghua and other provincial airports has prompted its development and competitiveness within 1 decade. Although the overall competitiveness of other three provinces has improved, the regional rankings are stable. Fourth, Jiangxi and Anhui have always been most disadvantaged concerning the comprehensive competitiveness of CAAs in the YREB.
Figure 3 shows the comprehensive index of CAAs in 2009, 2014, and 2019, respectively. Each dot represents one single CAA. Different colors indicate the competitiveness level of airports. From high to low, competitiveness is reflected as red-orange-light green-dark green. It can be seen that, with the total index of each CAA increasing in the past 10 years, the competitiveness has been significantly enhanced. The airport cluster in the downstream Yangtze River Delta region is characterized by high-high competitiveness. The competitiveness of airports in the midstream cities develops to middle-to-high competitiveness. Among the upstream cities, the competitiveness of airports in Chengdu, Chongqing, and Kunming is high. In contrast, the competitiveness of other airports is still weak.
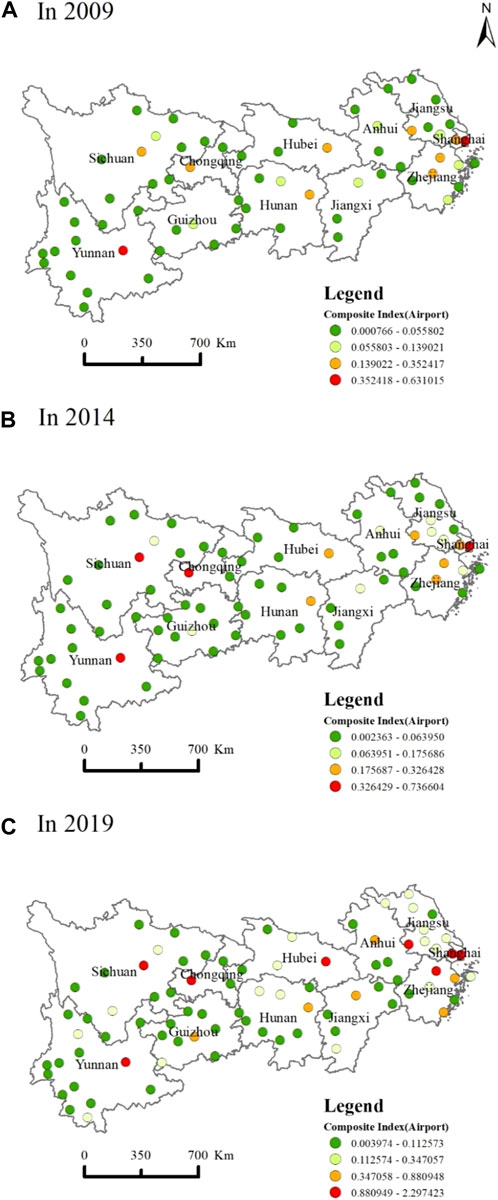
FIGURE 3. The composite index of the CAAs in YREB. (A) 2009; (B) 2014; (C) 2019.
In 2009, Shanghai Pudong International Airport and Kunming Changshui International Airport were the most competitive in 2009, followed by Chongqing Jiangbei, Chengdu Shuangliu, Wuhan Tianhe, and Changsha Huanghua International Airports in the middle and lower reaches. Most of the other airports were at a weak level of competitiveness. In 2014, the competitiveness of CAAs in the Chengdu-Chongqing city cluster in the upper reaches of the Yangtze River has been significantly improved, which can be seen in the transformation of Chengdu Shuangliu and Chongqing Jiangbei International Airport into red circles. Benefiting from the developed service industry and strong foreign trade demand boosted by the integration strategy of Chengdu and Chongqing, the competitiveness of the midstream city cluster has increased exponentially. But the overall color field shows that the single airport competitiveness still has much room for improvement. In 2019, the comprehensive index value of each airport expands, and the competitiveness of regional airports continues to enhance. Compared with 2014, three more red dots are added in 2019, including Nanjing Lukou International Airport, Hangzhou Xiaoshan International Airport, and Wuhan Tianhe International Airport. The former two make it more remarkable in terms of clusters of highly competitive airports in the downstream Yangtze River Delta region. The latter is located in the middle of the area, east of the Hu Huanyong Line, with a large regional flow of passengers. The regional airport, Wuhan Tianhe International Airport, has undergone rapid development, boosted by the strategy for the rise of the central region.
Based on the overall index data of CAAs in the YREB in 2009, 2014, and 2019, the univariate Moran’s I module of GeoDa spatial analysis is used to calculate the global Moran index for quantifying the spatial correlation of each CAA development in YREB. Table 2 shows that the absolute value of Z is greater than 1.96 at the significance level of 0.05 (by 95% confidence test), indicating a significant autocorrelation of spatial elements.
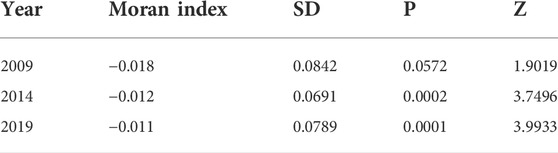
TABLE 2. Global moran index of CAA competitiveness in the YREB.
The global Moran indexes of civil CAAs in YREB for 2009, 2014, and 2019 are -0.018, -0.012, and -0.01. The result indicates a negative spatial autocorrelation in CAAs’ development strength. That is, airports with superior strength and weaker strength are more likely to gather in space. The reason is that China’s airports can be divided into three main categories: hub, trunk, and feeder. There will be one or two hub airports with solid strength in a particular region, where several weak trunk airports and feeder airports are distributed. And they are spatially clustered.
Figure 4 spatializes the local spatial autocorrelation analysis of civil aviation airports in YREB. The Local Moran’s I module of the ArcGIS 10.6 is used to calculate the local LISA index in 2009, 2014, and 2019. The improvement of the overall competitiveness index of CAAs in YREB from 2009 to 2019 has facilitated the trend of local spatial clustering in the region. The cluster of high-high competitiveness has been in the Yangtze River Delta Economic Zone for a long time. It has changed from the “Shanghai-Hangzhou”, a highly competitive development pole, to “Shanghai-Hangzhou-Nanjing” and extends to central Jiangsu Province. The airports of provincial capitals and secondary cities form clustered areas of high-low competitiveness, indicating that the provincial capital city airports are the provincial core area of competitiveness development. The clustered area of low-low competitiveness covers the Yunnan-Guizhou Plateau to cities of the middle reaches, which shows that the CAAs’ competitiveness in YREB still needs to be improved through certain spatial planning strategies.
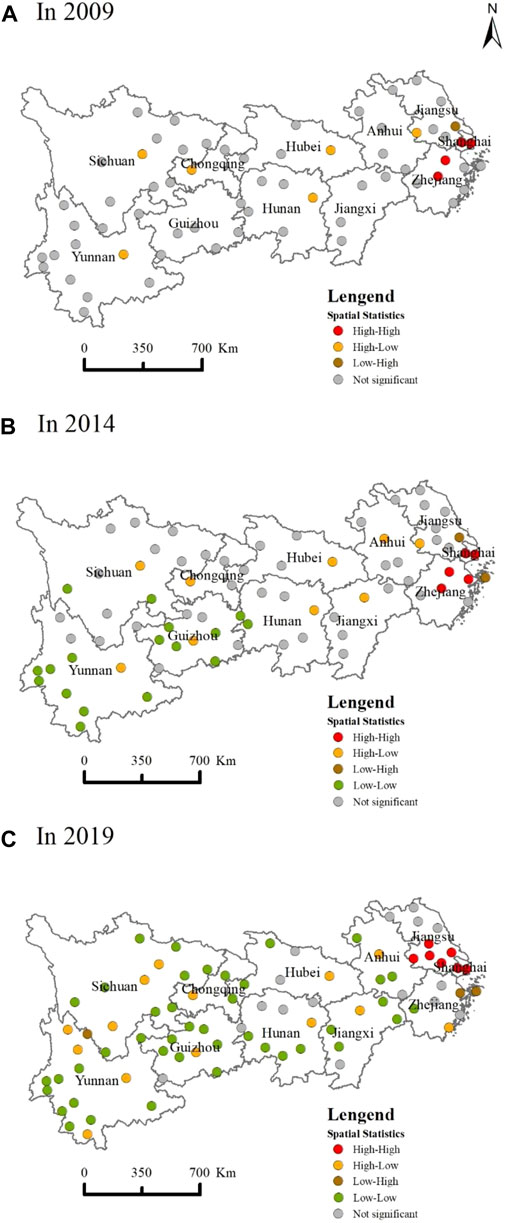
FIGURE 4. Local clustering characteristics of CAAs in YREB: (A) 2009; (B) 2014; (C) 2019.
In 2009, 82.8% of the CAAs showed an insignificant spatial cluster. Four of the airports form a cluster area with high-high competitiveness, namely Shanghai Pudong International Airport, Shanghai Hongqiao International Airport, Hangzhou Xiaoshan International Airport, and Yiwu Airport. Six CAAs, all located in provincial capitals, form a cluster of high-low competitiveness. Compared with other provincial airports, these are featured with high level, good accessibility, strong distribution capacity, well-connected cities, and wide radiation range, forming the competitiveness center of the lagging area. Though Nantong Xingdong Airport has surpassed more than 70% of the airports in the region, it is a weak unit in an area with solid regional competitiveness due to its geographical constraints and its adjacent location to clusters of high-high competitiveness, namely, Shanghai, Zhejiang, and Jiangsu. In 2014 the high-high, high-low, and low-high clusters remain the same with more airports covered. A cluster of high-high competitiveness has formed a “Shanghai-Hangzhou” highly competitive developing pole. The low-high cluster includes Zhoushan Putuoshan airport. Average CAAs in Yunnan and Guizhou have formed a cluster of low-low competitiveness, a contiguous lagging place in the competitiveness ranking within the region. In 2019, 80.5% of the airports are locally clustered in terms of the competitiveness. The cluster of high-high competitiveness takes Shanghai as the center to link Hangzhou and gradually spreads to the middle of Jiangsu Province, forming a “Shanghai-Hangzhou-Nanjing” high-competitive developing pole, covering Nantong Xingdong International Airport. Fourteen CAAs form a cluster of high-low competitiveness, indicating a backward unit in the competitiveness ranking of CAAs in YREB. In addition to the provincial capital airports with clustering capacity, airports adjacent to the provincial capital airport, airports with a particular trading strength and source market stand out from the local spatial competitiveness ranking. There are two clusters of low-low competitiveness: Ningbo Lishe International Airport, Zhoushan Putuoshan Airport, and Ninglang Luguhu Airport. Therefore, clustered areas of low-low competitiveness spread from the airport in the upper reaches to the airports in the middle and lower reaches, forming a contiguous lagging area.
To further explore the interregional difference and temporal evolution of CAA competitiveness in YREB by the Theil index, this study takes provinces and economic zones as research units. Table 3 shows the inter-regional, intra-regional, and overall inter-provincial differences among CAAs in the three major zones of YREB in 2009, 2014, and 2019.
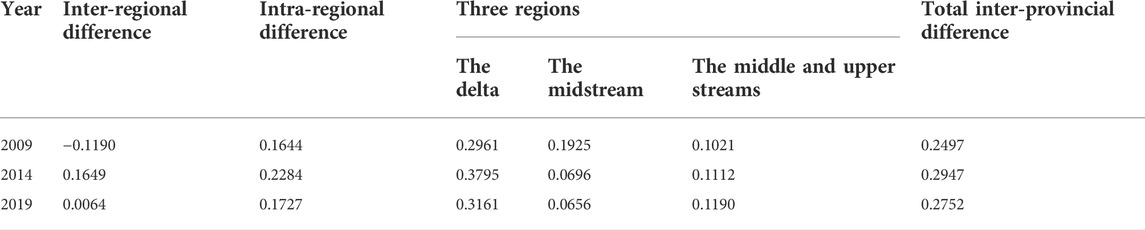
TABLE 3. Theil index measurement and contribution rate decomposition.
Taking the YREB as a whole, the total inter-provincial differences show a fluctuating trend, with the overall difference first expanding and then shrinking. The increase in inter-provincial differences from 2009 to 2014 is due to the rapid development of the international and regional leading airports in YREB, while other feeder airports are still lagging. In addition, the inconsistency of airport development in the region caused by the incompatible number of airports with the regional economic growth sharpens the disparity in competitiveness. The narrowing of inter-provincial differences from 2014 to 2019 is due to the gradual development of feeder airports in YREB and the strong follow-up momentum, narrowing the gap between the leading regional and feeder airports. The variation trend of inter-regional and intra-regional differences in the Theil index is consistent with the overall competitiveness gap (i.e., expanding before shrinking). The change of inter-regional differences is because the three major regions show a chronological sequence of development in the past decade, the Yangtze River Delta progressed first, the Midstream Economic Zone, and the Middle and Upper Reach of Economic Zone followed. The inter-regional change is because each region has provinces with precedence in development over other provinces within 10 years.
Specific to the three major zones, the Theil index of the competitiveness of CAAs in the Yangtze River Delta Economic Zone is the largest, which is the dominating factor affecting regional differences, followed by the Middle and Upper Reaches of the Yangtze Economic Belt. A stepped competitiveness difference has formed with Shanghai in the lead, followed by Jiangsu and Zhejiang with a large gap compared with Shanghai. Anhui is the weakest in competitiveness. The competitiveness difference between airports in the middle and upper reaches of YREB is the slightest because Hubei, Hunan, and Jiangxi airports are weak in terms of overall competitiveness.
In general, there are differences in the CAA competitiveness of YREB in 2009, 2014, and 2019. And the competitive differences exist both in the three major zones, namely, the Yangtze River Delta Economic Zone, the Midstream YREB, and the Upper and Middle YREB. From the perspective of overall trends, the inter-provincial and inter-zonal differences in the CAA competitiveness of the YREB show a fluctuating trend, with the level of differences first expanding and then narrowing. From the inter-provincial and zonal perspectives, the difference in the CAA competitiveness has developed from inter-provincial hierarchical differences to inter-regional differences. For the contribution of the three major zones, regional differences are mainly manifested in the Yangtze River Delta Economic Zone, followed by the Middle and Upper Yangtze Economic Zone, and finally the Midstream Yangtze Economic Zone.
This study comprehensively evaluates the competitiveness of CAAs at the provincial level of YREB and spatializes their spatio-temporal evolution in 2009, 2014, and 2019. The research findings are as follows.
1) From 2009 to 2019, the comprehensive competitiveness of CAAs in YREB has increased remarkably, showing a distribution characteristic of “strong in east and west, weak in central”. The provincial-level distribution of the civil CAAs competitiveness in YREB has formed a relatively distinct hierarchical system. Shanghai and Zhejiang are in the first tier, with Sichuan, Jiangsu, and Yunnan in the second tier, Chongqing, Hubei, Guizhou, and Hunan in the third, and Jiangxi and Anhui in the fourth tier. In terms of single airports, the competitiveness in central cities per province has increased the most. The airports in the downstream Yangtze River Delta region are highly clustered, and the competitiveness of airports in midstream city clusters develops to medium-to-high intensity. The upstream city clusters have Chengdu and Chongqing as the core of high competitiveness of CAAs, while the competitiveness of other airports in this region is still weak.
2) The global Moran Index shows spatial auto-correlation of CAAs in YREB is negative in 2009, 2014, and 2019. That is, highly competitive airports and uncompetitive airports are more likely to be spatially clustered. At the same time, the local Moran index shows that the local spatial cluster in the region from 2009 to 2019 has become more and more distinct. The clustered area of high-high competitiveness has been located in the Yangtze River Delta Economic Zone for a long time, converging from the “Shanghai-Hangzhou” high-competitive development pole to “Shanghai-Hangzhou-Nanjing” and further extends to central Jiangsu Province. The provincial capitals CACs and sub-city airports form a clustered area of high-low competitiveness; clustered areas of low-low competitiveness spread from the Yunnan-Guizhou Plateau to urban cities in the middle reaches of the Yangtze River.
3) From 2009 to 2019, spatial heterogeneity exists in terms of the competitiveness of CAAs at the provincial level in YREB among the three major zones (i.e., the Yangtze River Delta Economic Zone, the Midstream Yangtze River Economic Zone, and the Upper Middle Yangtze River Economic Zone). In terms of the overall evolution trend, the Thiel index shows fluctuations, namely, increasing first and then decreasing. The Yangtze River Delta Economic Zone is the dominating region affecting the level of spatial heterogeneity. From the inter-provincial and inter-zonal perspectives, the differences in the CAAs competitiveness develop from an inter-provincial hierarchical difference to an inter-regional integration.
Theoretically, this study comprehensively evaluates the competitiveness of CAAs in YREB. Methodologically, this research applies the classic tempo-spatial analytical method to spatialize the spatial-temporal pattern of CAAs. Practically, the study site is enriched in YREB. The limitations of this study are: 1) all data adopted are second-hand, which tends to be with low timeliness; 2) The research objects are airports in YREB and a larger spatial scale could better reflect the spatial distributional regularities, e.g., in the whole China. More case studies (e.g., other regions in China or other countries) should be considered to verify or discover more regularities. 3) This study involves the decade 2009–2019 and did not consider the impact of COVID-19 which erupted in 2020.4) The time span is 5 years, namely 2009, 2014, and 2019. A yearly analysis needs further exploring. Taking the impact of COVID-19 into consideration, the following research will explore airports’ competitiveness evolution at multiple spatial scales, e.g., in other regions of China or even around the world over a longer period. Based on analyzing the mechanisms behind the evolution and the interactions of various influencing factors, the following research aims to improve airport competitiveness evaluation by involving more factors from a systematic perspective in further studies.
Based on investigating the competitiveness and spatial interdependence of CAAs in YREB, it is found that there is an unbalanced layout of competitiveness at multiple spatial scales, namely, the zonal spatial scale, the provincial scale, and the single airport scale. Therefore, it is necessary to make the competitive strategies of CAAs from different spatial dimensions for building a hierarchical CAAs system with a reasonable layout and excellent functions towards maximizing the competitive advantages of airport clusters in the YREB.
First of all, for the three zones in the upper, middle, and lower reaches of the YREB, the Yangtze River Delta Economic Zone is the leading region affecting the spatial heterogeneity of airport competitiveness, and it should play its leading role in the development of CAAs in the entire YREB, and continue to promote the effect of domestic and international dual circulation on trade, economic development, international exchange, and cooperation. Specifically, airports in the upper reach region should seize the development opportunity of the “Chengdu-Chongqing” city cluster, and progress the construction of regional and feeder airports to achieve better integration into the synergistic regional development. Relying on the original air cargo, airports in the middle reach should build a “dual hub” system of air passengers and cargo based on its natural geographical location of linking the east and the west, communicating with the north and the south to boost its development. Secondly, at the provincial spatial scale in the YREB, airports in the central cities and featured cities with rich tourism resources play a crucial role in improving the competitiveness of airports in the whole province. Eleven provinces or provincial-level municipalities in the YREB should grasp the trend of expanding airport cluster competition and cooperation from central cities and single airports to metropolitan area airports system and take airports with strong competitiveness in the province as the core to drive the airports in the adjacent geographic areas. Alternatively, the airports in the vicinity of the central cities should develop joint provincial cooperation to build a metropolitan area airport cluster. Under solid competition in the domestic aviation market, expanding international airline markets will promote the metropolitan airport cluster to be a “stabilizer” and “builder” of the aviation market order. In terms of each single airport in the YREB, evaluating the competitiveness of CAAs facilities the application of specific policies, and hierarchical development of airports.
The last but not the least, as the international hub airports and domestic backbone airports are at the core of the three zones of the YREB, they should actively adapt to the new development pattern that mainly relies on the domestic cycle and mutually promotes the domestic and international dual cycle, emphasizing regional synergy and epidemic prevention and control. For regional medium-sized and feeder airports that are less competitive, clearer development goals are needed, for example, taking advantage of their spatial dependence on strong airports to take over the overcapacity. Moreover, breakthroughs in regional medium-sized and feeder airports can be made by improving their capacity and differentiating competition with distinctive services, brand building, and active market development.
The development of civil aviation airports (CAAs) affects the advancement of the regional economy to a certain extent. Exploring the competitiveness and spatial-temporal imbalance of CAAs in the Yangtze River Economic Belt (YREB) is conducive to optimizing the airport layout and promoting the coordinated development of urban agglomerations along the YREB. To fill the research gap of lacking the tempo-spatial insights into the CAAs’ competitiveness, this research maps the dynamic changes of 86 CAAs’ competitiveness in YREB based on the competitiveness evaluation by the entropy weight approach, spatial auto-correlation analytical technique and Theil index measurement respectively. This research is concluded that: 1) The comprehensive competitiveness of CAAs in the Yangtze River Economic Belt increased significantly from 2009 to 2019, showing that provinces in East and West China are more competitive in terms of airports competitiveness compared with provinces in Central China. 2) Superior and inferior airports are likely to be spatially clustered. Moreover, CAAs in provincial capitals and secondary cities form high-low cluster areas. 3) From 2009 to 2019, spatial differences in CAA competitiveness exist, among provinces of the Yangtze River Economic Belt, or within the three major zones (i.e., the Yangtze River Delta Economic Zone, the middle reaches of the Yangtze River Economic Zone, and the middle and upper reaches of the Yangtze River economic zone). 4) The interprovincial civil aviation airport competitiveness fluctuates, with the discrepancy increasing and then decreasing. This research benefits the spatial planning of civil aviation airports in the Yangtze River Economic Belt.
The datasets presented in this study are available from the corresponding author upon request.
YZ conceptualization, methodology, writing original draft preparation; RL software, validation and visualization; XJ resources, data collection, formal analysis and investigation; ML writing, reviewing and editing; YJ supervision and project administration. All authors have read and agreed to the published version of the manuscript.
Shaanxi Provincial Soft Science Research Program (Grant 2020KRM068); Shaanxi Provincial Research Project on Major Theoretical and Practical Issues in Philosophy and Social Sciences (Grant 2021ND0193).
The authors declare that the research was conducted in the absence of any commercial or financial relationships that could be construed as a potential conflict of interest.
All claims expressed in this article are solely those of the authors and do not necessarily represent those of their affiliated organizations, or those of the publisher, the editors and the reviewers. Any product that may be evaluated in this article, or claim that may be made by its manufacturer, is not guaranteed or endorsed by the publisher.
Bian, H. Y., Gao, J., Wu, J. G., Sun, X., and Du, Y. (2020). Hierarchical analysis of landscape urbanization and its impacts on regional sustainability: A case study of the Yangtze River economic Belt of China. J. Clean. Prod. 279, 123267. doi:10.1016/j.jclepro.2020.123267
Carracedo, P., and Debon, A. (2021). Spatiotemporal econometrics models for old age mortality in europe. Mathematics 9, 1061. doi:10.3390/math9091061
Chao, C. C., and Yu, P. C. (2013). Quantitative evaluation model of air cargo competitiveness and comparative analysis of major Asia-Pacific airports. Transp. Policy 30 (30), 318–326. doi:10.1016/j.tranpol.2013.10.001
Chen, Y. G. (2021). An analytical process of spatial autocorrelation functions based on Moran's index. Plos One 16 (4), e0249589. doi:10.1371/journal.pone.0249589
Choi, M. S. (2020). A study on the development and priority analysis of the evaluation index for local airport competitiveness. Int. J. Tour. Hosp. Res. 34 (8), 117–130. doi:10.21298/IJTHR.2020.8.34.8.117
Cui, J. X., Li, R. H., Zhang, L. Y., and Jing, Y. (2021). Spatially illustrating leisure agriculture: Empirical evidence from picking orchards in China. Land 10 (6), 631. doi:10.3390/land10060631
Cui, Q., Kuang, H. B., and Li, Y. (2013a). The evaluation of dynamic airport competitiveness based on IDCQGA-BP algorithm, 1–8. doi:10.1155/2013/309750
Cui, Q., Kuang, H. B., Wu, C. Y., and Li, Y. (2013b). Dynamic formation mechanism of airport competitiveness: The case of China. Transp. Res. Part A Policy Pract. 47 (1), 10–18. doi:10.1016/j.tra.2012.10.021
Cui, Q., Wei, Y. M., Li, Y., and Li, W. X. (2016). Exploring the differences in the airport competitiveness formation mechanism: Evidence from 45 Chinese airports during 2010–2014. Transp. B Transp. Dyn. 5, 325–341. doi:10.1080/21680566.2016.1216811
Cui, Q., Wei, Y. M., Li, Y., and Li, W. X. (2017). Exploring the differences in the airport competitiveness formation mechanism: Evidence from 45 Chinese airports during 2010–2014. Transp. B Transp. Dyn. 5 (3), 325–341. doi:10.1080/21680566.2016.1216811
Darand, M., Dostkamyan, M., and Rehmanic, M. I. A. (2017). Spatial autocorrelation analysis of extreme precipitation in Iran. Russ. Meteorol. Hydrol. 42 (6), 415–424. doi:10.3103/S1068373917060073
Spina, L. D., Scrivo, R., Ventura, C., and Viglianisi, A. (2014). The culture of evaluation to improve the airport competitiveness of the metropolitan city of the strait: Analysis of alternative scenarios of connection. Adv. Mater. Res., 1065–1069. doi:10.4028/www.scientific.net/AMR.1065-1069.3381
Demirsoy, C. (2012). Analysis of stimulated domestic air transport demand in Turkey. Rotterdam: Erasmus University.
He, J. L., Wei, M. H., Yu, H., Yuan, J., and Chen, Y. (2021). Evaluating the rail-based multimodal freight transportation after HSR entry in Yangtze River Delta economics zone. Sci. Program. 2021, 1–14. doi:10.1155/2021/5530343
Hu, L., Chun, Y. W., and Griffith, D. A. (2020). Uncovering a positive and negative spatial autocorrelation mixture pattern: A spatial analysis of breast cancer incidences in broward county, Florida, 2000-2010. J. Geogr. Syst. 22 (3), 291–308. doi:10.1007/s10109-020-00323-5
Huynh, T. M., Kim, G., and Ha, H. K. (2020). Comparative analysis of efficiency for major Southeast Asia airports: A two-stage approach. J. Air Transp. Manag. 89, 101898. doi:10.1016/j.jairtraman.2020.101898
Ishizuka, Y. (2014). Efforts to the tourism-oriented country and strengthening of international competitiveness of airport in Singapore. JAFIT Int. Tour. Rev. 21, 159–165. doi:10.24526/jafit.21.0_159
Jiang, Y., Wang, L., Jiang, X., and Lu, J. (2013). Spatial-temporal evolution of multi-airports’ homogenization in China Yangtze River Delta. Procedia - Soc. Behav. Sci. 96, 1402–1411. doi:10.1016/j.sbspro.2013.08.159
Jin, G., Deng, X., Zhao, X., Guo, B., and Yang, J. (2018). Spatiotemporal patterns in urbanization efficiency within the Yangtze River economic Belt between 2005 and 2014. J. Geogr. Sci. 28 (8), 1113–1126. doi:10.1007/s11442-018-1545-2
Jing, Y., Liu, Y., Cai, E., and Zhang, Y. (2018). Quantifying the spatiality of urban leisure venues in Wuhan, Central China – GIS-based spatial pattern metrics. Sustain. Cities Soc. 40, 638–647. doi:10.1016/j.scs.2018.05.015
Kim, D., and Song, I. (2021). Predicting model improvement by accounting for spatial autocorrelation: A socioeconomic perspective. Prof. Geogr. 73 (1), 131–149. doi:10.1080/00330124.2020.1812408
Klophaus, R., and Lauth, G. J. (2022). Monetary mapping of the climate footprint of air travel to a single airport. J. Air Transp. Manag. 5 (2), 102204. doi:10.1016/j.jairtraman.2022.102204
Liang, X. B., Liang, W., Zhang, L. B., and Guo, X. Y. (2019). Risk assessment for long-distance gas pipelines in coal mine gobs based on structure entropy weight method and multi-step backward cloud transformation algorithm based on sampling with replacement. J. Clean. Prod. 227, 218–228. doi:10.1016/j.jclepro.2019.04.133
Liang, X. Z., Lai, K. K., Liu, J., Qiao, H., Yin, H. X., et al. (2016). Study on the multilayer airport system in China based on evaluation of airport competitiveness. Manag. Rev. 28 (12), 116–126. doi:10.14120/j.cnki.cn11-5057/f.2016.12.010
Liu, X., Guo, P., Yue, X., Zhong, S., and Cao, X. (2021). Urban transition in China: Examining the coordination between urbanization and the eco-environment using a multi-model evaluation method. Ecol. Indic. 130 (1), 108056. doi:10.1016/j.ecolind.2021.108056
Liu, X. J., Xia, S. Y., Yang, Y., Wu, J. f., Zhou, Y. N., and Ren, Y. W. (2020). Spatiotemporal dynamics and impacts of socioeconomic and natural conditions on PM2.5 in the Yangtze River Economic Belt. Environ. Pollut. 263, 114569. doi:10.1016/j.envpol.2020.114569
Liu, Y. L., Jing, Y., Cai, E. X., Cui, J., Zhang, Y., and Chen, Y. (2017). How leisure venues are and why? A geospatial perspective in wuhan, central China. Sustainability 9, 1865. doi:10.3390/su9101865
Lu, Y. N., Li, X. P., and Li, K. X. (2022). Promoting the high-quality development of the Yangtze River Economic Belt the People’s daily, cited from, Available at: http://politics.people.com.cn/n1/2022/0612/c1001-32444082.html (Accessed on July 1, 2022).
Luo, J., Chen, S., Sun, X., Zhu, Y., and Chen, G. (2020). Analysis of city centrality based on entropy weight topsis and population mobility: A case study of cities in the Yangtze River economic Belt. J. Geogr. Sci. 30 (4), 515–534. doi:10.1007/s11442-020-1740-9
Wen, J., Xu, Z. H., and Luo, X. Y. (2022). Evaluation and Empirical Study on competitiveness of Regional Airport Cluster. Aeronautical Computing Technique 51 (05), 10–14. doi:10.3969/j.issn.1671-654X.2021.05.003
MacKinnon, D., Pirie, G., Gather, M., Knowles, R. D., and Shaw, J. (2008). “Transport and economic development,” in Docherty I. Transport geographies: Mobilities, flows and spaces (Malden: Blackwell Publishing).
McLay, P., and Reynolds, F. A. (2006). Competition between airport terminals: The issues facing Dublin airport. Transp. Res. Part A Policy Pract. 40 (2), 181–203. doi:10.1016/j.tra.2005.06.002
Moura, F. H. S. D., Caetano, M., and Severino, M. R. (2020). Airport competitiveness analysis from aircraft and passenger movement. J. Transp. Logist., 143–157. doi:10.26650/JTL.2020.0015
Pan, Z., He, J., Liu, D., Wang, J., and Guo, X. (2021). Ecosystem health assessment based on ecological integrity and ecosystem services demand in the middle reaches of the Yangtze River Economic Belt, China. Sci. Total Environ. 774 (7724), 144837. doi:10.1016/j.scitotenv.2020.144837
Park, Y. (1997). Application of a fuzzy linguistic approach to analyse Asian airports’ competitiveness. Transp. Plan. Technol. 20 (4), 291–309. doi:10.1080/03081069708717595
Pei, T. A., Wu, H. Q., Yang, T. T., Jiang, F., Zhang, W., Zhu, Z., et al. (2021). Evaluation of urban water ecological civilization: A case study of three urban agglomerations in the Yangtze River economic Belt, China. Ecol. Indic. 123, 107351. doi:10.1016/j.ecolind.2021.107351
Pels, E., Nijkamp, P., and Rietveld, P. (2003). Access to and competition between airports: A case study for the san Francisco Bay area. Transp. Res. Part A Policy Pract. 37 (1), 71–83. doi:10.1016/S0965-8564(02)00007-1
Peng, M., Xu, H., Qu, C., Xu, J., Chen, L., Duan, L., et al. (2021). Understanding China’s largest sustainability experiment: Atmospheric and climate governance in the Yangtze River Economic Belt as a lens. J. Clean. Prod. 290, 125760. doi:10.1016/j.jclepro.2020.125760
Qin, G. (2020). An empirical study on the impact of Yangtze River Delta airport cluster on regional economy. Open J. Transp. Technol. 09 (6), 464–475. doi:10.12677/ojtt.2020.96056
Sarkis, J. (2000). An analysis of the operational efficiency of major airports in the United States. J. Operations Manag. 18 (3), 335–351. doi:10.1016/S0272-6963(99)00032-7
Stoyanets, N., Hu, Z. T., Chen, J. M., and Niu, L. C. (2020). Managing sustainability development of the agricultural sphere based on the entropy weight TOPSIS model. Int. J. Technol. Manag. Sustain. Dev. 19 (3), 263–278. doi:10.1386/TMSD_00026_1
Sun, C., Chen, L., and Tian, Y. (2018). Study on the urban state carrying capacity for unbalanced sustainable development regions: Evidence from the Yangtze River economic Belt. Ecol. Indic. 89 (JUN), 150–158. doi:10.1016/j.ecolind.2018.02.011
Sydorenko, K., Sydorenko, O., Lozhachevska, O., and Pashchenko, O. (2021). Competitiveness of international airports production infrastructure in global air transportation market: Comprehensive situational model. Asian Acad. Manag. J. 26 (2), 173–195. doi:10.21315/aamj2021.26.2.8
Tang, D., and Li, Z. J. (2019). Relevance analysis of sustainable development of Yangtze River Economic Belt based on spatial structure[J]. J. Audit Econ. 16 (17), 3076. doi:10.3390/ijerph16173076
Wang, C. Y., Xu, M., Olsson, G., and Liu, Y. (2020). Characterizing of water-energy-emission nexus of coal-fired power industry using entropy weighting method. Resour. Conserv. Recycl. 161, 104991. doi:10.1016/j.resconrec.2020.104991
Wei, Y. E., Hong, J., and Park, D. (2019). Evaluating the competitiveness for major international airports in northeast Asia. KSCE J. Civ. Eng. 23 (2), 844–849. doi:10.1007/s12205-018-0254-9
Wu, X. Y., and Wu, K. Y. (2005). Study on the competency of Shanghai Pudong airport in Asia- pacific ocean with AHP. Logist. Technol. 9, 203–206. doi:10.3969/j.issn.1005-152X.2005.09.068
Xiong, N. X., and Wang, Y. M. (2018). Multiple attribute decision method based on improved fuzzy entropy and evidential reasoning. J. Comput. Appl. 38 (10), 2803–2808. doi:10.11772/j.issn.1001-9081.2018030677
Yu, Y., Zhang, N., and Kim, J. D. (2020). Impact of urbanization on energy demand: An empirical study of the Yangtze River Economic Belt in China. Energy Policy 139, 111354. doi:10.1016/j.enpol.2020.111354
Zeng, J., Wang, C., Song, D., and Sun, G. (2012). Evolution of industrial structure in airport economic zone: Taking hub airports in the Yangtze River Delta as examples. Prog. Geogr. 31 (12). doi:10.11820/dlkxjz.2012.12.014
Zhang, X., Du, Q., Xu, Z. L., and Tao, H. Q. (2012). “Construction of evaluation index system of regional multi-airport coordinated development in the Yangtze River Delta region,” in Proceeding 7th International Conference on Computing and Convergence Technology, 3 - 5 December 2012 (ICCCT), 338–341.
Zhang, Z., Ou, G., Elshkaki, A., and Liu, R. (2022). Evaluation of regional carrying capacity under economic-social-resource-environment complex system: A case study of the Yangtze River Economic Belt. Sustainability 14, 7117. doi:10.3390/su14127117
Zhang, Z. X., Yu, Y., Wang, D., Kharrazi, A., Ren, H., Zhou, W., et al. (2021). Socio-economic drivers of rising CO2 emissions at the sectoral and sub-regional levels in the Yangtze River Economic Belt. J. Environ. Manag. 290, 112617. doi:10.1016/j.jenvman.2021.112617
Zhao, X. F., Huang, X. J., and Liu, Y. B. (2012). Spatial autocorrelation analysis of Chinese inter-provincial industrial chemical oxygen demand discharge. Int. J. Environ. Res. Public Health 9 (6), 2031–2044. doi:10.3390/ijerph9062031
Keywords: civil aviation airport, competitiveness evaluation, spatial analysis, dynamic evolution, the Yangtze River Economic Belt
Citation: Zhang Y, Jin X, Li M, Liu R and Jing Y (2022) Evaluating civil aviation airport competitiveness in the Yangtze River Economic Belt of China: A lens of spatial-temporal evolution. Front. Environ. Sci. 10:994860. doi: 10.3389/fenvs.2022.994860
Received: 15 July 2022; Accepted: 15 August 2022;
Published: 09 September 2022.
Edited by:
Ehsan Elahi, Shandong University of Technology, ChinaReviewed by:
Baishu Guo, China University of Geosciences Wuhan, ChinaCopyright © 2022 Zhang, Jin, Li, Liu and Jing. This is an open-access article distributed under the terms of the Creative Commons Attribution License (CC BY). The use, distribution or reproduction in other forums is permitted, provided the original author(s) and the copyright owner(s) are credited and that the original publication in this journal is cited, in accordance with accepted academic practice. No use, distribution or reproduction is permitted which does not comply with these terms.
*Correspondence: Ying Jing, eS5jcnlzdGFsQG5pdC56anUuZWR1LmNu
Disclaimer: All claims expressed in this article are solely those of the authors and do not necessarily represent those of their affiliated organizations, or those of the publisher, the editors and the reviewers. Any product that may be evaluated in this article or claim that may be made by its manufacturer is not guaranteed or endorsed by the publisher.
Research integrity at Frontiers
Learn more about the work of our research integrity team to safeguard the quality of each article we publish.