 S. Yu
S. Yu S. Fan1
94% of researchers rate our articles as excellent or good
Learn more about the work of our research integrity team to safeguard the quality of each article we publish.
Find out more
ORIGINAL RESEARCH article
Front. Environ. Sci., 01 September 2022
Sec. Environmental Economics and Management
Volume 10 - 2022 | https://doi.org/10.3389/fenvs.2022.994023
This article is part of the Research TopicResource Efficiency and Environmental Impact AssessmentView all 21 articles
The overuse of nitrogen fertilizers in agricultural production in China, resulting in negative impacts on the environment, has become a serious issue. Thus, reducing agricultural nitrogen use has become one of the top priorities for achieving the sustainable development goals of the Chinese agricultural sector. Searching for effective approaches to reduce nitrogen use is essential to agricultural and environmental sustainability. In this study, we selected the Yangtze River Basin as the research area, owing to its critical role in Chinese agricultural production, and established a price endogenous partial equilibrium model to simulate the effect of nitrogen use reduction from nitrogen use optimization (NUO) and nitrogen use efficiency improvement (NUE+). Based on agricultural datasets in 2019, simulation results revealed that 1) NUO helped reduce nitrogen use and nitrogen loss by 6.99% and 7.50%, respectively; if changes in the acreage are considered, then the reduction effect will be less significant; 2) nitrogen use decreased continuously with NUE+, and the reduction rate was 7.85%, 15.38%, 22.65%, and 28.02% under the NUE+10%, NUE+20%, NUE+30%, and NUE+40% scenarios, respectively, and nitrogen loss was highly sensitive; and 3) the crop heterogeneity indicated that cereals are regarded as nitrogen-overuse crops and more sensitive to nitrogen use reduction under the NUE+ scenarios than oil crops. Accordingly, in this study, we suggested that practical NUO and NUE+ policies and incentives are necessary, and flexible adjustment strategies for crop-planting structures, such as enlarging the acreage for cereals, may be useful in reducing nitrogen use in the Yangtze River Basin.
Nitrogen (N) is an essential nutrient for crops and one of the basic elements comprising living creatures (Houlton et al., 2019; Sun et al., 2020). As a major component of fertilizers, N has become the most important material input in global food production. Over the past decades, demand for N fertilizers increased rapidly, owing to the growing population (Liu et al., 2013; Ladha et al., 2016). However, agricultural N use has exceeded sustainable limits, causing massive environmental problems such as surface water eutrophication, groundwater nitrate enrichment, and greenhouse gas emissions (Wu and Chen, 2013; Keisman et al., 2018). As the most populous country in the world, China has exerted considerable effort to guarantee the supply of agricultural products since the early 1980s. During the last 40 years, China’s total grain output increased by over 70%, whereas fertilizer use, especially N fertilizers, more than doubled. Currently, China consumes 27% of global N fertilizers and accounts for the highest quantity of N loss in the world. Therefore, N use reduction is one of China’s priorities to achieve its sustainable development goals in agriculture (Jiao et al., 2018; Jin et al., 2021). According to the second national pollution census in 2020, 46.5% of the total N loss comes from agricultural sources, which rises to over 75% in the Yangtze River Basin (Wang et al., 2010; Liu et al., 2020).
Regarding the complexity of N absorption and utilization in agriculture, the optimization of management practices and increase in the nitrogen use efficiency (NUE) are regarded as the best solutions to global N challenges (Houlton et al., 2019). In agricultural production, only the N element absorbed by crops is believed to be effective, and the other elements are treated as emissions (Wei et al., 2011; Xie et al., 2018). From an economic perspective, the emitted N elements can be reduced without any yield loss; thus, efficiency terms may be evaluated by the ratio of output/input and divided by technical, allocative, and scale efficiencies (Jollands, 2006; Kros et al., 2013; Xiao et al., 2019). China’s NUE was 21.6%–26.5% in the past decades, which is much lower than that of the EU and other developed countries, and N losses were estimated at 18.5%–24.7%, which is one-third higher than the global average (Zhang et al., 2015; Wang et al., 2020; Sun et al., 2020). To date, most existing studies focused on estimating NUE or identifying individual effects of specific management practices, such as the adoption of new cultivars or technologies (Zhang et al., 2015; Xiao et al., 2019; Liu et al., 2020), for instance, split N fertilization can significantly increase the N element absorption levels of crops from chemical fertilizers, thereby increasing NUE to 37.5% for 2-splits and 40% for 3-splits (Wang et al., 2010). Integrated soil–crop system management and slow-release fertilization would save around 20% of N fertilizer input and improve NUE by 5%–10%, in practice (Zhang et al., 2015). N nanofertilizers are also expected to improve NUE by increasing N delivery effectiveness in fields (Mejias et al., 2021). However, very few studies paid sufficient attention to reversed effects of NUE changes on N use and loss reduction, especially under a systematic framework of analysis covering multiple N management practices in agriculture. Additionally, empirical research in the context of the YRB, which contributes about 30% to China’s total arable land and agricultural output each year, is lacking. Furthermore, the problem of agricultural N loss in China is far worse than the average situation.
Thus, we select the YRB as our study area. In addition, we consider seven main crops (i.e., rice, wheat, maize, soybean, peanut, rapeseed, and potato) that contribute more than 70% to Chinese agricultural production and are widely planted across the YRB and other regions in our analysis. Next, we employ a price endogenous partial equilibrium model (PEPEM) as a systematic framework to analyze the comprehensive effects on N use and N loss under different conditions. The overall objectives of our study are as follows: to assess the effects of N use reduction from nitrogen use optimization (NUO) and NUE improvement (NUE+), reveal the heterogeneity among the crops, and propose efficient policy recommendations for decision-makers for reducing N use and N loss in the YRB. Compared with previous studies, our study contributes to the literature in at least two ways. First, we evaluate reversed influences from NUE+ on N use rather than impacts of N use or other factors on NUE changes, which are widely discussed in the literature. Second, taking seven main crops for the analysis, we reveal crop heterogeneity in N use reduction.
The rest of this study is organized as follows: Section 2 introduces the study area; Section 3 details the model structure, data sources, and designed scenarios; Section 4 provides the simulation results under the designed scenarios and a discussion; Section 5 presents the conclusions and policy implications.
The Yangtze River, with a length of 6,300 km, is the third longest river in the world and the longest in China and Asia. The YRB is defined as the wide area where the trunk stream and tributaries of the Yangtze River run through (Figure 1). The trunk stream runs through 11 provinces, namely, Qinghai, Tibet, Sichuan, Yunnan, Chongqing, Hubei, Hunan, Jiangxi, Anhui, Jiangsu, and Shanghai, and the tributaries extend the basin to eight other provinces, namely, Guizhou, Gansu, Shaanxi, Henan, Zhejiang, Guangxi, Guangdong, and Fujian. The YRB is located at 24°30’∼35°45′N, 90°33’∼122°25′E, covering an area of 1.8 million km2 and accounting for 18.8% of China’s total land area.
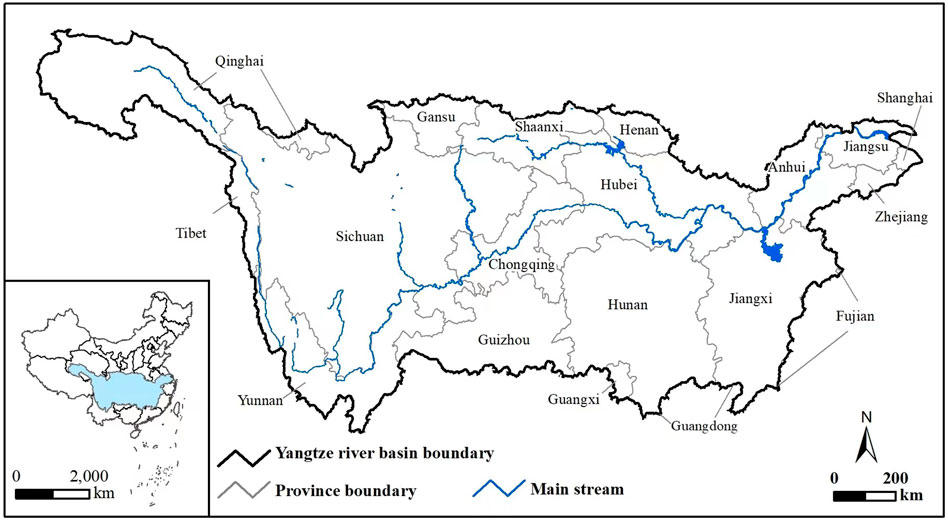
FIGURE 1. Location of the YRB.
With a humid subtropical climate, the YRB has extreme hydrothermal conditions for agriculture, contributing 30.32% and 28.9% to China’s total arable land and agricultural output, respectively, in terms of the seven main crops of the country (Table 1). Specifically, the YRB contributes over half of the domestic rice supply and over 70% of rapeseed production in China.
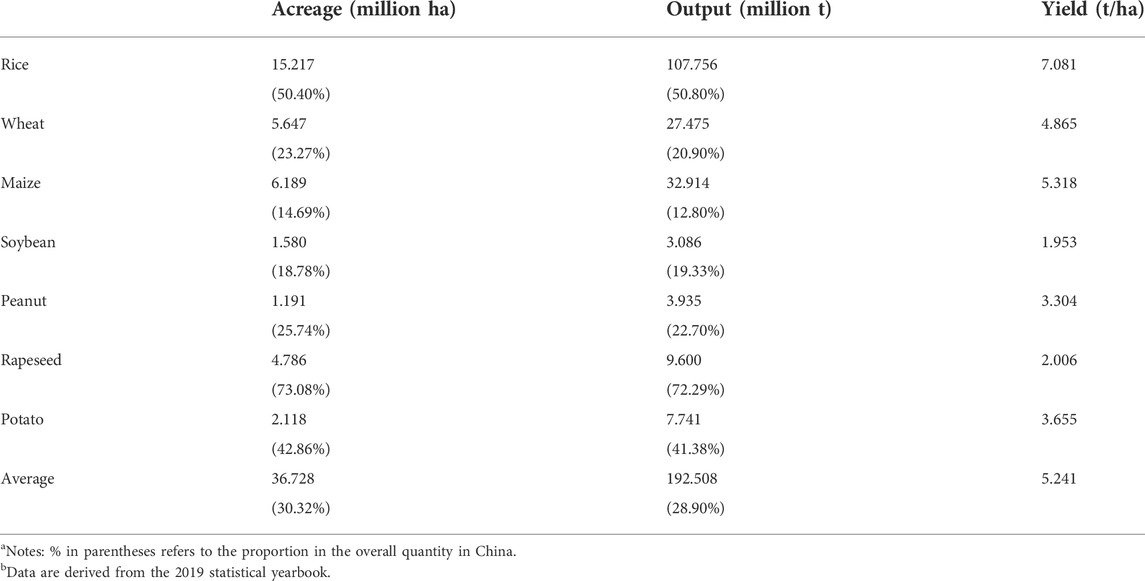
TABLE 1. Overview of agricultural production in the YRB.
To evaluate the impact of agricultural N use and loss reduction in the YRB from NUO and NUE+, we developed a multi-regional and multiproduct PEPEM. Based on the nonlinear mathematical programming approach, the PEPEM stands for the framework of partial equilibrium analysis to agriculture, which is widely used to reveal the impact of external policies on agricultural production and environmental performance (McCarl and Spreen, 1980; Beach and McCarl, 2010). Compared with general equilibrium models, the PEPEM endogenously determines market equilibrium prices and quantities by maximizing the surplus in the market, thereby demonstrating higher model structure flexibility and simulation accuracy (Yi et al., 2018; Ma et al., 2022).
In this study, we established the PEPEM to investigate the changes in agricultural N use under NUO scenarios and different NUE levels. We took seven main crops for the analysis and treated the 18 provinces in the YRB as the multiple regions in the model. Each region has different agricultural features, such as farming systems, arable acreages, labor forces, and other resource constraints. Meanwhile, the PEPEM has three basic assumptions: 1) the domestic agricultural market is integrated such that all products can be traded and transported freely across regions; 2) the domestic agricultural product supply is sufficient, and imports and exports remain stable; 3) agricultural producers are completely rational and, thus, can maximize social welfare by autonomously allocating production inputs. Based on the agricultural features of the regions and basic PEPEM assumptions, we constructed the research model as follows:
where
a. Supply–demand balance
Eq. 2 expresses the market supply–demand balance of the crops, where
Eq. 3 restricts the total production of crop c in the YRB to equal to or higher than the total supply, where
where
where
where
Unabsorbed N elements will enter groundwater through surface runoffs and leaching, forming N loss and causing nonpoint agricultural and environmental pollution. Quantifying the N loss is important in analyzing the environmental influence of N use. In existing studies, N loss was estimated with the coefficient of N loss in farmlands. Following Ti et al. (2011) and Xia et al. (2018), we calculated the N loss estimation in this study as follows:
where
We divided the required data into three parts, namely, supply (production), demand (consumption), and related coefficients. We derived the crops’ planting acreages and yields from the 2019 statistical yearbook of each province in the YRB. In addition, we collected the quantities and prices of agricultural inputs, such as the labor force, N fertilizers (including N fertilizers, non-N fertilizers, and compound fertilizers), pesticides, agricultural films, and irrigation water, from the Compilation of Cost and Benefit National Agricultural Products (2019). In this study, we defined N use as the sum of N fertilizers and compound fertilizers multiplied by their N weight. We estimated demand for the major agricultural products using the BRIC Agricultural Database from the perspective of feeding, industrial use, seeding, and wastage, according to the approaches proposed by Xue and Zhang (2019). Finally, we obtained the demand elasticities of the different crops fromWang et al. (2020)and N loss coefficients from Ti et al. (2011).
To verify the validity of the PEPEM, we first calibrated the data derived from the statistical materials, including acreages, outputs, and prices of the seven main crops in the YRB (Table 2). Based on the calibrations, we determined that the variations between the simulated and statistical values fell within 4%, indicating that the PEPEM can accurately simulate the production systems in the YRB. Hence, the model can be further used in the simulation analysis.
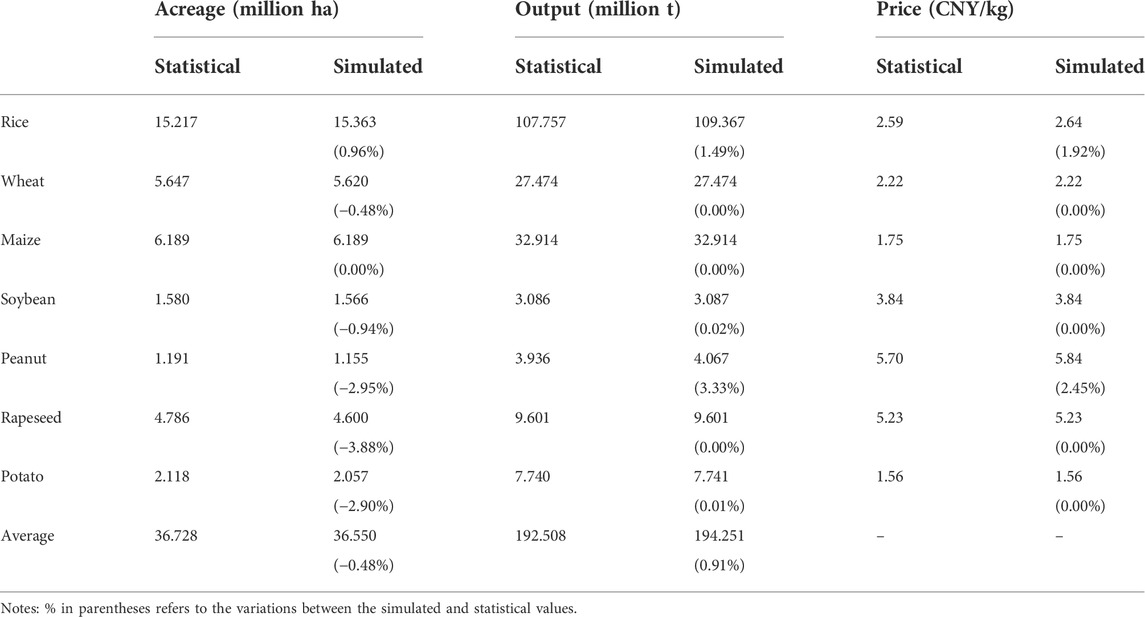
TABLE 2. Statistical and simulated values of the main crops in the YRB.
To compare the changes in N use and loss under different conditions, we designed the following scenarios:
Based on the statistical data derived from the 2019 yearbook, we inserted calibrated values into the PEPEM simulation, which we used as the BL scenario in this study.
If technological conditions are given, the relationship between the crop yield and N use should fit the quadratic curve, that is, the yield will first increase if the N input is insufficient, whereas if N is overused, the yield curve will turn to decrease. Therefore, to achieve the maximum total social welfare of the agricultural sector, we treated N use as an endogenous decision variable in the PEPEM. Meanwhile, we estimated the yield–N use relationship of the crops through the quadratic regression of the statistical data for the period of 2009–2018.
NUE+, which is generally induced by agricultural technology advancement, will likely affect N use in agricultural production (Chen et al., 2014; Cui et al., 2018). In this regard, we designed four NUE+ scenarios, denoted as NUE+10%, NUE+20%, NUE+30%, and NUE+40%, to simulate N use and loss outcomes when NUE is increased by 10%–40%. In terms of the analysis of the integrated effects, the NUE + scenarios should simplify the comprehensive influences of different technologies or management applications.
We performed the PEPEM simulations under different scenarios by GAMS 33.2.
The simulation results of agricultural production under NUO and BL are presented in Table 3.
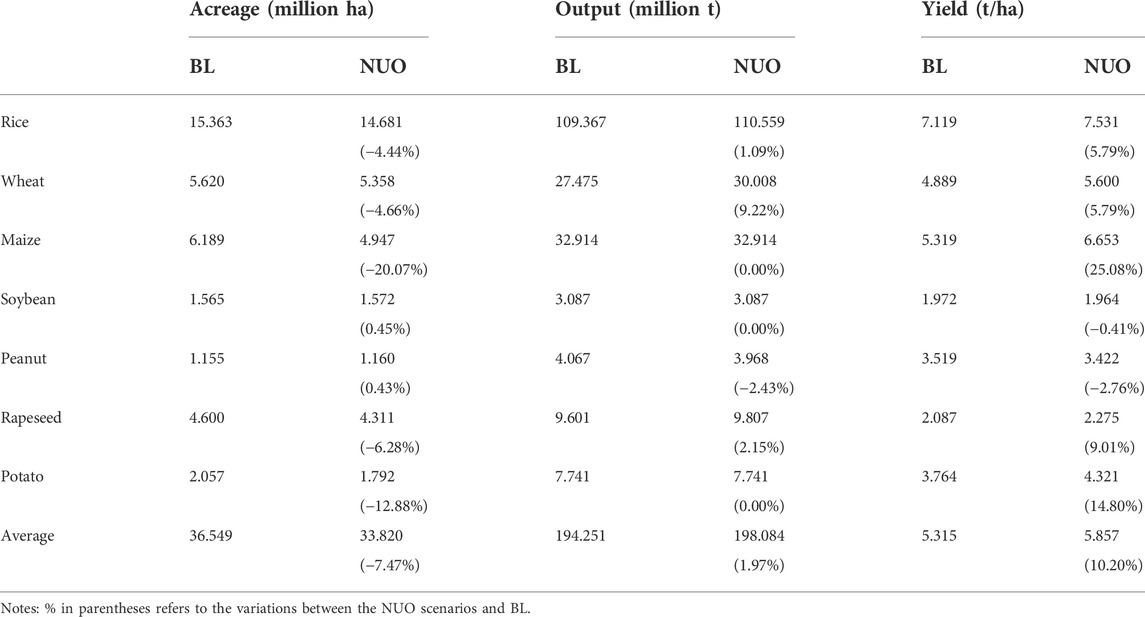
TABLE 3. Agricultural production under the NUO scenarios and BL.
According to the overall results, NUO increased the total agricultural output by 1.97% and simultaneously saved 7.47% of the arable land in the YRB, resulting in a 10.2% growth in the integrated yield level. The grain crops, including rice, wheat, maize, and potato, shared the same variation trend in the overall results of the BL and NUO scenarios. Specifically, the maize production considerably benefitted from NUO, which decreased the maize acreage by up to 20% and induced a 25% yield growth. By contrast, the variation trends in the production of soybean and peanut, which are the main oil crops in the YRB, are not consistent with the overall results, and the changes in the acreage and yield of the two oil crops were inconspicuous (less than 0.5% and 3%, respectively) compared with those of the rapeseed and grain crops.
Table 3 shows a rough comparison of the impact of NUO on the different crops, especially between the grain and oil crops. To further investigate the benefits of NUO, Table 4 presents the N use and N loss simulations at the total quantity and per unit levels. Apparently, NUO reduced N use and N loss in the YRB by 6.99% and 7.50%, respectively. Among the seven crops, rapeseed contributed the most to the N use (0.212 million t) and N loss (0.034 million t) reduction. If NUO is employed, we can see that nearly two-fifths of N use can be saved in the rapeseed production. With regard to the grain crops, over 5%, 9%, and 3% of N use and N loss were reduced under NUO in the rice, wheat, and maize production, respectively. However, it should be noted that N use and N loss increased in the soybean and peanut production. With an 18.92% and 14.52% growth in N use, the two oil crops led to a 16.67% and 15.00% N loss, respectively. Such numbers reached 3% in potato production. One possible explanation for these results is that N may be overused in the rapeseed and grain crop production in the YRB; thus, reducing N use will likely improve crop yields. By contrast, N use in the soybean and peanut production was insufficient, and inputting increased N fertilizers is beneficial to derive high output. Another explanation may be that soybean and peanut are leguminous crops, which require much more external N elements than cereals. In this regard, inputting increased N elements through fertilizer utilization may be an effective approach for meeting the N demand for crop growth and improving the yield level.
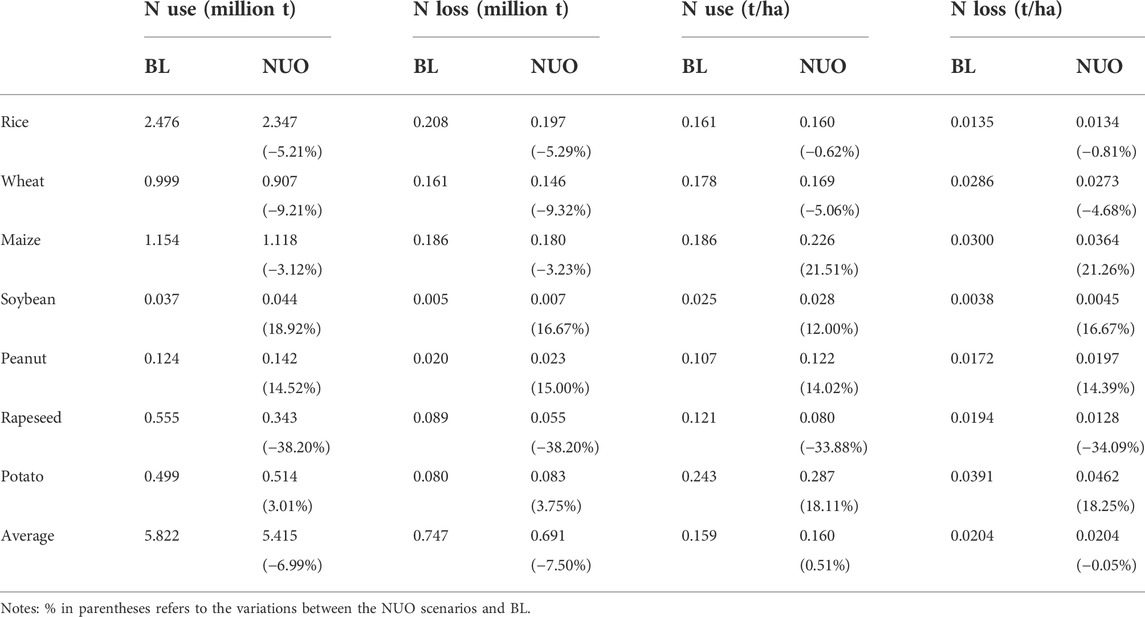
TABLE 4. N use and N loss under the NUO scenarios and BL.
NUO can help reduce N use and N loss in the total quantity; however, if the changes in crop acreages are considered, then the reduction effect from NUO will seem to disappear at the per unit level. The changes in N use and N loss per hectare in the YRB were limited under the NUO scenarios and in BL, in which the variation rates were only 0.51% and 0.05%. Similarly, N use and N loss per hectare in rice production decreased by 0.62% and 0.81%, respectively, indicating that the reduction was mostly from the acreage changes. However, among the other crops, the variation rates remained significant. For instance, NUO reduced N use and N loss by 33.88% and 34.09% per hectare in rapeseed production, respectively, and by 5.06% and 4.68% in wheat production, respectively. Most of the changes in N use and N loss per hectare in the crops were moderately less than those in the total quantity, except for two crops, namely, maize and potato. Although they were reduced by around 3% in the total quantity, the simulated N use and N loss in maize production increased by over 25% per hectare. As for potato production, the increasing rates reached 18%, which is more than five times the total quantity. In this sense, we may reconsider whether N elements are overused in maize and potato production at present in the YRB and regard the two crops as N use insufficient crops similar to soybean and peanut.
Based on the NUO simulations, we evaluated the influences of the different NUE levels. As the changes in agricultural production were less than 0.1%, we placed the simulation production results under the NUE + scenarios in Supplementary Table S1. The N use and N loss results of the main crops in the YRB under the four NUE+ scenarios, as well as the NUO results for comparison, are presented in Table 5.
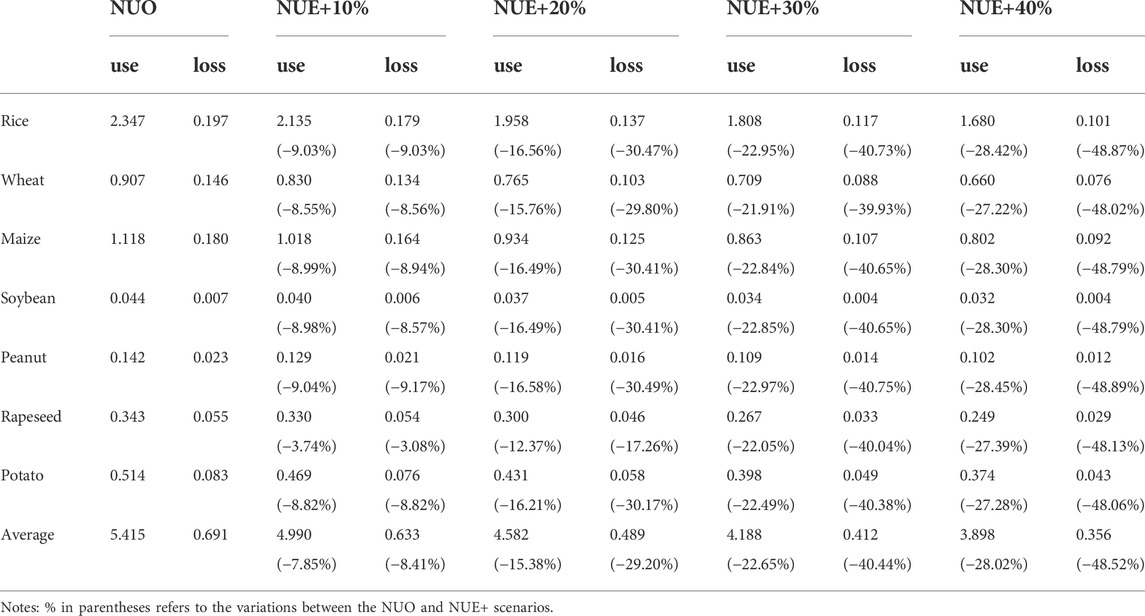
TABLE 5. N use and N loss under the NUE+ scenarios (million t).
Overall, N use and N loss in the YRB decreased continuously with NUE+, as expected. Compared with the NUO results, N use dropped from 5.415 million t to 3.898 million t (NUE+40%), and the reduction rates were 7.85%, 15.38%, 22.65%, and 28.02% under the four NUE + scenarios. N loss seemed to be highly sensitive to NUE+, decreasing from 0.691 million t to 0.356 million t, with reduction rates of 8.41%, 29.20%, 40.44%, and 48.52%. N use fell slightly with every 10% NUE+, whereas N loss dropped rapidly between NUE+10% and NUE+20%.
Most of the crops shared the same decreasing trend, that is, an N use (loss) reduction by around 9% (9%), 16% (30%), 22% (40%), and 28% (48%) under the four NUE + scenarios. Among the crops, rapeseed was the exception, whose reduction rate was 3.74% and 12.37% under the NUE+10% and NUE+20% scenarios, respectively, which are lower than the average rates. However, in the NUE+30% and NUE+40% scenarios, the N use and N loss reduction rates in rapeseed production returned to the average level and caught up with those of the other crops. Therefore, a larger jump existed in the N use (loss) in rapeseed between the interval of NUE+20% and NUE+30% than in the other crops. To clearly present the variation trends, the N use and N loss reduction rates of the seven main crops in the YRB under the four NUE + scenarios are illustrated in Figure 2A,B. The rates calculated in the figures considered the changes in the crop acreage. In this context, the curves in Figure 2 represent the N use and N loss trends at the per unit level.
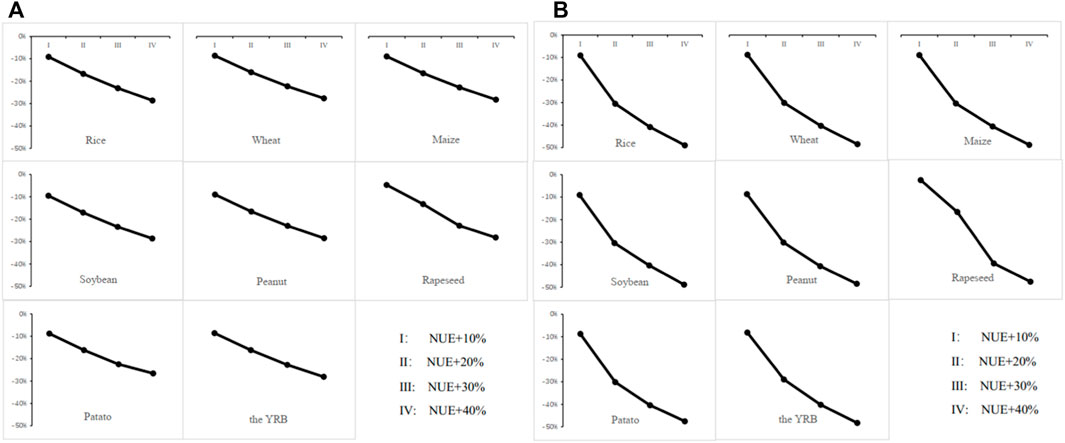
FIGURE 2. N use and N loss reduction rates (t/ha) in crops under the NUE + scenarios.
According to Figure 2A, the N use (t/ha) of all the crops decreased gradually along with NUE+, except for rapeseed, whose reduction rates were smaller than those of the others under the NUE+10% and NUE+20% scenarios. N loss (t/ha) showed a slight difference, that is, its curves dropped quicker than those of N use, especially under the NUE+20% scenario. Similarly, rapeseed was the only exception, which demonstrated a quick drop under the NUE+30% scenario.
In this study, we conducted a partial equilibrium analysis to evaluate the changes in N use and N loss instead of using econometric approaches. Unlike most studies, which used regression models to identify the influences of specific technologies and other driving forces (Zhao et al., 2012; Zhang et al., 2015; Liu et al., 2020), in our study, we used NUO scenarios to represent integrated effects. Additionally, we designed NUE+ scenarios. Previous studies estimated NUE with statistical data, site–year observations, and field plot surveys (Ma et al., 2014; Gu et al., 2017; Cui et al., 2018). In our study, we simplified this issue by hypothesizing a 10%–40% NUE growth to represent NUE+ or agricultural (technological) development instead of calculating time-serious NUEs. In addition, we constructed a reversed influence channel from NUE + to N use and N loss instead of examining the common impacts of N use or other forces on NUE changes, as in most existing studies.
We selected the YRB as the study area because of its critical role in China’s agricultural sector, which contributes about 30% to the agricultural output and over half of the rice production in China. Moreover, we considered seven main crops, namely, rice, wheat, maize, soybean, peanut, rapeseed, and potato. Some studies focused on one crop, such as rice (Ma et al., 2014), wheat (Liu et al., 2020), or staple grains (Cui et al., 2018). Another stream of literature reports assessed integrated N use in agriculture (Gu et al., 2017; Wu et al., 2018; Sun et al., 2020). Contributing to the literature, our study compared the differences between the seven main crops and revealed the sufficiency of N use for each crop, as well as N use and N loss reduction rates under NUE + scenarios. In this study, we emphasized the heterogeneity among the crops and simulated N loss and revealed the sensitivity gap between the N use and N loss reduction effects.
Despite the highlights or contributions mentioned previously, our study has several limitations. First, the partial equilibrium model can be classified as a static simulation analysis method. Long-period information on crops’ production is yet to be included, and prediction analysis is unavailable in the current framework. However, although the model covered multiple regions in the YRB, regional heterogeneity is yet to be investigated, owing to the data limitations for each region and data-induced simulation bias.
By employing the multi-region multiproduct price endogenous partial equilibrium analysis framework, in this study, we developed a PEPEM to analyze the impacts of NUO and NUE + on agricultural N use and N loss in the YRB. The simulation results indicated that 1) NUO increased the average yield level in the YRB by 10.2% and helped reduce N use and N loss in most of the crops, except for soybean and peanut; 2) N use in the YRB decreased continuously with NUE+, as expected, with the reduction rates of 7.85%, 15.38%, 22.65%, and 28.02% under the NUE+10%, NUE+20%, NUE+30%, and NUE+40% scenarios, respectively, and N loss was highly sensitive; 3) most of the crops shared the same decreasing trend, that is, N use (loss) was reduced by around 9% (9%), 16% (30%), 22% (40%), and 28% (48%) under the four NUE + scenarios, except rapeseed, whose reduction rates were around 4% and 12% under the first two scenarios; and 4) if the changes in the crop acreage are considered, then the reduction effects of NUO and NUE + will seem insignificant.
Overall, our study provides several insights into N use and N loss reduction in the YRB. First, NUO and NUE + are useful in agricultural N management. Specifically, a high level of NUE can increase N use and N loss reduction rates, thereby suggesting that NUO and NUE + policies and incentives are inevitable. In terms of heterogeneity among the different crops, another policy implication is related to the adjustment of the crops’ planting structure in the YRB. Enlarging cultivated areas for cereals, rather than oil crops such as soybean, peanut, and rapeseed, may be effective in reducing N use and N loss if NUE increases continually. In future studies, the PEPEM, which is a static model, should be reconstructed into a dynamic model through mathematical recursive methods, which would enable the model to incorporate multiperiod datasets in simulations. However, in future studies, we will further evaluate the regional heterogeneity or crop heterogeneity in each region based on detailed datasets and a dynamic PEPEM.
The original contributions presented in the study are included in the article/Supplementary Material; further inquiries can be directed to the corresponding author.
SY: writing—reviewing and editing, formal analysis, and visualization; SF: writing the original draft, data collection, and software; CT: conceptualization and visualization; YM: conceptualization, writing—reviewing and editing, supervision, and funding acquisition.
This work was supported by the National Natural Science Foundation of China (Grant Nos. 41961124004 and 71873125), the Scientific Research Foundation of Zhejiang Sci-Tech University (Grant No. 22092140-Y), and the Foundation of Philosophy and Social Science of Hangzhou (Grant No. Z21JC094).
The authors declare that the research was conducted in the absence of any commercial or financial relationships that could be construed as a potential conflict of interest.
All claims expressed in this article are solely those of the authors and do not necessarily represent those of their affiliated organizations, or those of the publisher, the editors, and the reviewers. Any product that may be evaluated in this article, or claim that may be made by its manufacturer, is not guaranteed or endorsed by the publisher.
The Supplementary Material for this article can be found online at: https://www.frontiersin.org/articles/10.3389/fenvs.2022.994023/full#supplementary-material
Beach, R., and McCarl, B. A. (2010). U.S. Agricultural and forestry impacts of the energy independence and security act: FASOM results and model description. Final report. RTI International. Prepared for the U.S. Environmental Protection Agency, Office of Transportation and Air Quality. RTI Project Number 0210826.003. Available at: https://www.rti.org/publication/us-agricultural-and-forestry-impacts-energy-independence-and-security-act.
Chen, X., Cui, Z., Fan, M., Vitousek, P., Zhao, M., Ma, W., et al. (2014). Producing more grain with lower environmental costs. Nature 514 (7523), 486–489. doi:10.1038/nature13609
Chen, X., and Önal, H. (2012). Modeling agricultural supply response using mathematical programming and crop mixes. Am. J. Agric. Econ. 94 (3), 674–686. doi:10.1093/ajae/aar143
Cui, Z., Zhang, H., Chen, X., Zhang, C., Ma, W., Huang, C., et al. (2018). Pursuing sustainable productivity with millions of smallholder farmers. Nature 555 (7696), 363–366. doi:10.1038/nature25785
Gu, B., Ju, X., Chang, S. X., Ge, Y., and Chang, J. (2017). Nitrogen use efficiencies in Chinese agricultural systems and implications for food security and environmental protection. Reg. Environ. Change 17 (4), 1217–1227. doi:10.1007/s10113-016-1101-5
Houlton, B. Z., Almaraz, M., Aneja, V., Austin, A. T., Bai, E., Cassman, K. G., et al. (2019). A world of co-benefits: Solving the global nitrogen challenge. Earth's. Future 7, 865–872. doi:10.1029/2019EF001222
Jiao, X., He, G., Cui, Z., Shen, J., and Zhang, F. (2018). Agri-environment policy for grain production in China: Toward sustainable intensification. China Agric. Econ. Rewiew 10, 78–92. doi:10.1108/CAER-10-2017-0201
Jin, S., Lin, Y., and Niu, K. (2021). Driving green transformation of agriculture with low carbon: Characteristics of agricultural carbon emissions and its emission reduction path in China. Reform 5, 29–37. In Chinese.
Jollands, N. (2006). Concepts of efficiency in ecological economics: Sisyphus and the decision maker. Ecol. Econ. 56 (3), 359–372. doi:10.1016/j.ecolecon.2005.09.014
Keisman, J., Devereux, O., LaMotte, A., Sekellick, A., and Blomquist, J. (2018). Manure and fertilizer inputs to land in the chesapeake bay watershed 1950–2012: U.S. Geol. Surv. Sci. Investig. Rep. 2018–5022, 37. doi:10.3133/sir20185022
Kros, J., Gies, T., Voogd, J., and de Vries, W. (2013). Efficiency of agricultural measures to reduce nitrogen deposition in Natura 2000 sites. Environ. Sci. Policy 32, 68–79. doi:10.1016/j.envsci.2012.09.005
Ladha, J., Tirol-Padre, A., Reddy, C., Cassman, K., Verma, S., Powlson, D., et al. (2016). Global nitrogen budgets in cereals: A 50-year assessment for maize, rice, and wheat production systems. Sci. Rep. 6 (1), 19355. doi:10.1038/srep19355
Liu, L., Zheng, X., Peng, C., Li, J., and Xu, Y. (2020). Driving forces and future trends on total nitrogen loss of planting in China. Environ. Pollut. 267, 115660. doi:10.1016/j.envpol.2020.115660
Liu, X., Zhang, Y., Han, W., Tang, A., Shen, J., Cui, Z., et al. (2013). Enhanced nitrogen deposition over China. Nature 494 (7438), 459–462. doi:10.1038/nature11917
Ma, L., Velthof, G., Kroeze, C., Ju, X., Hu, C., Oenema, O., et al. (2014). Mitigation of nitrous oxide emissions from food production in China. Curr. Opin. Environ. Sustain. 9-10, 82–89. doi:10.1016/j.cosust.2014.09.006
Ma, Y., Zhang, L., Song, S., and Yu, S. (2022). Impacts of energy price on agricultural production, energy consumption, and carbon emission in China: A price endogenous partial equilibrium model analysis. Sustainability 14 (5), 3002. doi:10.3390/su14053002
McCarl, B., and Spreen, T. (1980). Price endogenous mathematical programming as a tool for sector analysis. Am. J. Agric. Econ. 62 (1), 87–102. doi:10.2307/1239475
Mejias, J., Salazar, F., Pérez Amaro, L., Hube, S., and Alfaro, M. (2021). Nanofertilizers: A cutting-edge approach to increase nitrogen use efficiency in grasslands. Front. Environ. Sci. 9, 635114. doi:10.3389/fenvs.2021.635114
Sun, C., Chen, L., Zhai, L., Liu, H., Wang, K., Jiao, C., et al. (2020). National assessment of nitrogen fertilizers fate and related environmental impacts of multiple pathways in China. J. Clean. Prod. 277, 123519. doi:10.1016/j.jclepro.2020.123519
Ti, C., Pan, J., Xia, Y., and Yan, X. (2011). A nitrogen budget of mainland China with spatial and temporal variation. Biogeochemistry 108 (1-3), 381–394. doi:10.1007/s10533-011-9606-y
Wang, P., Han, Y., and Zhang, Y. (2020). Characteristics of change and influencing factors of the technical efficiency of chemical fertilizer use for agricultural production in China. Resour. Sci. 42 (9), 1764–1776. In Chinese. doi:10.18402/resci.2020.09.11
Wang, X., Hao, F., Cheng, H., Yang, S., Zhang, X., and Bu, Q. (2010). Estimating non-point source pollutant loads for the large-scale basin of the Yangtze River in China. Environ. Earth Sci. 63 (5), 1079–1092. doi:10.1007/s12665-010-0783-0
Wu, H., Wang, S., Gao, L., Zhang, L., Yuan, Z., Fan, T., et al. (2018). Nutrient-derived environmental impacts in Chinese agriculture during 1978–2015. J. Environ. Manag. 217, 762–774. doi:10.1016/j.jenvman.2018.04.002
Wu, Y., and Chen, J. (2013). Investigating the effects of point source and nonpoint source pollution on the water quality of the East River (Dongjiang) in South China. Ecol. Indic. 32 (9), 294–304. doi:10.1016/j.ecolind.2013.04.002
Xia, Y., Yang, W., and Shi, W. (2018). Estimation of non-point source N emission in intensive cropland of China. J. Ecol. Rural Environ. 34 (9), 782–787. In Chinese. doi:10.11934/j.issn.1673-4831.2018.09.003
Xiao, J., Wang, Q., Ge, X., Zhu, L., Li, X., Yang, X., et al. (2019). Defining the ecological efficiency of nitrogen use in the context of nitrogen cycling. Ecol. Indic., 107, 105493. doi:10.1016/j.ecolind.2019.105493
Xue, P., and Zhang, W. (2019). Change of grain consumption in Jiangsu Province and its contribution index to China’s grain security. Res. Agric. Mod. 40 (2), 206–214. In Chinese. doi:10.13872/j.1000-0275.2019.0014
Yi, F., McCarl, B., Zhou, X., and Jiang, F. (2018). Damages of surface ozone: Evidence from agricultural sector in China. Environ. Res. Lett. 13 (3), 034019. doi:10.1088/1748-9326/aaa6d9
Keywords: nitrogen use, nitrogen loss, the Yangtze River Basin, price endogenous partial equilibrium, crop heterogeneity
Citation: Yu S, Fan S, Ti C and Ma Y (2022) Reducing agricultural nitrogen use: A price endogenous partial equilibrium analysis in the Yangtze River Basin, China. Front. Environ. Sci. 10:994023. doi: 10.3389/fenvs.2022.994023
Received: 14 July 2022; Accepted: 08 August 2022;
Published: 01 September 2022.
Edited by:
Wendong Wei, Shanghai Jiao Tong University, ChinaCopyright © 2022 Yu, Fan, Ti and Ma. This is an open-access article distributed under the terms of the Creative Commons Attribution License (CC BY). The use, distribution or reproduction in other forums is permitted, provided the original author(s) and the copyright owner(s) are credited and that the original publication in this journal is cited, in accordance with accepted academic practice. No use, distribution or reproduction is permitted which does not comply with these terms.
*Correspondence: Y. Ma, bXl4QHpzdHUuZWR1LmNu
Disclaimer: All claims expressed in this article are solely those of the authors and do not necessarily represent those of their affiliated organizations, or those of the publisher, the editors and the reviewers. Any product that may be evaluated in this article or claim that may be made by its manufacturer is not guaranteed or endorsed by the publisher.
Research integrity at Frontiers
Learn more about the work of our research integrity team to safeguard the quality of each article we publish.