 Hua Tang
- Management Innovation Research Center, Beijing Normal University, Zhuhai, China
Previous studies on the relationship between environmental, social and governance (ESG) information disclosure and cost of equity (COE) have found mixed results. They conclude that this relationship may be affected by some attributes of the company inside. In this study, we examine whether investors’heterogeneous beliefs moderates the relationship between ESG performance and COE. Our sample starts with ESG-rating firms included in Huazheng index of the Wind China financial database (WIND) for years 2015–2020. We collect financial information and relevant data from the China Stock Market and Accounting Research database (CSMAR). Using a two-way fixed effect multiple regression model, we report a negative moderate effect of both ESG performance on COE. We also find that COE Is higher when the firm financing constraints increase. Investors’heterogeneous beliefs with a lower (rather than higher) level tends to pay close attention from ESG performance by stakeholders and financing constraints decreases, which then leads to the reduction of investors’ expected risk. We therefore conclude that firms that manage actions on ESG issues have a better choices of release investors disagreements which in turn reduces their equity financing costs.
1 Introduction
The concept of sustainable development gave birth to the concept of responsible investment. In 2006, PRI clarified the impact of environmental, social and governance issues on portfolio returns and formally recommended that investors incorporate ESG factors into the investment decision-making process. ESG performance represents: A business organization’s configuration of principles of [environmental,] social [and governance] responsibility, processes of [environmental,] social [and governance] responsiveness, and politics, programs and observable outcomes as they relate to the firm’s societal relationships (Wood, 1991). The United Nations Global Compact (2017) indicates that there are over 9,000 companies and 4,000 non-businesses across 161 countries have taken serious commitments to address social issues, specifically actions to improve the ESG performance. Companies that ignore environmental, social and governance factors and do not incorporate ESG standards into their business operations face consequences that investors are averse to (Shakil et al., 2020).
ESG performance evaluation, also known as ESG Ratings, is created by commercial and non-profit organizations to assess how the commitment, performance, business model and structure of enterprises are consistent with sustainable development goals. Rating agencies collect information about the ESG performance scores of enterprises through various channels and design evaluation indicators, comprehensively investigate the obtained information, and finally score and rate enterprises. ESG performance scores make the level of ESG practice activities among enterprises comparable. Generally, companies with high ESG performance scores emphasis more on achieving environmental and social sustainability to get active support from influential stakeholders and further access to resources (Branco and Rodrigues, 2006; Haque and Ntim, 2018), better financial performance (Ng and Rezaee., 2015) to improve its competitiveness (Haseeb et al., 2019).
ESG has created opportunities and challenges for firms in their risk–return relationships with shareholders and other stakeholders. Previous studies have focused on the impact of ESG information disclosure on equity or debt financing costs (Dhaliwal et al., 2011; Dhaliwal et al., 2014; Maaloul et al., 2021a; Nicola et al., 2021a; Xu et al., 2022). However, ESG performance and ESG disclosure are two different measures of practice (Eliwa et al., 2019). ESG performance measures what enterprises actually do, while ESG disclosure refers to the communication of their ESG performance (Deegan, 2017). The former is uses a substantive method, and the latter is uses a symbolic method (Ashforth and Gibbs, 1990). The two cannot be equated. Previous studies on ESG performance only involves bond capital costs (Maaloul et al., 2021b; Nicola et al., 2021b) and financing costs (Qiu and Yin, 2019). For enterprises, the risk of equity financing is usually lower than that of debt financing, and the cost of equity capital reflects investors’ risk expectations for a company (Kim et al., 2019). Anthony (Ng and Rezaee., 2015)has shown that sustainable performance has a negative relationship with the cost of equity capital. But the literature shows that the role of sustainable development capability in enterprise financing activities may change with changes in the economic environment (El Ghoul et al., 2017). As the world’s largest developing country, China implemented a new environmental protection law in 2015, and corporate governance standards revision for listed companies were issued in 2018, which promote listed companies to better carry out sustainability practices. With enterprises in China paying attention to ESG practice, can enterprise ESG performance reduce investors’ risk expectations? Theoretically, ESG performance can reduce financing constraints (El Ghoul et al., 2011; Zhang et al., 2022), while financing constraints affect the cost of equity capital (Hashim Syarif et al., 2019), however, there is limited evidence in prior literature to support the moderating influence of ESG performance and cost of equity capital. Further, when the enterprise is seeking financing from the outside, external investors often have different understanding and interpretation of the same information, and form inconsistent expectations for the target enterprise (Hong and Stein, 2007), the investment concept is a value that reflects the investor’s investment personality, urges the investor to carry out normal analysis and judgment, makes decisions and guides the investor’s behavior, and reflects the investor’s investment purpose and willingness. Credit rating news coordinates investors’beliefs (Tran et al., 2019), investors’disagreement regarding volatility influences asset prices (Lin and Lin, 2010). Heterogeneous beliefs can increase the degree of financing constraints. Will investors perceive the ESG related behaviors taken by enterprises? Does ESG performance make decisions and guide investor behavior in emerging markets ? This study intends to answer three research questions to fill the gap in the literature by providing theoretical evidence to support the stakeholder and signaling theory and empirical evidence to contribute to ESG and cost of equity literature. Questions are as follows—(1) Is there any influence of ESG on the cost of equity capital after new environmental protection law ? (2) Does financing constraints mediates the ESG-cost of equity link ? and (3) Does investors’ heterogeneous beliefs moderate the association between ESG and cost of equity ?
In order to answer these three research questions, this study uses a sample of China’s A-share listed companies from 2015 to 2020 to investigate the direct influence of ESG performance on cost of equity capital, mediating impact of financing constraints and moderating impact of investors’ heterogeneous beliefs. This study applies panel regressions technique to test the hypothesis. This study finds a significant indirect effect of financing constraints. ESG performance adversely influences financing constraints and cost of equity capital. Also, heterogeneous investor beliefs have a substantial moderating effect on ESG-cost of equity.
Possible incremental contributions of this paper are as follows: first, our study contributes to the existing evidence on the determinants of the cost of equity in emerging markets. Previous studies on the impact of sustainable performance on the cost of equity capital (Ng and Rezaee., 2015) focuses on developed country or the impact of ESG information disclosure on the cost of equity capital (Dhaliwal et al., 2011; Dhaliwal et al., 2014). China is the world’s largest developing country, and its capital market presents different characteristics. The analysis of the effect of ESG rating on the cost of equity of stocks in the Chinese market after the Environmental Protection Law is helpful to the financing problems in the development of dual carbon, which helps global environmental protection. Second, this finding reveals the important role of ESG practices in investors’ expected investment risk assessment model. If investors demand stronger ESG performance, their relatively strong position may encourage companies to strengthen their ESG performance, which will benefit other stakeholder groups. Third, this study contributes to the literature by investigating the investors’ beliefs on the relationship between ESG performance and equity cost. It provides a new understanding of the determinants of the cost of equity in emerging markets. The results will help regulators and policymakers to revise the ESG criteria and rank firms based on their ESG performance.
The rest of this paper is structured as follows. Section 2 provides a literature review and our hypotheses; Section 3 presents the adopted research design; Section 4 describes the empirical test and result analysis; Section 5 presents the robustness test; and Section 6 concludes.
2 Theory and hypotheses development
2.1 ESG performance and cost of equity
Stakeholder theory holds that enterprises must expand their focus beyond the maximization of short-term shareholder profits by considering the impact of their operations on the interests of all stakeholders, including the community, society and the environment (Freeman, 1984). Stakeholder theory can rationalise the ESG and firm value as ESG increases the shareholder wealth as it motivates other stakeholders to contribute to the success of the firm with the resources they avail (Freeman, 1984; Freeman, 2010). Firms with higher ESG are less likely to face lawsuit risk due to the reduction of environmental pollution (Sharfman and Fernando, 2008).
Brockett and Rozaee (Brockett and Rezaee, 2012) believe that an optimal investment in ESG plans can maximize the positive externalities of enterprises and balance the costs and benefits of sustainability efforts. The expected benefits of sustainability include generating sustainable benefits, reducing environmental responsibility and litigation costs, cost savings from a sustainable supply chain, improved product quality and customer satisfaction, improved reputation and regulatory approval, and improved employee loyalty and productivity (Stock Exchange (TSX), 2014).
According to signaling theory, if ESG performance of an enterprise is high, this will send a signal to the outside world, and the enterprise may be committed to achieving excellent sustainable performance. Focusing on economic and ESG sustainability performance creates opportunities for investors to identify and correct the impacts of corporate reputation (Pina et al., 2020) and financial risks (Ng and Rezaee., 2015), which will improve economic performance and reduce the cost of equity. Cheng et al. (Cheng et al., 2006) find that strong governance and greater financial transparency reduce the cost of equity capital. Sharfman and Fernando (Sharfman and Fernando, 2008) provide evidence that improved environmental risk management is associated with a lower cost of equity capital. Crifo et al. (Crifo et al., 2015) find that ESG performance generally affects firm valuation and investment decisions through a field experiment. Based on the above analysis, this paper proposes Hypothesis 1.
2.2 ESG performance, financing constraints and the cost of equity capital
Modern corporate finance theory holds that problems of information asymmetry and agency make the cost of external financing higher than that of internal capital, therefore creating financing constraints. High ESG performance includes the moral obligation to become a good corporate citizen (by contributing to society and the environment; building a good reputation among employees, customers and other stakeholders; and balancing short and long term financial sustainability performance) and the license to operate by focusing on social and environmental issues important to stakeholders (Porter and Kramer, 2006), which can release positive signals to the capital market.
This will help an enterprise win the recognition and support of stakeholders, alleviate the market doubts of investors due to the blockage of information access channels, and reduce the costs and resistance of enterprises in the financing process (Qiu and Yin, 2019). El Ghoul et al. (El Ghoul et al., 2017) provide theoretical evidence that environmental social responsibility can reduce the likelihood and cost of negative events, reducing investors’ risk expectations. An increase in investors’ shareholding demand and reduction in risk expectations reduce the cost of capital. Enterprises with higher ESG performance are more likely to have less equity capital (Khan et al., 2016), and higher credit ratings (Henriksson et al., 2019), allowing them to obtain more external capital, reduce financing costs and alleviate financing constraints (Zhang et al., 2020). Therefore, from the perspective of signal transmission theory, high ESG performance of enterprises may send a positive signal to external stakeholders. The decision-making and resource allocation adjustment of stakeholders may increase the supply of external funds, alleviate the severity of equity financing constraints in the capital market, further reduce the overall average equity financing cost of listed companies, and alleviate the information asymmetry between enterprises and investors, thus affecting the expected risks of investors and reducing the cost of equity capital. Based on the above analysis, this paper proposes following hypothesis.
2.3 The moderating effect of heterogeneous investor beliefs
In an incomplete market with heterogeneous prior beliefs, public information can have a substantial impact on the ex-ante cost of capital and trading volume (Peter and Qin, 2014). Boehme, Danielsen, and sorescu (Boehme et al., 2006) study the stocks of all United States listed companies and find that under the condition of short selling restrictions, the stronger the heterogeneous beliefs of investors, the lower the late return of stocks through measuring heterogeneous beliefs by stock turnover and excess return volatility. Investors’ heterogeneous belief theory holds that investors have heterogeneous beliefs about the future return and risk estimation of securities, and the degree of heterogeneity of this belief is positively correlated with stock returns (Miller, 1977). Focusing on ESG sustainability performance provides information for investors about corporate reputation (Pina et al., 2020) and financial risks (Ng and Rezaee., 2015) in some extent. However, not all investors have the “rational” characteristics of “homogeneity”. They often have different understanding and interpretation of the same information, and form inconsistent expectations for the target enterprise, resulting in the problem of heterogeneous beliefs (Hong and Stein, 2007). Under both rational and irrational conditions, the difficulty of obtaining information and the understanding characteristics of individuals make investors’ heterogeneous beliefs widely exist (Banerjee, 2011; Bhamra and Uppal, 2014). When the value information obtained by external investors and internal investors is more different, the degree of heterogeneous beliefs will be higher Even if the development prospect of the enterprise is very good, when the enterprise is seeking financing from the outside, the external investors will be cautious about the investment of the target enterprise because they are unable to make accurate investment judgment, so as to increase the degree of financing constraints of the enterprise. Chen, Hu and Wang (Chen et al., 2009) have found that heterogeneous beliefs will lead to the overestimation of current stock prices and have a negative correlation with future returns on China’s stock market with measuring investors’ heterogeneous beliefs by turnover rate and return volatility. Based on the above analysis, this paper proposes Hypothesis 5a.
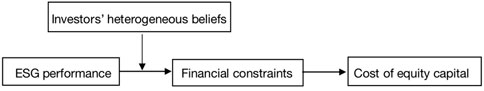
FIGURE 1. The theoretical model and research design note.
3 Data and research methodology
3.1 Sample selection and data source
We investigate the relation between ESG performance and the cost of equity after China implemented a new environmental protection law in 2015. Our sample starts with ESG-rating firms included in Huazheng index of the Wind China financial database (WIND) for years 2015–2020. We collect financial information and relevant data from the China Stock Market and Accounting Research database (CSMAR), respectively, and merge them with the data from WIND. To ensure the scientificity and accuracy of the research results, We first eliminate observations with missing values and then exclude Chinese special treatment firms (ST firms) and financial firms. Then companies with eps2-eps1 < 0 in the sample were excluded because they did not meet the requirements of the equity capital cost calculation model adopted in this study. To alleviate the influence of extreme values on the empirical results, this paper shrinks the tail of continuous variables at the 1% level. Finally, unbalanced panel data composed of 2,131 firm-year observations are obtained.
3.2 Variable definition and measurement
3.2.1 measures of cost of equity capital
The cost of equity capital is the price paid by enterprises to obtain the required funds by issuing shares, and it is the expected rate of return of investors. There are many measurement standards for the cost of equity capital, including ex ante and ex post indicators, such as those calculated through the price return growth (PEG) model, modified price return growth (MPEG) model, Ohlson and Juettner Nauroth (OJ) model and capital asset pricing model (CAPM). Mao et al. used the data of Chinese listed companies to evaluate the effectiveness of the PEG method and different equity capital cost models and found that on the whole, the ex ante model is better than the ex post model, and the PEG model is more effective than other models. Referring to the research of Mao et al. (Mao and ye, 2012), this paper uses the PEG method to calculate the cost of equity capital. The OJ model and PG program use ex ante prediction. In this paper, the OJ model proposed by Ohlson and Juettner Nauroth is used in place of the PEG method to calculate equity capital to test robustness. Following the PEG model proposed by Easton (Easton, 2004), the specific calculation is shown in Formula 1, where esp2 and esp1 are the average earnings per share in the second and first periods predicted by analysts, respectively, and P0 is the market price per share at the end of the year.
The OJ model is used to calculate the cost of equity capital in the robustness test. Following the work of Ohlson and Juettner Nauroth (Ohlson and Juettner-Nauroth, 2005), Formula 2 is adopted as the calculation formula, dps1 represents the dividend of per common share in the first period.
Where
3.2.2 proxies for ESG performance
This paper uses the ESG rating index of Huazheng from the Wind database to measure the ESG performance of enterprises. Information on which the Huazheng ESG rating is based includes ESG reports, social responsibility reports, sustainable development reports, annual reports, official website information, third-party data, etc., including ESG information released by enterprises. The Huazheng ESG index system refers to the mainstream ESG evaluation framework adopted abroad combined with the reality of China’s capital market and the characteristics of various listed companies. The ESG rating calculation method is as follows: calculate the scores of 26 three-level indicators based on the underlying data, build an industry weight matrix according to industry characteristics, and calculate ESG scores according to the industry weight matrix. The Huazheng ESG rating is divided into nine grades of, in ascending order, C, CC, CCC, B, BB, BBB, AA, and AAA. In this paper, the ESG rating adopts the assignment method, and the 9 grades of C ∼ AAA are respectively assigned as 1–9; that is, when the rating is C, ESG = 1; when the rating is CC, ESG = 2; when the rating is CCC, ESG = 3; and so on. Although the Huazheng ESG rating has the advantages of broad coverage and a high update frequency, given that the ESG rating does not come from objective information such as corporate financial statements, the fairness of the index prepared by an institution may be controversial. Referring to the research of Li (Jin, 2021) and in consideration of data availability levels, this paper also adopts core explanatory variables of the basic regression of the ESG rating measurement of SynTao Green Finance Agency in the robustness test and uses the assignment method to construct ESG performance.
3.1.3 Measures of financing constraints
We refer to Gu (Gu and Guo, 2020) to establish a model to measure the level of enterprise financing constraints. The calculation of financing constraint variable is as follows. Firstly, standardize the three variables of enterprise size and age and the cash dividend payment rate according to the year, and determine financing constraint virtual variable QUFC according to the standardized mean value of the variables. Enterprises with an average value higher than the third quartile face fewer financing constraints, and the corresponding QUFC is 0. Enterprises with a mean value lower than the third quartile have more financing constraints, and the corresponding QUFC is 1.
Secondly, a logit model is used to fit the probability of financing constraints of enterprises every year, and it is defined as financing constraint index FC (value between 0 and 1). The greater FC is, the more serious the financing constraints of enterprises are. Cashdiv in Formula (4) represents the cash dividend announced in the current year, Ta represents total assets, NWC represents net working capital, and EBIT represents the profit before interest and tax.
The last step is to conduct logit regression with Formula 3, fit the occurrence probability P of financing constraints of enterprises every year, and define it as financing constraint index FC (the value is between 0 and 1). The larger the FC value is, the more serious the financing constraints of enterprises are.
where:
3.1.4 Proxies for heterogeneous investor beliefs
The measurement indicators of investors’ heterogeneous beliefs mainly include theinstitutional exit ratio adopted by Houge et al. (Houge et al., 2001), the analyst predictio differences (Diether et al., 2002) the excess return volatility and turnover rate (Gao et al., 2006; Hail and Leuz, 2009), among the above indicators, the exit ratio of institutional investors is questioned by Gao, Mao and Zhong (Gao et al., 2006), who believe that this indicator only measures uncertainty. Analysts’ prediction divergence indicators have also been controversial because they can not represent the actual judgment of all investors and include the impact of uncertainty. Relatively speaking, we believe that the turnover rate and excess return volatility proposed by Boehme, Da Nielsen and sorescu (Boehme et al., 2006) can better reflect the heterogeneous beliefs of the majority of investors. Therefore, this paper intends to use the annual average turnover rate to measure investors’ heterogeneous beliefs. The turnover rate of stock usually refers to the ratio of stock trading volume to the total number of circulating shares during a trading period. It is one of the indicators reflecting the strength of stock liquidity. In addition, according to the availability of data, the number of analyst attention is subsequently selected as an alternative measure for robustness test.
3.1.5 Construction of other variables
We follow the literature and control for firm-level variables known to determine the cost of equity (Hail and Leuz, 2009; Tong and Xu, 2020). Our vector of control variables includes: environmental uncertainty (EU), using the fluctuation of a company’s sales revenue, which is expressed and proposed by Ghosh and Olsen (Ghosh and Olsen, 2009) as follows: (standard deviation of operating revenue residual in last five years/five-year average sales revenue)/industry median. Financial risk (Lev), using an enterprise’s asset liability ratio calculated as (total liabilities/total assets) × 100%. The book-to-market ratio (MB), expressed as the ratio of share price per share to net assets per share. Return on total assets (ROA) is expressed as profits/average total assets at the beginning and end of the period. Enterprise size is expressed as the natural logarithm of total assets. Growth is expressed by the annual growth rate of operating revenue. In this paper, the industry (IND) and year (YEAR) are selected as virtual variables to control the industry and year. Table 1 provides the definitions of all variables used in this paper.
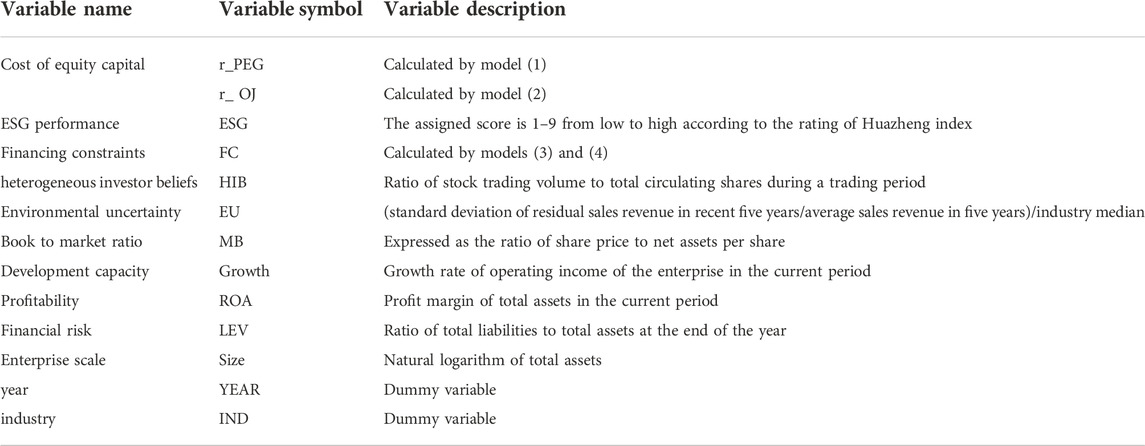
TABLE 1. Defifinitions of variables.
3.3 Regression model
3.3.1 Benchmark regression model
To test Hypothesis 1, this paper applies the following regression model:
where subscript i is the enterprise, t is the year, and j is the serial number of the control variable r_PEG refers to the cost of equity capital, ESGi,t refers to the ESG rating obtained by enterprise i in t; Controls are the control variables, which are environmental uncertainty (EU), Book to market ratio (MB), enterprise size (Size), financial risk (LEV), enterprise growth (Growth) and the return on net assets (ROA); YEAR and IND are the fixed effects of the year and industry, respectively; and εi,t is the random disturbance term. The regression models used in this paper control the time fixed effect and industry fixed effect, where the industry is divided according to the 2012 industry classification standard of the China Securities Regulatory Commission. To control the influence of the heteroscedasticity of the error term and time series-related problems on the standard error of the estimation coefficient, this paper adopts a robust standard error.
3.3.2 The indirect effect model
To identify the specific ways in which ESG performance affects the cost of equity capital (H2-H4), this paper adopts the indirect effect analysis method of Wen and Ye (Wen, 2014) and establishes the following model according to the theoretical analysis of this paper, focusing on how ESG reduces the cost of equity capital by reducing financing constraints. The financing constraints (FC)is the intermediary variable, and this paper tests coefficients δ2。
3.3.3 The moderation effect model
In order to test whether H5a and H5b,investors’ heterogeneous beliefs (HIB) can regulate the intermediary effect of financing constraints (FC), this paper constructs models 8) with reference to the research of preacher (Preacher et al., 2007). The adjustment effect of investors’ heterogeneous beliefs (HIB) on ESG performance on financing constraints is tested by adding the intersection of explanatory variables and regulatory variables. The model controls the fixed effect of industry and year. When the interaction is significant, the moderation effect is significant.
The definitions of the main variables included in the above three models are shown in Table 1.
4 Empirical test and result analysis
4.1 Descriptive statistics
The descriptive statistical results in Table 2 show that the maximum value of the equity capital cost of the sample enterprises is 0.253, the minimum value is 0.0378 and the average value is 0.107, indicating that the equity capital cost of China’s A-share listed companies varies greatly, from less than 1% to more than 10%, and fluctuates frequently. The mean ESG rating (ESG) is 7.358, and the variance is 1.12, indicating that the average rating of ESG performance is between a and AA. The ESG ratings of listed companies are uneven, with a lowest performance of CC and highest ESG rating of AAA. The average value of financing constraints is 0.142, and the difference between the maximum and minimum values is very large, indicating that the financing constraints faced by different enterprises vary widely. The average investors’ heterogeneous beliefs is 1.096, and the standard deviation is 0.867. It is left biased, indicating that the turnover rate of individual listed companies is very high. The average value of environmental uncertainty is 1.007, and the standard deviation is 0.85. These data show that most listed companies in China’s capital market have had unstable sales revenues over the past five years. Moreover, the minimum and maximum values are 0.0844 and 5.608, respectively, which further shows that the environmental uncertainty faced by different enterprises in China’s listed companies also varies widely. The statistics of the other variables are basically similar to those of existing studies.
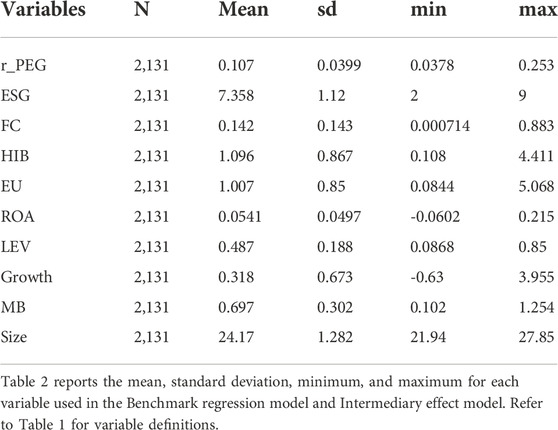
TABLE 2. Descriptive statistics.
4.2 Analysis of the benchmark and moderation effects
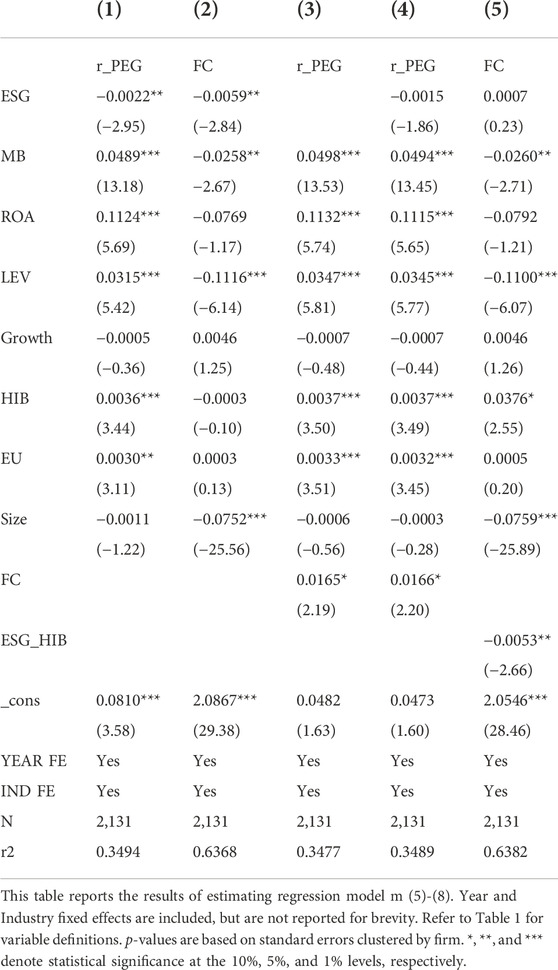
TABLE 3. Results of benchmark and moderation effects.
4.3 Analysis of the indirect effect
4.4 Analysis of the moderation effect
In order to calculate the size of conditional indirect effect, we take three values of stock liquidity adjustment variables: low investors’ heterogeneous beliefs (mean minus one standard deviation), medium investors’ heterogeneous beliefs (mean) and high investors’ heterogeneous beliefs (mean plus one standard deviation). As shown in Table 4, the results of bootstrapping techniques with 500 bootstrap samples (Preacher et al., 2007; Hayes, 2013) showed that the indirect effect of ESG performance on cost of equity capital through financing constraints was stronger at a lower level of environmental uncertainty (coefficient = 0.002252, 95% CI = [0.00165, 0.002856]) than at a higher level (coefficient = 0.001829, 95% CI = [0.00124, 0.002424]). That is, the moderated mediation effect of ESG performance-financing constraints - cost of equity capital is significant, and the conditional indirect effect decreases slowly with the increase of investors’ heterogeneous beliefs. These results imply that investors’ heterogeneous beliefs with a lower (rather than higher) level tends to pay close attention from ESG performance by stakeholders and financing constraints decreases, which then leads to the reduction of investors’ expected risk. For companies with low investors’ heterogeneous beliefs, the ESG performance released by enterprises can send a signal to the external environment, which can reduce the expected risk of investors through financing constraints.
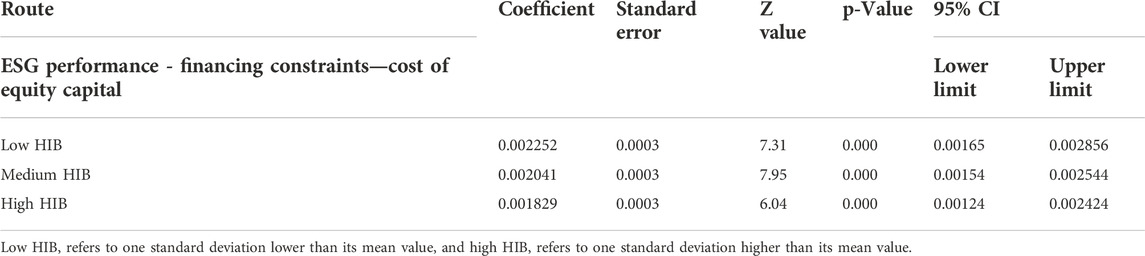
TABLE 4. Conditional effect regression of stock liquidity.
5 Robustness test
5.1 Replacing the measurement method of the explained variable
To further strengthen the robustness of the results, this paper first uses the OJ method to calculate the cost of equity capital (r_OJ) again and then uses the benchmark model to regress the whole sample. The empirical results are shown in column (1) of Table 5. Table 5 shows that the coefficient of ESG performance on the cost of equity capital (r_OJ) is −0.0020, which is significant at the 10% level. The conclusions drawn from the previous empirical analysis of H1 are thus still valid.
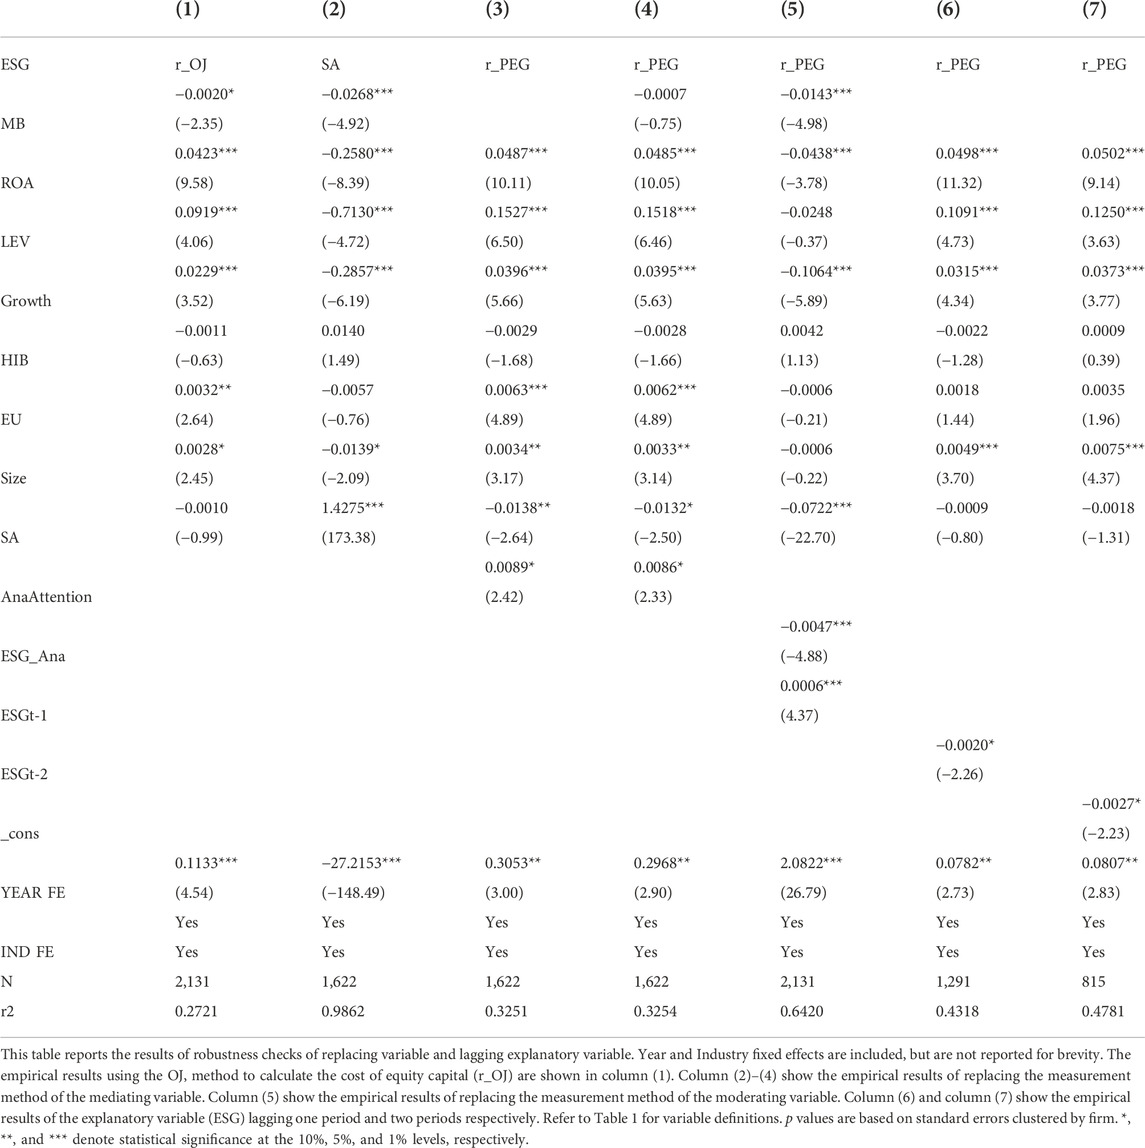
TABLE 5. The robustness checks of replacing variable and Lagging explanatory variable.
5.2 Replacing the measurement method of the mediating variable
In this part, the SA index constructed by Hadlock and Pierce (Hadlock and Pierce, 2010) is selected to re measure enterprise financing constraints. The SA index is constructed by sequential logical analysis and regression estimation coefficient. The specific formula is
SAit = -0.737∗Sizeit +0.043∗Sizeit2-0.040∗Ageit
Size represents the natural logarithm of the total asset size of the enterprise; Age represents the enterprise business year, which equals to current accounting period minus the enterprise establishment time (year). The larger the index is, the more serious the financing constraint is. In order to re measure the financing constraints, the subsequent robustness test is carried out. Column (2) in Table 5 shows that the coefficient of financing constraints (SA) on ESG performance (ESG) is −0.0268, which is significant at the 1% level, the previous empirical analysis of H2 are thus still valid. Column (3) in Table 5 shows that the coefficient of the cost of equity (r_PEG)on financing constraints (SA) is 0.0089, which is significant at the 1% level, the previous empirical analysis of H3 are thus still valid. Column (4) in Table 5 shows that the coefficient of ESG performance (ESG) is not significant, while the coefficient of financing constraints (SA) is 0.0086 which is significant at the 1% level, the previous empirical analysis of H5a are thus still valid.
5.3 Replacing the measurement method of the moderating variable
In this part, according to the availability of data, the number of analyst attention is selected as an alternative measure for investors’ heterogeneous beliefs. The little the number is, the more serious the investors’ heterogeneous beliefs is, so this is reverse indicator. Column (5) in Table 5 shows that the coefficient of Multiplicative term (ESG_Ana) is, which is significant at the 1% level. The previous empirical analysis of H5a are thus still valid.
5.4 Lag explanatory variable
In this work, the explanatory variable (ESG) lags one period and two periods to alleviate the two-way causality problem. The results in columns (6) and (7) of Table 5 show that the coefficient of the explanatory variable (ESGt-1) lagging one period is −0.002, which is significantly positive at 1%, and the coefficient of the explanatory variable (ESGt-2) lagging two periods is −0.0027, which is significantly positive at 1%. The result of the basic regression is robust. The results show that the ESG rating will reduce the expected risk of investors in the next year, and the coefficient of lagging two years (−0.0027) is higher than that lagging one year, indicating that the expected risk of enterprises by investors based on ESG performance takes time and lags. It thus can be concluded that the result of the basic regression is robust.
5.5 Instrumental variable method
Referring to the work of Quan (Quan et al., 2015), the mean ESG performance (ESG_ind) of other listed companies in the same industry is used as the instrumental variable. The ESG rating of each enterprise will be affected by the ESG rating of other enterprises in the same industry, and the ESG rating of other enterprises is not directly related to the cost of equity capital of an enterprise. In this paper, the two-stage least square (2SLS) method is used for instrumental variable regression. Column (1) of Table 6 reports the regression results of the first stage, and Column (2) reports those of the second stage. In the first stage, the F value of Anderson Rubin Wald is 12.13, passing the weak instrumental variable test. In the second stage, the coefficient of ESG is -0.039, which is significantly negative at the 5% level, indicating that the conclusion that ESG performance can significantly reduce the cost of equity capital is stable.
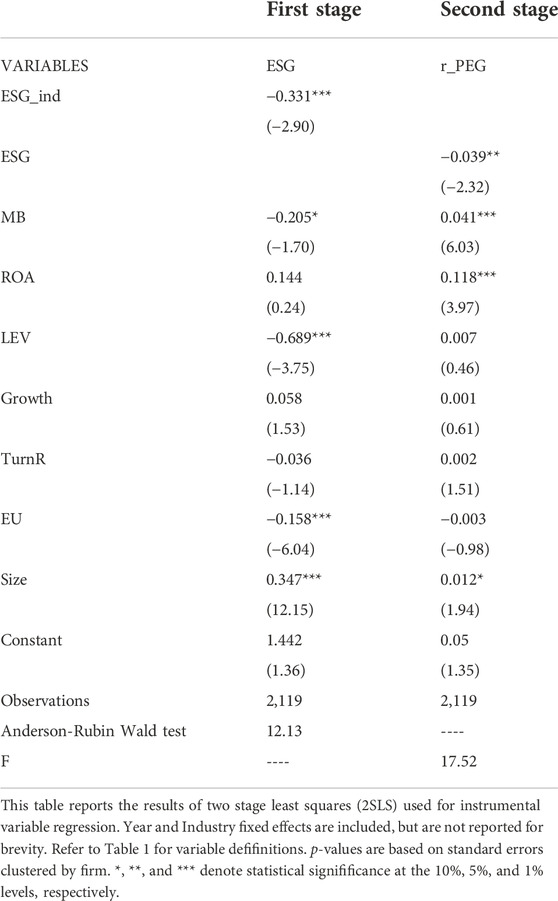
TABLE 6. The Robustness checks of Instrumental variable method.
6 Conclusions and policy Implication
6.1 Conclusions
Combining theories related to environmental information disclosure and enterprise economic behavior, this paper examines 2,131 observation samples of the A-share market for 2015–2020; uses a mixed panel model, panel double fixed effects and other models and transforms variables to alleviate endogeneity. Through regression analysis, this paper obtains a more robust empirical result: We find that enterprises with high ESG performance will release favorable information, which will help ease the information asymmetry between investors and enterprises, further ease the financing constraints, reduce the expected risk of investors, and thus reduce the cost of equity capital. We also find that investors’ heterogeneous beliefs can significantly adjust the negative correlation between ESG performance and financing constraints. The higher the degree of investors’ heterogeneous beliefs faced by enterprises, that is, the greater the divergence of investors’ opinions. Even enterprises with high ESG performance will have higher investors’ expected risks, because the higher the degree of investors’ heterogeneous beliefs, the more serious the financing constraints.
6.2 Policy Implication
Our research has several practical implications. First, emphasising on ESG performance help enterprises to distinguish investors’ expected risk. Regulators and policymakers can consider formulating more detailed ESG construction standards to improve the operability of enterprises. Such as guide enterprises to transmit more detailed information about ESG’s behavior process and results to the capital market, and improve relevant guidance policies of ESG. Second, our overall results encourage A-share listed companies to continue to invest and report ESG activities because their cost of equity capital is affected by ESG ratings. Third, this study shows that a company’s support for continuous contribution is beneficial to the environment and society and to their own development. In addition, our findings can help managers understand how their investors respond to their corporate ESG practices. Therefore, they can establish an optimal corporate social ESG strategy so that they can benefit from financing. Moreover, enterprises managers should impose better information discloure to decrease investors’ heterogeneous beliefs so as to the reduction of investors’ expected risk
6.3 Limitations
This study has some limitations, which can guide future research. First, to measure the Cost of Equity Capital, we were only able to use ex ante models such as the PEG and OJ models. Future research can apply other models, such as the model of Gebhardt (Gebhardt and Swaminathan, 2001), to test our hypothesis. In addition, although we prove how investors view the ESG performance of Chinese enterprises, we do not discuss the differences in detail, such as the impact of the separate evaluation of ESG dimensions on the cost of equity capital, due to a lack of data in domestic databases, placing such an analysis beyond the scope of our research. Finally, is relationship between ESG and the cost of equity capital affected by other factors? Can analyst tracking reveal this relationship and can risk-related reasons be used to explain it? These are interesting research questions whose answers have important policy implications.
Data availability statement
The original contributions presented in the study are included in the article/supplementary material, further inquiries can be directed to the corresponding author.
Author contributions
Conceptualization, HT; methodology, HT; software, HT; data curation, HT; writing—original draft preparation, HT; writing—review and editing, HT. All authors have read and agreed to the published version of the manuscript.
Funding
This research was funded by Philosophy and Social Science Planning Project of Guangdong, Guangdong, China, grant number GD18XGL01. Scientific Research and Innovation Team Project, School of Management, Beijing Normal University at Zhuhai, grant number GL20190303.
Conflict of interest
The author declares that the research was conducted in the absence of any commercial or financial relationships that could be construed as a potential conflict of interest.
Publisher’s note
All claims expressed in this article are solely those of the authors and do not necessarily represent those of their affiliated organizations, or those of the publisher, the editors and the reviewers. Any product that may be evaluated in this article, or claim that may be made by its manufacturer, is not guaranteed or endorsed by the publisher.
References
Ashforth, B. E., and Gibbs, B. W. (1990). The double-edge of organizational legitimation. Organ. Sci. 1 (2), 177–194. doi:10.1287/orsc.1.2.177
Banerjee, S. (2011). Learning from prices and the dispersion in beliefs. Rev. Financ. Stud. 24 (24), 3025–3068. doi:10.1093/rfs/hhr050
Bhamra, H., and Uppal, R. (2014). Asset prices with heterogeneity in preferences and beliefs. Rev. Financ. Stud. 2014 (27), 519–580. doi:10.1093/rfs/hht051
Boehme, R. D., Danielsen, B. R., and Sorescu, S. M. (2006). Short-sale constraints, differences of opinion and overvaluation. J. Financ. Quant. Anal. 41 (2), 455–487. doi:10.1017/s0022109000002143
Branco, M. C., and Rodrigues, L. L. (2006). Corporate social responsibility and resource-based perspectives. J. Bus. Ethics 69 (2), 111–132. doi:10.1007/s10551-006-9071-z
Brockett, A., and Rezaee, Z. (2012). Corporate sustainability: Integrating performance and reporting. Hoboken, NJ: John Wiley & Sons.
Chen, Guojin, Hu, Chaofan, and Wang, Jing (2009). Heterogeneous beliefs and stock returns: An empirical study based on China's stock market. Finance, trade Econ. (3), 26–31.
Cheng, C. S., Collins, D., and Huang, H. H. (2006). Shareholder rights, financial disclosure and the cost of equity capital. Rev. Quant. Finan. Acc. 27, 175–204. doi:10.1007/s11156-006-8795-2
Crifo, P., Forget, V. D., and Teyssier, S. (2015). The price of environmental, social and governance practice disclosure: An experiment with professional private equity investors. J. Corp. Finance 30, 168–194. doi:10.1016/j.jcorpfin.2014.12.006
Deegan, C. (2017). Twenty five years of social and environmental accounting research within Critical Perspectives of Accounting : Hits, misses and ways forward. Crit. Perspect. Account. 43, 65–87. doi:10.1016/j.cpa.2016.06.005
Dhaliwal, D., Li, O. Z., Tsang, A., and Yang, Y. G. (2014). Corporate social responsibility disclosure and the cost of equity capital: The roles of stakeholder orientation and financial transparency. J. Account. Public Policy 33 (4), 328–355. doi:10.1016/j.jaccpubpol.2014.04.006
Dhaliwal, D. S., Li, O. Z., Tsang, A., and Yang, Y. G. (2011). Voluntary nonfinancial disclosure and the cost of equity capital: The initiation of corporate social responsibility reporting. Account. Rev. 86 (1), 59–100. doi:10.2308/accr.00000005
Diether, K. B., Malloy, C. J., and Scherbina, A. (2002). Differences of opinion and the cross section of stock returns. J. Finance 57 (5), 2113–2141. doi:10.1111/0022-1082.00490
Easton, P. P. E. (2004). PE ratios, PEG ratios, and estimating the implied expected rate of return on equity capital. SSRN J. 79, 73–96. doi:10.2139/ssrn.423601
El Ghoul, Sadok, Guedhami, Omrane, and Kim, Yongtae (2017). Country-level institutions, firm value, and the role of corporate social responsibility initiatives. J. Int. Bus. Stud. 48 (3), 360–385. doi:10.1057/jibs.2016.4
El Ghoul, Sadok, Guedhami, Omrane, Kwok, Chuck C. Y., and Mishra, Dev R. (2011). Does corporate social responsibility affect the cost of capital? J. Bank. Finance 35 (9), 2388–2406. doi:10.1016/j.jbankfin.2011.02.007
Eliwa, Yasser, Ahmed, Aboud, and Ahmed, Saleh (2019). ESG practices and the cost of debt: Evidence from EU countries. Crit. Perspect. Account. 79, 102097. doi:10.1016/j.cpa.2019.102097
Freeman, R. E. (2010). Strategic management: A stakeholder approach. New York: Cambridge University Press.
Gao, Y., Mao, C. X., and Zhong, R. (2006). Divergence of opinion and long-term performance of initial public offerings. J. Financ. Res. 29 (1), 113–129. doi:10.1111/j.1475-6803.2006.00169.x
Gebhardt, W., and Swaminathan, B. (2001). Toward an implied cost of capital. J. Account. Res.Journal Account. Res. 39, 135–176. doi:10.1111/1475-679X.00007
Ghosh, D., and Olsen, L. (2009). Environmental uncertainty and managers’use of discretionary accruals. Account. Organ. Soc. 34 (2), 188–205. doi:10.1016/j.aos.2008.07.001
Gu, Leilei, and Guo, jianluan (2020). Wang hongyu corporate social responsibility. financing constraints Enterp. financialization Financial Res. (2), 109–127.
Hadlock, C. J., and Pierce, J. R. (2010). New evidence on measuring financial constraints: Moving beyond the KZ index. Rev. Financ. Stud. 23 (5), 1909–1940. doi:10.1093/rfs/hhq009
Hail, L., and Leuz, C. (2009). Cost of capital effects and changes in growth expectations around U.S. cross-listings. J. Financ. Econ. 93, 428–454. doi:10.1016/j.jfineco.2008.09.006
Haque, F., and Ntim, C. G. (2018). Environmental policy, sustainable development, governance mechanisms and environmental performance. Bus. Strategy Environ. 27 (3), 415–435. doi:10.1002/bse.2007
Haseeb, M., Hussain, H. I., Kot, S., Androniceanu, A., and Jermsittiparsert, K. (2019). Role of social and technological challenges in achieving a sustainable competitive advantage and sustainable business performance. Sustainability 11, 3811. doi:10.3390/su11143811
Hashim Syarif, Diana, Wahyudi, Sugeng, and Demi Pangestuti, Irene Rini (2019). Financial constraints and cost of equity: Empirical study of shariah compliant firms in Indonesia. Res. World Econ. 10 (3), 371. doi:10.5430/rwe.v10n3p371
Hayes, A. F. (2013). Introduction to mediation, moderation, and conditional process analysis: A regression-based approach. New York, NY: Guilford Press.
Henriksson, R., Livnat, J., Pfeifer, P., and Stumpp, M. (2019). Integrating ESG in portfolio construction. J. Portfolio Manag. 45 (4), 67–81. doi:10.3905/jpm.2019.45.4.067
Hong, H., and Stein, J. Disagreement and the stock market[J], J. Econ. Perspect., 2007, 21 (2) : 109–128. doi:10.1257/jep.21.2.109
Houge, T., Loughran, T., Suchanek, G., and Yan, X. (2001). Divergence of opinion, uncertainty, and the quality of initial public offerings. Financ. Manag. 30 (4), 5–23. doi:10.2307/3666256
Jin, Li (2021). Research on ESG risk premium and additional return in China's. A-share Mark. Secur. Mark. guide (6), 24–33.
Khan, M., Serafeim, G., and Yoon, A. (2016). Corporate sustainability:first evidence on materiality. Account. Rev. 91 (6), 1697–1724. doi:10.2308/accr-51383
Kim, S. M., Kim, S. M., Lee, D. H., and Yoo, S. W. (2019). How investors perceive mandatory audit firm rotation in Korea. Sustainability 11 (4), 1089. doi:10.3390/su11041089
Kong, Dongmin, Kong, Gaowen, and Liu, Shasha (2015). Liquidity and information efficiency. J. Manag. Sci. (3), 1–15.
Lang, M., Lins, K. V., and Maffett, M. (2012). Transparency, liquidity, and valuation: International evidence on when transparency matters most. J. Acc. Res. 50 (3), 729–774. doi:10.1111/j.1475-679X.2012.00442.x
Li, D., and Zhang, L. (2010). Does q-theory with investment frictions explain anomalies in the cross section of returns? J. Financ. Econ. 98 (2), 297–314. doi:10.1016/j.jfineco.2010.06.001
Lin, Chien-Chih, and Lin, Feng-Teng (2010). Heterogeneous beliefs in asset pricing: When investors’ estimates of asset volatility disagree. Asia-Pacific J. Financial Stud. 39 (6), 720–735. doi:10.1111/j.2041-6156.2010.01030.x
Liu, W. (2006). A liquidity-augmented capital asset pricing model. J. Financ. Econ. 82 (3), 631–671. doi:10.1016/j.jfineco.2005.10.001
Luo, Di.ESG, liquidity, and stock returns[J]. J. Int. Financial Mark. Institutions Money, 78, 101526, 2022.doi:10.1016/J.INTFIN.2022.101526
Maaloul, A., Zéghal, D., Ben Amar, W., and Mansour, S. (2021a). The effect of environmental, social, and governance (ESG) performance and disclosure on cost of debt:the mediating effect of corporate reputation. Corp. Reput. Rev., 35. doi:10.1057/S41299-021-00130-8
Maaloul, A., Zéghal, D., Ben Amar, W., and Mansour, S. (2021b). The effect of environmental, social, and governance (ESG) performance and disclosure on cost of debt: The mediating effect of corporate reputation. Corp. Reput. Rev., 4753. doi:10.1057/S41299-021-00130-8
Mao, Xinshu, and ye, kangtao (2012). Zhang Zhen Measurement and evaluation of equity capital cost of Listed Companies - Based on the empirical test of China's securities market. Account. Res. (11), 12–22.
Mario, Quagliariello (2009). Macroeconomic uncertainty and banks' lending decisions: The case of Italy. Appl. Econ. 41 (3), 323–336. doi:10.1080/00036840601007286
Miller, E. M. (1977). Risk, uncertainty and divergence of opinion. J. Finance 32 (4), 1151–1168. doi:10.1111/j.1540-6261.1977.tb03317.x
Ng, Anthony C., and Rezaee., Zabihollah (2015). Business sustainability performance and cost of equity capital. J. Corp. Finance 34, 128–149. doi:10.1016/j.jcorpfin.2015.08.003
Nicola, Raimo, Alessandra, Caragnano, Marianna, Zito, Filippo, Vitolla, and Massimo, Mariani (2021). Extending the benefits of ESG disclosure: The effect on the cost of debt financing. Corp. Soc. Responsib. Environ. Manag. 28 (4), 1412–1421. doi:10.1002/CSR.2134
Nicola, Raimo, Alessandra, Caragnano, Marianna, Zito, Filippo, Vitolla, and Massimo, Mariani (2021). Extending the benefits of ESG disclosure: The effect on the cost of debt financing. Corp. Soc. Responsib. Environ. Manag. 28 (4), 1412–1421. doi:10.1002/CSR.2134
Ohlson, J. A., and Juettner-Nauroth, B. E. (2005). Expected EPS and EPS growth as determinants of value. Rev. Acc. Stud. 10 (2-3), 349–365. doi:10.1007/s11142-005-1535-3
Peter, O., and Qin, Z., Information and heterogeneous beliefs: Cost of capital, trading volume, and investor welfare[J]. Account. Rev., 2014, 89(1).209–242.doi:10.2308/accr-50605
Pina, Murè, Marco, Spallone, Fabiomassimo, Mango, Stefano, Marzioni, and Lucilla, Bittucci. ESG and reputation: The case of sanctioned Italian banks[J]. Corp. Soc. Responsib. Environ. Manag., 2020, 28(1), 265–277.doi:10.1002/CSR.2047
Porter, M. E., and Kramer, M. R. (2006). Strategy and society:the link between competitive advantage and corporate social responsibility. Harv. Bus. Rev. 84 (12), 78–92. Available at://hbr.org/2006/12/strategy-and-society-the-link-between-competitive-advantage-and-corporate-social-responsibility.
Preacher, K. J., Rucker, D. D., and Hayes, A. F. (2007). Addressing moderated mediation hypotheses: Theory, methods, and prescriptions. Multivar. Behav. Res. 42 (1), 185–227. doi:10.1080/00273170701341316
Qiu, M. Y., and Yin, H. (2019). Analysis of enterprises’ ESG performance and financing costs under the background of ecological civilization construction. J. Quan Tech. Econ. 3, 108–123. doi:10.13653/j.cnki.jqte.2019.03.007
Quan, Xiaofeng, Wu, Shinong, and Yin, Hongying (2015). Corporate social responsibility and the risk of stock price collapse: “value weapon” or “self-interest tool. Econ. Res. 50 (11), 49–64.
Saad, Mohsen, and Samet, Anis. Liquidity and the implied cost of equity capital[J]. J. Int. Financial Mark. Institutions Money, 2017, 51.
Shakil, M. H., Tasnia, M., and Mostafiz, M. I. (2020). Board gender diversity and environmental, social and governance performance of US banks: Moderating role of environmental, social and corporate governance controversies. Int. J. Bank. Mark. 39 (4), 661–677. doi:10.1108/IJBM-04-2020-0210
Sharfman, M. P., and Fernando, C. S. (2008). Environmental risk management and the cost of capital. Strateg. Manag. J. 29 (6), 569–592. doi:10.1002/smj.678
Stock Exchange (Tsx), Toronto (2014). A primer for environmental and social disclosure. Available at http:/www.tmx.com.
Tong, Menghua, and Xu, Dongyan. Zheng Tianwen Corporate environmental information disclosure and the cost of equity capital - an. analysis intermediary Eff. based Inf. Transpar. Soc. Responsib. Res. financial issues 2020 (2), 63–71. doi:10.19654/j.cnki.cjwtyj.2020.02.008
Tran, Vu, Alsakka, Rasha, and ap Gwilym, Owain (2019). Investors’ heterogeneous beliefs and the impact of sovereign credit ratings in foreign exchange and equity markets. Eur. J. Finance 25 (13), 1211–1233. doi:10.1080/1351847X.2019.1586743
Wen, Zhonglin (2014). Analyses of mediating effects: The development of methods and models. Adv. Psychol. Sci. 22 (05), 731–745. doi:10.3724/sp.j.1042.2014.00731
Wood, D. J. (1991). Corporate social performance revisited. Acad. Manag. Rev. 16 (4), 691–718. doi:10.2307/258977
Xu, Yifan, Fan, Muyuan, Huang, Chengling, Liu, Shuilan, Ruan, Zhirong, and Chen, Jin (2022). The relationship between ESG information disclosure, media attention and corporate debt financing costs. Front. Econ. Manag. 3 (2). doi:10.6981/FEM.202202_3(2).0071
Zhang, Dongyang, Wang, Cao, and Dong, Yu. (2022). How does firm ESG performance impact financial constraints? An experimental exploration of the COVID-19 pandemic. Eur. J. Dev. Res., 1–21. doi:10.1057/S41287-021-00499-6
Keywords: ESG performance, cost of equity capital, financing constraints, heterogeneous beliefs, sustainable development
Citation: Tang H (2022) ESG performance, investors’ heterogeneous beliefs, and cost of equity capital in China. Front. Environ. Sci. 10:992559. doi: 10.3389/fenvs.2022.992559
Received: 12 July 2022; Accepted: 15 November 2022;
Published: 25 November 2022.
Edited by:
Muhammad Mohsin, Jiangsu University, ChinaReviewed by:
Nadeem Iqbal, Air University, PakistanHamed Fazlollahtabar, Damghan University, Iran
Yasin Şeker, Hitit University, Turkey
Copyright © 2022 Tang. This is an open-access article distributed under the terms of the Creative Commons Attribution License (CC BY). The use, distribution or reproduction in other forums is permitted, provided the original author(s) and the copyright owner(s) are credited and that the original publication in this journal is cited, in accordance with accepted academic practice. No use, distribution or reproduction is permitted which does not comply with these terms.
*Correspondence: Hua Tang, tanghua@bnuz.edu.cn