
94% of researchers rate our articles as excellent or good
Learn more about the work of our research integrity team to safeguard the quality of each article we publish.
Find out more
ORIGINAL RESEARCH article
Front. Environ. Sci. , 01 February 2023
Sec. Soil Processes
Volume 10 - 2022 | https://doi.org/10.3389/fenvs.2022.991262
This article is part of the Research Topic Early-Career Scientists’ Contributions to Soil Processes Research: 2022 View all 7 articles
 Susan E. Crow1*
 Hannah Hubanks1
 Jonathan L. Deenik2Tai McClellan Maaz2Christine Tallamy Glazer1Elaine Vizka1
 Johanie Rivera-Zayas1
Soil health conceptualized as a measurable ecosystem property provides a powerful tool for monitoring progress in restoration projects or implementation of best management practices to improve degraded lands and promote sustainable agroecosystems. We surveyed soils collected from a range of land uses (i.e., protected native and non-native forest, managed pasture, unmanaged previously intensive agricultural lands, organic cropland, and conventional cropland) across a range of soil orders (Oxisol, Mollisol, Andisol, Inceptisol, and Vertisol) on three Hawaiian Islands. Forty-six soil health indicators encompassing biological, chemical, and physical properties were measured. In this multivariate survey, the most distinct group was the unmanaged, previously intensive agriculture lands, which was significantly different from all other land uses even when considering differences in mineralogy. Importantly, the soil health indicators of well-managed pastures in Hawaiʻi were not different from protected forests, suggesting that well-managed grazing lands may be as healthy and resilient as protected forests. A suite of 11 readily measured indicators emerged out of a first-principle approach to determining a holistic indication of soil health across a range of soils and systems in Hawaiʻi encompassing much of the diversity in the tropics and subtropics. Every land use may improve its soil health status within a reasonable range of expectations for a soil’s land use history, current land use, and mineralogy. Key drivers of inherent differences in the soil health indicators, including intensive land use history, current land use practices, and mineralogy, must be interwoven into the soil health index, which should set minimum and maximum benchmarks and weight indicators according to equitable standards.
The degradation of tropical and subtropical soils is widespread, and degraded lands increasingly are targeted for land-based climate action and other efforts to restore health and maintain landscapes, and ecosystem function and resilience (Olsson et al., 2019). Globally, the soil carbon (C) debt driven by the urban and agricultural expansion and intensification is substantial (Sanderman et al., 2017). Recent studies of biodiversity (Isbell et al., 2019) and reforestation highlight the challenges to potentially sequester C (Zhu et al., 2018) and soil and landscape functions regaining what is lost following soil degradation. Conceptually, climate smart soils (Paustian et al., 2016), the 4 per mille initiative (Minasny et al., 2017; Rumpel et al., 2020), and other efforts aimed at building soil C as a natural climate solution (e.g., (Bossio et al., 2020), that encompasses soil health as a holistic concept with multiple co-benefits including environmental, economic and social resiliency (Bradford et al., 2019; Lehmann et al., 2020), C storage, and climate change mitigation.
We define soil health broadly as the capacity of soil to function as a living system that sustains biological productivity; maintains environmental quality; and promotes plant, animal, and human health (Doran and Jones, 1996; Doran and Zeiss, 2000; Kibblewhite et al., 2008; Adhikari and Hartemink, 2016). Further, we recognize that soil health concepts encompass soil fertility and soil quality principles at different scales towards achieving soil security. With soil fertility being most narrowly applied to field-scale crop production, to pristine grasslands or forests used as a standard for soil quality, to all concepts encompassing soil security (Lehmann et al., 2020). Thus, soil health assessments may support a number of sustainability goals (Adhikari and Hartemink, 2016) such as Zero Hunger and Good Health and Wellbeing (UN Sustainable Development goals 2 and 3) (Bach et al., 2020). In this framework, soil organic matter and healthy soils increasingly are linked to healthy societies (Amundson et al., 2015).
Soil organic matter is the critical link between C sequestration and soil health. Soil organic matter is approximately 58% C and is central to soil functions that are supported by biological, chemical, and physical properties, that dynamically affect the balance and flow of water, nutrients, and energy through the soil ecosystem (Kibblewhite et al., 2008). Key biological, chemical, and physical indicators are common to soil health assessments, which are directly relevant to specific ecosystem services through their functional roles (such as C and nutrient cycling, air quality, water quality and cycling, habitat for flora and fauna, and climate regulation) (Lehmann et al., 2020) Many of the common soil health indicators are dynamic soil properties that are sensitive to disturbances or stressors, feasible for routine laboratory analysis, and interpretable for management (Lehmann et al., 2020). These are opposed to inherent soil properties which are resistant to change, but yet, are highly relevant and provide the critical context for understanding changes in soil health for a given soil type. An example would be interpreting a dynamic soil property such as N mineralization for soils with similar underlying mineralogy as an inherent soil property (Lehmann et al., 2020).
The tremendous diversity of tropical/subtropical soils and ecosystems (including natural and working lands, or, agroecosystems) in the small geographic space of Hawaiʻi is an opportunity to explore complex relationships between land use, land use history, soil type, and soil health indicators. Furthermore, the reconciliation of potentially competing issues of development, food production, and biodiversity in Hawaiʻi, together with the added pressure of climate change (Kurashima et al., 2019), is urgent. In the last few decades, large-scale plantation agriculture declined drastically, leaving large areas of abandoned agricultural lands across the islands. Current state law mandates improvements in soil health, C sequestration, and yields across agricultural sectors and forested land while in pursuit of achieving at least state-level C neutrality by 2045. But, like other regions across the tropics and subtropics, there are not yet science-based programs in place to support this outcome due, in part, to insufficient science specific to Hawaiʻi’s soils. Knowledge addressing this gap in Hawaiʻi, serving as a model system, can be transferred to other tropical and subtropical regions. In this context, we asked: as an ecosystem property not limited to agricultural systems, what were the predominant indicators upon which to index soil health and how are indicators of soil health most effectively assessed across tropical and subtropical regions and volcanic islands with tremendous diversity? We hypothesized that, 1) within the land uses and soils studied, the expression of soil health indicators would fundamentally differ between volcanic ash-derived soils and crystalline soils, and 2) that current land uses would affect dynamic soil health indicators secondarily to inherent soil differences.
Twenty-two sites were selected across three islands (Oahu, Maui, Molokai) within the main Hawaiian archipelago to cover a diversity of soil management, fertility, and taxonomy to maximize the variance in parameters associated with soil health. Preliminary assessments helped categorize sites into 1) current land management/use, 2) land use history, 3) disturbance level, 4) soil order, and 5) predominant mineralogy. Current land management/uses included protected forests (managed to preserve long-term non-native or native forest, greater than 100 years no disturbance from feral ungulates), unmanaged previously intensive agricultural lands (UPIAL, previously monocrop plantation with no current management system, grasses, shrubs, or forest as dominate cover, and less than 100 years no disturbance), pasture (managed with pasture grasses for rearing livestock), organic croplands (no use of chemical pesticides), and conventional croplands (use of chemical pesticides). Land use history indicated simply whether an intensive plantation history (for Hawaiʻi, this is typically sugarcane or pineapple) was present or absent. Disturbance level was defined categorically as low, medium, and high (Table 1). Soil order was according to final GPS coordinates of sample location and NRCS NCSS taxonomic classification (Web Soil Survey). Predominant mineralogy was assigned using taxonomic classification and a diagnostic key (Supplementary Table S1).
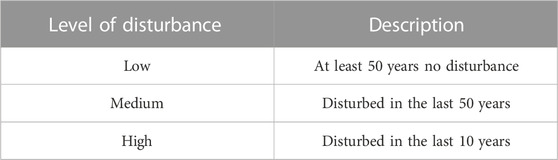
TABLE 1. Assessment of level of disturbance for each study site is categorized based on the time frames described since the most recent soil disturbance, based on available history of land use. Disturbance was considered to be land that has undergone man-made change to soil’s surface layer by physical disruption of the soil structure and ecosystem, such as tillage or compaction.
The final compilation included an integration of sites across soil types, land use history, and natural versus agricultural landscapes that is representative of Hawaiʻi (Table 2). However, as is reflective of reality, some soil types are more represented in some land uses and some current land uses are more likely to be represented in one past land use history or another. Therefore, we purposefully designed this study as a multivariate approach to identifying parameters indicative of soil function, specifically healthy soil function, for the ecosystems of Hawaiʻi (and other similar tropical/subtropical, and volcanic regions). Then, we narrowed down to key soil health indicators that can be linked to inherent drivers to facilitate the next steps of developing an index of soil health and refining the parameters for specific systems with the goal of assisting landowners, managers, and farmers to improve the health and resilience of their lands.
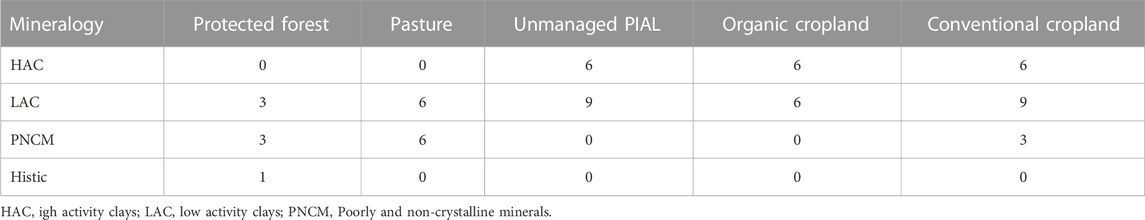
TABLE 2. Summary of sample numbers for each mineralogy class and current land use.
Three replicate samples were collected from each of the 22 sites. Each sample was comprised of five soil cores taken from the 0–15 cm depth of mineral soil using established sampling methods form the Cornell Soil Health Manual (Doran and Jones, 1996; Moebius-Clune, 2016). Briefly, the organic horizon was removed prior to soil coring 0–15 cm of mineral soil at five locations within a 1 m2 quadrant. The soil from five cores was homogenized into one sample in a bucket in the field. Three quadrants that each produced one soil sample for a site were located at least 5 m apart within the site. Thus, 66 soil samples were packaged in a cooler with ice and transported to the lab for analysis. Samples were transported to processing and storage facilities at UH Mānoa and subsets were frozen at −20°C and air-dried (<10% moisture). Additionally, a subset for phospholipid fatty acid testing (see below) was kept chilled, not frozen, and shipped immediately under refrigeration to the analysis facility.
Forty-six parameters classified as biological, chemical, or physical and tied to soil function or process were measured for each of the 66 samples (Supplementary Table S2).
The principle components, based on the key soil health indicators covariance matrix, of each sample location was summarized using principal components analysis (PCA in PC-ORD v.7.0) The response matrix included 46 parameters in 66 soil samples. Uneven distribution of data (i.e., a slight horseshoe shape with clear outliers) in the 2D output suggested the need to transform data, which was confirmed by assessing distribution tables of each variable for non-normality (Peck, 2016). Transformations of log, cube root, and square root were tested on each highly skewed variable since all were either positively or negatively skewed with single peaks. Transformed variables were rerun for skewness and the transformation with the lowest skewness value was selected as the best possible transformation. A new PCA using variables transformed for normality showed an improved graphical display regarding spatial distribution of plots and outlier assessment.
Values from the 46 measured parameters served as the main dataset for PCA ordination, and overlays of supplemental environmental data operated as the second matrix including current land management, historical disturbance, soil order, and soil series. Potential variables were individually removed and re-added to determine their influence on the PCA and assess any significant impact on results, while using the second matrix overlays to identify issues with the distributions of data balance or flag potential errors in data manipulation. To avoid potential bias, variables problematic to overall balance were removed. Supplemental environmental data operated as the second matrix including current land management/use, land use history, disturbance level, soil order, predominant mineralogy, and combinations relevant to hypothesis testing.
The normally distributed soil health indicator matrix was analyzed using a standardized PCA with a correlation cross-products matrix, which produces correlation coefficients among the variables and further standardizes non-comparable response variables. This method provides a broken stick eigenvalue; the broken stick eigenvalue was less than the actual eigenvalue for the first four axes, therefore these are all presented and interpreted to some degree (Peck, 2016). Rnd-Lambda randomization results agreed with the broken stick method, the last useful axis is four with p = .001 and cumulative variance explained at 71.7%.
Multi-response permutation procedure (MRPP) is a non-parametric multivariate test of differences between groups (Peck, 2016). The A statistic describes effect size with respect to how similar within-group samples are compared to outside the group samples. When A = 1, sample units within each group are identical, when A = 0, groups are no more different than expected by chance. We tested all possible models based on the site attributes—agricultural history, current land use, soil order, mineralogical class, disturbance level, and cropland versus non-cropland. The MRPP was run with Euclidean distance measure on the transformed data. Any contrast with less than two sites (6 sample points) was excluded. In the final model, an adjusted p-value was calculated by dividing the model p-value by the number of pairwise contrasts, the adjusted p-value was used to determine whether a pairwise contrast was significant or not.
The list of 46 potential indicators of soil health was reduced to a short list of key indicators that meet multiple criteria for capturing the breadth of soil health as an ecosystem property, reducing multicollinearity with other variables, and practicality for inclusion in a routine soil test. First, potential parameters were removed if r < .50 or > −.50 with axis 1 in the PCA, which left 26 selected for further assessment. A hierarchical ordering correlogram of the untransformed values for remaining 26 selected parameters was performed in R. Highly correlated parameters were reduced further on the basis of practicality (i.e., combination of cost and difficulty). The final list was cross checked to maintain balanced coverage across biological, chemical, and physical properties. Within the constraints of the original sample design, the key parameters of soil health were compared across a subset of mineral and land use classes to assess their utility as indicators of soil health.
Univariate analyses were conducted to first determine the effect of past land use (PIAL versus none) and then assess the effect of current land use (protected forest, pasture, UPIAL, organic cropland, versus conventional cropland) on each of the 11 soil health indicators. A mixed model ANOVA approach was used to assess the main effect of past or present land use with soil mineralogical classes as the random effect [lmer function in the lme4 package (Bates et al., 2015)]. General linear hypothesis testing [glht function in multcomp package (Lenth, 2020)] was performed to compare group means (Tukey-adjusted). For a subset of the data (including UPIAL, organic cropland, and conventional cropland in LAC and HAC soils), mixed factorial ANOVA was performed to examine the interactive effect of soil mineralogical class and current land use on each soil health indicator with farm/location as the random effect (lmer function in the lme4 package). Group differences were assessed by Tukey multiple comparisons of least square means (lsmeans function in emmeans package). For all post hoc multiple comparisons with the Tukey test, letter groupings were assigned with the cld function (multcomp package (Piepho, 2004)).
Soil was collected from a range of land uses (identified a priori as protected native and non-native forest, managed pasture, unmanaged previously intensive agricultural lands (UPIAL), organic cropland, and conventional cropland) (Figure 1) across a range of soil orders and clay mineralogy (Oxisol, Mollisol, Andisol, Inceptisol, and Vertisol) on three islands. When possible, pairs or triplets of sites were obtained on the same, or related, soil series but different land use. Forty-six parameters across biological, chemical, and physical soil properties were measured and analyzed with a multivariate approach to 1) test for the predominant drivers of inherent (i.e., clay mineralogy, texture) differences in soil on a heterogenous landscape and 2) deduce a key set of indicators that may represent soil health as an ecosystem property. Four significant principle components analysis (PCA) axes cumulatively explained 71.7% of the variance within the soil health indicator dataset. The two dominant axes explained 43.0% and 12.3% of variance, followed by the next two that explained a further 9.0% and 7.4%. Many of the parameters across biological, chemical and physical soil properties, strongly correlated (i.e., r > .5) to the positive or negative side of axis 1 (Supplementary Table S3).
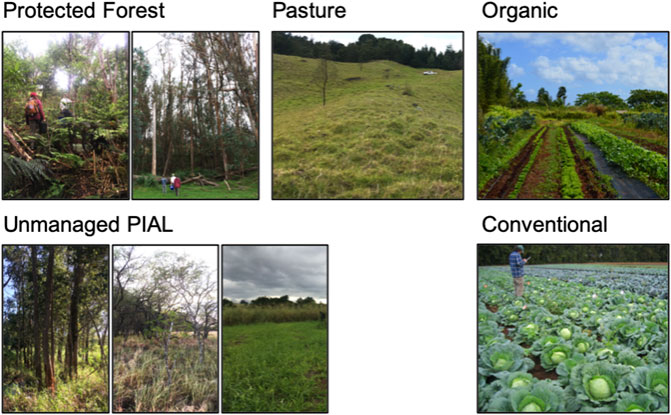
FIGURE 1. Images from field sites in each category of current land use. Protected forest included both native (left) and non-native (right) stands. Unmanaged, previous intensive agriculture lands (PIAL) included forest stands (left), shrub lands (center), and grasslands (right). Pasture sites were managed grazing lands; croplands included organic and conventional managements.
Land use, specifically the legacy of intensive cultivation, predominated over soil type to influence the indicators of soil health. Visualization of axis 1 and 2 of the PCA showed that regardless of current land use and soil type, sites with a history of long-term intensive cultivation clustered independently from other land uses within forest and pasture classifications (Figure 2). Sites without a plantation agricultural history (i.e., 80+ years of sugarcane or pineapple) separated out from those sites with intensive land use history along axis one. The top five strongest (i.e., r > .95) parameters driving the sites with no intensive agricultural history toward the negative side of axis 1 were high Gram negative bacteria, total phospholipid fatty acids (PLFA), organic carbon (OC) concentration, total N concentration, and actinomycetes. The negative side of axis 1 was also driven by high values of many additional biological parameters not listed as well (Supplementary Table S3). In contrast, those sites with a plantation history had low concentration of those parameters negatively related to axis one, and high bulk density (BD), dissolved OC (DOC) to dissolved organic N (DON) ratio, actinomycetes to bacteria ratio, clay concentration, and crystalline Fe oxides. Axis 2 did not provide a clear separation among the past or current land use classifications.
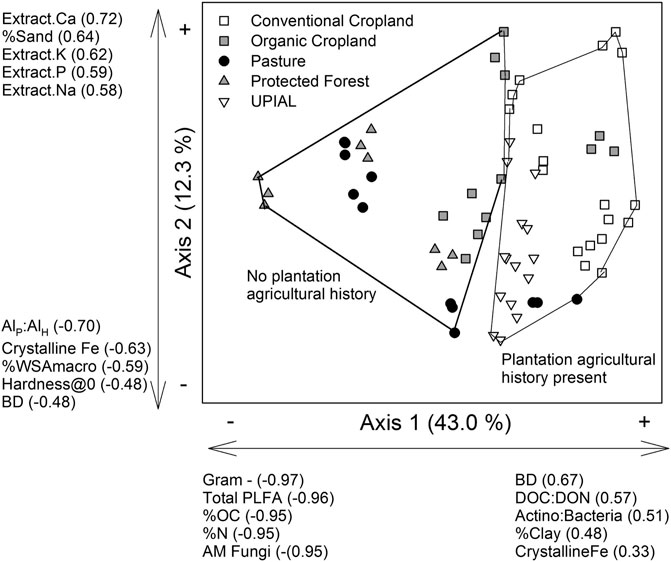
FIGURE 2. Principal components analysis of all potential soil health indicators with the top five most negatively and positively correlated variables to axis 1 and axis 2. Correlation values for each parameter to the axis follow it in parentheses. Groups are delineated based on whether an intensive plantation agricultural history is present or absent at that site. The current land use of each site is also indicated: conventional cropland (white square), organic cropland (grey square), pasture (black circle), protected forest (grey triangle), or unmanaged previously intensive agriculture (UPIAL, upside down white triangle). The amount of variability explained by each axis is in parentheses.
To a certain degree, some current land uses correspond to areas with an intensive agricultural past and others to areas without due to land availability and suitability. For example, the sampling sites classified as conventional cropland and UPIAL (by its own definition) reside exclusively within the cluster defined by an intensive agricultural history. Likewise, all the sampled protected forests occurred in areas without the agricultural past. However, organic croplands and pastures resided within both types of areas with and without the intensive agricultural past. Visualization of axes two and three showed no separation among land use history or current status (Supplementary Figure S1).
Soil type, as defined by soil order and more broadly by mineralogical class (i.e., high activity clays, low activity clays, poorly and non-crystalline minerals, and histic) was not strongly associated with axis 1 (Figure 3). Both high and low activity clays aligned with the positive side of axis 1 associated with high BD, DOC:DON, clay and crystalline minerals. However, high activity clays included Vertisols and Mollisols, and associated with the positive side of axis two, driven by high extractable Ca2+, K+, P, and Na2+, and sand concentration. Low activity clays included Ultisols and Oxisols, and associated more with the negative side of axis 2, driven by high ratio of pyrophosphate to hydroxylamine extractable Al, crystalline Fe oxides, concentration of mega size class water stable aggregates, soil hardness at the surface layers, and BD. Histic soils fell on the negative side of axis 1 which correlated highly with total OC, total N, Actino:Bacteria, and AM Fungi. Visualization of axis 2 and 3 helped further separate out the histic and poorly and non-crystalline mineral (PNCM) groups (Supplementary Figure S1). Particularly with respect to the Andisols and andic Inceptisols having high concentration of poorly and non-crystalline minerals (AlH+0.5FeH), PNCM separation from other soils was driven by silt and sand concentration, fungi to bacteria ratio, and concentration of “mega” size class water stable aggregates.
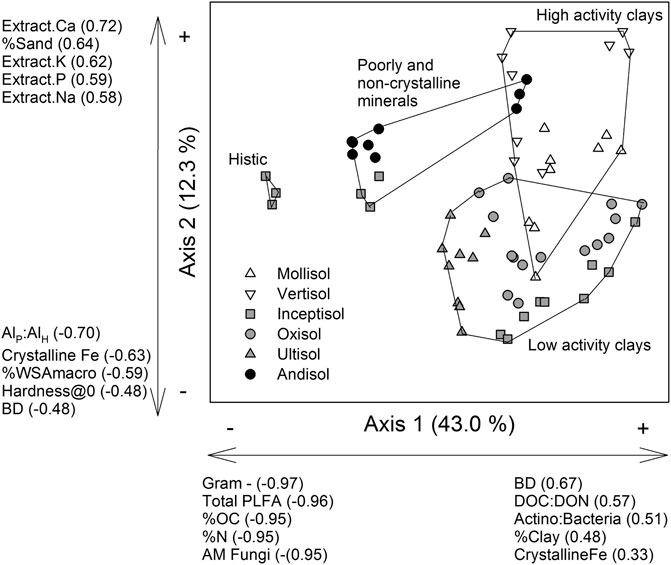
FIGURE 3. Principal components analysis of all potential soil health indicators with the top five most negatively and positively correlated variables to axis 1 and axis 2. Correlation values for each parameter to the axis follow it in parentheses. Groups are delineated based on broad mineralogical categorization at that site. The soil order of each site is indicated as Mollisol (white triangle), Vertisol (upside down white triangle), Inceptisol (grey square), Oxisol (grey circle), Ultisol (grey triangle), and Andisol (black circle). The amount of variability explained by each axis is in parentheses.
Multiple multi-response permutation procedure (MRPP), a non-parametric multivariate test of differences between groups (Peck, 2016), models were run among the categorical classifications and selected combinations for hypothesis testing to identify indicators of soil health (Supplementary Table S4). The combination of agricultural history and disturbance level was the second most significant contrast (adjusted p = .008, A value = .2636). The significant pairwise comparisons indicate that those sites classified as PIAL-medium are different than those PIAL-high and none-high; none-low is different than PIAL-medium and none-high. These results indicate first that sites with a plantation history and medium disturbance classification were more like one another than to those with a high disturbance level (i.e., currently in intensive cultivation), regardless of whether there was plantation past land use or not. Second, undisturbed sites with no plantation history were more like one another than to those with a plantation history and medium current disturbance classification or those with no plantation history but currently under intensive practices. The combination of agricultural history and current land use was also among the significant contrasts tested and yielded similar results to the interaction with plantation history and disturbance level. In the pairwise comparisons, those sites classified as PIAL and currently unmanaged (UPIAL) are different from PIAL and currently in conventional cropland, and from sites with no plantation history and currently in organic cropland, pasture, or protected forest. The simpler current land use model had the third highest A value (.2583) and 10 pairwise contrasts that separated from one another along the dominant PCA axis.
The most distinct group was the UPIAL land use class, which was significantly different from all other land uses (Figure 4). Pasture sample units spanned axis 1 yet were significantly different than UPIAL and organic croplands in multivariate space indicating a latent interaction with mineralogy unable to be explored further within the constraints of our dataset. Pastures were not different from protected forests and the two groups showed a lot of overlap in the 2-dimensional visualization of axis 1 and 2, also signaling a potential influence of similar mineralogy. In the case of conventional agriculture, the sample units were so dispersed within the group, that no differences emerged between it and the other current land uses, except for UPIAL. However, organic croplands were similar enough to one another to be significantly different than UPIAL, pastures, and protected forests.
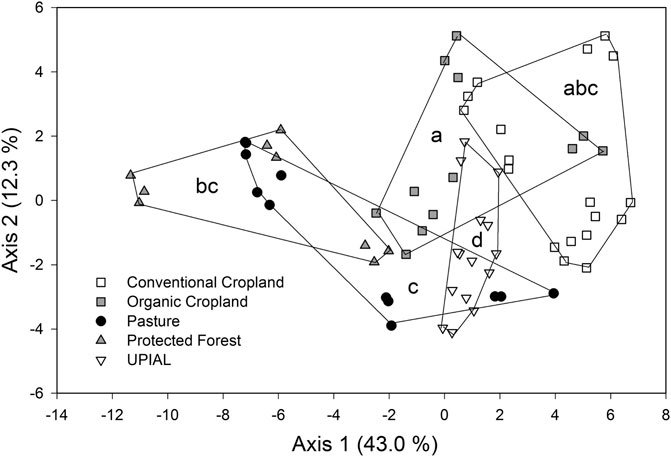
FIGURE 4. Axes 1 and 2 of the principal components analysis for all potential soil health indicators including the multi-response permutation procedures results comparing the multivariate within and between group testing among the current land uses. Conventional cropland (white square), organic cropland (grey square), pasture (black circle), protected forest (grey triangle), or unmanaged previously intensive agriculture (UPIAL, upside down white triangle). The amount of variability explained by each axis is in parentheses. Groups with different letters have statistically greater similarity within the group than to others in multivariate space.
The combination of cropland and mineral classifications also was among the significant contrasts tested (Supplementary Table S4) and provided additional insight into the nature of the interaction of minerals with land use by sub-setting the dataset to reduce the complexity of the five current land use classes to simply cropland (organic and conventional) and not cropland (UPIAL, pasture and protected forest). The non-cropland PNCM sites were different from non-cropland HAC and LAC. For both HAC and LAC, those sites in croplands were different from those not in cropland. Within the constraints of the dataset, which has greater coverage of HAC and LAC across the cropland/not cropland designations, being in cropland affected soil health indicators for both HAC and LAC. Additionally, HAC in cropland was different from LAC not in cropland, and vice versa.
Eleven dynamic soil parameters emerged from a multi-step dimension reduction process as indicators of soil health across diverse land uses, histories, and soil types. First, at its foundation PCA is a dimension reduction approach, and 26 parameters correlated strongly (
With the criteria of strong relationship to PCA axis 1, non-covariance, practicality, and inclusion of biological, chemical, and physical parameters, 11 parameters emerged as potential indicators of a soil health gradient across the soils and ecosystems in Hawaiʻi (Table 3). Summary values show the range, mean, and median of each indicator across the dataset (Table 4). For contextualization, all indicators except pH and BD are greater in soils without an intensive plantation history than in those with. For several of these indicators (total OC %, CO2 burst, ß-glucosidase, ß-glucosaminidase, PMN, and HWEC), protected forests are greater than conventional croplands, while the DOC to DON ratio was lower. Similar differences were also present for pasture compared to conventional cropping except for a few (PMN and HWEC). Among those indicators with significant contrasts, total OC %, CO2 burst, PMN, and HWEC are the same for UPIAL versus conventional cropland, but ß-glucosidase and ß-glucosaminidase are greater while the DOC to DON ratio was lower for UPIAL than conventional cropland. There were fewer differences between organic and conventional cropping, but organic cropping had greater total OC%, and ß-glucosaminidase than conventional.
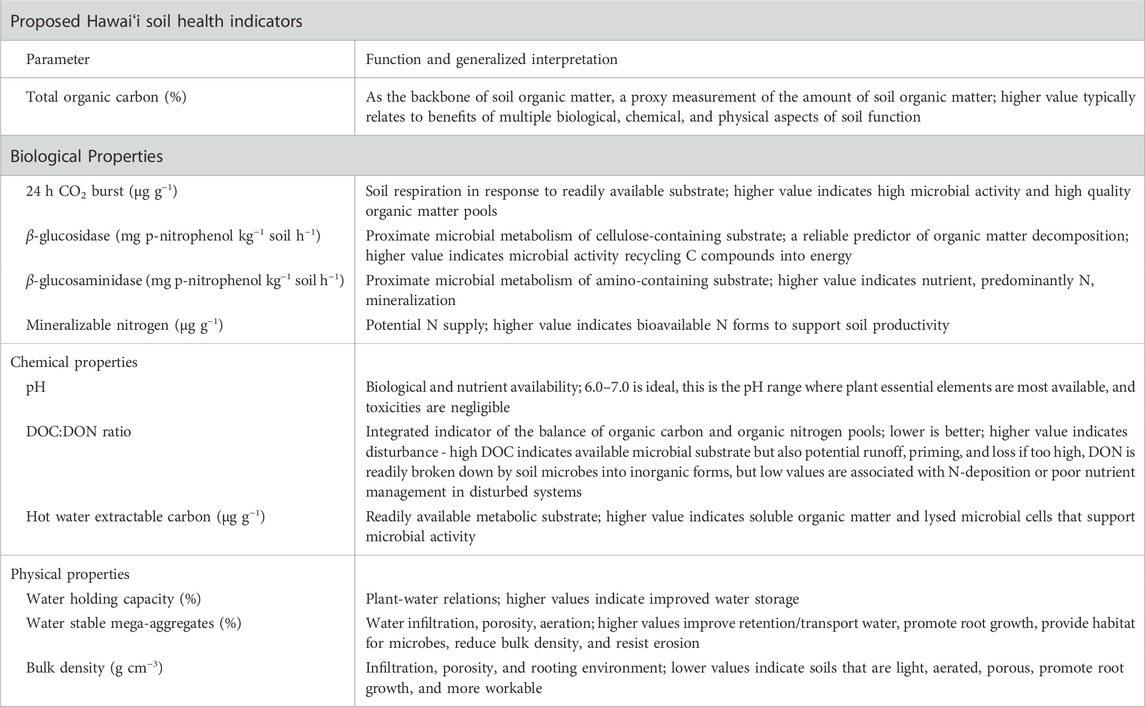
TABLE 3. After assessing the sensitivity, interpretation value, and feasibility (i.e., resources required for field collection and laboratory assays), the recommended indicators to use in a routine soil health test for Hawaiʻi and potentially other tropical-subtropical and volcanic regions, were reduced to 11 parameters.
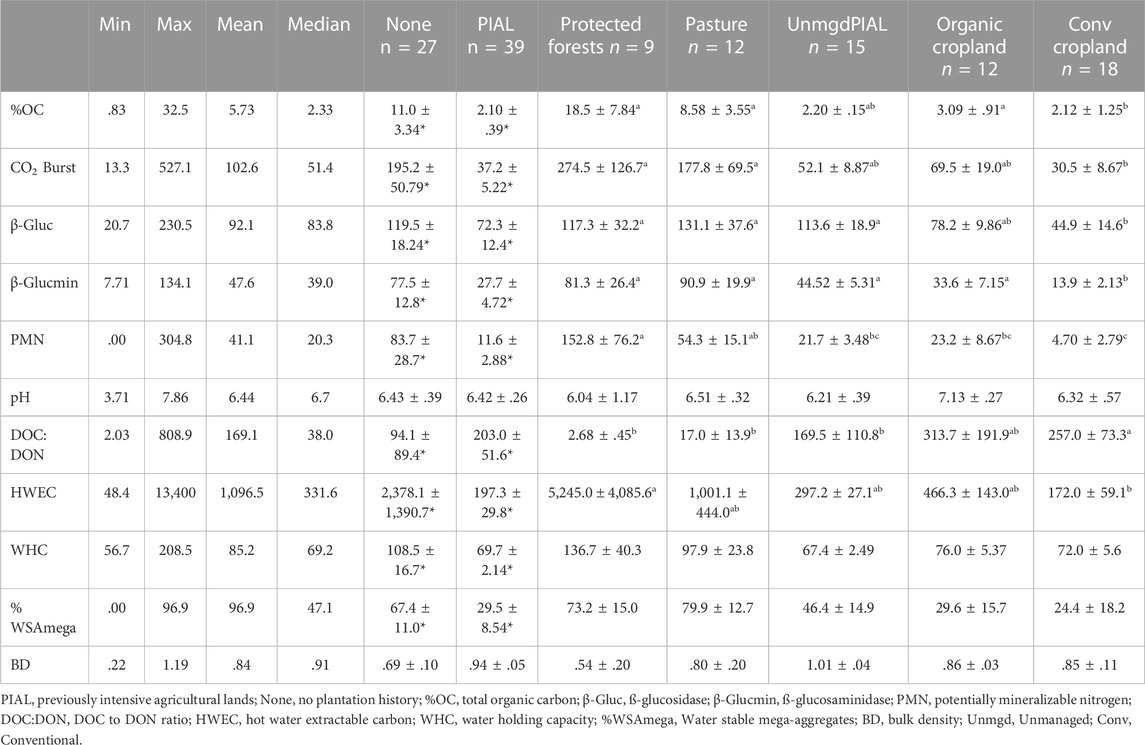
TABLE 4. Data summary for the proposed key indicators of health for subtropical/tropical and volcanic soils. Significant differences are indicated by * for the past land use (PIAL versus None) comparison and letters for the current land use comparisons (Tukey-adjusted comparison, p-value <.05).
For the subset of soils with adequate representation across mineralogy (HAC and LAC) and current land use (UPIAL, organic cropland, and conventional cropland) there were significant interactive effects among several soil health indicators, including total OC %, CO2 burst, ß-glucosidase and ß-glucosaminidase, PMN, HWEC, and mega-WSA (Figure 5). For LAC soils, many indicators were consistently lower for conventional than organic croplands, including OC %, CO2 burst, ß-glucosidase, ß-glucosaminidase, PMN, and mega-WSA. In general, UPIAL tended to have lower values than organic management, but greater than conventional cropland, which was especially apparent for total OC %. In contrast to LAC soils, very few significant effects of land use on HAC soils were detected, and only PMN and HWEC was less in conventional than in organic croplands while mega-WSA were greater. Of those indicators without significant interactions, mineralogy was significant for the DOC to DON ratio and WHC, and in both cases HAC was greater than LAC (Figure 6). Current land use was significant for the DOC to DON ratio (conventional > UPIAL), WHC (organic > UPIAL and conventional croplands), and BD (UPIAL > organic croplands) (Figure 7). Mineralogy and land use had no detectable effect on soil pH.
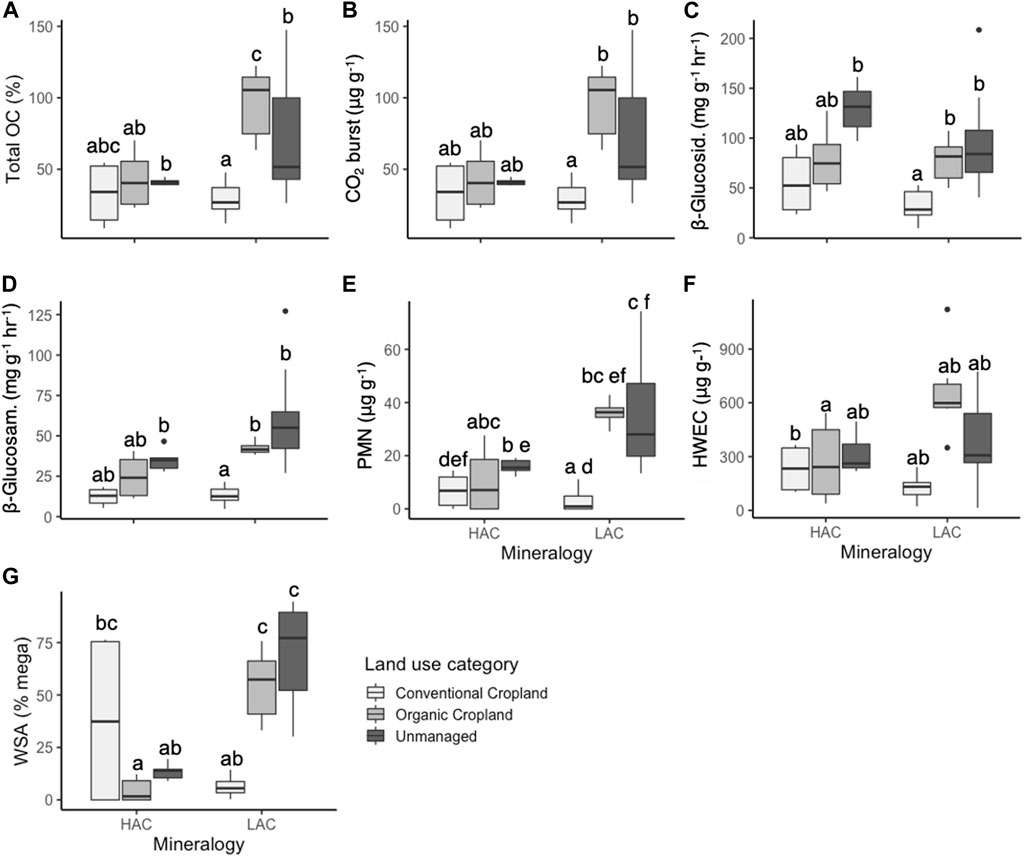
FIGURE 5. Boxplots for the proposed key indicators of health (A–G) for a subset of high (HAC) and low activity clay (LAC) soils under land use classes for conventional cropland, organic cropland, and unmanaged previously intensive agriculture. Means sharing a letter are not significantly different (Tukey-adjusted comparison of least square means at p-value < .05.) n = 51.
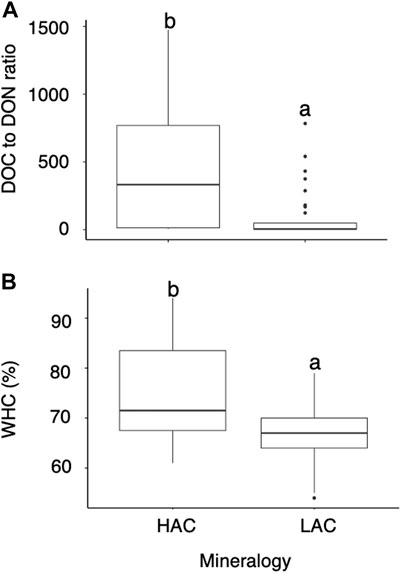
FIGURE 6. Boxplots for the proposed key indicators of health (DOC to DON ratio, (A) and WHC, (B)) for a subset of high (HAC) and low activity clay (LAC) soils averaged across land use classes. Means sharing a letter are not significantly different (Tukey-adjusted comparison of least square means at p-value < .05.) n = 51.
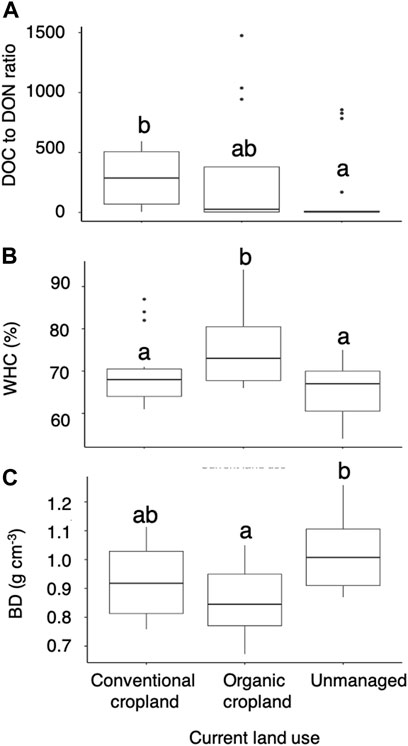
FIGURE 7. Boxplots for the proposed key indicators of health (DOC to DON ratio, (A); WHC, (B); BD, (C)) for a subset of soils across land use classes for conventional cropland, organic cropland, and unmanaged previously intensive agriculture averaged across high (HAC) and low activity clay (LAC) soils. Means sharing a letter are not significantly different (Tukey-adjusted comparison of least square means at p-value < .05.) n = 51.
Soil health conceptualized as a measurable ecosystem property based upon key indicators provides a powerful tool for monitoring progress in restoration projects or implementation of best management practices to promote sustainable agroecosystems. A new paradigm of soil organic matter dynamics, which is central to soil health, is driving the development of new compartmental models tied to measurable soil parameters (Blankinship et al., 2018). Soil organisms, particularly microbial communities that are proximately responsible for the flow of nutrients, C, and energy in the soil ecosystem, rely on accessible organic matter for metabolic substrate. Many of the emergent process-based ecosystem models are microbial models [e.g., (Wieder et al., 2015; Robertson et al., 2018)] and hold promise to improve both decision support tools and earth system projections.
In policy and programs intended to incentivize maintaining and aggrading soil health across multifunctional landscapes and diverse stakeholders, expectations must be gauged accordingly. Long-term, intensive monocrop agriculture, which in Hawaiʻi was predominantly pineapple and sugarcane plantations established post-Western contact, leaves a detrimental legacy on indicators of soil health. The adverse effects on soil biological properties and microbial communities persists following both abandonment and land use/management change to practices consistent with soil health management principles (e.g., perennial grasses or crops, organic matter inputs, and no or reduced tillage). Especially because the legacy of intensive cultivation history may carry-over into the success of land-based initiatives now and into the future, it is important to understand the resultant differences in baseline conditions as well as the limitations to improvements in soil health indicators when building decision support tools and programs.
Soil health metrics interwoven with process-based ecosystem models that underpin decision support tools used by policy makers may also assist in accessing aid and improved economic outcomes that are critical to success in overcoming adoption barriers. Ecosystem functions such as greenhouse gas emission, C storage, nutrient transformation, biomass production, and regulation of hazards and extreme events link directly to key services contributing to human wellbeing (Adhikari and Hartemink, 2016; Saco et al., 2021). Conventional soil organic matter models (e.g., RothC, DNDC, EPIC, and CENTURY) embedded within established decision support tools that assist land managers and policy makers alike contain some of these ecosystem functions. However, their ability to simulate (sub) tropical or volcanic soils which have very different properties from the temperate or continental soils for which they were developed currently limits their usefulness. Alternatively, microbial models such as (MEMS v1.0) developed from the Microbial Efficiency-Matrix Stabilization framework incorporate measurable parameters that constrain C pools sizes and modulate fluxes (Robertson et al., 2018). Measurable pools and rate modifiers in MEMS v1.0 include microbial biomass and turnover, dissolved organic matter, sorption/desorption dynamics, and exoenzyme activity. The overlap between these parameters and the indicators of soil health suggest that compartmental models designed to simulate soil organic SOM matter dynamics and nutrient and GHG fluxes may benefit from the integration of soil health measurements into their initialization and projections for (sub) tropical soils.
In the process of aggrading soil health, landscapes regain resilience through improved soil functions. For Hawaiʻi and other (sub)tropical and volcanic regions, land-based management relating to conservation, biocultural restoration, climate action for mitigation/adaptation, and increased local food production strive for their specific goals. But, these practices also contribute more broadly to sustainability when viewed through the lens of improved soil health and the associated expansive network of co-benefits and regulation services. Understanding, representing, and projecting outcomes associated with soil health is critical to incorporating their full value into complex watershed-based management and interdisciplinary social-ecological forecasting that link directly to building resilient, climate ready landscapes and communities.
Key drivers for the inherent differences in the soil health indicators, including land use history, current land use practices, and mineralogy, must be understood and integrated into the development of a soil health index. Any index should set minimum and maximum benchmarks and weigh parameters according to equitable standards. Therefore, the state of each driver (e.g., timeline of intensive use history, time since implementation of current land use and management, and predominant mineralogy) must be ascertained and recorded in databases designed for syntheses of soil health into the future.
The legacy of a plantation history is a strong driver of differences in soil health indicators, but greater complexity associated with current land use, management, and soil type also is present and important to understand while developing a robust soil health index for the (sub)tropics. For example, the level of disturbance in current management practices and, outside of croplands, mineralogy both also affected soil health indicators. Results suggest that soil health may differ inherently for high versus low activity clays and whether a system is cultivated intensively for food production (cropland) under conventional versus organic management affects soil health regardless of mineralogy.
Importantly, the soil health indicators of pastures were not different from protected forests, suggesting that well-managed grazing lands may be similar in its soil health status as protected forests. However, the most distinct group was the unmanaged, previously intensive agriculture lands (UPIAL land use class), which was significantly different from all other land uses. Unmanaged abandoned agricultural lands are more similar to each other than to sites that remain in intensive cultivation. But, they are also more similar to each other than to sites without plantation history and currently are in organic croplands, pasture, or protected forest. Upon further inspection, the univariate analysis suggests that, while the relationship between organic versus conventional cropland was largely consistent across soil type for most soil health indicators, abandoned cropland was more variable. For UPIAL, in some cases, soil health indicators fell in between organic and conventional croplands, while sometimes aligning more closely to conventional or organic for other indicators. This finding further highlights the imprint that intensive agriculture may have on the health of a soil and demonstrates the constraints to rebuilding soil health upon the cessation of soil disturbance without proactive management strategies.
A suite of readily measured indicators emerged out of a first-principle approach to determining a holistic indication of soil health across a range of soils and systems in Hawaiʻi encompassing much of the diversity in the tropics and subtropics. These indicators integrate biological, chemical, and physical properties with key functions associated with soil C and nutrient cycling, water relations, and generally, the provisions of a soil environment conducive to a diverse soil organismal community. These indicators are consistent with current measures and assessments of soil health (Rinot et al., 2019), but developed with a more organic and equitable process, without carry over of ingrained bias (Lehmann et al., 2020). In the development of a soil health index, indicators may be weighted differentially for systems. Further, cropping systems should be paired with additional fertility testing and nutrient management for optimal environmental and yield outcome.
Every land use may improve its soil health status within a reasonable range of expectations when considering land use history, current land use, and mineralogy. Land use history had a predominate effect on all but two of the 11 soil health indicators significant. We also detected greater complexity in the interactions between land use and mineralogy, suggesting that we must capture such nuances when we interpret changes in soil health indicators. Therefore, our results provide robust evidence for the contextual inclusion of land use history, current land use, and mineralogy as we develop a soil health index.
The measurement of soil health as a dynamic ecosystem property is only possible by properly identifying the right suite of indicators specific to a region and metering that measurement to appropriate benchmarks for a system defined by past land use, current land use, and mineralogy. Moving forward, providing a soil health index of (sub)tropical and volcanic soils will help to assist currently underserved producers and land managers improve the health and productivity of their lands and simultaneously reap the co-benefits of a healthier environment and society. Within this framework, fair and equitable programs can be established to improve economic outcomes as well as C neutrality goals.
Land use, particularly where a legacy of intensive cultivation existed, affected soil health indicator metrics, which supports continued policies and programs that help incentivize producers and land managers to implement best practices. Because of the close association of soil health and C cycling, climate change mitigation is a powerful co-benefit of improving soil health in degraded systems. As Amundson and Biardeau (Amundson and Biardeau, 2018) put forward, “soil carbon sequestration is an elusive climate mitigation tool.” However, soil health is a more inclusive measure of the holistic value of improving the state of a natural resource key to achieving multiple sustainability goals worldwide.
Competing demands for food, fiber, fuel, and urbanization will continue. In Hawaiʻi, especially, competing land uses associated with development, food production, and biodiversity under climate change is a pressing issue. Improved land use projections are critical for reducing uncertainties in indicators for ecosystem services in a changing environment (Bayer et al., 2021). Land use and management options that reconcile production with maintenance and enhancement of biodiversity, soil health indicators and associated ecosystem services in human dominated landscapes now and into the future are critical. We conclude that land use history, current land use practices, and mineralogy are all predominant drivers for inherent differences in soil health indicators. Our proposed “Hawaiʻi Soil Health Indicators” may be further validated for (sub)tropical and volcanic soils and systems and are critical to developing regionally appropriate incentives programs and policy.
The raw data supporting the conclusion of this article will be made available by the authors, without undue reservation.
An authorship matrix tabulated across four areas of contribution, each of which were split into three additional compartments and weighted. 1) Ideas: original idea, development, interpretation/intellectual input, 2) Work: field, sample analysis, data analysis, 3) Writing: preliminary thesis and draft, final manuscript, editing, and 4) Stewardship: funding, database, continued responsibility to research group. SC (28.6% total contribution), in decreasing order across writing, ideas, stewardship, and work. HH (26.6%), across work, ideas, and preliminary thesis and draft. JD (20.1%) ideas, stewardship, writing, and work. TM (11.7%), across writing, work, stewardship, and ideas. CT (7.3%), primarily in work and stewardship. EV (3.6%) in work and stewardship. JR-Z (2.1%) in stewardship and ideas.
This work is supported by the Bioenergy, Natural Resources, and Environment (BNRE) Networks for Synthesis, Data Sharing, and Management (Grant No. 2018-67019-27811) from the USDA National Institute of Food and Agriculture. This work was also supported by the USDA National Institute of Food and Agriculture, Hatch project (Project HAW1151-H), managed by the College of Tropical Agriculture and Human Resources at the University of Hawaiʻi Manoa.
We are grateful to all the farmers, ranchers and land managers who supported this research and allowed access to their lands. We especially thank Extension Agents A. Arakaki, R. Shimabuku, J. S. Silva, K. Wong, and J. Uyeda for their assistance. We thank Nhu Nguyen, Rebecca Ryals, R. Yost, D. Beilman, J. P. Bingham, and K. Carlson for their support of HH during the thesis process, and Jerilynn Peck for workshop and advice on multivariate analysis Reference styles.
The authors declare that the research was conducted in the absence of any commercial or financial relationships that could be construed as a potential conflict of interest.
All claims expressed in this article are solely those of the authors and do not necessarily represent those of their affiliated organizations, or those of the publisher, the editors and the reviewers. Any product that may be evaluated in this article, or claim that may be made by its manufacturer, is not guaranteed or endorsed by the publisher.
The Supplementary Material for this article can be found online at: https://www.frontiersin.org/articles/10.3389/fenvs.2022.991262/full#supplementary-material
Adhikari, K., and Hartemink, A. E. (2016). Linking soils to ecosystem services — a global review. Geoderma 262, 101–111. doi:10.1016/j.geoderma.2015.08.009
Amundson, R., Berhe, A. A., Hopmans, J. W., Olson, C., Sztein, A. E., and Sparks, D. L. (2015). Soil science. Soil and human security in the 21st century. Science 348, 1261071. doi:10.1126/science.1261071
Amundson, R., and Biardeau, L. (2018). Opinion: Soil carbon sequestration is an elusive climate mitigation tool. Proc. Natl. Acad. Sci. U. S. A. 115, 11652–11656. doi:10.1073/pnas.1815901115
Bach, E. M., Ramirez, K. S., Fraser, T. D., and Wall, D. H. (2020). Soil biodiversity integrates solutions for a sustainable future. Sustainability 12, 2662. doi:10.3390/su12072662
Bates, D., Mächler, M., Bolker, B., and Walker, S. (2015). Fitting linear mixed-effects models using lme4. J. Stat. Softw. 67. doi:10.18637/jss.v067.i01
Bayer, A. D., Fuchs, R., Mey, R., Krause, A., Verburg, P. H., Anthoni, P., et al. (2021). Diverging land-use projections cause large variability in their impacts on ecosystems and related indicators for ecosystem services. Earth Syst. Dynam. 12, 327–351. doi:10.5194/esd-12-327-2021
Blankinship, J. C., Berhe, A. A., Crow, S. E., Druhan, J. L., Heckman, K. A., Keiluweit, M., et al. (2018). Improving understanding of soil organic matter dynamics by triangulating theories, measurements, and models. Biogeochemistry 140, 1–13. doi:10.1007/s10533-018-0478-2
Bossio, D. A., Cook-Patton, S. C., Ellis, P. W., Fargione, J., Sanderman, J., Smith, P., et al. (2020). The role of soil carbon in natural climate solutions. Nat. Sustain 3, 391–398. doi:10.1038/s41893-020-0491-z
Bradford, M. A., Carey, C. J., Atwood, L., Bossio, D., Fenichel, E. P., Gennet, S., et al. (2019). Soil carbon science for policy and practice. Nat. Sustain 2, 1070–1072. doi:10.1038/s41893-019-0431-y
Doran, J. W., and Jones, A. J. (1996). Methods for assessing soil quality. Madison, Wis., USA: Soil Science Society of America. doi:10.2136/sssaspecpub49
Doran, J. W., and Zeiss, M. R. (2000). Soil health and sustainability: Managing the biotic component of soil quality. Appl. Soil Ecol. 15, 3–11. doi:10.1016/S0929-1393(00)00067-6
Isbell, F., Tilman, D., Reich, P. B., and Clark, A. T. (2019). Deficits of biodiversity and productivity linger a century after agricultural abandonment. Nat. Ecol. Evol. 3, 1533–1538. doi:10.1038/s41559-019-1012-1
Kibblewhite, M. G., Ritz, K., and Swift, M. J. (2008). Soil health in agricultural systems. Philosophical Trans. R. Soc. B Biol. Sci. 363, 685–701. doi:10.1098/rstb.2007.2178
Kurashima, N., Fortini, L., and Ticktin, T. (2019). The potential of indigenous agricultural food production under climate change in Hawaiʻi. Nat. Sustain 2, 191–199. doi:10.1038/s41893-019-0226-1
Lehmann, J., Bossio, D. A., Kögel-Knabner, I., and Rillig, M. C. (2020). The concept and future prospects of soil health. Nat. Rev. Earth Environ. 1, 544–553. doi:10.1038/s43017-020-0080-8
Lenth, R. (2020). Estimated marginal means, aka least-squares means. Available at: https://CRAN.R-project.org/package=emmeans.
Minasny, B., Malone, B. P., McBratney, A. B., Angers, D. A., Arrouays, D., Chambers, A., et al. (2017). Soil carbon 4 per mille. Geoderma 292, 59–86. doi:10.1016/j.geoderma.2017.01.002
Olsson, L., Barbosa, H., Bhadwal, S., Cowie, A., Delusca, K., Flores-Renteria, D., et al. (2019). Land degradation,” in climate change and land: An IPCC special report on climate change, desertification, land degradation, sustainable land management, food security, and greenhouse gas fluxes in terrestrial ecosystems. IPCC report
Paustian, K., Lehmann, J., Ogle, S., Reay, D., Robertson, G. P., and Smith, P. (2016). Climate-smart soils. Nature 532, 49–57. doi:10.1038/nature17174
Peck, J. E. (2016). Multivariate analysis for ecologists: Step-by-step. Gleneden Beach, Oregon: MjM Software Design
Piepho, H.-P. (2004). An algorithm for a letter-based representation of all-pairwise comparisons. J. Comput. Graph. Statistics 13, 456–466. doi:10.1198/1061860043515
Rinot, O., Levy, G. J., Steinberger, Y., Svoray, T., and Eshel, G. (2019). Soil health assessment: A critical review of current methodologies and a proposed new approach. Sci. Total Environ. 648, 1484–1491. doi:10.1016/j.scitotenv.2018.08.259
Robertson, A. D., Paustian, K., Ogle, S., Wallenstein, M. D., Lugato, E., and Cotrufo, M. F. (2018). Unifying soil organic matter formation and persistence frameworks: The MEMS model. Biogeosciences Discuss., 1–36. doi:10.5194/bg-2018-430
Rumpel, C., Amiraslani, F., Chenu, C., Cardenas, M. G., Kaonga, M., Koutika, L.-S., et al. (2020). Response to “the ‘4p1000’ initiative: A new name should be adopted” by baveye and white (2019). Ambio 49, 363–364. doi:10.1007/s13280-019-01209-7
Saco, P. M., McDonough, K. R., Rodriguez, J. F., Rivera-Zayas, J., and Sandi, S. G. (2021). The role of soils in the regulation of hazards and extreme events. Phil. Trans. R. Soc. B 376, 20200178. doi:10.1098/rstb.2020.0178
Sanderman, J., Hengl, T., and Fiske, G. J. (2017). Soil carbon debt of 12, 000 years of human land use. Proc. Natl. Acad. Sci. U. S. A. 114, 9575–9580. doi:10.1073/pnas.1706103114
Wieder, W. R., Grandy, A. S., Kallenbach, C. M., Taylor, P. G., and Bonan, G. B. (2015). Representing life in the Earth system with soil microbial functional traits in the MIMICS model. Geosci. Model. Dev. 8, 1789–1808. doi:10.5194/gmd-8-1789-2015
Keywords: land degradation, tropical, subtropical, agroecosytems, policy
Citation: Crow SE, Hubanks H, Deenik JL, McClellan Maaz T, Tallamy Glazer C, Vizka E and Rivera-Zayas J (2023) The legacy of intensive agricultural history on the soil health of (sub)tropical landscapes. Front. Environ. Sci. 10:991262. doi: 10.3389/fenvs.2022.991262
Received: 11 July 2022; Accepted: 30 December 2022;
Published: 01 February 2023.
Edited by:
Krishnaswamy Jayachandran, Florida International University, United StatesReviewed by:
Dedrick Davis, Alabama Agricultural and Mechanical University, United StatesCopyright © 2023 Crow, Hubanks, Deenik, McClellan Maaz, Tallamy Glazer, Vizka and Rivera-Zayas. This is an open-access article distributed under the terms of the Creative Commons Attribution License (CC BY). The use, distribution or reproduction in other forums is permitted, provided the original author(s) and the copyright owner(s) are credited and that the original publication in this journal is cited, in accordance with accepted academic practice. No use, distribution or reproduction is permitted which does not comply with these terms.
*Correspondence: Susan E. Crow, Y3Jvd3NAaGF3YWlpLmVkdQ==
Disclaimer: All claims expressed in this article are solely those of the authors and do not necessarily represent those of their affiliated organizations, or those of the publisher, the editors and the reviewers. Any product that may be evaluated in this article or claim that may be made by its manufacturer is not guaranteed or endorsed by the publisher.
Research integrity at Frontiers
Learn more about the work of our research integrity team to safeguard the quality of each article we publish.