 Yuqiao Su
 Xiaorong Jia1
 Lu Zhang
- 1State Key Laboratory for Conservation and Utilization of Subtropical Agro-Bioresources (South China Agricultural University), Guangdong Key Laboratory for Innovative Development and Utilization of Forest Plant Germplasm, College of Forestry and Landscape Architecture, South China Agricultural University, Guangzhou, China
- 2Guangdong Provincial Key Laboratory of Silviculture, Protection and Utilization, Guangdong Academy of Forestry, Guangzhou, China
Woody plant structural diversity and soil C:N:P stoichiometry have widely been examined for their spatial patterns and changes across environmental gradients, but the interactions and relationship of these biotic and abiotic variables have not been well understood. Here, we investigated the associations of woody plant structural diversity variables with soil total organic carbon (TOC), total nitrogen (TN), total phosphorus (TP), and their stoichiometry. We found only weak associations between soil C:N:P stoichiometry and species diversity variables, however, stronger significant associations were detected between C:N:P stoichiometry and species diversity variables for the adult trees and saplings when analyses were carried out with appropriate size stratification of woody plants. Most size diversity variables were significantly correlated with TOC, TN, TP, and their stoichiometric ratios, and the size diversity variables were greater in strength than species diversity in their associations with TOC, TN, TP, and C:N:P stoichiometric ratios. In most cases, C:N:P stoichiometric ratios were more sensitive than TOC, TN, or TP in predicting species diversity and size diversity. Our findings demonstrate that the associations of woody plant species diversity with TOC, TN, TP, C:N:P stoichiometry are size-dependent, and the size diversity is much more sensitive than species diversity in predicting the change of soil TOC, TN, TP, and C:N:P stoichiometric ratios. These findings also suggest that an appropriate size stratification will help demonstrate the linear relations between woody plant structural diversity and C:N:P stoichiometry and amplify the environmental signals from soil factors in predicting the biotic variables.
Introduction
Soil organic carbon (C), nitrogen (N), and phosphorus (P) are important elements for sustaining forest ecosystem functions and for maintaining forest biodiversity (Kirkby et al., 2013; Di Palo and Fornara, 2015; Wilson et al., 2019), and the relationships of these elements with ecosystem functions and forest biodiversity may be usefully assessed based on C:N:P stoichiometry (Sterner and Elser, 2002; Cleveland and Liptzin, 2007). C:N:P stoichiometric study of biological resources has attracted increasing attention since the “Redfield ratio” was established with plankton in 1958 (Redfield, 1958; Cleveland and Liptzin, 2007). Since then, research on C:N:P stoichiometry has been applied to terrestrial higher plants, and a growing number of stoichiometric studies have been reported on scales ranging from individual plants to populations and communities, with some consistent findings for the C:N:P stoichiometric ratios in plant organs of specific species, especially in plant leaves (Cao and Chen, 2017; Li et al., 2017; Peng et al., 2017; Hu et al., 2018). The study of soil C:N:P stoichiometry is an important extension from biotic resource stoichiometry to environmental and ecosystem stoichiometry (Zhao et al., 2015; Soares et al., 2017; Farrell et al., 2018). To date, however, no specific soil type or ecosystem has been found to have a definite stoichiometric ratio. This is mainly because the soil ecosystem is affected by soil type and formation (Mendoza-Vega et al., 2003; Munoz-Rojas et al., 2012), vegetation cover (Egli et al., 2007; Oueslati et al., 2013), anthropogenic activities (Dintwe and Okin, 2018; Chang et al., 2019), climate change (Fantappie et al., 2011; Reynolds et al., 2015; Puissant et al., 2017), and many other biotic and abiotic factors (e.g., Zhang et al., 2013).
Studies on resource and environmental stoichiometry have mainly revealed the differences in the stoichiometric properties of plant species and soil composition under various gradients related to biotic and abiotic factors (Su et al., 2012; Nottingham et al., 2015; Hu et al., 2018; Saeed et al., 2019; Xu et al., 2019). These biotic and environmental gradients involve latitude, altitude, land use types, climate, community types, and community successional stages (Di Palo and Fornara, 2015; Liang et al., 2018). At the community or stand level, however, few studies have determined how soil C, N, and P and their stoichiometric ratios are related to biotic variables such as species composition, community structure, and biodiversity. A recent study of a subtropical forest ecosystem of the same area showed a consistent pattern for the spatial heterogeneity of soil C:N:P stoichiometric ratios, which could predict the changes of certain community indicators to some extent and were sensitive in response to a negative elevation-dependent warming gradient (Su et al., 2020). From this point of view, an appropriate stratification of environmental gradients can help reveal the relationships between response variables and the weak environmental signals from abiotic or biotic factors.
By definition, the structural diversity of woody plant community comprises species diversity and tree size diversity (Zlatanov et al., 2013; He et al., 2017), and can be measured and described by species richness, abundance, species diversity indexes, and tree size (Fang et al., 2012; Zlatanov et al., 2013). While a variety of metrics have been used in quantifying species diversity, size diversity is commonly quantified by tree diameter at breast height (DBH) or basal area, a proxy variable of biomass or productivity widely used in forest ecological studies (Nguyen et al., 2012; Zhong et al., 2017). Woody plant structural diversity and soil C:N:P stoichiometry have been widely and yet independently examined for their spatial patterns and changes across environmental gradients, but the interactions and relationship of these biotic and abiotic variables have not been well understood. To clarify how woody plant diversity are associated with soil C:N:P stoichiometry will help understand the interactions of major biotic and abiotic factors in a forest ecosystem. Here, we focused on the patterns of woody plant structural diversity as related to soil total organic carbon (TOC), total nitrogen (TN), total phosphorus (TP), and their stoichiometric ratios. Our study had three objectives: 1) to determine whether and how woody plant species composition is affected by the spatial distribution of soil TOC, TN, TP, and C:N:P stoichiometry; 2) to evaluate the relationships between woody plant species diversity and soil TOC, TN, TP, and C:N:P stoichiometry, and to determine whether these relationships are size-dependent; and 3) to determine the relative importance of abiotic variables in predicting the biotic variables, as well as the relative importance of biotic variables in predicting abiotic variables. To achieve these objectives, we carried out a field investigation in a subtropical forest to collect both vegetation and soil data for analyses of their relationships using a variety of statistical and data-mining methods.
Materials and methods
Study area and sampling design
Our study site was located at the Kanghe Provincial Nature Reserve (23°44′37″–23°52′16″ N, 115°04′27″–115°09′41″ E) in the eastern part of Guangdong Province in south China. This area has a humid subtropical monsoon climate, with a mean annual temperature ranging from 20.3 to 21.1°C and a mean annual precipitation of 2,142 mm (Hu et al., 2015; He et al., 2017; Su et al., 2020). Soils in the area are predominantly clay loamy latosols developed from granite. The major vegetation type in the nature reserve is subtropical secondary forest dominated by hardwood tree species in the families of Fagaceae, Theaceae, and Iteaceae (He et al., 2017; Su et al., 2020). The forest ecosystem has been well protected since the founding of the nature reserve in 1991. As documented by the nature reserve’s administration office, no major natural or anthropogenic disturbance occurred in this area in the past 50 years.
We used a total station (Nikon DTM-310, Nikon Geotecs Co. Ltd., Tokyo, Japan) to measure site topography and to establish an 8-ha rectangular plot (200 m × 400 m) on a forested slope in the nature reserve. The plot was divided into 200 contiguous square quadrats (20 m × 20 m) for field data collection. The quadrats were numbered and marked by placing PVC (polyvinyl chloride) tubes at the 20-m corners within the plot, and the elevation at each 20-m corner was recorded by the total station. The elevation of each quadrat was calculated by averaging the elevation values at its four corners (Lai et al., 2009), and the mean elevation of the plot was 291.4 m.
Data collection
We collected data from all tree individuals ≥ 1 cm diameter at breast height (DBH) in each quadrat. All censused individuals were identified to species and recorded for species identity and DBH value measured to the nearest 0.1 cm. For exact DBH measurement, trees ≤ 5 cm DBH were measured with a dial caliper, and those > 5 cm DBH were measured with a diameter tape. Plant taxonomy and systematics followed Ye and Peng (2006).
A total of 200 composite soil samples (one per quadrat) were collected. To collect a composite soil sample for each quadrat, we first collected five subsamples of mineral soils to a depth of 25 cm in each quadrat. These subsamples of mineral soils were then evenly mixed to produce one homogenized composite sample per quadrat. Soil samples were transported to the laboratory and then air-dried, thoroughly ground, and passed through a 2-mm mesh sieve. Total soil organic carbon (TOC) and total nitrogen (TN) contents were determined by dry combustion using a vario-Max N/CN elemental analyzer (Elementar Analysensysteme GmbH, Germany), while total phosphorus (TP) content was determined by the ammonium molybdate colorimetric method (Bao, 2000). We calculated C:N:P stoichiometric values as the ratios of TOC to TN (C:N), TOC to TP (C:P), and TN to TP (N:P).
Data analysis
To determine whether and how woody plant species composition is related to the spatial distribution of soil TOC, TN, TP, and C:N:p stoichiometry, we first performed two-way indicator species analysis (TWINSPAN) to group the forest vegetation of the 8-ha plot into four communities. TWINSPAN is a generally recognized and widely-used approach for community classification based on species composition data, and the resulting communities or vegetation groups reflect the differences in species composition and community structure (McCune et al., 2002). We then used the Kruskal–Wallis test, a nonparametric method that is appropriate for use with field ecology data, to determine whether there were significant differences in TOC, TN, TP, and C:N:P stoichiometric ratios across the TWINSPAN-based communities.
To evaluate the relationships between woody plant species diversity and soil TOC, TN, TP, and C:N:P stoichiometry, and to examine whether these relationships were size-dependent, we first grouped all tree individuals into three size classes, i.e., seedlings, saplings, and adults, as defined by DBH values using the following criteria: seedlings, 1 cm ≤ DBH < 2.5 cm; saplings: 2.5 cm ≤ DBH < 12.5 cm; and adult trees: DBH ≥ 12.5 cm (He et al., 2017). We then calculated species richness (number of species), total abundance (number of stems), number of stems per species, the Shannon-Weiner diversity index, Pielou’s evenness, and the Berger-Parker index by four size groups, i.e., all sizes (i.e., non-stratified data), seedlings, saplings, and adult trees, for each quadrat. Finally, we performed correlation analysis to determine the relationships between these species abundance-based diversity variables and soil TOC, TN, TP, and C:N:P stoichiometric ratios.
The Shannon-Wiener diversity index, Pielou’s evenness, and the Berger-Parker index were calculated with the following formulas (Magurran and McGill, 2011):
where H’ is the Shannon-Wiener diversity index, and Pi is the relative abundance of the ith species in proportion to the total number of stems in a quadrat; E is the Pielou’s evenness, and S is the number of species in a quadrat; DB-P is the Berger-Parker index, Nmax is the number of stems of the most abundant species, and N is the total number of stems in a quadrat.
We performed correlation analyses to reveal the relationships between tree size diversity and soil TOC, TN, TP, and C:N:P stoichiometric ratios. We defined the size diversity as the variability in basal area (BA), size diversity index, size-dependent evenness, and the size-dependent Berger-Parker index across quadrats. We calculated the size diversity variables with the dataset for trees of all sizes. The size diversity index, size-dependent evenness, and size-dependent Berger-Parker index were calculated based on the Shannon-Wiener index, Pielou’s evenness, and the Berger-Parker index, respectively, with the following formulas:
where Dsize is the size diversity index, and PBAi is the relative basal area of the ith species in proportion to the total basal area of all species in a quadrat; Esize is size-dependent evenness; DB-P(size) is the size-dependent Berger-Parker index, BAmax is the basal area of the most dominant species by size, and BATotal is the total basal area of stems in a quadrat.
We used Random Forest to model the relationships between predictor variables and response variables. Random Forest is a data mining algorithm that does not require conventional statistical assumptions for variables (Breiman, 2001; Breiman et al., 2003). Because the relationships between the vegetation-related biotic variables and the abiotic variables (TOC, TN, TP, and C:N:P stoichiometric ratios) are interdependent, either the biotic variables or the abiotic variables can be used as predictor variables or response variables. We used the Random Forest regression model to assess the relative importance of the six abiotic variables in predicting the 10 biotic variables, as well as the relative importance of the biotic variables in predicting the abiotic variables. The relative importance of predictor variables ranged from 0 (no importance) to 1 (substantial importance).
TWINSPAN and the calculation of diversity variables were carried out with PC-ORD version 7.0 (MjM Software, Gleneden Beach, Oregon, United States). Kruskal–Wallis tests, correlation analysis, and the Random Forest regression model were executed with Statistica version 8 (Statsoft, Inc. Tulsa, OK, United States).
Results
Species composition
We recorded a total of 37,778 stems ≥ 1 cm DBH of 141 woody plant species from 52 families in our census of trees in the 8-ha plot. The four TWINSPAN-based communities differed in terms of species composition, the number of stems per species, stem density, and species density (Table 1). The number of stems per species, also termed species-specific density (Niklas et al., 2003), exhibited different explanatory capability in separating the communities as compared with stem density and species density. The number of stems per species was highest for community 2 and lowest for both community 3 and 4, while the values of both stem density and species density were highest for community 3 (Table 1).
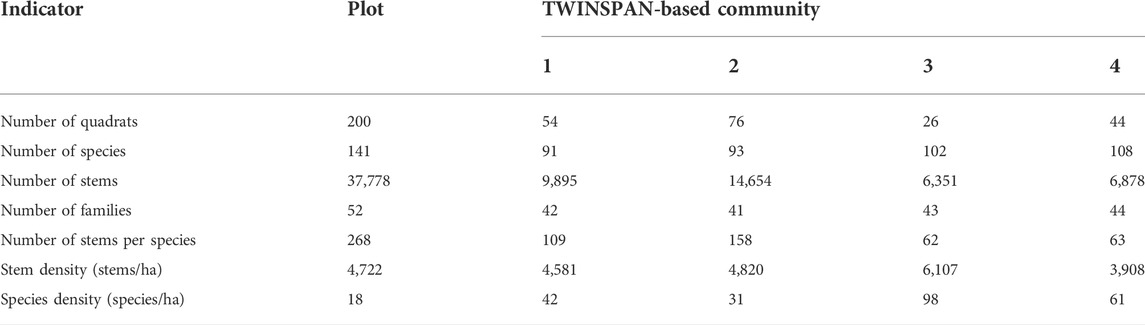
TABLE 1. | Species composition of the woody plants (DBH ≥1 cm) in the sample plot and forest communities. The values of number of stems per species, stem density, and species density have been rounded to whole numbers.
We found significant differences in soil total nitrogen (TN), total phosphorus (TP), and the C:N:P stoichiometric ratios across the TWINSPAN-based communities (Figure 1). The difference in soil total organic carbon (TOC) across the communities was also marginally significant (P = 0.0534; Figure 1A). The values of the Kruskal–Wallis test statistics (KW-H) were higher for the C:N:P stoichiometric ratios than for TOC, TN, or TP (Figure 1), while the p-values for the significance level of the C:N:P stoichiometric ratios (p < 0.001) were lower than for TOC (p = 0.0534; Figure 1A) or for TN or TP (p < 0.01; Figures 1B,C). These results indicated that the C:N:P stoichiometric ratios were more sensitive in predicting the change in species composition across communities than either TOC, TN, or TP.
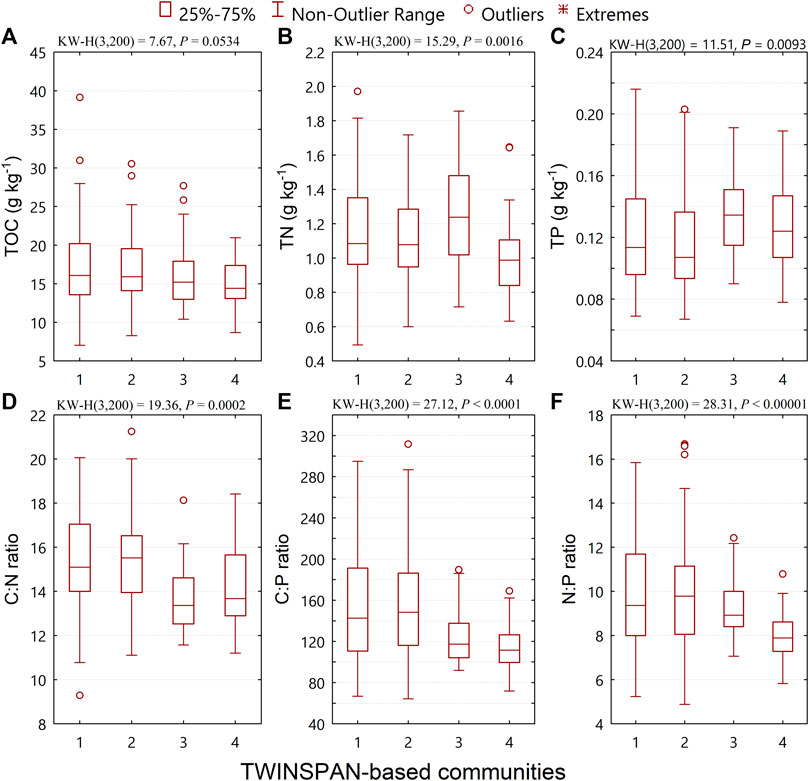
FIGURE 1. Changes in soil total organic carbon (TOC), total nitrogen (TN), total phosphorus (TP), and C:N:P stoichiometric ratios across TWINSPAN-based communities.
Species diversity
We found size-dependent associations of woody plant species diversity with TOC, TN, TP, and the C:N:P stoichiometric ratios (Table 2). Linear relationships between species diversity variables and TOC, TN, TP, and C:N:P stoichiometric ratios were significant for sapling and adult tree size classes, but not for the seedling size class (Table 2). Only eight of 36 correlation coefficients were significant for the sapling size class, but 26 of 36 correlation coefficients were significant for the adult tree size class (Table 2). For the trees of all sizes, only 7 of 36 correlation coefficients were significant (Table 2), an outcome most probably due to the fact that the number of stems of the two most abundant size classes, i.e., seedlings (16,490 stems) and saplings (13,977 stems), together accounted for 80.6% of the total species abundance (Table 2).
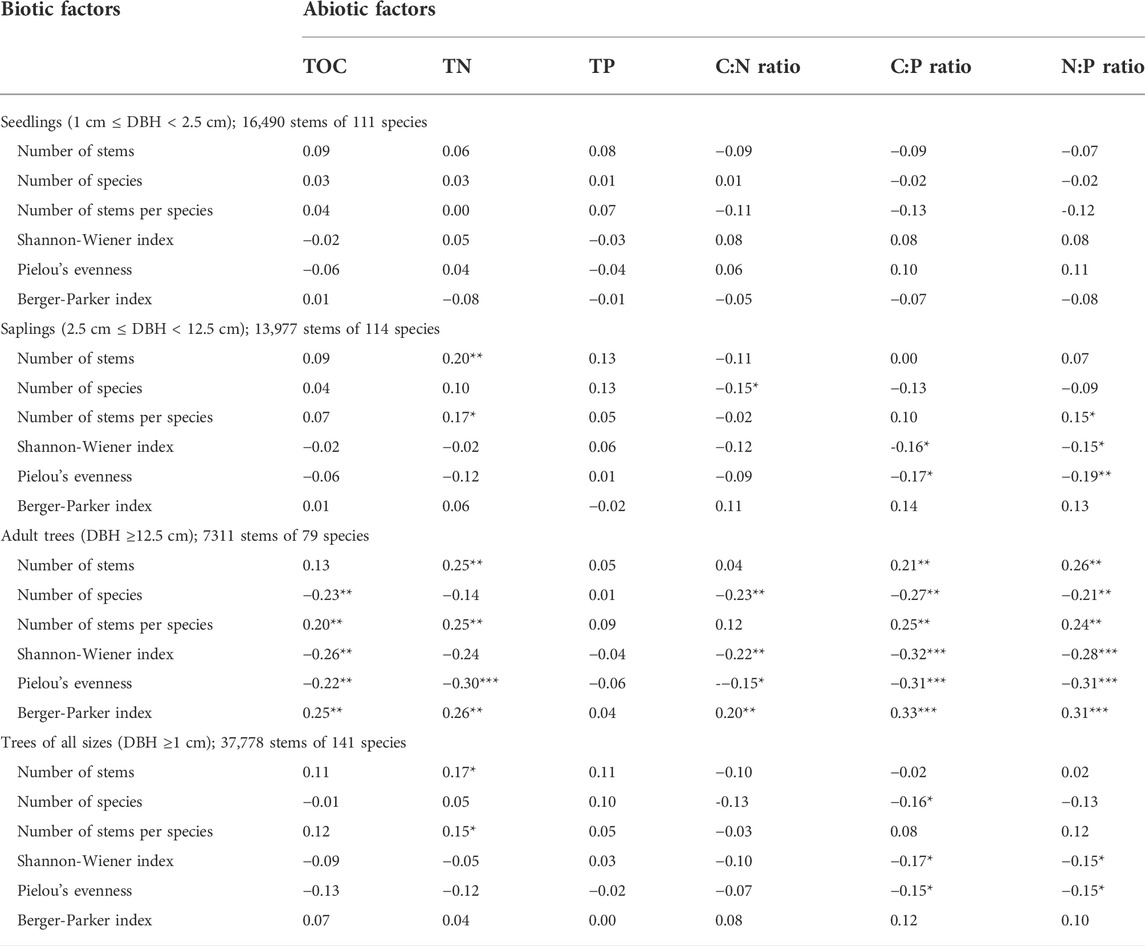
TABLE 2. Pearson correlation coefficients of six vegetation-related biotic factors with soil total organic carbon (TOC, g kg−1), total nitrogen (TN, g kg−1), total phosphorus (TP, g kg−1), and C:N:P stoichiometric ratios at the quadrat level. Asterisks (*, **, or ***) alongside a coefficient indicate statistical significance at p < 0.05, < 0.001, or < 0.0001, respectively.
The strength of the correlation coefficients in the relationships between species diversity variables and TOC, TN, TP, and C:N:P stoichiometric ratios was generally greater for the adult size class than for the sapling size class (Table 2). For the sapling size class, the relationship between the number of stems and TN was positive and highly significant (p < 0.01), whereas the relationship between Pielou’s evenness and N:P ratio was negative and highly significant (p < 0.01). The number of stems per species was positively correlated with TN and N:P ratio (p < 0.05), while C:P was negatively correlated with the Shannon-Wiener index and Pielou’s evenness (p < 0.05).
The relationships between diversity variables and TOC, TN, TP, and the stoichiometric ratios for the adult tree size class followed similar patterns (positive or negative) as those of the sapling size class. Higher nutrient status and their stoichiometric ratios would favor the abundance-dependent variables, such as the number of stems, number of stems per species, and the Berger-Parker dominance index, resulting in a positive correlation, while these nutrient-related variables were negatively correlated with the richness-dependent diversity variables, such as number of species, the Shannon-Wiener diversity index, and Pielou’s evenness. Among the positive correlations, the coefficient was highest for the relationship between the Berger-Parker index and the C:P ratio (r = 0.33, p < 0.001; Table 2), followed by the relationship between the Berger-Parker index and the N:P ratio. Among the negative correlations, the coefficient was highest for the relationship between the Shannon-Wiener index and the C:P ratio (r = -0.32, p < 0.001; Table 2), followed by the relationships between Pielou’s evenness and the C:P ratio, Pielou’s evenness and the N:P ratio, and Pielou’s evenness and TN (Table 2).
Size diversity
Relationships with TOC, TN, TP, and C:N:P stoichiometric ratios for size diversity variables differed from those described in the previous section for species diversity variables. Basal area (BA) was negatively correlated with TP (p < 0.01; Figure 2C), and was positively correlated with the C:N ratio (p < 0.05; Figure 2D), the C:P ratio (p < 0.01; Figure 2E), and the N:P ratio (p < 0.01; Figure 2F); BA was not correlated with TOC (p = 0.19; Figure 2A) or TN (p = 0.83; Figure 2B).
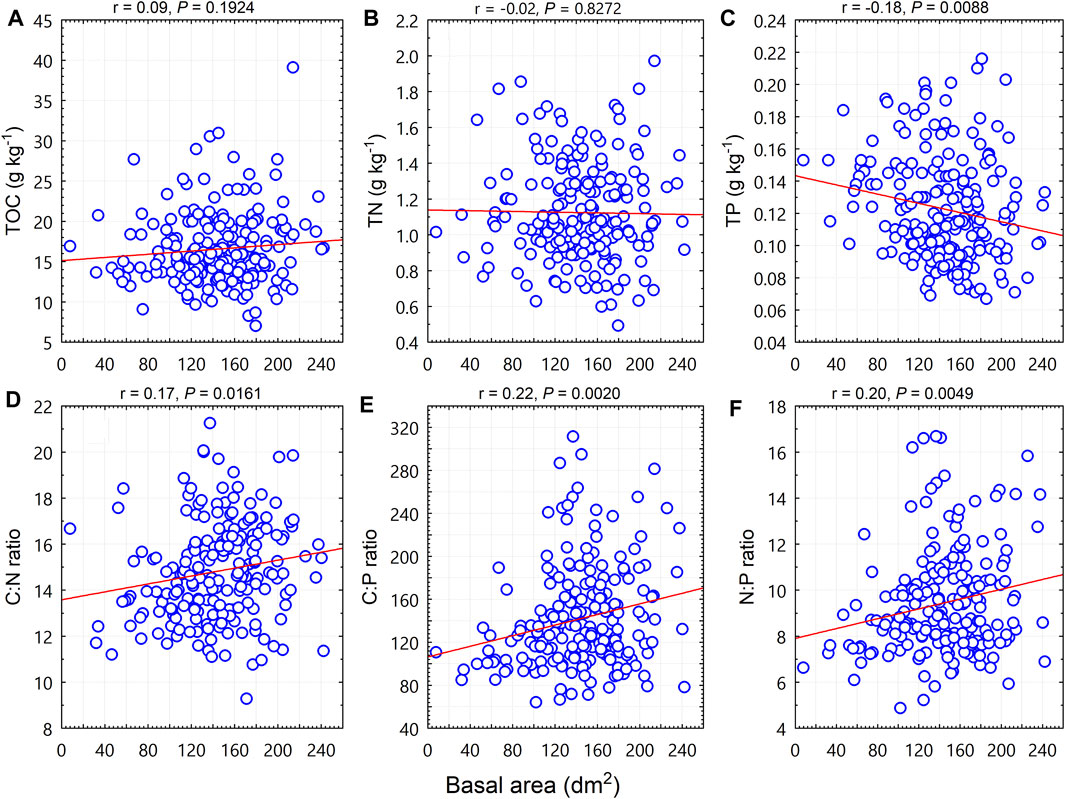
FIGURE 2. Relationships between woody plant basal area (BA, dm2) and soil total organic carbon (TOC), total nitrogen (TN), total phosphorus (TP) contents, and C:N:P stoichiometric ratios at the quadrat level.
The size diversity index was negatively correlated with TOC (p < 0.01; Figure 3A), TN (p < 0.05; Figure 3B), the C:N ratio (p < 0.001; Figure 3D), the C:P ratio (p < 0.0001; Figure 3E), and the N:P ratio (p < 0.0001; Figure 3F), but was not correlated with TP (p = 0.52; Figure 3C).
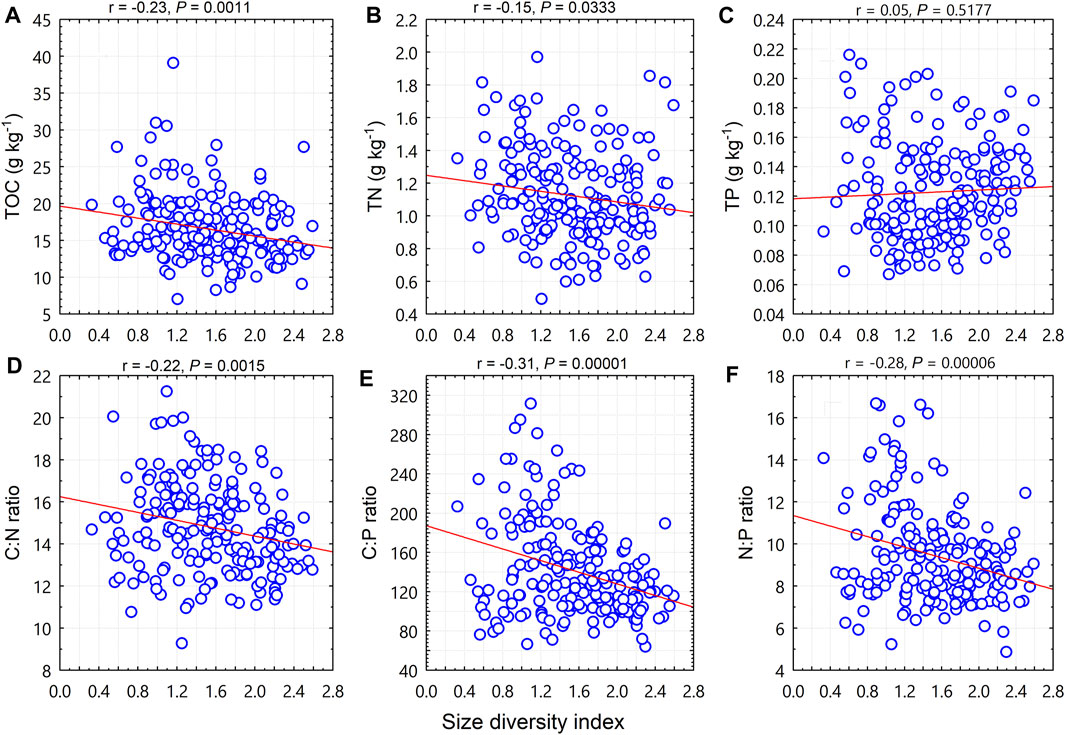
FIGURE 3. Relationships between woody plant size diversity index and soil total organic carbon (TOC), total nitrogen (TN), total phosphorus (TP), and C:N:P stoichiometric ratios.
Like the size diversity index, size-dependent evenness was negatively correlated with TOC (p < 0.001; Figure 4A), TN (p < 0.01; Figure 4B), the C:N ratio (p < 0.01; Figure 4D), the C:P ratio (p < 0.0001; Figure 4E), and the N:P ratio (p < 0.0001; Figure 4F), but was not correlated with TP (p = 0.71; Figure 4C).
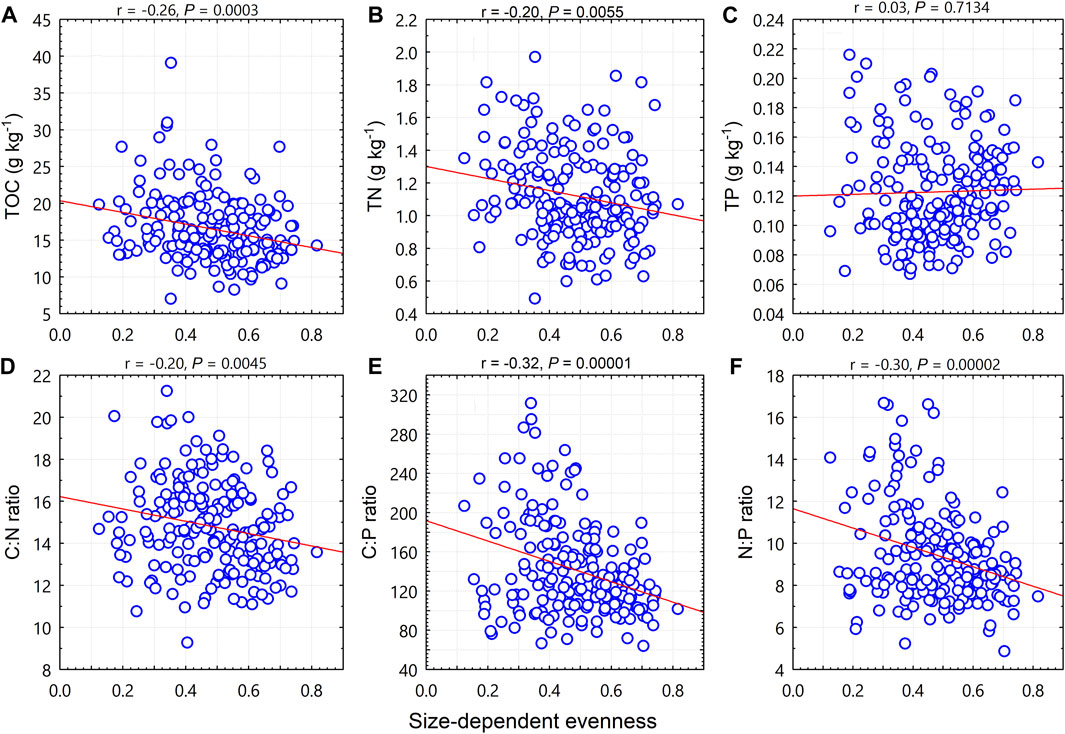
FIGURE 4. Relationships between woody plant size-dependent evenness and soil total organic carbon (TOC), total nitrogen (TN), total phosphorus (TP), and C:N:P stoichiometric ratios.
Unlike the size diversity index or the size-dependent evenness, the size-dependent Berger-Parker index was positively correlated with TOC (p < 0.01; Figure 5A), TN (p < 0.05; Figure 5B), the C:N ratio (p < 0.01; Figure 5D), the C:P ratio (p < 0.0001; Figure 5E), and the N:P ratio (p < 0.001; Figure 5F), but was not correlated with TP (p = 0.78; Figure 5C).
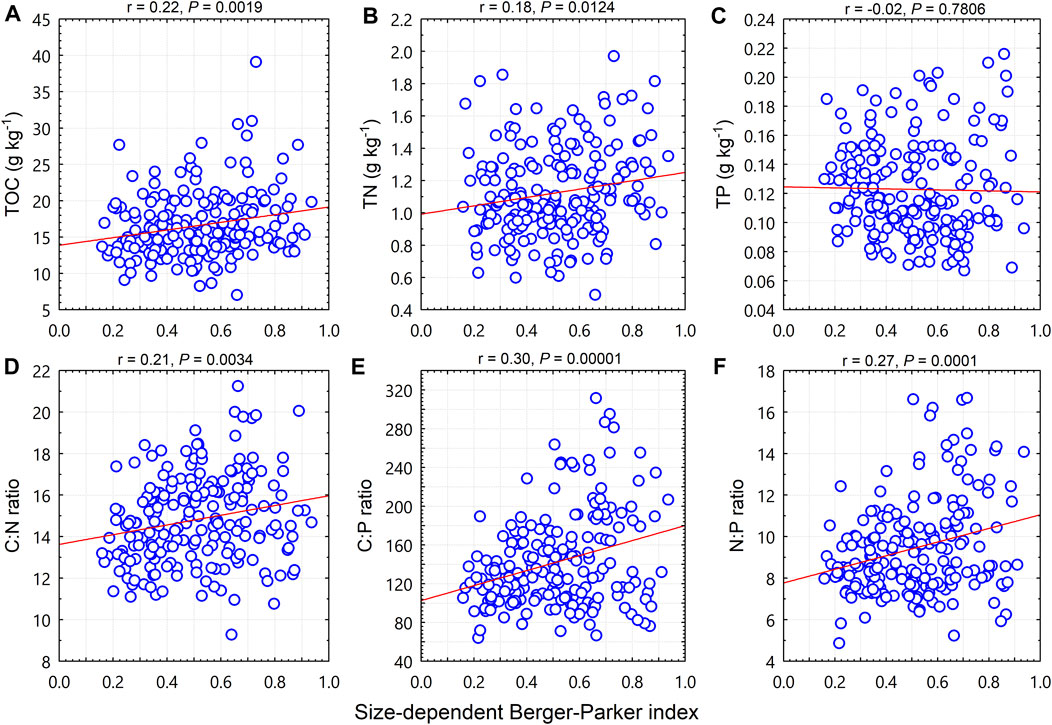
FIGURE 5. Relationships between woody plant size-dependent Berger-Parker and soil total organic carbon (TOC), total nitrogen (TN), total phosphorus (TP), and C:N:P stoichiometric ratios.
Predictability of variables
The relative importance of the biotic factors (i.e., the structural diversity variables), in predicting the spatial variability of TOC, TN, TP, and C:N:P stoichiometric ratios is shown in Figure 6. Among the 10 biotic predictor variables, the most important variable for predicting TOC was size-dependent evenness (Figure 6A); for predicting the C:N ratio was the size diversity index (Figure 6B); for predicting TN was Pielou’s evenness (Figure 6C); for predicting the C:P ratio was the size diversity index and size-dependent evenness (Figure 6D); for predicting TP was basal area (Figure 6E); and for predicting the N:P ratio was the size diversity index (Figure 6F).
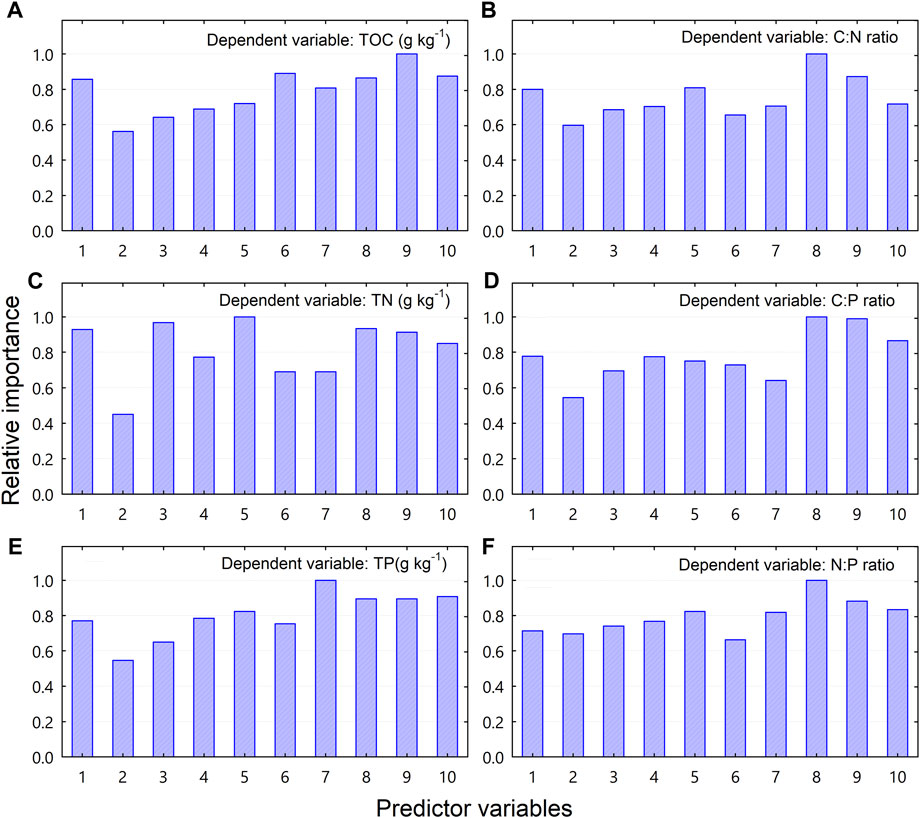
FIGURE 6. Relative importance of vegetation-related variables in predicting soil total organic carbon (TOC), total nitrogen (TN), total phosphorus (TP), and C:N:P stoichiometric ratios as determined by the Random Forest regression model. Code for predictor variables: 1 = number of stems; 2 = number of species; 3 = number of stems per species; 4 = Shannon-Wiener index; 5 = Pielou’s evenness; 6 = Berger-Parker index; 7 = basal area; 8 = size diversity index; 9 = size-dependent evenness; 10 = size-dependent Berger-Parker index.
When using the abiotic factors as predictor variables and the biotic factors as response variables, we found that the C:N:P stoichiometric ratios were much more important than TOC, TN, or TP (Table 3). TN and TP were the most important variables for predicting the number of stems and number of species, respectively. The C:N ratio was the most important variable for predicting total basal area. Both the C:P and N:P ratios were the most important variables for predicting a number of structural diversity variables (Table 3). In most cases, predictor importance was greater for C:N:P stoichiometric ratios than for TOC, TN, or TP.
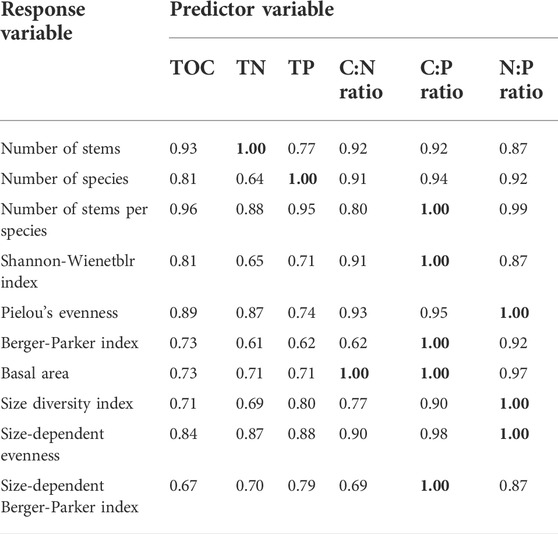
TABLE 3. The relative importance of soil total organic carbon (TOC), total nitrogen (TN), total phosphorus (TP), and C:N:P stoichiometric ratios in predicting vegetation-related variables as determined by Random forest analysis. In this analysis, values range from 0.00 to 1.00, and higher values indicate greater relative importance.
Discussion
We found that associations between woody plant structural diversity and soil C:N:P stoichiometry were size-dependent, i.e., depended on the size of the woody plants. To our surprise, correlations between woody plant species diversity variables and topsoil TOC, TN, TP, and their stoichiometric ratios were not significant for seedlings but were significant for adult-sized trees. It would be expected that seedlings, which are small and have shallow root systems, should be more closely related with topsoil nutrient variables than were saplings and adult trees (Lin et al., 2016; Scholten et al., 2017; Chen et al., 2019). Relative to adult trees and saplings, seedlings are likely to be more susceptible to biotic and non-soil abiotic factors, such as the competition from canopy trees, understory radiation, pests and pathogens, and animal damage. Therefore, the associations of woody plant seedlings with topsoil TOC, TN, TP, and their stoichiometric ratios will be weakened by non-soil habitat factors.
At the population level, plant individuals can change their chemical composition to some extent so as to adapt to the chemical composition of the soils that support them (Fanin et al., 2017; Hu et al., 2018), but such changes will be quite limited because during long-term evolution, plants have formed homeostatic mechanisms that keep the chemical composition of their organisms relatively constant (Fanin et al., 2017; Bai et al., 2019). Because the coupling of C, N, and P differs among plant species, changes in species composition, richness, abundance, and diversity metrics will be an effective mechanism of plants at the community level to respond to the spatial changes of soil C, N, P, and their stoichiometric ratios. As shown by our results, higher resource availability reduced species diversity, size diversity, Pielou’s evenness, and size-dependent evenness, because increases in TOC, TN, and TP will promote community dominance (Alberti et al., 2015; Aanderud et al., 2018).
The C:N:P stoichiometric ratios rather than TOC, TN, or TP showed consistent trends for predicting changes in woody plant structural diversity. For species diversity variables of the adult trees, the C:N:P stoichiometric ratios were negatively associated with species richness, the Shannon-Wiener index, and Pielou’s evenness, but were positively with Berger-Parker index. Both the number of stems and number of stems per species were positively associated with the C:P ratio and the N:P ratio. For size diversity variables, both basal area and the size-dependent Berger-Parker index were positively associated with the C:N:P stoichiometric ratios, while both the size diversity index and size-dependent evenness were negatively associated with the C:N:P stoichiometric ratios. The C:N:P stoichiometric ratios not only showed consistent trends in their associations with woody plant structural diversity variables, but they significantly differed among communities, indicating that C:N:P stoichiometry is closely associated with plant community type and species composition. The C:N:P stoichiometric ratios were more sensitive than soil C, N, or P content in response to the changes in community type. This may reflect a greater influence of the coupling of two or more nutrient elements on the species composition and community structure than a single nutrient element, because C:N:P stoichiometric ratios represent the coupling and balance among the elements (Sterner and Elser, 2002).
Although the correlation analysis does not predict causal relationships between woody plant community and soil TOC, TN, TP, and their stoichiometric ratios, the strength of the associations between them does reflect their interdependencies (Zemunik et al., 2018). Soil N and P are the major nutrients for plants to grow, while soil organic matter, which is the major source of soil organic carbon, is a reserve of the N and other nutrients required by plants (Craswell and Lefroy, 2001). On the other hand, forest plants affect soil C, N, P and their stoichiometry by forming heterogeneous habitats, regulating soil surface microclimate conditions (Toledo et al., 2011) and nutrient return, and by affecting soil microbial diversity through root metabolism (Bergkemper et al., 2016) and other process such as shading effect provided by adult trees. Given that the associations of woody plant structural diversity with soil C, N, P, and their stoichiometry were dependent on tree size, and the woody plant size diversity and productivity metrics rather than abundance-based species diversity can better reflect changes in soil C, N, P, and their stoichiometry, it could be inferred that the associations of a forest community with soil C, N, P, and their stoichiometry are driven by community productivity.
Conclusion
Associations between soil C:N:P stoichiometry and woody plant species diversity variables were weak when plant size was ignored but were strong when plant size class (seedling, sapling, and adult) was accounted for. Most size diversity variables were correlated with TOC, TN, TP, and C:N:P stoichiometric ratios, and the correlations with TOC, TN, TP, and C:N:P stoichiometric ratios were stronger with the size diversity variables than with species diversity. In most cases, C:N:P stoichiometric ratios were more sensitive than TOC, TN, or TP in predicting the spatial variability of diversity variables. Our findings demonstrate that the associations of woody plant species diversity with TOC, TN, TP, and C:N:P stoichiometry are size-dependent, and that size diversity is much more sensitive than species diversity in predicting soil TOC, TN, TP, and C:N:P stoichiometric ratios. These findings also suggest that an appropriate size stratification will help demonstrate the linear relations between woody plant structural diversity and C:N:P stoichiometry and amplify the environmental signals from soil variables in predicting the biotic variables.
Data availability statement
The raw data supporting the conclusions of this article will be made available by the authors, without undue reservation.
Author contributions
HC and YS conceived and designed the study. YS, XJ, and LZ collected the data. YS analyzed the data and wrote the paper. HC edited the paper. All authors discussed the results and approved the paper for submission.
Funding
This research was supported by the Forestry Department of Guangdong Province, China, for non-commercial ecological forest research (890-2020-XMZC-2744-01-0001).
Acknowledgments
We thank Mingfeng Xu for his help with field work. We also thank the staff of the Kanghe Provincial Nature Reserve of Guangdong Province, China, for logistic support during field survey.
Conflict of interest
The authors declare that the research was conducted in the absence of any commercial or financial relationships that could be construed as a potential conflict of interest.
Publisher’s note
All claims expressed in this article are solely those of the authors and do not necessarily represent those of their affiliated organizations, or those of the publisher, the editors and the reviewers. Any product that may be evaluated in this article, or claim that may be made by its manufacturer, is not guaranteed or endorsed by the publisher.
References
Aanderud, Z. T., Saurey, S., Ball, B. A., Wall, D. H., Barrett, J. E., Muscarella, M. E., et al. (2018). Stoichiometric shifts in soil C:N:P promote bacterial taxa dominance, maintain biodiversity, and deconstruct community assemblages. Front. Microbiol. 9, 1401. doi:10.3389/fmicb.2018.01401
Alberti, G., Vicca, S., Inglima, I., Belelli-Marchesini, L., Genesio, L., Miglietta, F., et al. (2015). Soil C: N stoichiometry controls carbon sink partitioning between above-ground tree biomass and soil organic matter in high fertility forests. iForest 8 (2), 195–206. doi:10.3832/ifor1196-008
Bai, X. J., Wang, B. R., An, S. S., Zeng, Q. C., and Zhang, H. X. (2019). Response of forest species to C:N:P in the plant-litter-soil system and stoichiometric homeostasis of plant tissues during afforestation on the Loess Plateau, China. Catena 183, 104186. doi:10.1016/j.catena.2019.104186
Bergkemper, F., Welzl, G., Lang, F., Kruger, J., Schloter, M., and Schulz, S. (2016). The importance of C, N and P as driver for bacterial community structure in German beech dominated forest soils. J. Plant Nutr. Soil Sci. 179 (4), 472–480. doi:10.1002/jpln.201600077
Breiman, L., Last, M., and Rice, J. (2003). “Random forests: Finding quasars,” in Statistical challenges in astronomy. Editors E. D. Feigelson, and G. J. Babu (New York, USA: Springer), 243–254.
Cao, Y., and Chen, Y. M. (2017). Ecosystem C:N:P stoichiometry and carbon storage in plantations and a secondary forest on the Loess Plateau, China. Ecol. Eng. 105, 125–132. doi:10.1016/j.ecoleng.2017.04.024
Chang, R. Y., Zhou, W. J., Fang, Y. T., Bing, H. J., Sun, X. Y., and Wang, G. X. (2019). Anthropogenic nitrogen deposition increases soil carbon by enhancing new carbon of the soil aggregate formation. J. Geophys. Res. Biogeosci. 124 (3), 572–584. doi:10.1029/2018jg004877
Chen, Y. Q., Cao, J. B., Zhao, J., Wu, J. P., Zou, X. M., Fu, S. L., et al. (2019). Labile C dynamics reflect soil organic carbon sequestration capacity: Understory plants drive topsoil C process in subtropical forests. Ecosphere 10 (6), e02784. doi:10.1002/ecs2.2784
Cleveland, C. C., and Liptzin, D. (2007). C:N:P stoichiometry in soil: Is there a “redfield ratio” for the microbial biomass? Biogeochemistry 85 (3), 235–252. doi:10.1007/s10533-007-9132-0
Craswell, E. T., and Lefroy, R. D. B. (2001). “The role and function of organic matter in tropical soils,” in Managing organic matter in tropical soils: Scope and limitations. Editors C. Martius, H. Tiessen, and P. L. G. Vlek (Dordrecht, Netherlands: Springer).
Di Palo, F., and Fornara, D. (2015). Soil fertility and the carbon: Nutrient stoichiometry of herbaceous plant species. Ecosphere 6 (12), art273–15. doi:10.1890/es15-00451.1
Dintwe, K., and Okin, G. S. (2018). Soil organic carbon in savannas decreases with anthropogenic climate change. Geoderma 309, 7–16. doi:10.1016/j.geoderma.2017.08.030
Egli, M., Alioth, L., Mirabella, A., Raimondi, S., Nater, M., and Verel, R. (2007). Effect of climate and vegetation on soil organic carbon, humus fractions, allophanes, imogolite, kaolinite, and oxyhydroxides in volcanic soils of Etna (Sicily). Soil Sci. 172 (9), 673–691. doi:10.1097/ss.0b013e31809eda23
Fang, J., Shen, Z., Tang, Z., Wang, X., Wang, Z., Feng, J., et al. (2012). Forest community survey and the structural characteristics of forests in China. Ecography 35 (12), 1059–1071. doi:10.1111/j.1600-0587.2013.00161.x
Fanin, N., Fromin, N., Barantal, S., and Hattenschwiler, S. (2017). Stoichiometric plasticity of microbial communities is similar between litter and soil in a tropical rainforest. Sci. Rep. 7, 12498. doi:10.1038/s41598-017-12609-8
Fantappie, M., L'Abate, G., and Costantini, E. A. C. (2011). The influence of climate change on the soil organic carbon content in Italy from 1961 to 2008. Geomorphology 135 (3-4), 343–352. doi:10.1016/j.geomorph.2011.02.006
Farrell, K. J., Rosemond, A. D., Kominoski, J. S., Bonjour, S. M., Rugg, J., Koenig, L. E., et al. (2018). Variation in detrital resource stoichiometry signals differential carbon to nutrient limitation for stream consumers across biomes. Ecosystems 21 (8), 1676–1691. doi:10.1007/s10021-018-0247-z
He, S., Zhong, Y., Sun, Y., Su, Z., Jia, X., Hu, Y., et al. (2017). Topography-associated thermal gradient predicts warming effects on woody plant structural diversity in a subtropical forest. Sci. Rep. 7, 40387. doi:10.1038/srep40387
Hu, C., Li, F., Xie, Y. H., Deng, Z. M., and Chen, X. S. (2018). Soil carbon, nitrogen, and phosphorus stoichiometry of three dominant plant communities distributed along a small-scale elevation gradient in the East Dongting Lake. Phys. Chem. Earth Parts A/B/C 103, 28–34. doi:10.1016/j.pce.2017.04.001
Hu, Y., Su, Z., Li, W., Li, J., and Ke, X. J. P. O. (2015). Influence of tree species composition and community structure on carbon density in a subtropical forest. PLOS ONE 10 (8), e0136984. doi:10.1371/journal.pone.0136984
Kirkby, C. A., Richardson, A. E., Wade, L. J., BattenB, G. D., Blanchard, C., and Kirkegaard, J. A. (2013). Carbon-nutrient stoichiometry to increase soil carbon sequestration. Soil Biol. Biochem. 60, 77–86. doi:10.1016/j.soilbio.2013.01.011
Lai, J., Mi, X., Ren, H., and Ma, K. J. J. o. V. S. (2009). Species‐habitat associations change in a subtropical forest of China. J. Veg. Sci. 20 (3), 415–423. doi:10.1111/j.1654-1103.2009.01065.x
Li, H. L., Crabbe, M. J. C., Xu, F. L., Wang, W. L., Niu, R. L., Gao, X., et al. (2017). Seasonal variations in carbon, nitrogen and phosphorus concentrations and C:N:P stoichiometry in the leaves of differently aged Larix principis-rupprechtii Mayr. Plantations. Forests 8 (10), 373. doi:10.3390/f8100373
Liang, X. Y., Liu, S. R., Wang, H., and Wang, J. X. (2018). Variation of carbon and nitrogen stoichiometry along a chronosequence of natural temperate forest in northeastern China. J. Plant Ecol. 11 (3), 339–350. doi:10.1093/jpe/rtx008
Lin, D. M., Anderson-Teixeira, K. J., Lai, J. S., Mi, X. C., Ren, H. B., and Ma, K. P. (2016). Traits of dominant tree species predict local scale variation in forest aboveground and topsoil carbon stocks. Plant Soil 409 (1-2), 435–446. doi:10.1007/s11104-016-2976-0
Magurran, A. E., and McGill, B. J. (2011). Biological diversity: Frontiers in measurement and assessment. New York: Oxford University Press.
McCune, B., Grace, J. B., and Urban, D. L. (2002). Analysis of ecological communities. Gleneden Beach, Oregon, USA: MjM Software Design.
Mendoza-Vega, J., Karltun, E., and Olsson, M. (2003). Estimations of amounts of soil organic carbon and fine root carbon in land use and land cover classes, and soil types of Chiapas highlands, Mexico. For. Ecol. Manag. 177 (1-3), 191–206. doi:10.1016/s0378-1127(02)00439-5
Munoz-Rojas, M., Jordan, A., Zavala, L. M., De la Rosa, D., Abd-Elmabod, S. K., and Anaya-Romero, M. (2012). Organic carbon stocks in Mediterranean soil types under different land uses (Southern Spain). Solid earth. 3 (2), 375–386. doi:10.5194/se-3-375-2012
Nguyen, H., Herbohn, J., Firn, J., and Lamb, D. (2012). Biodiversity–productivity relationships in small-scale mixed-species plantations using native species in Leyte province, Philippines. For. Ecol. Manag. 274, 81–90. doi:10.1016/j.foreco.2012.02.022
Niklas, K. J., Midgley, J. J., and Rand, R. H. (2003). Size‐dependent species richness: Trends within plant communities and across latitude. Ecol. Lett. 6 (7), 631–636. doi:10.1046/j.1461-0248.2003.00473.x
Nottingham, A. T., Whitaker, J., Turner, B. L., Salinas, N., Zimmermann, M., Malhi, Y., et al. (2015). Climate warming and soil carbon in tropical forests: Insights from an elevation gradient in the Peruvian Andes. Bioscience 65 (9), 906–921. doi:10.1093/biosci/biv109
Oueslati, I., Allamano, P., Bonifacio, E., and Claps, P. (2013). Vegetation and topographic control on spatial variability of soil organic carbon. Pedosphere 23 (1), 48–58. doi:10.1016/s1002-0160(12)60079-4
Peng, Y. F., Li, F., Zhou, G. Y., Fang, K., Zhang, D. Y., Li, C. B., et al. (2017). Linkages of plant stoichiometry to ecosystem production and carbon fluxes with increasing nitrogen inputs in an alpine steppe. Glob. Chang. Biol. 23 (12), 5249–5259. doi:10.1111/gcb.13789
Puissant, J., Mills, R. T. E., Robroek, B. J. M., Gavazov, K., Perrette, Y., De Danieli, S., et al. (2017). Climate change effects on the stability and chemistry of soil organic carbon pools in a subalpine grassland. Biogeochemistry 132 (1-2), 123–139. doi:10.1007/s10533-016-0291-8
Redfield, A. C. (1958). The biological control of chemical factors in the environment. Am. Sci. 46 (3), 205–221.
Reynolds, L. L., Johnson, B. R., Pfeifer-Meister, L., and Bridgham, S. D. (2015). Soil respiration response to climate change in Pacific Northwest prairies is mediated by a regional Mediterranean climate gradient. Glob. Chang. Biol. 21 (1), 487–500. doi:10.1111/gcb.12732
Saeed, S., Sun, Y., Beckline, M., Chen, L., Lai, Z., Mannan, A., et al. (2019). Altitudinal gradients and forest edge effect on soil organic carbon in Chinese fir (cunninghamia lanceolata): A study from southeastern China. Appl. Ecol. Environ. Res. 17 (1), 745–757. doi:10.15666/aeer/1701_745757
Scholten, T., Goebes, P., Kuhn, P., Seitz, S., Assmann, T., Bauhus, J., et al. (2017). On the combined effect of soil fertility and topography on tree growth in subtropical forest ecosystems-a study from SE China. J. Plant Ecol. 10 (1), 111–127. doi:10.1093/jpe/rtw065
Soares, A. R. A., Bergstrom, A. K., Sponseller, R. A., Moberg, J. M., Giesler, R., Kritzberg, E. S., et al. (2017). New insights on resource stoichiometry: Assessing availability of carbon, nitrogen, and phosphorus to bacterioplankton. Biogeosciences 14 (6), 1527–1539. doi:10.5194/bg-14-1527-2017
Sterner, R. W., and Elser, J. J. (2002). Ecological stoichiometry: The biology of elements from molecules to the biosphere. Princeton, New Jersey: Princeton University Press.
Su, Y., Wu, Z., Xie, P., Zhang, L., and Chen, H. (2020). Warming effects on topsoil organic carbon and C: N: P stoichiometry in a subtropical forested landscape. Forests 11 (1), 66. doi:10.3390/f11010066
Su, Z. Y., Ke, X. D., and Zhang, S. J. (2012). Vascular plants as indicators of organic carbon gradient in subtropical forested soils. Pol. J. Environ. Stud. 21 (5), 1393–1398.
Toledo, M., Poorter, L., Pena-Claros, M., Alarcon, A., Balcazar, J., Leano, C., et al. (2011). Climate is a stronger driver of tree and forest growth rates than soil and disturbance. J. Ecol. 99 (1), 254–264. doi:10.1111/j.1365-2745.2010.01741.x
Wilson, B. R., Wilson, S. C., Sindel, B., Williams, L. K., Hawking, K. L., Shaw, J., et al. (2019). Soil properties on sub-Antarctic Macquarie Island: Fundamental indicators of ecosystem function and potential change. Catena 177, 167–179. doi:10.1016/j.catena.2019.02.007
Xu, W. F., Yuan, W. P., Cui, L. L., Ma, M. N., and Zhang, F. G. (2019). Responses of soil organic carbon decomposition to warming depend on the natural warming gradient. Geoderma 343, 10–18. doi:10.1016/j.geoderma.2019.02.017
Ye, H. G., and Peng, S. L. (2006). Plant diversity inventory of Guangdong. Guangzhou: Guangdong World Publishing Corporation.
Zemunik, G., Davies, S. J., and Turner, B. L. (2018). Soil drivers of local-scale tree growth in a lowland tropical forest. Ecology 99 (12), 2844–2852. doi:10.1002/ecy.2532
Zhang, Z. S., Song, X. L., Lu, X. G., and Xue, Z. S. (2013). Ecological stoichiometry of carbon, nitrogen, and phosphorus in estuarine wetland soils: Influences of vegetation coverage, plant communities, geomorphology, and seawalls. J. Soils Sediments 13 (6), 1043–1051. doi:10.1007/s11368-013-0693-3
Zhao, F. Z., Kang, D., Han, X. H., Yang, G. H., Yang, G. H., Feng, Y. Z., et al. (2015). Soil stoichiometry and carbon storage in long-term afforestation soil affected by understory vegetation diversity. Ecol. Eng. 74, 415–422. doi:10.1016/j.ecoleng.2014.11.010
Zhong, Y., Sun, Y., Xu, M., Zhang, Y., Wang, Y., and Su, Z. (2017). Spatially destabilising effect of woody plant diversity on forest productivity in a subtropical mountain forest. Sci. Rep. 7, 9551. doi:10.1038/s41598-017-09922-7
Keywords: soil factor, C:N:P stoichiometry, species diversity, size diversity, random forest
Citation: Su Y, Jia X, Zhang L and Chen H (2022) Size-dependent associations of woody plant structural diversity with soil C:N:P stoichiometry in a subtropical forest. Front. Environ. Sci. 10:990387. doi: 10.3389/fenvs.2022.990387
Received: 09 July 2022; Accepted: 19 August 2022;
Published: 14 September 2022.
Edited by:
Zhiqiang Wang, Southwest Minzu University, ChinaReviewed by:
Xianjin He, Chongqing University, ChinaHaiyan Ren, Inner Mongolia Agricultural University, China
Copyright © 2022 Su, Jia, Zhang and Chen. This is an open-access article distributed under the terms of the Creative Commons Attribution License (CC BY). The use, distribution or reproduction in other forums is permitted, provided the original author(s) and the copyright owner(s) are credited and that the original publication in this journal is cited, in accordance with accepted academic practice. No use, distribution or reproduction is permitted which does not comply with these terms.
*Correspondence: Hui Chen, Y2hlbmh1aUBzY2F1LmVkdS5jbg==