 Jihong Qu
 Jueyan Jiang1,2
 Shibao Lu
95% of researchers rate our articles as excellent or good
Learn more about the work of our research integrity team to safeguard the quality of each article we publish.
Find out more
ORIGINAL RESEARCH article
Front. Environ. Sci. , 02 September 2022
Sec. Toxicology, Pollution and the Environment
Volume 10 - 2022 | https://doi.org/10.3389/fenvs.2022.989257
Groundwater level fluctuation alters hydrodynamic conditions and hydrogeochemical action, thus affecting the migration and transformation of pollutants. This study investigated the effect of groundwater level fluctuations on Pb migration processes. We selected two typical media, coarse sand and medium sand, for the soil column experiments and numerical simulations of the Pb migration process in the groundwater level fluctuation zone. The soil column experiments showed that when the contaminants were distributed at a 30–40 cm depth in the soil column, the Pb migrated into the water in the range of 20–45 cm in coarse sand, while the range of Pb migration in medium sand decreased to 30 cm–40 cm. We constructed a numerical model of Pb migration in the aeration zone–saturation zone coupled with water transport and solute transport by HYDRUS-1D. The model simulated the migration process of Pb in different amplitude and frequency of water level fluctuation and initial concentration of pollutants. The results showed that the coarse sand column and medium sand column showed relatively noticeable changes in Pb concentration in water at 30–40 cm and 30–35 cm, respectively. The migration range and concentration of Pb in water are proportional to the medium particle size and the frequency of water level fluctuation, and inversely proportional to the magnitude of water level fluctuation. The Pb concentration in the water increased or decreased as the initial pollutant concentration of the medium increased or decreased. Its variation is basically the same as the variation of the initial contaminant concentration. The research results can provide a scientific basis for the remediation of heavy metal pollution in groundwater.
The overall soil environmental situation in China is not promising. Typical areas of heavy metal pollution include heavily polluted enterprise land, industrial wasteland, industrial parks, mining areas, agricultural land, wage irrigation areas, and both sides of trunk highways (Zhou et al., 2007; Zhou et al., 2008; Jiao et al., 2015; Srivastava et al., 2017; Liu et al., 2014; Yan et al., 2007; Xi et al., 2011). The pollution of groundwater by heavy metals is often associated with the pollution of soil (Alfaifi et al., 2021). Under the action of precipitation, irrigation, water carried by itself and fluctuation of groundwater level, soil heavy metals penetrate into the envelope and pollute groundwater directly.
Groundwater level fluctuation zones are caused by variations in natural conditions and human activities, such as meteorology, hydrology, and groundwater extraction, which cause groundwater levels to rise and fall. Water level fluctuations alter hydrodynamic conditions and cause changes in environmental conditions and hydrogeochemistry. During the process of groundwater level fluctuation, soluble substances in the aquifer media, are gradually dissolved into the groundwater, thus changing the chemical composition of the groundwater, which affects the migration transformation of solutes in the groundwater (Jing Liu et al., 2021). The influence of water level fluctuation on the migration and transformation of pollutants has received much attention from scholars, but few studies (Meng, 2015) have been reported on the migration and transformation of heavy metals under fluctuating water level conditions.
Recent studies on contaminants in the groundwater fluctuation zone have focused on the migration of soil salts, three-nitrogen (ammonia nitrogen, nitrite nitrogen and nitrate nitrogen), light non-aqueous liquid (LNAPL)/dense non-aqueous phase liquid (DNAPL), Mn, and Fe (Steffy et al., 1998; Kamon et al., 2003; Zhang et al., 2012; Liu et al., 2018; Wang et al., 2019; Shi et al., 2020; Rudzianskaite and Sukys, 2008; Gupta et al., 2019; Yang et al., 2021; Yang et al., 2022; Haj-Amor et al., 2017). Jeongkon Kim (2003) explored the process of the redistribution of contaminants between aquifer medium and groundwater by fluctuations in the water level and the inhomogeneity of the media. Ibrahimi et al. (2014) found that groundwater fluctuations enhanced the accumulation of salts in the soil profile compared to the stable groundwater. de Ruijter et al. (2007) demonstrated that nitrate concentrations in sandy soils with a high water table were more minor than half of the nitrate concentrations in sandy soils with a low water table. Zhang et al. (2020) concluded that shallow groundwater fluctuations significantly influenced nitrogen concentrations in shallow groundwater and soil profiles. Xin Liu et al. (2021) investigated the effect of two types of water level fluctuations (constant water level and water level fluctuation of 20 cm every 10 days) on the nitrate–nitrogen concentration in groundwater. Azimi et al. (2020) studied the variation in LNAPL thickness during rises and falls in the water level. Farnsworth et al. (2012) studied the effect of transient dissolved oxygen (DO) on manganese oxidation during water level fluctuations. The Fe concentration corresponds well with groundwater level fluctuations. The total Fe content and Fe2+ mass concentration increase or decrease as the groundwater level rises and falls (Zhang et al., 2021; Wang et al., 2017).
Field investigations and monitoring, laboratory experiments, and numerical simulations are the main methods used to study the effects of groundwater level fluctuations on solute migration (Krause et al., 2007; Neuman and Tartakovsky, 2009; Zhang et al., 2010; Li W. et al., 2013; Du et al., 2021). Li et al. (2015) used hydrogeological information and land management data from monitoring sites to verify the results of a laboratory experiment on the effect of water level changes on pollutant concentrations. Bustos Medina et al. (2013) explored the effect of water level changes on ferric hydroxide plugged wells using field site investigations and numerical simulations. Oostrom et al. (2007) used two-dimensional sandbox simulations to study the distribution of contaminants during transport from sources to soil and groundwater under fluctuating water levels. Li X. et al. (2013) simulated the nitrogen transport pattern during different magnitude fluctuations of groundwater level by laboratory soil column experiments. Tian et al. (2009) studied the relationship between soil solute transport processes and groundwater level using laboratory experiments. Wu et al. (2019) investigated the vertical migration characteristics of Pb by capillary water rises in clay and sand using soil column tests. Li et al. (2014) utilized the solute transport equation, the one-dimensional saturated–unsaturated soil moisture movement control equation, and the Kool–Parker hysteresis model to develop a model for nitrate–nitrogen migration transformation in soils under the fluctuating groundwater level. Jiao et al. (2017) used HYDRUS-1D to simulate the effect of rising and falling groundwater levels on nitrate–nitrogen concentrations. Qi et al. (2019) developed a one-dimensional numerical model to simulate the transfer of VOC from groundwater to seepage and validated it using soil box test data. Wang et al. (2020) used a TMVOC model to simulate the migration transformations of benzene, toluene, ethylbenzene, and o-xylene (BTEX) under the fluctuating groundwater levels.
HYDRUS is a series of software developed by USL (United States Department of Agriculture Salt and Soil Laboratory) that is widely used to computationally simulate water movement and solute transport in the saturated-unsaturated zone (Gumua-Kawcka et al., 2022). The series software is divided into 1D, 2D and 3D, named HYDRUS-1D, HYDRUS-2D and HYDRUS-3D respectively. Through physical laboratory experiments, we studied the distribution characteristics of Pb in the aeration zone and saturation zone under the fluctuation of groundwater level. We analyzed the Pb migration process in the groundwater level fluctuation zone and used HYDRUS-1D to establish a numerical model of Pb migration in the aeration zone–saturation zone to predict the spatial and temporal distribution of Pb. The results of the study can expand our understanding of the migration of Pb in groundwater level fluctuations. It provides a scientific basis for the management of, remediation of, and protection against heavy metal pollution in soil and groundwater.
The soil medium used for this experiment was taken from the bank of the Yellow River in Mengjin District, Luoyang City, Henan Province, China. The soil samples were collected in the field and processed by quartering. Soil samples were divided into 30 × 40 cm bags and brought back to the laboratory for natural drying. During the drying process, the samples were covered with a 250 mesh nylon filter to avoid interference from atmospheric dust and other factors. After the soil samples were completely dried, they were sorted using 0.25 mm, 0.5 mm, 1 mm and 2 mm sieves to remove weeds, gravel, biological debris, plant residues and other impurities from the media (Jiao, 2018; Wang and Cao, 2019). We selected two types of sandy soils, coarse sand and medium sand, as the experimental soil media. Table 1 shows their pH and organic matter contents.
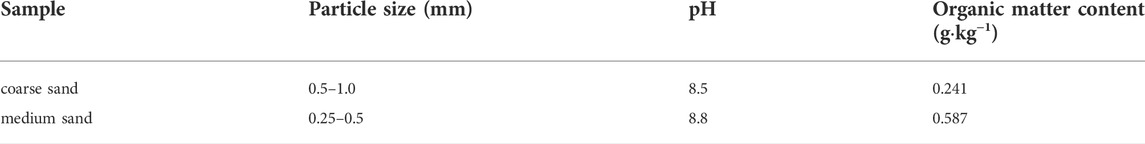
TABLE 1. Physical and chemical properties of the soil medium.
The experimental device includes a soil column, water tank, peristaltic pump, piezometer tube, and soil solution sampler (Figure 1). The material of the soil column is PVC, and it has an inner diameter of 20 cm, an outer diameter of 22 cm, and a column height of 100 cm. A total of 25 L of deionized water was used as the experimental water for the tank, and a peristaltic pump was used to control the rise and fall of the groundwater level. The flow rate in the peristaltic pump is 100–300 ml min−1, the power is 30 W, and the revolution speed is 0.1–400 rpm.
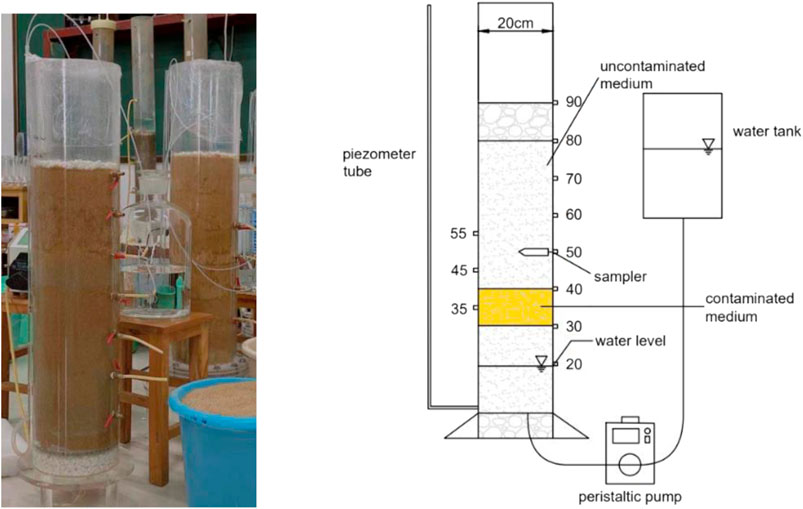
FIGURE 1. Schematic diagram of the experimental device.
The columns were filled with coarse sand and medium sand, respectively, to a total height of 90 cm. The column fillers were 5 cm gravel, 25 cm uncontaminated media, 10 cm contaminated media, 40 cm uncontaminated media, and 10 cm gravel from the bottom up. The bottom gravel prevented the soil from being lost due to the washing of water. The top gravel reduced the evaporation of water inside the column. We weighed 1 g of Pb(NO3)2 and dissolved it in 100 ml of water to get 10 g L−1 lead nitrate contamination solution. The contamination solution was added to coarse sand and medium sand, stirred well, ventilated and dried, and made into 2000 mg kg−1 Pb(NO3)2 contamination medium for use (Lin, 2014). Deionized water was added to the tank, and the initial water level was maintained at 20 cm using a peristaltic pump and left to stand for 7 days. The initial soil moisture content was 1%.
The initial water level of the soil column was 20 cm. The water level was raised rapidly and stabilized at 30 cm using a peristaltic pump, and then raised by 10 cm every 1 day continuously to 60 cm. Using the same method, the water level was lowered from 60 cm to 20 cm, thus completing a water level fluctuation cycle. The experiment was conducted for two fluctuation cycles. Two soil columns were utilized at the same time for the same water level fluctuation process. Figure 2 shows the water level fluctuation over time.
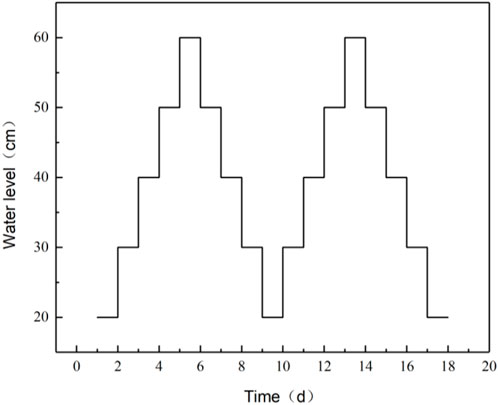
FIGURE 2. Water level fluctuation process.
Eight sampling ports were set up at 20 cm, and 30 cm–60 cm (5 cm intervals). The sampling port has a valve, which will be opened when sampling, and the soil solution sampler is a disposable syringe. Water samples were collected through a soil solution sampler after 1 day between each water level adjustment. The Pb concentrations in the water samples were tested with a flame atomic spectrophotometer (Wang et al., 2019) (Model: WFX-120A).
HYDRUS-1D is the most commonly used one-dimensional water and solute transport simulation software, which includes water transport, thermal transport, solute transport, root uptake and other simulation modules, and can handle water and solute transport processes under various boundary conditions and soil conditions such as constant flow, constant pressure head. (Li W. et al., 2013). The software includes a database of different water movement equations and hydraulic parameters of soil media, which meets the requirements of numerical simulation in this study. We used HYDRUS-1D to construct a numerical model of Pb migration in the aeration zone–saturation zone with coupled water transport and solute transport based on physical experiments of Pb migration processes in the groundwater level fluctuation zone. This numerical model can study the dynamic process of Pb migration in the groundwater level fluctuation zone.
One-dimensional saturated–unsaturated soil water movement control equation (Celia et al., 1990):
where θ is the volumetric water content (cm3·cm−3), z is the soil thickness (cm), K(h) is the unsaturated hydraulic conductivity (cm d−1), and h is the soil matrix potential (cm).
Let c(h) be the water capacity of the soil, such that:
The movement of water in the soil is described by the function corresponding to the soil matrix potential, and the movement model is obtained thus:
where
For heavy metals adsorbed without degradation and output under steady flow conditions, the one-dimensional convective-dispersion equation for homogeneous soil transport can be described (Nie et al., 2009):
where
The initial water level was 20 cm. According to the experimental model, the upper boundary was in direct contact with the atmosphere and was set as the atmospheric boundary. The lower boundary changed the water level rise and fall, set as a variable head boundary. Table 2 shows the variable head values (GWL). The upper and lower boundaries of solute transport were set as zero concentration gradient boundaries.
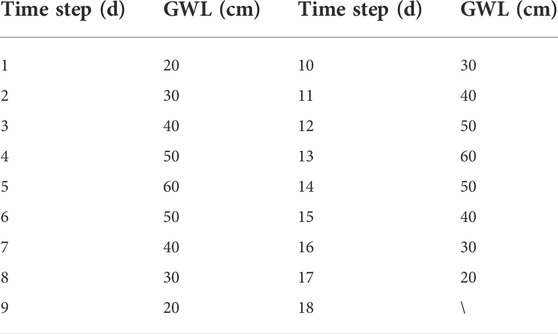
TABLE 2. Time-variable boundary conditions.
The parameters of the numerical model included soil hydrodynamic parameters and solute transport parameters. The initial values of the soil hydrodynamic parameters were determined according to the soil medium hydrodynamic parameters database of HYDRUS-1D (Table 3). The initial values of the solute transport parameters were determined according to the measured results and the empirical values of this physical experiment (Table 4). The inverse solution module of HYDRUS-1D was used to invert the final parameters of the numerical model.
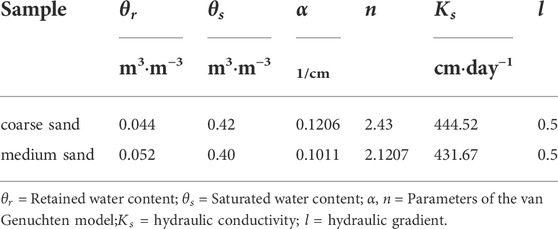
TABLE 3. Hydraulic parameters and dispersion of soil.
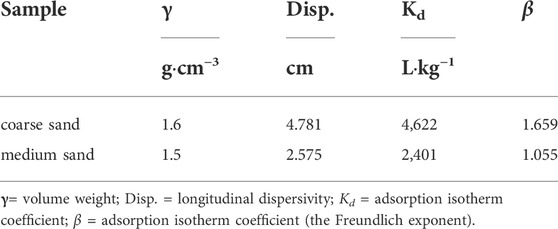
TABLE 4. Solute transport parameters.
To invert the hydrodynamic and solute transport parameters in the numerical model and evaluate the model simulation effect, the decision coefficient and root mean square error were used to assess the model. The calculation equations are given in Eqs. 5, 6 (Gao et al., 2019). The closer the R2 is to 1, the closer the RMSE is to 0, indicating that the model simulation is effective.
where Si and Mi are the simulated and measured values and N is the number of samples.
According to the results of the experiments on groundwater level fluctuations, the process of variation in Pb concentration in water at different sampling points for coarse and medium sand soil columns is shown in Figure 3. During the first fluctuation cycle of the coarse sand column, the Pb concentration in the water at the 30 cm sampling port increases at the beginning of the water level rise and then the concentration decreases. The Pb concentration in the water always tends to decrease at 35 cm and 40 cm. The Pb concentration at 20 cm and 45 cm increases slightly on day four and then converges to zero. No Pb concentration is detected between 50 cm and 60 cm. The maximum concentrations at 20 cm, 30 cm, 35 cm, 40 cm, and 45 cm are 0.072 mg L−1, 36.061 mg L−1, 38.973 mg L−1, 16.941 mg L−1, and 0.042 mg L−1, respectively. The Pb concentrations at the 30 cm, 35 cm, and 40 cm sampling ports in the medium sand column decrease with the fluctuation in the water level. The highest concentrations are 1.285 mg L−1, 18.862 mg L−1, and 0.164 mg L−1, respectively. As the adsorption capacity of medium sand is greater than that of coarse sand, the migration capacity of Pb is weakened (Zhang et al., 2013), resulting in the Pb concentration not being detected at the 20 cm and 45 cm sampling ports.
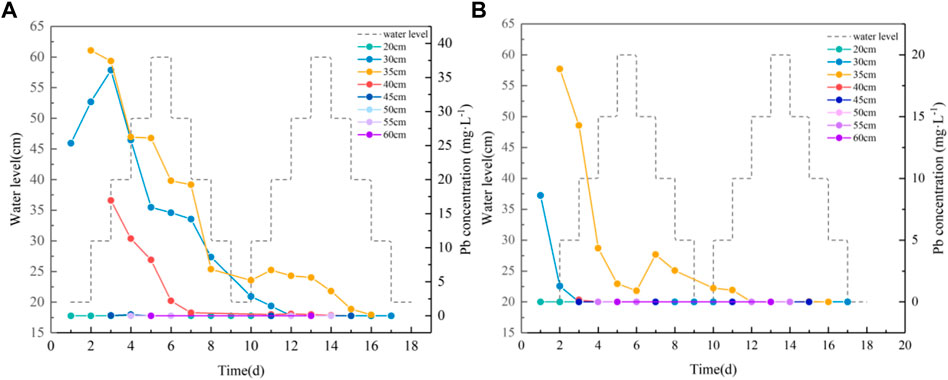
FIGURE 3. Relation diagram between the Pb content and water level fluctuation. (A): Variation of Pb concentration in water of coarse sand column; (B): variation of Pb concentration in water of medium sand column.
Figure 4 shows the observed and forecasted results of Pb concentration in water in the coarse sand and medium sand columns. The simulation results are basically consistent with the measured concentration values. The R2 of the coarse sand and medium sand models is 95.5% and 93.4%, and the RMSE is 1.965 and 0.704, respectively. This indicates that the model fits well and can be used to simulate and predict the migration of Pb under the conditions of groundwater level fluctuation.
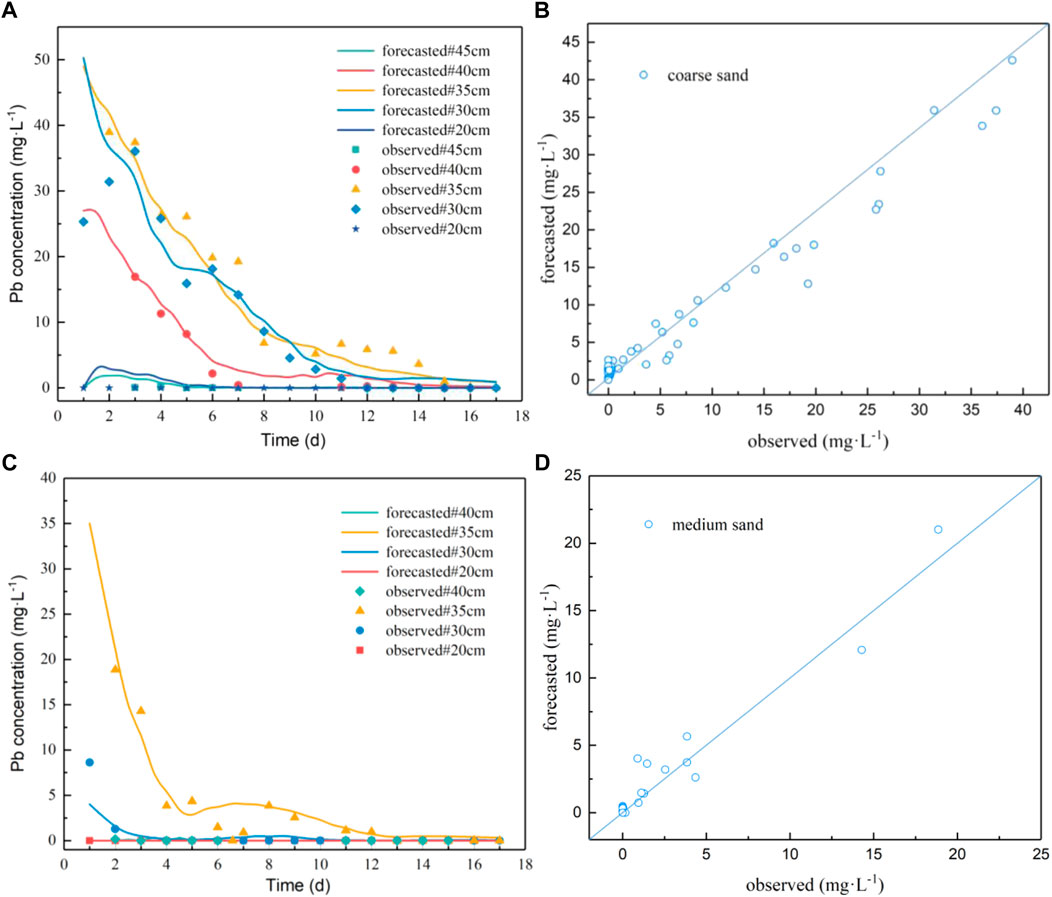
FIGURE 4. Comparison of observed results and forecasted results of Pb concentration in sampling water. (A): Fitting curve of Pb concentration in water from coarse sand sampling port; (B): the scatter plot of observed and forecasted values of Pb concentration in water from coarse sand;(C): fitting curve of Pb concentration in water from medium sand sampling port; (D): the scatter plot of observed and forecasted values of Pb concentration in water from medium sand.
Four simulation scenarios were set up by varying the water level fluctuation conditions and the initial concentration of pollutants. In the previous physical experiment of Pb migration in the groundwater level fluctuation zone, the groundwater level fluctuation was 10 cm and the initial concentration of contaminants was 2000 mg kg−1. This scenario was referred to as the fluctuation experiment scenario (F) to distinguish it from the simulation scenario. The fluctuation range of water level was set as 5 cm, the highest water level and fluctuation cycle remained constant, the number of water level fluctuations was increased, and the initial concentration of pollutants remained constant; this was referred to as scenario 1 (A1). The fluctuation range of the water level was set as 20 cm, the highest water level and fluctuation cycle remained unchanged, the number of water level fluctuations was reduced, and the initial concentration of pollutants remained unchanged; this was referred to as scenario 2 (A2). Figure 5 shows the changes in water level for scenarios 1 and 2. Setting the water level fluctuation to stay the same as the fluctuation experiment scenario but using an initial concentration of pollutants of 6000 mg kg−1 was referred to as scenario 3 (A3). Setting the water level fluctuation to stay the same as the fluctuation experiment scenario but using an initial concentration of pollutants of 1000 mg kg−1 was referred to as scenario 4 (A4).
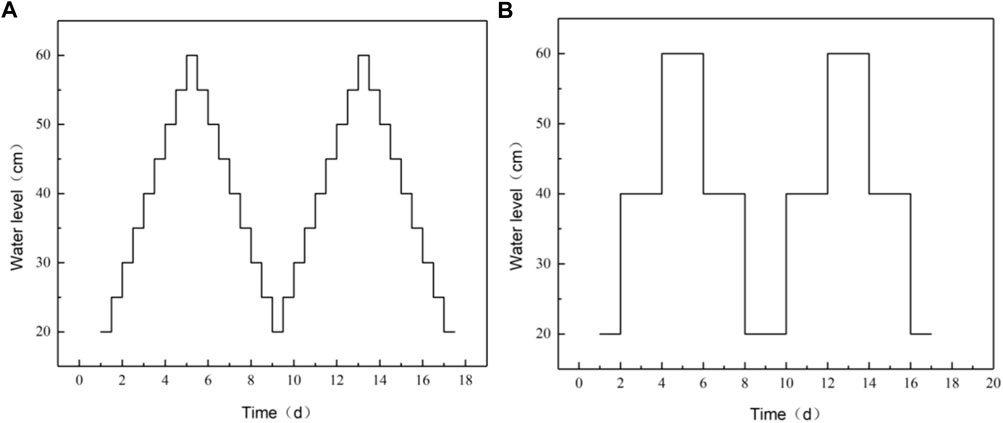
FIGURE 5. Water level fluctuation process. (A): Scenario 1; (B): scenario 2.
Using the established Hydrus-based numerical model of Pb migration in the groundwater level fluctuation zone, the spatial and temporal variations of Pb concentration in coarse sand and medium sand were predicted. These are compared with the results of fluctuation experimental scenarios in Figure 6. The water flow and solute transport model established by HYDRUS-1D can better reflect the water flow movement and Pb transport pattern in the experiment (Li et al., 2017). The results show that the small fluctuation of water level, high fluctuation frequency, and high concentration of contaminants in the aquifer media increase the range and concentration of Pb migration into the groundwater.
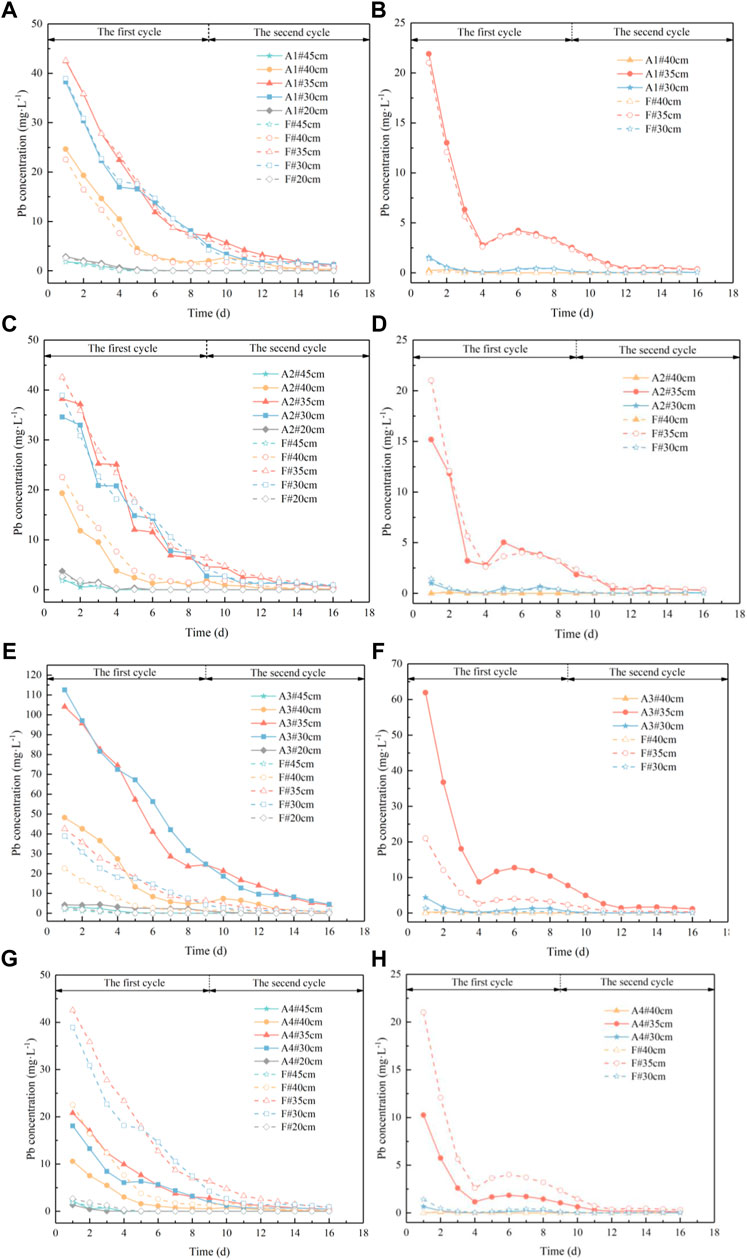
FIGURE 6. Pb concentration change process in water of soil column. (A): Variation of Pb concentration in water of coarse sand column in scenario 1; (B): variation of Pb concentration in water of medium sand column in scenario 1; (C): variation of Pb concentration in water of coarse sand column in scenario 2; (D): variation of Pb concentration in water of medium sand column in scenario 2; (E): variation of Pb concentration in water of coarse sand column in scenario 3; (F): variation of Pb concentration in water of medium sand column in scenario 3; (G): variation of Pb concentration in water of coarse sand column in scenario 4; (H): variation of Pb concentration in water of medium sand column in scenario 4.
The comparison of the Pb concentration in water in coarse and medium sand columns for scenario 1 and fluctuating experimental scenarios are shown in Table 5 and Table 6. Relative to the fluctuating experimental scenario, the water level fluctuation shown in scenario 1 decreases in magnitude and increases in frequency. The average Pb concentrations in water at the 40 cm, 35 cm, and 30 cm sampling ports in the coarse sand column increased by 26.57%, 9.27%, and 9.47%, respectively. The maximum concentrations were 24.64 mg L−1, 42.48 mg L−1, and 38.26 mg L−1, respectively. The average Pb concentrations in the water at the sampling ports at 35 cm and 30 cm in the medium sand column increased by 8.99% and 16.70%, respectively. The maximum concentrations of Pb in water were 21.90 mg L−1 and 1.56 mg L−1, respectively. Relative to the fluctuating experimental scenario, the water level fluctuation shown in scenario 2 increases in magnitude and decreases in frequency. The average Pb concentrations in water at the 40 cm, 35 cm, and 30 cm sampling ports in the coarse sand column decreased by 59.90%, 20.13%, and 14.04%, respectively. The maximum concentrations were 19.34 mg L−1, 38.24 mg L−1, and 34.59 mg L−1, respectively. The average Pb concentrations in the water at the sampling ports at 35 cm and 30 cm in the medium sand column decreased by 10.12% and 11.88%, respectively. The maximum concentrations of Pb in water were 15.18 mg L−1 and 0.99 mg L−1, respectively.
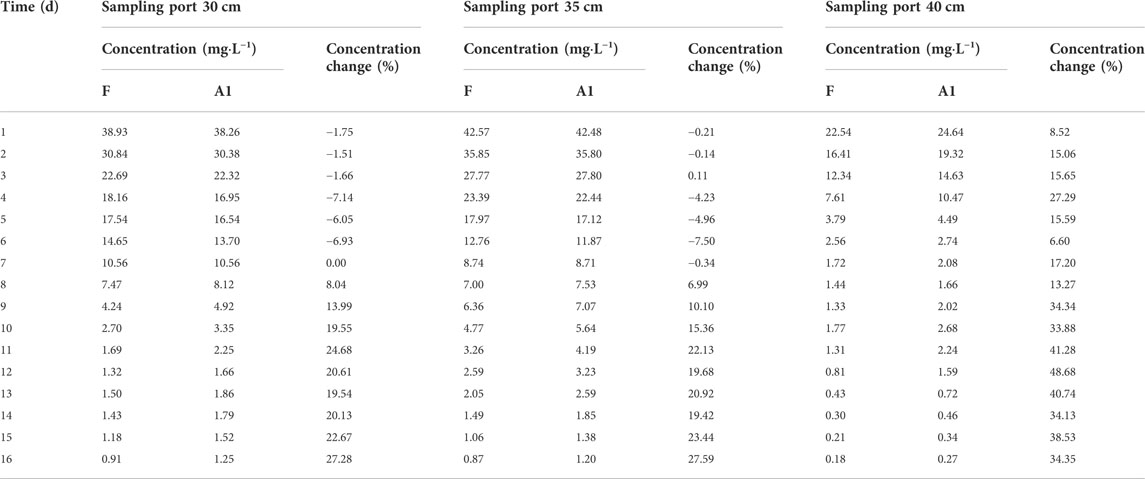
TABLE 5. Scenario 1: comparison of Pb concentration in the sampling water of the coarse sand column.
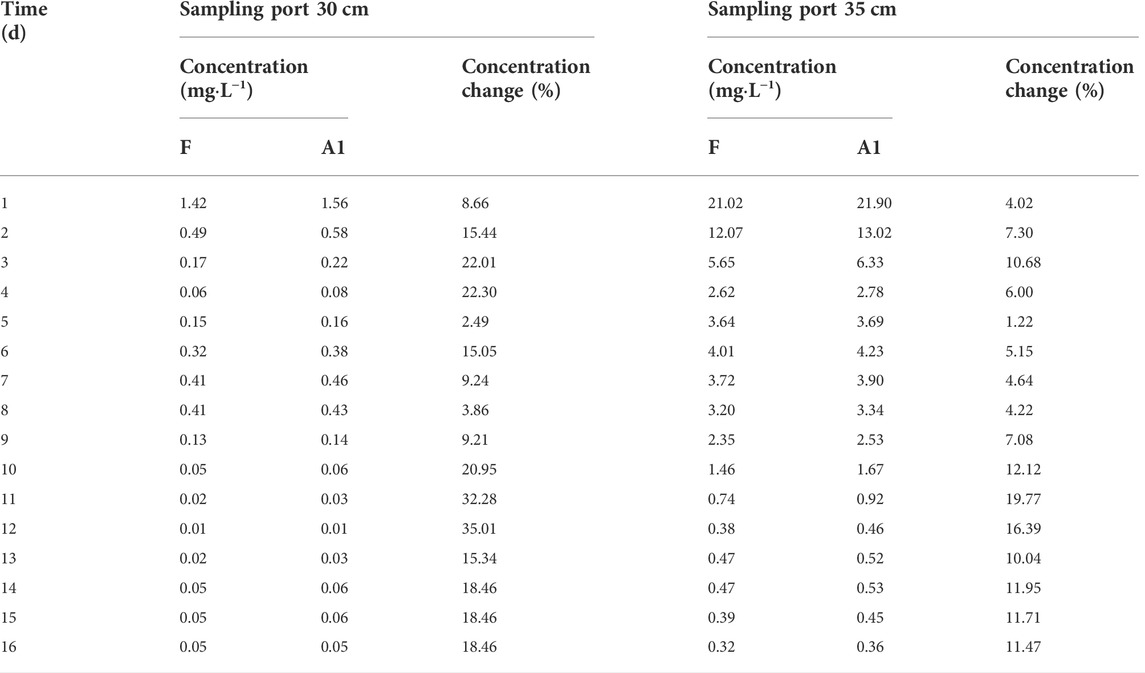
TABLE 6. Scenario 1: comparison of Pb concentration in the sampling water of the medium sand column.
Relative to the fluctuating experimental scenario, the initial pollutant concentrations shown in scenario 3 is 6000 mg kg−1. The average Pb concentrations in water at the 40 cm, 35 cm, and 30 cm sampling ports in the coarse sand column increased by 297.81%, 296.03%, and 395.75%, respectively. The maximum concentrations were 48.15 mg L−1,104.10 mg L−1, and 112.50 mg L−1, respectively. The average Pb concentrations in the water at the sampling ports at 35 cm and 30 cm in the medium sand column increased by 236.74% and 248.25%, respectively. The maximum concentrations of Pb in water were 61.96 mg L−1 and 4.37 mg L−1, respectively. Relative to the fluctuating experimental scenario, the initial pollutant concentrations shown in scenario 4 is 1,000 mg kg−1. The average Pb concentrations in water at the 40 cm, 35 cm, and 30 cm sampling ports in the coarse sand column decreased by 55.16%, 54.11%, and 56.42%, respectively. The maximum concentrations were 10.58 mg L−1,20.81 mg L−1, and 18.06 mg L−1, respectively. The average Pb concentrations in the water at the sampling ports at 35 cm and 30 cm in the medium sand column decreased by 55.45% and 56.54%, respectively. The maximum concentrations of Pb in water were 10.25 mg L−1 and 0.66 mg L−1, respectively.
Compared with the fluctuation experiment scenario (F), the variation in the Pb concentration in the water at the sampling port at 20 cm and 45 cm for the coarse sand column remains basically the same. The changes at 40 cm, 35 cm, and 30 cm are relatively apparent. The variation in the Pb concentration in water at the 35 cm and 30 cm sampling ports for medium sandy soil is relatively obvious. The rest of the sampling ports tend to be near zero. The average variations and maximum values of the Pb concentration for the four simulated scenarios are displayed in Table 7.
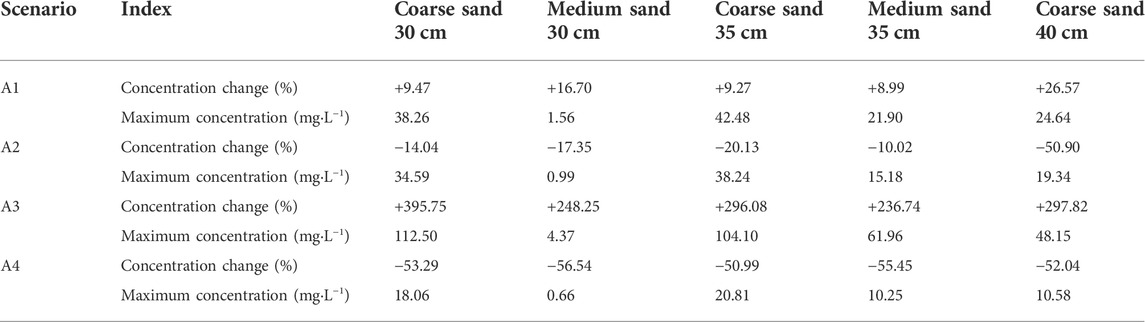
TABLE 7. Variation in Pb concentration in water under four simulated scenarios.
This experiment shows the effect of groundwater rise and fall on the migration of Pb contaminants in groundwater. The effect of water level fluctuation on lead migration is a dynamic process. When the groundwater level fluctuates to 30 cm, the water comes into contact with the contaminated medium, the soil water content increases, the capillary zone then rises, and the Pb in the soil enters the water through desorption (Wu et al., 2019; Lu et al., 2020a; Lu et al., 2020b; Lu et al., 2021; Lu et al., 2022). The Pb concentration in the water increases because the water level fluctuates rapidly and the Pb is not completely adsorbed by the soil (Ren, 2018). When the groundwater covers the contaminated medium completely, the maximum amount of Pb desorption occurs in the soil. There is the maximum amount of Pb in the water. At the same time, the uncontaminated medium has a large number of adsorption sites that could quickly adsorb Pb from the water. This prevents Pb from continuing to migrate upward with the rising water level. As the water level rises closer to the contaminant, the pH of the solution decreases, the activity of Pb becomes higher, and the amount of desorption increases (Ren, 2018). The highest concentration of Pb in the solution occurs at 35 cm. The further away the contaminant is, the smaller the maximum value of Pb content is. The content of Pb at 20 cm is greater than that at 45 cm in the coarse sand column. The main reason is that the ability of Pb to migrate downward by gravity is greater than the ability to migrate upward (Jiao, 2018).
As the water level rises, the concentration of Pb in water decreases for the following three main reasons. Firstly, the soil is alkaline. As the water table rises, the water pH increases and OH− combines with Pb2+ in the water to generate precipitation. Secondly, above the contaminated medium is clean soil, which has a stronger adsorption capacity than the polluted medium. The elevated water level will cause the Pb to be re-adsorbed. In addition, the adsorption and desorption of Pb are affected by the hydrodynamic conditions. The change in hydrodynamic conditions will cause the Pb to be desorbed and then adsorbed again. These two processes transform each other until an adsorption equilibrium is reached. At the stage of declining water level, it is difficult to detect the change in Pb concentration at the 20 cm sampling port. Because there is clean soil underneath the contaminated media, Pb desorbed from the contaminated media will be rapidly adsorbed.
Groundwater level fluctuations have a significant effect on the migration of Pb. In the same medium soil column, the concentration of Pb in water at the same location increases as the amplitude of the fluctuation in the water level decreases and the fluctuation frequency increases. As the fluctuation amplitude increases and the fluctuation frequency decreases, the concentration of Pb in water at the same location decreases. The Pb concentration in the water corresponds well with the initial pollutant concentration. The variation in the Pb concentration in water is basically the same as the magnitude of the change in the initial pollutant concentration. When the fluctuation amplitude decreases and the fluctuation frequency increases, the water level fluctuation accelerates, resulting in a shorter residence time of Pb in the medium. The Pb migrates with the water flow before it is wholly adsorbed, causing the concentration of Pb in water to increase. Compared with medium sand, coarse sand has larger particles, smaller specific surface area and lower organic matter content (Luo et al., 2019). Organic matter enters the soil medium and forms humic acid through the action of microorganisms. Humic acid enhances soil sorption of heavy metals, mainly because humic acid undergoes dissociation and then complexes with heavy metals, and its complexes bind to the soil, enhancing the soil’s ability to sorb heavy metals. At the same time, humic acid binds to the surface active sites of the soil, forming ion exchange centers that are more effective for trace metals. All these effects enhance the sorption of heavy metals by the soil (Yu et al., 2002). Polar groups in the organic matter of the medium, such as hydroxyl and carboxyl groups, can cause a large negative charge on the surface of the medium, thus enhancing the electrostatic sorption of Pb as well. Therefore, the adsorption capacity of coarse sand is smaller than that of medium sand. This result is consistent with the findings of Ren et al. (2016). It leads to the migration range and concentration of Pb in coarse sand water being greater than those of medium sand.
When the contaminants are distributed at 30–40 cm in the soil column, the coarse sand Pb and medium sand Pb migrated to the water in the range of 20–45 cm and 30–40 cm, respectively. During the fluctuation in the water level, the content of Pb in the water is proportional to the medium particle size.
A numerical model of Pb migration in the aeration zone–saturation zone coupled with water transport and solute transport was constructed using the HYDRUS-1D. The model is used to simulate the Pb concentration in water. The simulated values of Pb concentration in coarse sand and medium sand water were basically consistent with the measured values, with R2 of 95.5% and 93.4% and RMSE of 1.965 and 0.704, respectively. The numerical model fit was effective and the model was relatively reliable.
Four different scenarios were simulated using the numerical model of Pb migration in the groundwater fluctuation zone. The results showed that as the water level fluctuation decreased, the fluctuation frequency increased and the concentration of Pb in the water at the same location increased. Conversely, the concentration of Pb decreased. The Pb concentration in the water corresponds well to the initial pollutant concentration. The variation in the Pb concentration in water is basically the same as the magnitude of the change in the initial pollutant concentration (Zhang et al., 2012; Wang and Cao, 2019; Lu et al., 2020a; Lu et al., 2020b; Lu et al., 2021; Lu et al., 2022).
The original contributions presented in the study are included in the article/supplementary material, further inquiries can be directed to the corresponding author.
JQ proposed the original idea. YZ and JJ carried out the experiment. JJ and YZ conducted data curation. JQ and JJ wrote the original draft. JQ supervised the research work. YL, TY, WG, and SL reviewed the manuscript. All authors have read and agreed to the published version of the manuscript.
This research was funded by the Key R & D and Promotion Projects in Henan Province (202102310012), the Doctoral Research Fund of North China University of Water Resources and Electric Power (40651), and the Key Project of Science and Technology Research of Henan Education Department (14A170006).
The authors declare that the research was conducted in the absence of any commercial or financial relationships that could be construed as a potential conflict of interest.
All claims expressed in this article are solely those of the authors and do not necessarily represent those of their affiliated organizations, or those of the publisher, the editors and the reviewers. Any product that may be evaluated in this article, or claim that may be made by its manufacturer, is not guaranteed or endorsed by the publisher.
Alfaifi, H., El-Sorogy, A. S., Qaysi, S., Kahal, A., Zaidi, F. K., Alshehri, F., et al. (2021). Evaluation of heavy metal contamination and groundwater quality along the red sea coast, southern Saudi Arabia. Mar. Pollut. Bull. 163 (1), 111975. doi:10.1016/j.marpolbul.2021.111975
Azimi, R., Vaezihir, A., Lenhard, R., and Hassanizadeh, S. (2020). Evaluation of LNAPL behavior in water table inter-fluctuate zone under groundwater drawdown condition. Water 12 (9), 2337. doi:10.3390/w12092337
Bustos Medina, D. A., van den Berg, G. A., van Breukelen, B. M., Juhasz-Holterman, M., and Stuyfzand, P. J. (2013). Iron-hydroxide clogging of public supply wells receiving artificial recharge: Near-well and in-well hydrological and hydrochemical observations. Hydrogeol. J. 21 (7), 1393–1412. doi:10.1007/s10040-013-1005-0
Celia, M. A., Bouloutas, E. T., and Zarba, R. L. (1990). A general mass‐conservative numerical solution for the unsaturated flow equation. Water Resour. Res. 26, 1483–1496. doi:10.1029/WR026i007p01483
de Ruijter, F. J., Boumans, L. J. M., Smit, A. L., and van den Berg, M. (2007). Nitrate in upper groundwater on farms under tillage as affected by fertilizer use, soil type and groundwater table. Nutr. Cycl. Agroecosyst. 77 (2), 155–167. doi:10.1007/s10705-006-9051-9
Du, X., Yan, B., Xu, K., Wang, S., Gao, Z., Ren, X., et al. (2021). Research progress on water-salt transport theories and models in saline-alkali soil. Chin. J. Soil Sci. 03, 713–721. (In Chinese). doi:10.19336/j.cnki.trtb.2020052002
Farnsworth, C. E., Voegelin, A., and Hering, J. G. (2012). Manganese oxidation induced by water table fluctuations in a sand column. Environ. Sci. Technol. 46 (1), 277–284. doi:10.1021/es2027828
Gao, F., Liu, X. Q., Jiang, H. Y., and Ji, S. C. (2019). Probability theory and mathematical statistics. Nanjing: Nanjing University Press. (In Chinese).
Gumua-Kawcka, A., Jaworska-Szulc, B., Szymkiewicz, A., Gorczewska-Langner, W., Pruszkowska-Caceres, M., Angulo-Jaramillo, R., et al. (2022). Estimation of groundwater recharge in a shallow sandy aquifer using unsaturated zone modeling and water table fluctuation method. J. Hydrology 605, 127283. doi:10.1016/j.jhydrol.2021.127283
Gupta, P. K., Yadav, B., and Yadav, B. K. (2019). Assessment of lnapl in subsurface under fluctuating groundwater table using 2d sand tank experiments. J. Environ. Eng. New. York. 145 (9), 04019048. doi:10.1061/(ASCE)EE.1943-7870.0001560
Haj-Amor, Z., Hashemi, H., and Bouri, S. (2017). Soil salinization and critical shallow groundwater depth under saline irrigation condition in a Saharan irrigated land, Arabian. J. Geosciences 10 (14), 01. doi:10.1007/s12517-017-3093-y
Ibrahimi, M. K., Miyazaki, T., Nishimura, T., and Imoto, H. (2014). Contribution of shallow groundwater rapid fluctuation to soil salinization under arid and semiarid climate. Arab. J. Geosci. 7 (9), 3901–3911. doi:10.1007/s12517-013-1084-1
Jeongkon Kim, M. Y. C., and Corapcioglu, M. (2003). Modeling dissolution and volatilization of LNAPL sources migrating on the groundwater table. J. Contam. Hydrology 65 (1/2), 137–158. doi:10.1016/S0169-7722(02)00105-5
Jiao, X., Maimaitiyiming, A., Salahou, M., Liu, K., and Guo, W. (2017). Impact of groundwater level on nitrate nitrogen accumulation in the vadose zone beneath a cotton field. Water 9 (3), 171. doi:10.3390/w9030171
Jiao, X., Teng, Y., Zhan, Y., Wu, J., and Lin, X. (2015). Soil heavy metal pollution and risk assessment in Shenyang industrial district, Northeast China. PloS one 10 (5), e0127736. doi:10.1371/journal.pone.0127736
Jiao, Y. B. (2018). Numerical simulation of vertical transport of heavy metal Cd, Pb in soil. [master's thesis]. Kaifeng: Henan University. (In Chinese).
Jing Liu, J., Zhu, X., Li, S., Kang, L., Ma, M., and Du, L. (2021). Effects of groundwater fluctuation on nitrate nitrogen transport after nitrogen application in cropland soil. Chin. J. Eco-Agriculture 29 (01), 154–162. (In Chinese). doi:10.13930/j.cnki.cjea.200707
Kamon, M., Endo, K., and Katsumi, T. (2003). Measuring the k–S–p relations on DNAPLs migration. Eng. Geol. 70 (3-4), 351–363. doi:10.1016/S0013-7952(03)00103-0
Krause, S., Bronstert, A., and Zehe, E. (2007). Groundwater–surface water interactions in a North German lowland floodplain – implications for the river discharge dynamics and riparian water balance. J. Hydrology 347 (3-4), 404–417. doi:10.1016/j.jhydrol.2007.09.028
Li, W., He, J., Liu, L., Gao, P., and Ji, Y. (2013a). Application of Hydrus-1D software in groundwater contamination risk assessment. China Environ. Sci. 33 (4), 639–647. (In Chinese). doi:10.3969/j.issn.1000-6923.2013.04.009
Li, X., Yang, T., Bai, S., Xi, B., Zhu, X., Yuan, Z., et al. (2013b). The effects of groundwater table fluctuation on nitrogen migration in aeration zone. J. Agro-Environment Sci. 32 (12), 2443–2450. (In Chinese). doi:10.11654/jaes.2013.12.018
Li, S., Bai, S., Yang, Y., and Li, S. (2014). Numerical simulation of nitrate nitrogen migration in soil with water table fluctuation. Chin. J. Soil Sci. 45 (05), 1077–1082. (In Chinese). doi:10.19336/j.cnki.trtb.2014.05.010
Li, X., Li, J., Xi, B., Yuan, Z., Zhu, X., and Zhang, X. (2015). Effects of groundwater level variations on the nitrate content of groundwater: A case study in Luoyang area, China. Environ. Earth Sci. 74 (5), 3969–3983. doi:10.1007/s12665-015-4016-4
Li, J., Zhao, R., and Li, Y. (2017). Simulation of water and solute transport characteristics in different bioretention tanks using HYDRUS-1D model. Acta Sci. Circumstantiae 37 (11), 4150–4159. (In Chinese). doi:10.13671/j.hjkxxb.2017.0201
Lin, G. Y. (2014). Study on migration and transformation of petroleum hydrocarbons in zone of intermittent saturation. [master's thesis]. Changchun: Jilin University. (In Chinese).
Liu, Y., Su, C., Zhang, H., Li, X., and Pei, J. (2014). Interaction of soil heavy metal pollution with industrialisation and the landscape pattern in Taiyuan city, China. PloS one 9 (9), e105798. doi:10.1371/journal.pone.0105798
Liu, Y., Ding, A., Liu, B., Liang, X., Li, S., Zhang, L., et al. (2018). A review of the petroleum hydrocarbon contamination transformation performance in the zone of intermittent saturation. Sci. Technol. Eng. 18 (24), 172–178. (In Chinese).
Lu, S., Zhang, X., and Tang, Y. (2020a). Evolutionary analysis on structural characteristics of water resource system in basins of Northern China. Sustain. Dev. 28, 1–13. doi:10.1002/sd.2031
Lu, S., Li, J., Xiao, B., and Guo, M. (2020b). Analysis of standard accounting method of economic compensation for ecological pollution in watershed. Sci. Total Environ. 737, 138157. doi:10.1016/j.scitotenv.2020.138157
Lu, S., Lian, Z., Sun, H., Wu, X., Bai, X., and Wang, C. (2021). Simulating trans-boundary watershed water resources conflict. Resour. Policy 73, 102139. doi:10.1016/j.resourpol.2021.102139
Lu, S., Xiao, B., Zhang, J., Li, J., Li, W., and Lin, J. (2022). Impact of virtual water export on water resource security associated with the energy and food bases in northeast China. Technol. Forecast. Soc. Change 180, 121635. doi:10.1016/j.techfore.2022.121635
Luo, Y., Wu, Y., Shu, J., and Wu, Z. (2019). Effect of particulate organic matter fractions on the distribution of heavy metals with aided phytostabilization at a zinc smelting waste slag site. Environ. Pollut. 253, 330–341. doi:10.1016/j.envpol.2019.07.015
Meng, X. F. (2015). Study on variation of Fe and Mn content in fluctuation zone of groundwater level: An example in shenyang huangjia water source. [master's thesis]. Changchun: Jilin University. (In Chinese).
Neuman, S. P., and Tartakovsky, D. M. (2009). Perspective on theories of non-Fickian transport in heterogeneous media. Adv. Water Resour. 32 (5), 670–680. doi:10.1016/j.advwatres.2008.08.005
Nie, W. B., Ma, X. Y., and Wang, S. L. (2009). Numerical simulation of one-dimensional soil infiltration characteristic. J. Irrigation Drainage 28 (3), 53–57. (In Chinese). doi:10.13522/j.cnki.ggps.2009.03.021
Oostrom, M., Dane, J. H., and Wietsma, T. W. (2007). A review of multidimensional, multifluid, intermediate‐scale experiments: Flow behavior, saturation imaging, and tracer detection and quantification. Vadose zone J. 6 (3), 610–637. doi:10.2136/vzj2006.0178
Qi, S., Jian, L., David, O. C., Xiaoyuan, C., and Deyi, H. (2019). Influence of groundwater table fluctuation on the non-equilibrium transport of volatile organic contaminants in the vadose zone. J. Hydrology 580, 124353. doi:10.1016/j.jhydrol.2019.124353
Ren, L. J. (2018). Adsorption-desorption characteristics research of Pb, Cr, Ni in sediment and soil. [master's thesis]. Changchun: Jilin Agricultural University. (In Chinese).
Ren, L., Ma, X., Bian, W., Wang, F., Wang, Y., and Dua, J. (2016). The adsorption characteristic research of Pb in reservior sediment. J. Soil Water Conservation 30 (05), 255–260+265. (In Chinese). doi:10.13870/j.cnki.stbcxb.2016.05.042
Rudzianskaite, A., and Sukys, P. (2008). Effects of groundwater level fluctuation on its chemical composition in karst soils of Lithuania. Environ. Geol. 56 (2), 289–297. doi:10.1007/s00254-007-1164-1
Shi, H., Yang, S., Li, R., Li, X., Li, W., Yan, J., et al. (2020). Soil water and salt movement and soil salinization control in hetao irrigation district. Current State and Future Prospect 39 (08), 1–17. (In chinese). doi:10.13522/j.cnki.ggps.2020156
Srivastava, V., Sarkar, A., Singh, S., Singh, P., de Araujo, A. S. F., and Singh, R. P. (2017). Agroecological responses of heavy metal pollution with special emphasis on soil health and plant performances. Front. Environ. Sci. 5, 64. doi:10.3389/fenvs.2017.00064
Steffy, D. A., Johnston, C. D., and Barry, D. A. (1998). Numerical simulations and long-column tests of LNAPL displacement and trapping by a fluctuating water table. J. soil Contam. 7 (3), 325–356. doi:10.1080/10588339891334294
Tian, K., Zhang, G., and Zheng, F. (2009). Chemical transport from soil into surface runoff under different ground-water tables. J. Northwest A F Univ. Nat. Sci. Ed. 37 (11), 193–200. (In Chinese). doi:10.13207/j.cnki.jnwafu.2009.11.011
Wang, S., and Cao, J. (2019). The determination of lead content in geochemical samples. Biol. Chem. Eng. 5 (02), 35–37. (In Chinese) CNKI:SUN:SWHG.0.2019-02-008.
Wang, Y., He, J., Li, H., and Zhang, M. (2017). Dynamic changes of groundwater iron in a typical area of sanjiang plain. Environ. Eng. 35 (09), 48–52. (In Chinese). doi:10.13205/j.hjgc.201709010
Wang, G., Shi, H., Li, X., Zheng, Q., Guo, J., and Wang, W. (2019). Analysis of water and salt transportation and balance during cultivated land, waste land and lake system in Hetao Irrigation Area. J. Hydraulic Eng. 50 (12), 1518–1528. (In Chinese). doi:10.13243/j.cnki.slxb.20190593
Wang, Y., Wang, Y., Tang, J., Li, J., Yang, Y., Bai, S., et al. (2020). Numerical simulation of SVE in groundwater table fluctuation zone based on TMVOC. China Environ. Sci. 40 (01), 350–356. (In Chinese). doi:10.19674/j.cnki.issn1000-6923.2020.0040
Wu, Z., Liu, G., Qian, J., Wei, Y., and Yue, Q. (2019). Experimental study on the vertical migration of Pb from the saturated zone to unsaturated zone. Environ. Sci. Technol. 42 (09), 36–41. (In Chinese). doi:10.19672/j.cnki.1003-6504.2019.09.006
Xi, J., Yu, X., Zhou, L., Li, D., and Zhang, G. (2011). Comparison of soil heavy metal pollution in suburb fields of different regions. Soils 43 (05), 769–775. (In Chinese). doi:10.13758/j.cnki.tr.2011.05.004
Xin Liu, X., Zuo, R., Wang, J. S., He, Z. K., and Li, Q. (2021). Advances in researches on ammonia, nitrite and nitrate on migration and transformation in the groundwater level fluctuation zone. Hydrogeology Eng. Geol. 48 (02), 27–36. (In Chinese). doi:10.16030/j.cnki.issn.1000-3665.202007033
Yan, J., Lv, Q., and Ge, X. (2007). The research about soil heavy metal pollution forecast and early warning support by GIS. J. Jilin Univ. (Earth Sci. Ed. 03, 592–596. (In Chinese). doi:10.13278/j.cnki.jjuese.2007.03.028
Yang, C., Offiong, N. A., Zhang, C., Liu, F., and Dong, J. (2021). Mechanisms of irreversible density modification using colloidal biliquid aphron for dense nonaqueous phase liquids in contaminated aquifer remediation. J. Hazard. Mater. 415, 125667. doi:10.1016/j.jhazmat.2021.125667
Yang, C., Offiong, N. A., Zhang, C., Liu, F., Zhang, W., and Dong, J. (2022). Density-regulated remediation of dense non-aqueous phase liquids using colloidal biliquid aphrons (cbla): Force model of transport and distribution. Sci. Total Environ. 807, 151057. doi:10.1016/j.scitotenv.2021.151057
Yu, G., Jiang, X., Sun, L., Wang, F., and Bian, Y. (2002). A review for effect of organic substances on the availability of cadmium in Soils. Acta Ecol. Sin. 22 (05), 770–776. (In Chinese). doi:10.3321/j.issn:1000-0933.2002.05.021
Zhang, W., Lin, X., and Su, X. (2010). Transport and fate modeling of nitrobenzene in groundwater after the Songhua River pollution accident. J. Environ. Manag. 91 (11), 2378–2384. doi:10.1016/j.jenvman.2010.06.025
Zhang, B., Chen, Y., Fang, F., Li, Z., Guo, J., and Wang, Z. (2012). Nitrogen forms and their distribution characteristics in the soils of water-level-fluctuating zone in the central Three Gorges Reservoir. Acta Sci. Circumstantiae 32 (05), 1126–1133. (In Chinese). doi:10.13671/j.hjkxxb.2012.05.019
Zhang, R. J., Yao, S. Y., and Yan-Song, A. O. (2013). Vertical transport rules of Cu, Cd, Pb in the surface of soil. J. Shanghai Jiaot. Univ. Agric. Sci. 31, 67–71. doi:10.3969/J.ISSN.1671-9964.2013.05.013
Zhang, D., Fan, M., Liu, H., Wang, R., Zhao, J., Yang, Y., et al. (2020). Effects of shallow groundwater table fluctuations on nitrogen in the groundwater and soil profile in the nearshore vegetable fields of Erhai Lake, southwest China. J. Soils Sediments 20 (1), 42–51. doi:10.1007/s11368-019-02382-8
Zhang, Z., Xiao, C., Yang, W., Adeyeye, O. A., and Liang, X. (2021). Effects of the natural environment and human activities on iron and manganese content in groundwater: A case study of changchun city, northeast China. Environ. Sci. Pollut. Res. 28 (30), 41109–41119. doi:10.1007/s11356-021-13576-4
Zhou, J., Dang, Z., Cai, M., and Liu, C. (2007). Soil heavy metal pollution around the Dabaoshan mine, Guangdong Province, China. Pedosphere 17 (5), 588–594. doi:10.1016/S1002-0160(07)60069-1
Keywords: groundwater fluctuation zone, Pb, migration, soil column experiment, Hydrus-1D
Citation: Qu J, Jiang J, Zhang Y, Li Y, Yan T, Guo W and Lu S (2022) Soil column experiment and numerical simulation research of Pb migration process in the groundwater fluctuation zone based on HYDRUS. Front. Environ. Sci. 10:989257. doi: 10.3389/fenvs.2022.989257
Received: 08 July 2022; Accepted: 12 August 2022;
Published: 02 September 2022.
Edited by:
Nnanake-Abasi Offiong, Topfaith University, NigeriaReviewed by:
Pankaj K. Gupta, University of Waterloo, CanadaCopyright © 2022 Qu, Jiang, Zhang, Li, Yan, Guo and Lu. This is an open-access article distributed under the terms of the Creative Commons Attribution License (CC BY). The use, distribution or reproduction in other forums is permitted, provided the original author(s) and the copyright owner(s) are credited and that the original publication in this journal is cited, in accordance with accepted academic practice. No use, distribution or reproduction is permitted which does not comply with these terms.
*Correspondence: Jihong Qu, cXVqaWhvbmdAbmN3dS5lZHUuY24=
Disclaimer: All claims expressed in this article are solely those of the authors and do not necessarily represent those of their affiliated organizations, or those of the publisher, the editors and the reviewers. Any product that may be evaluated in this article or claim that may be made by its manufacturer is not guaranteed or endorsed by the publisher.
Research integrity at Frontiers
Learn more about the work of our research integrity team to safeguard the quality of each article we publish.