 Erum Rehman
 Shazia Rehman
 Ayesha Mumtaz
 Zhang Jianglin
 Muhammad Ali Shahiman
94% of researchers rate our articles as excellent or good
Learn more about the work of our research integrity team to safeguard the quality of each article we publish.
Find out more
ORIGINAL RESEARCH article
Front. Environ. Sci. , 29 September 2022
Sec. Environmental Economics and Management
Volume 10 - 2022 | https://doi.org/10.3389/fenvs.2022.988921
This article is part of the Research Topic Eco-Innovation and Green Productivity for Sustainable Production and Consumption View all 47 articles
The present study empirically analyzes the role of eco-innovation in plummeting carbon dioxide (CO2) emissions in conjunction with renewable energy usage, foreign direct investment, and trade openness for the states in G-7 from 1990 to 2019 in a mathematical and statistical context. Under the dynamical framework, the estimates of mathematical grey relational analyses indicate that eco-innovation holds a stronger degree of association with CO2 emissions. Further, the estimates demonstrate that, compared to the other G-7 states, Japan is the country where eco-innovation is a more striking variable. However, renewable energy utilization seems weaker in Japan, which necessitates adopting renewable energy to curb carbon emissions in the region. Statistically, the odds ratio illustrates a similar pattern, demonstrating that the odds of occurrence for eco-innovation are much stronger in reducing the rising levels of carbon emissions within the G-7 states. Moreover, trade openness and foreign direct investment were revealed to be the leading contributors to carbon emissions in Germany and Canada, respectively, whilst appearing to be significant variables in lowering emissions in the United States and the United Kingdom. The outcomes of this investigation offer significant perspectives for policymakers in formulating holistic and environmentally friendly policies by embracing eco-innovation as a potentially significant component for sustainable economic expansion and environmental health.
There is a growing consensus among countries worldwide that global warming poses a severe environmental threat (E. Rehman & Rehman, 2022). Most people think that anthropogenic emissions of dangerous gases like carbon dioxide (CO2) are the main cause of the increase in global temperatures that are harming both environment and public health (Mumtaz et al., 2022). Therefore, it is important to pinpoint the elements that might assist reduce Carbon emissions and associated damaging environmental consequences. Governments started looking for a unified strategy as the negative impacts of environmental degradation, such as global warming and climate change, became increasingly obvious on a global level (Shazia et al., 2022). As a result, various conferences on environmental sustainability were convened domestically and internationally. Global temperatures have increased by 1.9°F since 1880 due to increased pollution; sea levels have increased by 178 mm in the past century; and CO2 emissions have reached 413 parts per million, the highest level in 650,000°years (Kraaijenbrink et al., 2017). As a result, the world is currently confronting one of its greatest challenges due to the ongoing and accelerating degradation of the environment and climate. The 21st Conference (COP21) of the Parties of the United Nations Framework Convention on Climate Change (UNFCCC), often known as the UNFCCC, is a significant milestone in the global community’s response to these climatic variations. The Paris Agreement from the COP21 was a crucial milestone in improving global understanding and diplomacy over climate-related concerns. Due to the heavy utilization of energy, which releases Carbon dioxide into the atmosphere and eventually raises the global average temperature, COP21 was essential in the international community comprehending the negative impact that ongoing economic growth has had on climatic changes (United Nations Climate Change, 2021). The fast expansion in global output has also resulted in a larger contribution to global warming due to resource depletion and power consumption and then accelerated global warming (Fan et al., 2019). Additionally, as the population grows, the need for energy grows geometrically, increasing the destruction of the environment owing to the discharge of residues into the atmosphere. Today’s global ecology faces substantial difficulties from concerns like climate change and global warming, which have negative impacts on the well-being, of animals, and species of plants (International Energy Agency, 2015).
Referring to this, the G7 countries, the United Kingdom, the united states, Canada, France, Germany, Italy, and Japan are committed to reducing Carbon dioxide emissions through energy portfolio diversification, especially by incorporating green energy sources into their traditional energy portfolios (Murshed, 2020). Accordingly, these nations are responsible for around 30 and 25 percent of the world’s energy intensity and these emissions (Ahmad et al., 2021). The G7 nations are also significantly reliant on imported and domestic non-renewable sources. It is interesting to note that most G7 countries import non-renewable energy to fulfill their energy demands. Around 96 percent, 84%, and 64 percent, respective of Japan, Italy, and Germany’s supply are imported. These statistics underline the concern of the G7 countries’ reliance on polluting fuels. These statistics help to illustrate why, despite their economic success, these nations have mostly failed to stop the deterioration of their environmental protection (Li & Haneklaus, 2022; Murshed et al., 2022; Xu et al., 2022). Due to these environmental harms, initiatives like the Paris Agreement (UNFCCC, 2016) require all nations to decrease emissions to some level while also thinking about ways to help mankind adapt to climatic changes. Reduced environmental deterioration, a critical worldwide issue that affects human development and wellbeing, has been addressed. Targets for carbon emissions are now desired as a result. Contrarily, limiting economic activity is not sustainable in the long run. The question of whether policymakers can integrate growth strategies with low-carbon plans to ensure that society’s growth is optimum, efficient, and sustainable is therefore raised (E. Rehman et al., 2020) Shahzad et al., 2021).
Economic growth cannot be achieved over the long run without an unbroken flow of inputs like energy. As a result, the energy demand has dramatically expanded globally (Kirikkaleli & Adebayo, 2021). To combat the rising energy demand, the majority of nations throughout the world heavily rely on renewable resources including coal, crude oil, and natural gas. Indeed, the strong reliance on fossil fuels has exacerbated environmental challenges even worst (Adebayo et al., 2021; Fahad et al., 2022). Since the preindustrial era, anthropogenetic greenhouse gas (GHGs) emissions have increased and are now at their greatest level (Arif et al., 2022). According to BP 2020 report, carbon pollution in this context increased by 43.66%t during the previous 35 years, from 19,249.9 million tonnes in 1985 to about 34,169.0 million tonnes in 2019 (BP, 2020). In addition, if governments put up significant steps to decrease these emissions in the next years, carbon emissions are predicted to elevate around 2050. The global average temperature rose by 0.85°C between 1980 and 2012. Additionally, the manufacture of conventional energy-intensive goods necessitates greater energy use, worsening the atmosphere. Nevertheless, producing smart and complicated items could need minimal energy, which might promote ecological sustainability (Razzaq et al., 2021). The COP21 also emphasizes the importance of supporting green and sustainable growth to slow down ecological destruction. It is necessary to implement structural changes in the manufacturing activity by using cleaner resources of energy to reach the objectives of transitioning to green growth along with a low-carbon economy. The techniques used by nations throughout the world to produce energy urgently need to alter. As opposed to utilizing fossil fuels, which are not sustainable, this promotes the use of cleaner, renewable energy. The fast development and use of renewables are being driven by a wide range of factors, including the need to reduce greenhouse gas emissions, increase energy access, boost the economy, provide energy security, and mitigate environmental changes (UNFCCC, 2016).
Trade openness is essential for increasing the flow of goods and services and increasing economic productivity, but the relevance of viable options for Pollutant emissions is still up for dispute (Destek & Sinha, 2020). Even though some studies have suggested that trade openness is environmentally unfriendly, others contend that it improves it. Still, others contend that there is no connection between trade openness and ecological sustainability (Ali et al., 2020). Trade is a substantial contributor to Carbon emissions from industry in the G7 nations, and the amount of carbon dioxide is a component of the ultimate domestic demand for imported products (Adebayo et al., 2022). Even though countries are shifting their reserves to concentrate on project efficiency and use a broad range of environmental innovations to stabilize trade and Carbon dioxide, achieving greener and more efficient performance remains a significant issue in this world, with global trade and development being the key determinants (Y. Liu et al., 2022; H. Khan et al., 2022). Chen et al. (2019) used the error correction (ER) model and the autoregressive distributed lag (ARDL) technique to examine the connection between GDP, trade openness, RE, and CO2 emissions from 1980 to 2014 for the case of China. The findings show that trade and renewable energy have the worst ecological consequences than economic production, which has an inverted U-shaped association with these emissions. Furthermore, the Granger causality research verified a bidirectional causality between carbon emissions, trade, and renewables. But there is also proof that rapidly increasing foreign trade and FDI cause environmental destruction (Ren et al., 2014). FDI is the main engine driving industrial growth and economic expansion. FDI is a clear choice related to technical transition, productivity improvements, and employment creation. However, the presence of FDI in a nation is not necessarily trouble-free. For instance, FDI will likely lead to the development of new industries which might harm the ecology (Usman et al., 2022). Khan et al., 2020, 2020b) examined how environmental variables interacted in 190 different nations. They employed stationary and non - stationary models and discovered that the independent variables in this study had a big impact on one another. They also discovered that FDI has a favorable level of carbon emission whereas renewable energy has a negative impact. Similarly, Zameer et al. (2020) study the impact of natural resources, renewables, and foreign direct investment on CO2 emissions for OECD nations. According to them, renewable energy has a good positive impact on environmental performance and also shows that abundance of natural resources, and foreign investment raises carbon dioxide emissions. Furthermore, Manta et al. (2020) investigate the connection between financial development, carbon dioxide emissions, and energy usage in European nations. They employed FMOLS and VECM metrics, and the statistics revealed that CO2 emissions and energy have no long-term influence on economic prosperity. They have discovered, however, a bidirectional association between financial progress and development. They also show that financial growth does not lessen pollution, that energy usage accelerates financial advancement, and that financial expansion increases pollution in the short run.
Eco-Innovation is another recent aspect of the growth-environment nexus that has been deemed to have a substantial impact on ecological quality. For instance, according to research by Hodson et al. (2018). Eco-innovation lowers carbon emissions because it offers decent usage of resources and offers affordable solutions to minimize carbon dioxide emissions. Similar research was undertaken by Cagno et al. (2015), who revealed how eco-innovation improves energy efficiency and consequently lessens the utilization of non-renewable resources that aid to lower pollution. The link between economic development, eco-innovation, and carbon dioxide emissions was researched by Álvarez-Herránz et al. (2017). According to them, Eco-innovation promotes the use of cleaner energy and production in the economy. Mushta et al. (2020) looked at how innovation affected economic development, income inequality, and CO2 emissions in China at the local and national levels. Throughout this period, from 1995 to 2015, they collected data using panel data econometric approaches and discovered that the relationship between income inequality, CO2 emissions, and economic growth in China is moderated by environmental innovation. Between the years 1995–2015, Bilan et al. (2019) explored the role of Renewable Energy and GDP Per Capita on Carbon dioxide emission in the European Union countries. The authors demonstrate that the adoption of RE results in an improvement in ecosystems using cointegration and other methodologies like VECM. The role of RE in emission Reduction is examined by Dong et al. (2018) in the setting of EKC in China from 1993 to 2016. The use of renewable energy reduces environmental damage over the long and short term. On the other hand, using fossil fuels intensifies harmful emissions. Largest economies over the period 1990–2015. Using hierarchy, the authors show that GDP and population increase CO2 emissions, while RE decreases CO2 emissions. Moreover, the causes of CO2 emissions in the 50 industrialized nations between 1990 and 2015 are evaluated by de Souza Mendonça et al. (2020). The findings demonstrated employing hierarchy that Renewables reduce CO2 emissions, while Gross Domestic Product and the population gradually increase emissions. By employing the global panel data to examine the link between Economic output, Renewables, and Carbon dioxide emission, Fatima et al. (2021) add to the body of existing literature. The paper demonstrates that Gross domestic product modifies the link between Renewables and Carbon intensity using several analytical techniques. Economic growth also affects non-renewables, which in consequence drives up Carbon dioxide emissions. Awosusi et al. (2022) investigate the connection between globalization, renewables, rental costs, and Carbon intensity in Colombia from 1970 to 2017. The authors demonstrate how globalization and renewables aid in the mitigation of climate change using FMOLS, DOLS, and ARDL. In 73 nations between 1990 and 2019, Dou & Li (2022) look into the connections between eco-innovation, natural gas, and Carbon intensity. The EKC hypothesis is present, according to the regression results, and innovation lowers CO2 levels.
In this article, we consider making the specific instance that before designing effective policies for reducing carbon dioxide (CO2) emissions, it is crucial to thoroughly examine the part played by ecological innovation in the perspective of growing trade openness and foreign direct investment in the overarching cycle of carbon emissions. The proposed article examines the connection between renewable energy consumption, trade openness, foreign direct investment (FDI), and carbon emission based on the continuing discussion regarding eco-innovation and environmental quality. Employing mathematical and statistical methods in comparison, we aimed to investigate the relationship stated. In the beginning, we applied an integrated mathematical grey relational analysis (GRA) model of grey system theory (GST), which comprised the Deng degree of GRA, absolute degree of GRA, and second synthetic degree of GRA. When compared to traditional statistical models, the GRA models offer several benefits. For example, they show improved precision and could produce accurate results even with small samples. In addition, we used a statistical technique called odds ratio estimation (OR) to quantify the strength of the relationship between the dependent and independent factors. When equated to other methods, the mentioned grey methodology is more suitable for producing results that are convincing and help to prevent endogeneity problems. By concentrating on the worst variables in the G-7 regions, the proposed model offers policymakers and decision-makers a valuable tool and a source of extra practical insights to make more effective decisions to minimize air pollution.
The interaction between CO2 emissions, eco-innovation (technical innovation), trade openness, foreign direct investment, and the use of renewable energy for G7 economies was empirically examined in the present work. The carbon emissions (CO2), measured in metric tonnes, were used as the response variable in this investigation. Renewable energy use has been estimated as a % of total final energy consumption, while environmentally friendly technical innovation has been quantified as a % of all technologies. Except for the variable eco-innovation, which was taken from the OECD data repository, the World Bank Indicators website provided data on foreign direct investment, CO2 emissions, trade openness, and the utilization of renewable energy sources. In this analysis, statistics from 1990 to 2019 were analyzed. Table 1 provides adequate information regarding the measurement unit and source of data for the observed variables. To proceed with the analysis, a mathematical and statistical comparison has been conducted. Grey relational analysis was used for a mathematical investigation, integrating with absolute GRA and Deng GRA. In addition, we assessed the ODDS ratios for a conventional statistical analysis to investigate the interactions between the response and explanatory variables. As the subjected methodologies were intended to investigate a one-to-one relationship, there was no need to test for homogeneity, normality, or multicollinearity, whereas the first step in the grey methodology was to normalize the data before moving on to the subsequent analysis.
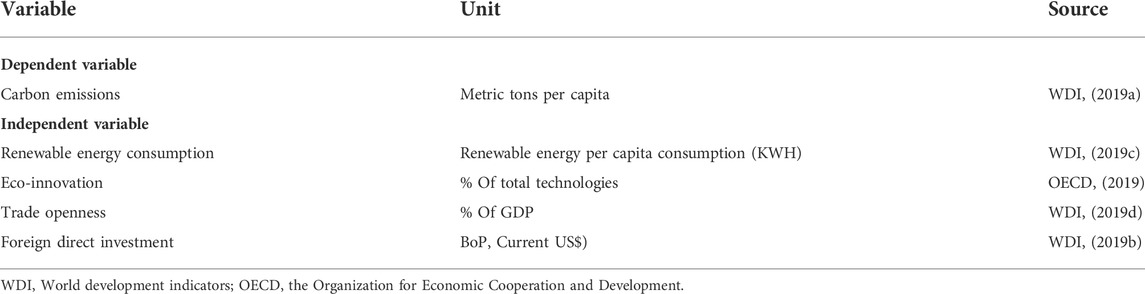
TABLE 1. Description of variables utilized in the study.
GRA methods are one of the fundamental aspects of grey system theory (GST), which was presented in 1982 by Chinese scholar Deng Julong to deal with ambiguous processes with partial information (Ng & Deng, 1995). The basic principle behind grey modeling is that the measure of closeness (or correlation) of the multilateral pattern of a given dataset representing the structural properties, could be used to foresee the closeness of a linkage among system variables. A detailed description of the GRA method can be found in (S. Liu et al., 2011). The incorporation and effective application of grey approaches have been demonstrated in the literature in several scientific disciplines (S. Rehman et al., 2022) (Javed & Liu, 2018) (Mahmoudi et al., 2019) (Javed et al., 2018) (E. Rehman & Rehman, 2022) (Mumtaz et al., 2022). The present investigation is carried out by engaging GRA methodologies. The data series are investigated by engaging GRA methodologies. The GRA models are designed using SPSS (IPCC.2019). Figure 1 depicts the conceptualized GRA paradigm. The accompanying section summarizes the computing algorithms for grey relational models.
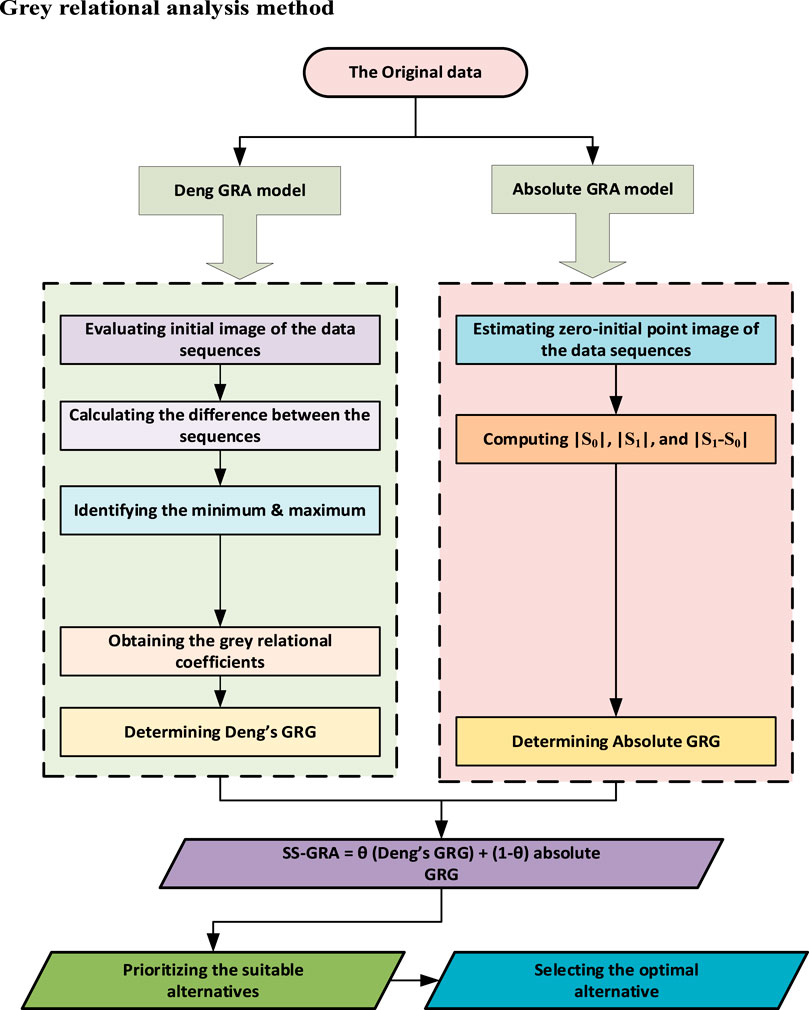
FIGURE 1. The proposed grey methodology framework utilized in the study.
Let
Where,
In this case,
If
Where,
The SSGRA model can be produced by incorporating the given equation.
where
In this investigation, as per Deng-GRA results, Italy (0.8457) has the most elevated influence between renewable energy use and carbon emissions, whilst the most fragile influence is observed for Japan (0.6672) (Table 2). Likewise, the same sequence is generated among the G-7 nations based on the absolute-GRA model findings. Italy (0.8547) acquired the greater measure of association trailed by Canada and Germany based on the results by absolute-GRA. The weakest associations were found in the United States and Japan, with grey relational weights of 0.6988 and 0.6734, respectively. Bodily, the assessment from the SS-GRA model demonstrated that across all G-7 economies, Italy (0.8502) appeared to be the leading country in terms of reducing CO2 emissions through renewable energy consumption, swiftly followed by Canada (0.8031) and Germany (0.7878). The statistical investigation also revealed a similar pattern of sequence, implying that Italy (OR: 17.05 (11.67-27.48)) has a higher odd of minimizing carbon emissions through renewable energy use, while Japan (OR: 1.98 (0.24-2.54)) has the lowest odds ratio with significant p values.

TABLE 2. Mathematical and statistical assessment between CO2 emissions and renewable energy.
An intriguing and insightful ranking gained importance when considering the role of eco-innovation on carbon emissions among the G-7 economies. The adoption of eco-innovation appeared to be more dramatic in the Japanese region (Deng-GRA: 0.9708, absolute-GRA:0.9802, SS-GRA:0.9755), and it was placed foremost in light of the outcomes of all three grey relational models, with comparatively higher strength of correlation. The findings in Table 3 demonstrated that the adoption of eco-innovation is a key predictor of reducing carbon emissions in the Japanese region followed by the UK (Deng-GRA:0.8576, absolute-GRA:0.8504, SS-GRA:0.8540) and France (Deng-GRA:0.8002, absolute-GRA:0.8000, SS-GRA:0.8001). Under all grey models, the US placed seventh and the UK ranked sixth, implying that these countries have the lowest impact among the G-7 nations due to their adoption of eco-innovation and reduction of carbon emissions. On comparing these results with statistical analysis, Japan (OR: 21.32 (16.73-28.91)) sustained its ranking pattern, with higher odds of emissions reduction owing to eco-innovation adoption, followed by the UK (OR: 16.09 (10.25-19.37)) and France (OR: 11.72 (7.65-14.44)). Our findings corroborated some earlier investigations that likewise showed a substantial linkage between adopting eco-innovation and lowering carbon emissions.
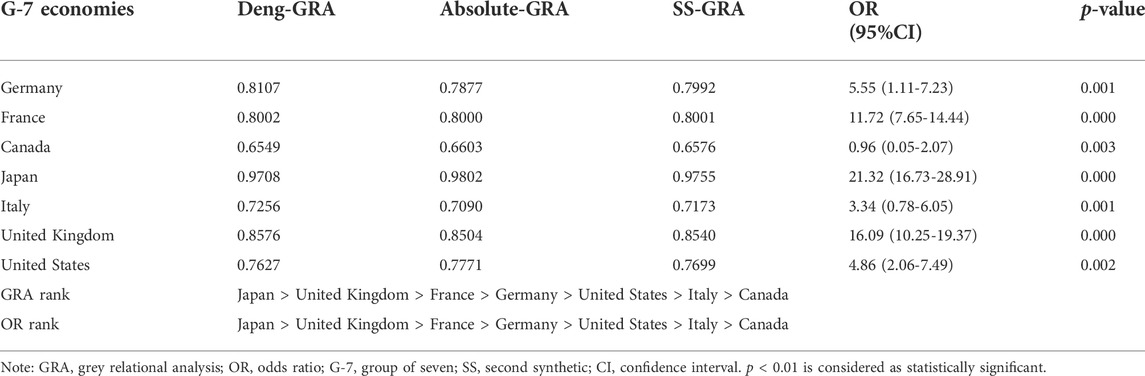
TABLE 3. Mathematical and statistical assessment between carbon emissions and eco-innovation.
Table 4 displays a review of the interactions between carbon emissions and trade openness among G-7 nations using GRA models. As per Deng-GRA estimates, Germany has the maximum impact, with an expected strength of 0.9557, attributable to trade openness being a substantial contribution to minimizing carbon emissions, preceded by Canada (0.8852) and France (0.8796). Considering the estimates determined for absolute-GRA, although the equivalent sequence emerged, the measure of the relationship was showed considerably higher for Germany (0.9645) on comparing with the rest of the G-7 economies. Meanwhile, in a grey relational assessment of trade openness on lowering CO2 emissions among G-7 economies, the US and UK are identified as the less significant nations. Predominantly, the strength of the relationship is considerably more grounded for Germany (SS-GRA:0.9601), suggesting that trade openness has a considerable influence on lowering carbon emissions within this region, led by the US (SS-GRA:0.7328) and UK (SS-GRA:0.8606). On comparing these results with odds ratios, a slightly distinct pattern is ascertained for the economies under investigation. With a slight change in estimations, France and the UK switched their positions. The United Kingdom (OR:5.75, 95% CI (1.99-7.07)) has higher odds of lowering carbon emissions attributable to trade openness, however, France (OR:5.66; 95% CI (2.21-8.03)) has lower odds when compared with the rest of the economies.
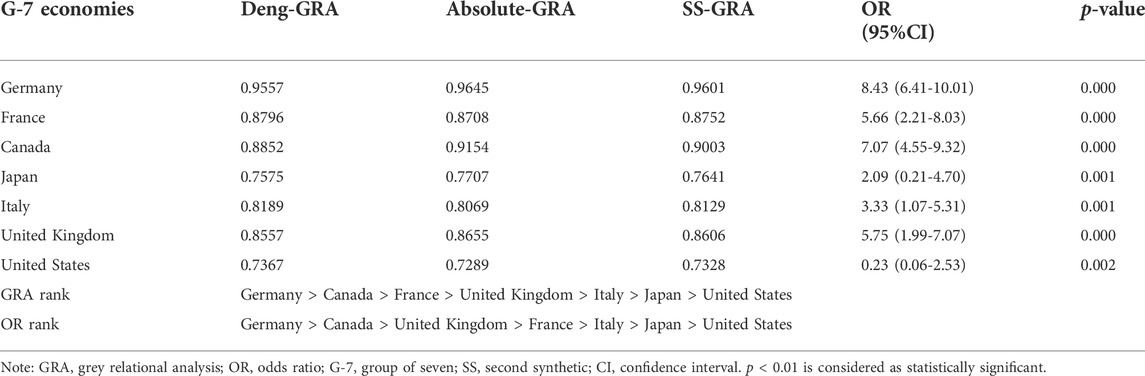
TABLE 4. Mathematical and statistical assessment between carbon emissions and trade openness.
Moreover, in accordance with the Deng-GRA model result, the Canadian nation (0.9342) has a better measure of influence between foreign direct investment and carbon emissions, whilst the United Kingdom (0.5822) has the most fragile level of influence. The stronger impact estimate of foreign direct investment on reducing carbon dioxide emissions in Canada demonstrates that the two are intrinsically connected. A relatively similar sequence appeared again in the findings of the absolute-GRA model, albeit with more intensity. The level of interaction for decreasing carbon emissions against FDI is substantially higher in the case of Canada, with an approximated grey significance of 0.9406. At a broader level, FDI is viewed as the primary contributor to reducing emissions in the Canadian region, based on the findings estimated from the SS-GRA model. The higher the degree of association between FDI and carbon emissions, the more closely those variables are related (Table 5). After Canada, France (0.9366) appeared to be more significant in reducing its carbon emission due to FDI with an approximated grey score of 0.9366 and placed 2nd, pursued by Italy (0.8653) and Germany (0.8212) with moderately less strength. A slightly different sequence appeared when we computed odds ratios for the selected variables to examine the associations. France and Canada altered their ranking order with only a smidgeon difference of 0.78. France appeared with a slightly higher odds of decreasing CO2 emissions attributable to FDI (OR:8.27, p < 0.000) when compared with Canada (OR:22.90, p < 0.000).
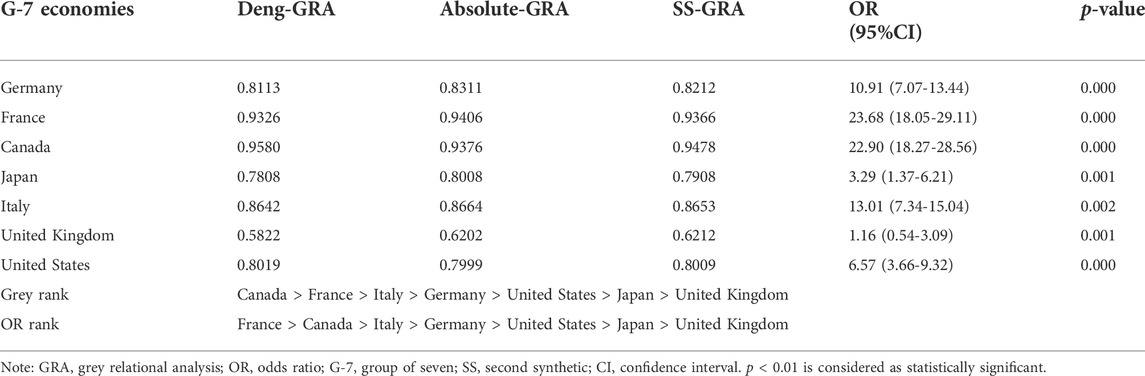
TABLE 5. Mathematical and statistical assessment between carbon emissions and FDI.
FDI has a considerable impact on carbon emissions, implying that FDI in France and Canada is more ecologically beneficial than in the rest of the G-7 economies. In this case, previous research contradicts each other, with some claiming that FDI has a favorable impact on environmental quality and others claiming that it has a negative impact.
We also compared our outcomes to those of the SS-GRA model using odd ratios. It can be noticed that the patterns achieved by the two methods are relatively identical. Their respective strengths, however, are the fundamental point of distinction. Despite the range of GRA models and odd ratios are not the same, their judgments can be contrasted as both ranges allow the decision-maker to assess whether the interaction is frail, significant, or extremely significant. Table 6 shows the ranking sequences of G-7 economies based on mathematical and statistical analyses for better interpretation of the results.
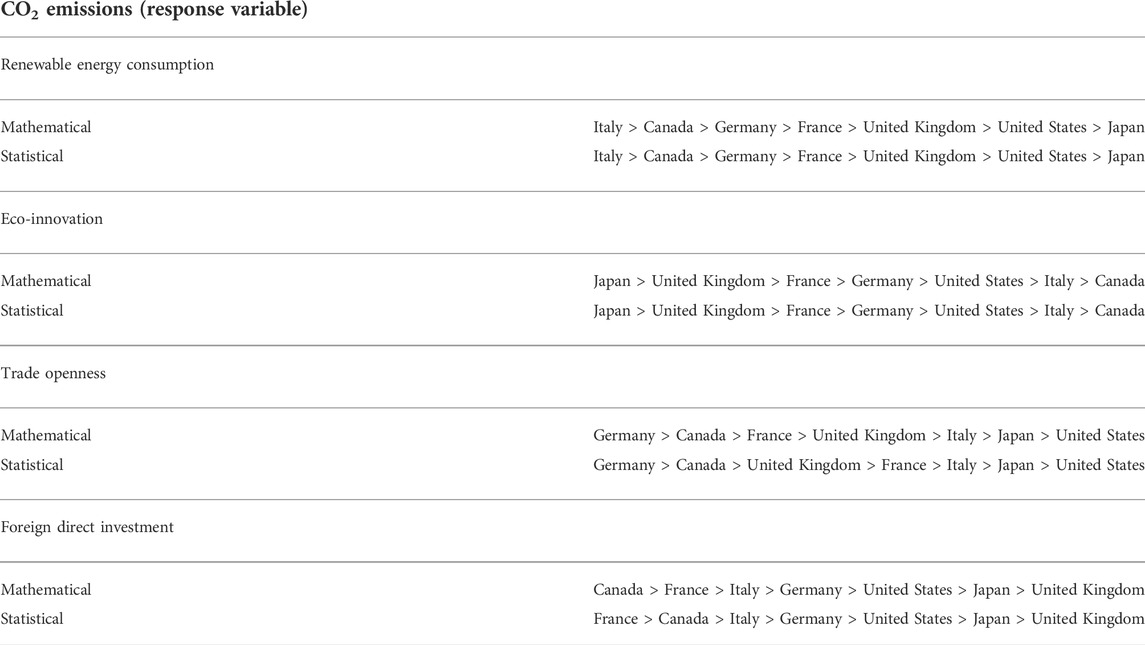
TABLE 6. Ranking sequence based on mathematical and statistical analysis.
For the period 1990-2019, this research preliminary examines the impacts of renewable energy usage, eco-innovation, trade openness, and FDI on CO2 emissions in G-7 economies. The relationship between the determinants listed above is thoroughly documented in the environmental literature, however, evidence on the individual and comparative effects of countries is scarce. To examine the individual impacts and their relative intensities among the studied nations, a multicriteria decision-making approach is implemented. To achieve the aforementioned objectives, we adopted two ways to investigate the interactions within variables across the studied economies: an advanced mathematical grey relational methodology and a statistical technique named Odds ratios. According to GRA outcomes, Japan claimed to be a prospective nation among G-7 economies in minimizing its carbon dioxide emissions due to eco-innovation, whereas renewable energy utilization is considered to be more striking in decreasing carbon emissions in Italy. Furthermore, Germany was revealed to be more potent as a result of trade openness while Canada appeared to be influential due to the FDI variable. In the current investigation, we implemented three grey relational models (Deng GRA, absolute GRA, and SS-GRA models), which might potentially replace conventional data analysis techniques. The estimated statistics confirmed the suitability and effectiveness of the grey relational model technique.
Renewable energy use plays a crucial role in abating CO2 emissions and improving environmental quality (Fareed et al., 2016). The linkage between renewable energy consumption and CO2 emissions emerged to be stronger in Italy than in other G-7 economies, implying that G-7 governments must adopt the use of renewables for a sustainable future. These figures are consistent with earlier research that found significant inverse relationships between the use of green energy and carbon emissions (S. Rehman et al., 2022) (Dong et al., 2020) (E. Rehman et al., 2020).
Eco-innovation has a significant influence on reducing carbon emissions in Japan, according to the current figures. This evidence speculated that eco-innovation may benefit Japan more than the other G-7 economies by significantly reducing pollution emissions or curbing the strain on natural resources. Eco-innovation is a key indicator of ecologically sustainable growth, energy efficiency, and climate variability, as evidenced by the growth of the industry for eco-services and eco-goods related to the environment over the last few decades (M. Li et al., 2021) (Shahzad et al., 2021). However, our findings are in accordance with prior empirical studies that found a significant negative linkage between eco-innovation and total carbon dioxide emissions (consumption and production-based). Among such investigations are BRICS (Razzaq et al., 2021), OECD (Puertas & Marti, 2021), China (Wang et al., 2020), the United States (Sun et al., 2021), France (Ding et al., 2021), and India (Tao et al., 2021). Therefore, rather than focusing on economic determinants, liable and innovative conduct towards ecological parameters could be more advantageous in strengthening environmental sustainability.
Trade openness is found strongly and significantly associated with carbon emissions in Germany as compared to other regions of G-7 economies which reveals that trade openness is an environmentally friendly indicator. This empirical finding is consistent with a range of investigations in the existing literature (Ibrahim & Ajide, 2021), (Shahbaz et al., 2019), (Mutascu, 2018), and (Hdom & Fuinhas, 2020). The argument that trade openness enhances environmental quality can be substantiated by the fact that the technique effect outweighs the scale effect (Shahbaz et al., 2013) (Ferrantino, 1997) (M. Li et al., 2021). We could make the argument that the scale effect arises when an economy moves from a developing to a developed phase, implying trade liberalization, which enhances exports and, by extension, economic expansion. Alternatively, trade liberalization alters an economy’s industrial hierarchy, while the technique effect encourages economies to adopt more efficacious and cleaner technologies (Ahmad et al., 2021). Therefore, the availability of comparative advancements in ecologically clean sectors and breakthroughs in fuel efficiency can validate the net impact of abating CO2 emissions (Lorente & Álvarez-Herranz, 2016) (Shahbaz et al., 2013) (D B Lorente & Alvarez-Herranz, 2016). Lately, Shahbaz et al. assessed the impact of trade openness on environmental quality over the 1980-2014 period employing data from low, middle, and high-income nations. They determined that trade openness is first positively correlated with carbon emissions and that at a certain level, this association inevitably falls, a phenomenon known as the EKC effect (Shahbaz et al., 2017) (Hashmi et al., 2021).
FDI tended to be more remarkable in Canada than in the other G-7 economies, as per the empirical findings. In most environmental literature, the elasticity of carbon emissions to FDI is found positive in the region of Canada. Existing empirical studies on the impact of FDI on the environment are contradictory. FDI has two main effects on the environment. It may cause substantial environmental damage in host countries, worsening their environment. On the contrary, it may incorporate more environmentally friendly technologies and management procedures to help host nations enhance their environmental quality. The G-7 economies should stimulate FDI inflows, specifically in technology-intensive and environmentally friendly businesses, and capture the possible negative impact of pollution-intensive FDI inflows on the environment, in order to improve environmental quality (Hashmi et al., 2021) (Hashmi et al., 2021).
Henceforth, it is reasonable to conclude that the factor of eco-innovation contributes more to the transition of the economies to sustainable energy resources, thus abating CO2 emissions. The country-specific findings demonstrate that renewable energy use, ecological innovation, trade openness, and FDI are key drivers of environmental quality improvement in G-7 economies. Among the parameters investigated, the coefficient of eco-innovation has a strong and considerable influence in Japan when compared to the other G-7 economies. This signifies that by implementing economic modalities that promote green innovation in economic processes, CO2 emissions can indeed be lowered and environmental quality can be improved. These findings suggest that ecological innovation is the optimum determinant in making significant advancements in sustainable development, whether by limiting the ecologic impacts of production modes, improving nature’s resilience to environmental stressors, or attaining a more productive and liable use of natural resources. These facts are in agreement with those published previously by Doğan et al. (2022) (Doğan et al., 2022) and X. Ji. et al. (Ji et al., 2021).
The empirical facts offer a few compelling policy implications. Initially, the study discovered eco-innovation as a key abating component of environmental degradation among others. Therefore, it is imperative to spend on green technologies to minimize environmental deterioration and to explore innovative ways of energy usage to enhance environmental quality. Policy-makers must concentrate on various legislative proposals, in particular, to be rational in their endeavors in adopting renewable energy resources. Multiple streams of renewable energy should be encouraged by the G-7 governments in both the residence and business sectors. They should also concentrate on public-private cooperation to raise citizens’ knowledge of environmentally friendly activities. This goal can be achieved through the use of social and mass media.
Furthermore, the G-7 governments must develop policies to encourage households and businesses to embrace eco-innovation by lowering interest rates on energy-efficient purchases, which will serve to enhance the positive impact of FDI on renewable energy consumption. Residential, commercial, and industrial users should be able to get financing for solar energy installation at a cheaper interest rate from the G-7 economies and the financial sector, as this will speed up the transition from NRE to RE consumption. The G-7 economies should also minimize non-renewable energy subsidies while providing tax relief for renewable energy to help expedite the transition from NREC to REC.
Future research should dig into the combined effects of all renewable energy sources to identify which one contributes the most to improving environmental quality. For comparison purposes, the impact of each fossil fuel should be investigated, separately. In this instance, multicriteria decision analysis can particularly be advantageous.
The data used to support the findings of this study are included within the article.
All authors listed have made a substantial, direct, and intellectual contribution to the work and approved it for publication.
The authors declare that the research was conducted in the absence of any commercial or financial relationships that could be construed as a potential conflict of interest.
All claims expressed in this article are solely those of the authors and do not necessarily represent those of their affiliated organizations, or those of the publisher, the editors and the reviewers. Any product that may be evaluated in this article, or claim that may be made by its manufacturer, is not guaranteed or endorsed by the publisher.
Adebayo, T. S., Awosusi, A. A., Kirikkaleli, D., Akinsola, G. D., and Mwamba, M. N. (2021). Can CO2 emissions and energy consumption determine the economic performance of South Korea? A time series analysis. Environ. Sci. Pollut. Res. 28 (29), 38969–38984. doi:10.1007/s11356-021-13498-1
Adebayo, T. S., Rjoub, H., Akinsola, G. D., and Oladipupo, S. D. (2022). The asymmetric effects of renewable energy consumption and trade openness on carbon emissions in Sweden: New evidence from quantile-on-quantile regression approach. Environ. Sci. Pollut. Res. 29 (2), 1875–1886. doi:10.1007/s11356-021-15706-4
Ahmad, Manzoor, Khan, Z., Rahman, Z. U., Khattak, S. I., and Khan, Z. U. (2021). Can innovation shocks determine CO2 emissions (CO2e) in the OECD economies? A new perspective. Econ. Innovation New Technol. 30 (1), 89–109. doi:10.1080/10438599.2019.1684643
Ahmad, Munir, Li, H., Anser, M. K., Rehman, A., Fareed, Z., Yan, Q., et al. (2021). Are the intensity of energy use, land agglomeration, CO2 emissions, and economic progress dynamically interlinked across development levels? Energy & Environ. 32 (4), 690–721. doi:10.1177/0958305x20949471
Ali, S., Yusop, Z., Kaliappan, S. R., and Chin, L. (2020). Dynamic common correlated effects of trade openness, FDI, and institutional performance on environmental quality: Evidence from OIC countries. Environ. Sci. Pollut. Res. 27 (11), 11671–11682. doi:10.1007/s11356-020-07768-7
Álvarez-Herránz, A., Balsalobre, D., Cantos, J. M., and Shahbaz, M. (2017). Energy innovations-GHG emissions nexus: Fresh empirical evidence from OECD countries. Energy Policy 101, 90–100. doi:10.1016/j.enpol.2016.11.030
Arif, U., Arif, A., and Khan, F. N. (2022). Environmental impacts of FDI: Evidence from heterogeneous panel methods. Environ. Sci. Pollut. Res. 29 (16), 23639–23649. doi:10.1007/s11356-021-17629-6
Awosusi, A. A., Adebayo, T. S., Altuntaş, M., Agyekum, E. B., Zawbaa, H. M., and Kamel, S. (2022). The dynamic impact of biomass and natural resources on ecological footprint in BRICS economies: A quantile regression evidence. Energy Rep. 8, 1979–1994. doi:10.1016/j.egyr.2022.01.022
Bilan, Y., Streimikiene, D., Vasylieva, T., Lyulyov, O., Pimonenko, T., and Pavlyk, A. (2019). Linking between renewable energy, CO2 emissions, and economic growth: Challenges for candidates and potential candidates for the EU membership. Sustainability 11 (6), 1528. doi:10.3390/su11061528
Cagno, E., Ramirez-Portilla, A., and Trianni, A. (2015). Linking energy efficiency and innovation practices: Empirical evidence from the foundry sector. Energy Policy 83, 240–256. doi:10.1016/j.enpol.2015.02.023
Chen, Y., Wang, Z., and Zhong, Z. (2019). CO2 emissions, economic growth, renewable and non-renewable energy production and foreign trade in China. Renew. Energy 131, 208–216. doi:10.1016/J.RENENE.2018.07.047
de Souza Mendonça, A. K., Barni, G. de A. C., Moro, M. F., Bornia, A. C., Kupek, E., and Fernandes, L. (2020). Hierarchical modeling of the 50 largest economies to verify the impact of GDP, population and renewable energy generation in CO2 emissions. Sustain. Prod. Consum. 22, 58–67. doi:10.1016/j.spc.2020.02.001
Destek, M. A., and Sinha, A. (2020). Renewable, non-renewable energy consumption, economic growth, trade openness and ecological footprint: Evidence from organisation for economic Co-operation and development countries. J. Clean. Prod. 242, 118537. doi:10.1016/j.jclepro.2019.118537
Ding, Q., Khattak, S. I., and Ahmad, M. (2021). Towards sustainable production and consumption: Assessing the impact of energy productivity and eco-innovation on consumption-based carbon dioxide emissions (CCO2) in G-7 nations. Sustain. Prod. Consum. 27, 254–268. doi:10.1016/j.spc.2020.11.004
Doğan, B., Ghosh, S., Hoang, D. P., and Chu, L. K. (2022). Are economic complexity and eco-innovation mutually exclusive to control energy demand and environmental quality in E7 and G7 countries? Technol. Soc. 68, 101867. doi:10.1016/j.techsoc.2022.101867
Dong, K., Dong, X., and Jiang, Q. (2020). How renewable energy consumption lower global CO2 emissions? Evidence from countries with different income levels. World Econ. 43 (6), 1665–1698. doi:10.1111/twec.12898
Dong, K., Sun, R., Li, H., and Liao, H. (2018). Does natural gas consumption mitigate CO2 emissions: Testing the environmental Kuznets curve hypothesis for 14 Asia-Pacific countries. Renew. Sustain. Energy Rev. 94, 419–429. doi:10.1016/j.rser.2018.06.026
Dou, D., and Li, L. (2022). Does sustainable financial inclusion and energy efficiency ensure green environment? Evidence from B.R.I.C.S. Countries. Econ. Research-Ekonomska Istraz. 19, 1–16. doi:10.1080/1331677X.2022.2032785
Fahad, S., Bai, D., Liu, L., and Baloch, Z. A. (2022). Heterogeneous impacts of environmental regulation on foreign direct investment: Do environmental regulation affect FDI decisions? Environ. Sci. Pollut. Res. 29 (4), 5092–5104. doi:10.1007/s11356-021-15277-4
Fan, J. L., Da, Y. Bin, Wan, S. L., Zhang, M., Cao, Z., Wang, Y., et al. (2019). Determinants of carbon emissions in ‘belt and road initiative’ countries: A production technology perspective. Appl. Energy 239, 268–279. doi:10.1016/j.apenergy.2019.01.201
Fareed, Z., Ali, Z., Shahzad, F., Nazir, M. I., and Ullah, A. (2016). Determinants of profitability: Evidence from power and energy sector. Stud. Univ. Babe-Bolyai Oeconomica 61 (3), 59–78. doi:10.1515/subboec-2016-0005
Fatima, T., Shahzad, U., and Cui, L. (2021). Renewable and nonrenewable energy consumption, trade and CO2 emissions in high emitter countries: Does the income level matter? J. Environ. Plan. Manag. 64 (7), 1227–1251. doi:10.1080/09640568.2020.1816532
Ferrantino, M. J. (1997). International trade, environmental quality and public policy. World Econ. 20 (1), 43–72. doi:10.1111/1467-9701.00057
Hashmi, S. H., Fan, H., Fareed, Z., and Shahzad, F. (2021). Asymmetric nexus between urban agglomerations and environmental pollution in top ten urban agglomerated countries using quantile methods. Environ. Sci. Pollut. Res. 28 (11), 13404–13424. doi:10.1007/s11356-020-10669-4
Hdom, H. A. D., and Fuinhas, J. A. (2020). Energy production and trade openness: Assessing economic growth, CO2 emissions and the applicability of the cointegration analysis. Energy Strategy Rev. 30, 100488. doi:10.1016/j.esr.2020.100488
Hodson, E. L., Brown, M., Cohen, S., Showalter, S., Wise, M., Wood, F., et al. (2018). U.S. energy sector impacts of technology innovation, fuel price, and electric sector CO2 policy: Results from the EMF 32 model intercomparison study. Energy Econ. 73, 352–370. doi:10.1016/j.eneco.2018.03.027
Ibrahim, R. L., and Ajide, K. B. (2021). Nonrenewable and renewable energy consumption, trade openness, and environmental quality in G-7 countries: The conditional role of technological progress. Environ. Sci. Pollut. Res. 28 (33), 45212–45229. doi:10.1007/s11356-021-13926-2
International Energy Agency (2015). World energy outlook special report: Energy and climate change. IEA. 1–30. doi:10.1038/479267b
IPCC (2019). Climate change and land: An IPCC special report. Clim. Change Land IPCC Special Rep. Clim. Change, Desertification, Land Degrad. Sustain. Land Manag. Food Secur. Greenh. Gas Fluxes Terr. Ecosyst., 1–30.
Javed, S. A., and Liu, S. (2018). Evaluation of outpatient satisfaction and service quality of Pakistani healthcare projects: Application of a novel synthetic grey incidence analysis model. Grey Syst. Theory Appl. 8 (4), 462–480. doi:10.1108/gs-04-2018-0018
Javed, S. A., Mahmoudi, A., Khan, A. M., Javed, S., and Liu, S. (2018). A critical review: Shape optimization of welded plate heat exchangers based on grey correlation theory. Appl. Therm. Eng. 144, 593–599. doi:10.1016/j.applthermaleng.2018.08.086
Ji, X., Umar, M., Ali, S., Ali, W., Tang, K., and Khan, Z. (2021). Does fiscal decentralization and eco‐innovation promote sustainable environment? A case study of selected fiscally decentralized countries. Sustain. Dev. 29 (1), 79–88. doi:10.1002/sd.2132
Kalyon, A., Günay, M., and Özyürek, D. (2018). Application of grey relational analysis based on Taguchi method for optimizing machining parameters in hard turning of high chrome cast iron. Adv. Manuf. 6 (4), 419–429. doi:10.1007/s40436-018-0231-z
Khan, A., Hussain, J., Bano, S., and Chenggang, Y. (2020). The repercussions of foreign direct investment, renewable energy and health expenditure on environmental decay? An econometric analysis of B&RI countries. J. Environ. Plan. Manag. 63 (11), 1965–1986. doi:10.1080/09640568.2019.1692796
Khan, H., Weili, L., and Khan, I. (2022). Environmental innovation, trade openness and quality institutions: An integrated investigation about environmental sustainability. Environ. Dev. Sustain. 24 (3), 3832–3862. doi:10.1007/s10668-021-01590-y
Khan, M. A., and Ozturk, I. (2020). Examining foreign direct investment and environmental pollution linkage in Asia. Environ. Sci. Pollut. Res. 27 (7), 7244–7255. doi:10.1007/s11356-019-07387-x
Kirikkaleli, D., and Adebayo, T. S. (2021). Do public-private partnerships in energy and renewable energy consumption matter for consumption-based carbon dioxide emissions in India? Environ. Sci. Pollut. Res. Int. 28, 30139–30152. doi:10.1007/S11356-021-12692-5
Kraaijenbrink, P. D. A., Bierkens, M. F. P., Lutz, A. F., and Immerzeel, W. W. (2017). Impact of a global temperature rise of 1.5 degrees Celsius on Asia’s glaciers. Nature 549 (7671), 257–260. doi:10.1038/nature23878
Li, B., and Haneklaus, N. (2022). Reducing CO2 emissions in G7 countries: The role of clean energy consumption, trade openness and urbanization. Energy Rep. 8, 704–713. doi:10.1016/j.egyr.2022.01.238
Li, M., Ahmad, M., Fareed, Z., Hassan, T., and Kirikkaleli, D. (2021). Role of trade openness, export diversification, and renewable electricity output in realizing carbon neutrality dream of China. J. Environ. Manag. 297, 113419. doi:10.1016/j.jenvman.2021.113419
Liu, S., Xie, N., and Forrest, J. (2011). Novel models of grey relational analysis based on visual angle of similarity and nearness. Grey Syst. Theory Appl. 1, 2043. doi:10.1108/20439371111106696
Liu, Y., Sadiq, F., Ali, W., and Kumail, T. (2022). Does tourism development, energy consumption, trade openness and economic growth matters for ecological footprint: Testing the Environmental Kuznets Curve and pollution haven hypothesis for Pakistan. Energy 245, 123208. doi:10.1016/j.energy.2022.123208
Lorente, D. B., and Alvarez-Herranz, A. (2016). An approach to the effect of energy innovation on environmental kuznets curve: An introduction to inflection point. Bull. Energy Econ. 4 (3), 224–233.
Lorente, Daniel Balsalobre, and Álvarez-Herranz, A. (2016). Economic growth and energy regulation in the environmental Kuznets curve. Environ. Sci. Pollut. Res. 23 (16), 16478–16494. doi:10.1007/s11356-016-6773-3
Mahmoudi, A., Javed, S. A., Zhang, Z., and Deng, X. (2019). IEEE 14th international Conference on intelligent Systems and knowledge engineering (ISKE), 2019, 189–195.Grey group QUALIFLEX method: Application in project management
Manta, A. G., Florea, N. M., Bădîrcea, R. M., Popescu, J., Cîrciumaru, D., and Doran, M. D. (2020). The nexus between carbon emissions, energy use, economic growth and financial development: Evidence from central and eastern European countries. Sustainability 12 (18), 7747. doi:10.3390/su12187747
Mumtaz, A., Rehman, E., Rehman, S., and Hussain, I. (2022). Impact of environmental degradation on human health: An assessment using multicriteria decision making. Front. Public Health 9, 812743. doi:10.3389/fpubh.2021.812743
Murshed, M. (2020). An empirical analysis of the non-linear impacts of ICT-trade openness on renewable energy transition, energy efficiency, clean cooking fuel access and environmental sustainability in South Asia. Environ. Sci. Pollut. Res. 27 (29), 36254–36281. doi:10.1007/S11356-020-09497-3
Murshed, M., Saboori, B., Madaleno, M., Wang, H., and Doğan, B. (2022). Exploring the nexuses between nuclear energy, renewable energy, and carbon dioxide emissions: The role of economic complexity in the G7 countries. Renew. Energy 190, 664–674. doi:10.1016/j.renene.2022.03.121
Mushta, A., Chen, Z., Ud Din, N., Ahmad, B., and Zhang, X. (2020). Income inequality, innovation and carbon emission: Perspectives on sustainable growth. Econ. Research-Ekonomska Istraživanja 33 (1), 769–787. doi:10.1080/1331677x.2020.1734855
Mutascu, M. (2018). A time-frequency analysis of trade openness and CO2 emissions in France. Energy Policy 115, 443–455. doi:10.1016/j.enpol.2018.01.034
Ng, D. K. W., and Deng, J. (1995). Contrasting grey system theory to probability and fuzzy. SIGICE Bull. 20 (3), 3–9. doi:10.1145/202081.202082
Puertas, R., and Marti, L. (2021). Eco-innovation and determinants of GHG emissions in OECD countries. J. Clean. Prod. 319, 128739. doi:10.1016/j.jclepro.2021.128739
Razzaq, A., Wang, Y., Chupradit, S., Suksatan, W., and Shahzad, F. (2021). Asymmetric inter-linkages between green technology innovation and consumption-based carbon emissions in BRICS countries using quantile-on-quantile framework. Technol. Soc. 66, 101656. doi:10.1016/j.techsoc.2021.101656
Rehman, E., Ikram, M., Feng, M. T., and Rehman, S. (2020). Sectoral-based CO2 emissions of Pakistan: A novel grey relation analysis (GRA) approach. Environ. Sci. Pollut. Res. 27 (23), 29118–29129. doi:10.1007/s11356-020-09237-7
Rehman, E., and Rehman, S. (2022). Modeling the nexus between carbon emissions, urbanization, population growth, energy consumption, and economic development in Asia: Evidence from grey relational analysis. Energy Rep. 8, 5430–5442. doi:10.1016/j.egyr.2022.03.179
Rehman, S., Rehman, E., Mumtaz, A., and Jianglin, Z. (2022). A multicriteria decision-making approach in exploring the nexus between wind and solar energy generation, economic development, fossil fuel consumption, and CO2 emissions. Front. Environ. Sci. 659, 9. doi:10.3389/fenvs.2021.819384
Ren, S., Yin, H., and Chen, X. H. (2014). Using LMDI to analyze the decoupling of carbon dioxide emissions by China’s manufacturing industry. Environ. Dev. 9 (1), 61–75. doi:10.1016/j.envdev.2013.11.003
Shahbaz, M., Balsalobre, D., and Shahzad, S. J. H. (2019). The influencing factors of CO2 emissions and the role of biomass energy consumption: Statistical experience from G-7 countries. Environ. Model. Assess. (Dordr). 24 (2), 143–161. doi:10.1007/s10666-018-9620-8
Shahbaz, M., Nasreen, S., Ahmed, K., and Hammoudeh, S. (2017). Trade openness–carbon emissions nexus: The importance of turning points of trade openness for country panels. Energy Econ. 61, 221–232. doi:10.1016/j.eneco.2016.11.008
Shahbaz, M., Tiwari, A. K., and Nasir, M. (2013). The effects of financial development, economic growth, coal consumption and trade openness on CO2 emissions in South Africa. Energy Policy 61, 1452–1459. doi:10.1016/j.enpol.2013.07.006
Shahzad, U., Fareed, Z., Shahzad, F., and Shahzad, K. (2021). Investigating the nexus between economic complexity, energy consumption and ecological footprint for the United States: New insights from quantile methods. J. Clean. Prod. 279, 123806. doi:10.1016/j.jclepro.2020.123806
Sun, Y., Yesilada, F., Andlib, Z., and Ajaz, T. (2021). The role of eco-innovation and globalization towards carbon neutrality in the USA. J. Environ. Manag. 299, 113568. doi:10.1016/j.jenvman.2021.113568
Tao, R., Umar, M., Naseer, A., and Razi, U. (2021). The dynamic effect of eco-innovation and environmental taxes on carbon neutrality target in emerging seven (E7) economies. J. Environ. Manag. 299, 113525. doi:10.1016/j.jenvman.2021.113525
United Nations Climate Change (2021). United nations framework convention on climate change. Int. J. Empir. Educ. Res., 1–63.
Usman, M., Kousar, R., Makhdum, M. S. A., Yaseen, M. R., and Nadeem, A. M. (2022). An insight based on ARDL bound testing approach.Do financial development, economic growth, energy consumption, and trade openness contribute to increase carbon emission in Pakistan?, Environ. Dev. Sustain., 1–30. doi:10.1007/s10668-021-02062-z
Wang, W., Li, Y., Lu, N., Wang, D., Jiang, H., and Zhang, C. (2020). Does increasing carbon emissions lead to accelerated eco-innovation? Empirical evidence from China. J. Clean. Prod. 251, 119690. doi:10.1016/j.jclepro.2019.119690
WDI (2019a). CO2 emissions. Available at: https://data.worldbank.org/indicator/EN.ATM.CO2E.KT?most_recent_year_desc=true.
WDI (2019b). Foreign direct investment, net flows (BoP, current US$). Available at: https://data.worldbank.org/indicator/BX.KLT.DINV.CD.WD?most_recent_year_desc=true.
WDI (2019c). Renewable Energy Consumption (% of total final energy consumption). Available at: https://data.worldbank.org/indicator/EG.FEC.RNEW.ZS?view=chart.
WDI (2019d). Trade openess (% of GDP). Available at: https://data.worldbank.org/indicator/NE.TRD.GNFS.ZS.
Wu, L.-F., Liu, S.-F., Cui, W., Liu, D.-L., and Yao, T.-X. (2014). Non-homogenous discrete grey model with fractional-order accumulation. Neural comput. Appl. 25 (5), 1215–1221. doi:10.1007/s00521-014-1605-1
Xu, D., Sheraz, M., Hassan, A., Sinha, A., and Ullah, S. (2022). Financial development, renewable energy and CO2 emission in G7 countries: New evidence from non-linear and asymmetric analysis. Energy Econ. 109, 105994. doi:10.1016/j.eneco.2022.105994
Yamaguchi, D., Li, G.-D., and Nagai, M. (2007). Verification of effectiveness for grey relational analysis models. J. Grey Syst. 10 (3), 169–181.
Keywords: eco-innovation, CO2, renewable energy, foreign direct investment, trade openness, grey mathematical modeling
Citation: Rehman E, Rehman S, Mumtaz A, Jianglin Z and Shahiman MA (2022) The influencing factors of CO2 emissions and the adoption of eco-innovation across G-7 economies: A novel hybrid mathematical and statistical approach. Front. Environ. Sci. 10:988921. doi: 10.3389/fenvs.2022.988921
Received: 07 July 2022; Accepted: 29 August 2022;
Published: 29 September 2022.
Edited by:
Zeeshan Fareed, Huzhou University, ChinaReviewed by:
Alam Rehman, National University of Modern Languages, PakistanCopyright © 2022 Rehman, Rehman, Mumtaz, Jianglin and Shahiman. This is an open-access article distributed under the terms of the Creative Commons Attribution License (CC BY). The use, distribution or reproduction in other forums is permitted, provided the original author(s) and the copyright owner(s) are credited and that the original publication in this journal is cited, in accordance with accepted academic practice. No use, distribution or reproduction is permitted which does not comply with these terms.
*Correspondence: Shazia Rehman, cmVobWFuc2hhemlhLm1hbGlrQGdtYWlsLmNvbQ==
Disclaimer: All claims expressed in this article are solely those of the authors and do not necessarily represent those of their affiliated organizations, or those of the publisher, the editors and the reviewers. Any product that may be evaluated in this article or claim that may be made by its manufacturer is not guaranteed or endorsed by the publisher.
Research integrity at Frontiers
Learn more about the work of our research integrity team to safeguard the quality of each article we publish.