 Sergey N. Vorobyev1
 Oleg S. Pokrovsky
 Mikhail Korets
 Liudmila S. Shirokova
94% of researchers rate our articles as excellent or good
Learn more about the work of our research integrity team to safeguard the quality of each article we publish.
Find out more
ORIGINAL RESEARCH article
Front. Environ. Sci. , 01 December 2022
Sec. Biogeochemical Dynamics
Volume 10 - 2022 | https://doi.org/10.3389/fenvs.2022.987596
Mobilization of dissolved organic carbon (DOC) and CO2 from the frozen peat to surface waters in the permafrost zone of high latitude regions is expected to enhance under on-going permafrost thaw and active layer thickness deepening. Here we explored one of the most remote, pristine, unregulated and yet environmentally important rivers in western Siberia (Taz). This subarctic river drains through forested and tundra peat bogs over a gradient of permafrost and climate and likely acts as an important conduit of CO2 to the atmosphere and carbon and nutrient exporter to the Arctic Ocean. In a snapshot study during end of spring flood–beginning of summer baseflow (July 2019), we monitored daytime CO2 and CH4 concentrations and measured CO2 emissions using floating chambers in the main stem (700 km from the upper reaches to the mouth) and 16 main tributaries and we also assessed day/night variations in the emissions. We further tested the impact of land cover parameters of the watershed and tributaries. Based on regular monitoring of the terminal (gauging) station, we quantified the C export to the Arctic Ocean during the study period. We revealed sizable CO2 emissions from the main stem and tributaries (1.0 ± 0.4 and 1.8 ± 0.6 g C-CO2 m−2 d−1, respectively). The CO2 concentrations positively correlated with dissolved organic carbon (DOC), whereas the CH4 concentrations could be partially controlled by dissolved nutrients (N, P) and proportion of light coniferous forest at the watershed. The overall C emission from the water surfaces (4,845 km2) of the Taz basin (150,000 km2) during open water period (6 months, May to October) was estimated as 0.92 Tg C (>99.5% C-CO2, <0.5% C-CH4) which is twice higher than the total dissolved C (organic and inorganic) riverine export flux during the same period. Applying a “substituting space for time” approach for northern and southern parts of the river basin, we suggest that the current riverine CO2 emission may increase 2 to 3 fold in the next decades due to on-going climate warming and permafrost thaw. When integrating the obtained results into global models of C and biogeochemical cycle in the Arctic and subarctic region, the use of the Taz River as a representative example of continental planes should help to estimate the consequences of frozen peatland thaw on CO2 cycle in the Arctic and subarctic regions.
A major challenge of our time is to understand and predict the effects of climate change on sources and sinks of greenhouse gases (GHG) in pristine aquatic ecosystems. Subarctic and Arctic regions are of special interest to future climate change scenarios, as temperature and precipitation are predicted to change strongly at high latitudes and influence ecosystems thus providing a feedback onto the climate system (Mack et al., 2021). One such critical feedback involves GHG production and evasion from streams and rivers (Raymond et al., 2007; Butman and Raymond, 2011; Hotchkiss et al., 2015; Lauerwald et al., 2015; Luo et al., 2019; Ni et al., 2019). This recognition has motivated research aimed at understanding climate impacts on the sources and sinks of GHG in high latitude inland waters (Campeau and del Giorgio, 2014; Hutchins et al., 2019; Zolkos et al., 2019; Dean et al., 2020). Of these numerous studies, only a few were conducted in the permafrost-affected rivers, typically at the scale of small watersheds (Denfeld et al., 2013; Serikova et al., 2018; Ji et al., 2020; Castro-Morales et al., 2022). Yet our knowledge of C cycling in so-called middle eight Arctic rivers (Severnaya Dvina, Pechora, Pur, Taz, Khatanga, Olenek, Yana, Indigirka) remains incomplete, preventing accurate quantification and prediction of C source-sink functions and responses to climate change. These medium size rivers, virtually unassessed by scientific research, remained outside of global efforts of PARTNERS and ARCTIC-GRO research programs centered on major Arctic rivers (McClelland et al., 2004, 2006; Raymond et al., 2007; Cooper et al., 2008; Holmes et al., 2013; Griffin et al., 2018). In particular, the rivers draining permafrost peatlands of large continental planes are most sensitive to climate warming and may turn out to be very important sources of dissolved carbon to the ocean and CO2 emission to the atmosphere, strongly underestimated at the present time. This is especially true for remote rivers of potentially high environmental importance such as the Taz River (Swatershed = 150,000 km2), draining through frozen peatlands of the Western Siberian Lowland. Up to present time, due to its remoteness and difficulty in access, this river remained outside the scope of main research in the terrestrial Arctic. The peatlands in WSL are highly vulnerable to climate warming and permafrost thaw, as the ground temperature is around 0°C ± 2°C, suggesting high instability of frozen peat and its imminent thaw over next decades, which may lead to sizeable CO2 emission to the atmosphere and C and nutrient export to the Arctic Ocean.
In addition to scarcity of information on spatial variation of C emissions in Siberian Rivers, there are sizeable gaps in understanding of fundamental processes controlling C exchange and export by these rivers. The reason of this is that the knowledge on governing factors operating in much better studied Scandinavian, East Siberian, Canadian, or Alaskan rivers (Dawson et al., 2004; Teodoru et al., 2009; Koprivnjak et al., 2010; Striegl et al., 2012; Crawford et al., 2013; Lundin et al., 2013; Wallin et al., 2013; Leith et al., 2015; Stackpoole et al., 2017; Rocher-Ros et al., 2019; Gomez-Gener et al., 2021), acquired in totally different environmental context (relief, permafrost, vegetation, size of water objects) cannot be directly extrapolated to WSL rivers draining though taiga and forest-tundra zone, where the permafrost peatlands and lake-mire systems are much larger in size. Without knowledge of sources and pathways for C emission and export, attempts to understand and predict these fluxes under various climate warming and permafrost thaw scenarios will be problematic and likely erroneous.
The present study attempts filling up the above mentioned gaps by using a medium-size river, not subjected to any anthropogenic influence (<1 person/km2) and draining through representative gradient of forest to tundra landscapes and permafrost zones (from absent and sporadic to isolated in the south to continuous in the north). The main objective of the study was to assess the impact of land cover and hydrochemistry of the water column on CO2 and CH4 concentration and emission in the Taz River basin. Specifically, we aimed at three goals: 1) to quantify how the magnitude of C emission and export fluxes varies across the river main stem and tributaries over large spatial gradient; 2) to characterize possible sources of C emission and export in the Taz River system; and 3) to estimate possible impacts of climate warming and permafrost thaw on C emissions and export.
The Taz River main stem and its 16 tributaries include watersheds of distinct sizes (catchment area ranged from 149,000 km2 at the Taz’s mouth to 25 km2 of smallest sampled tributary), with rather similar lithology, but contrasting climate and vegetation (Figure 1, Supplementary Table S1). The Taz River basin can be roughly divided into two parts: 1) the upper (southern) part 400–800 km upstream of the mouth, where the permafrost is sporadic to discontinuous and the dominant vegetation is forest-tundra and taiga, and 2) the lower (northern) part, 0–400 km upstream of the mouth where the permafrost is continuous to discontinuous and the dominant biome is tundra and forest-tundra. The mean annual air temperatures (MAAT) ranges from −4.6°C in the headwaters (Tol’ka village) to −5.4°C in the low reaches (Tazovsky town). The mean annual precipitation is 500 mm y−1 in the central part of the basin (Krasnosel’kup town) and 600 mm y−1 in the low reaches of the Taz River. The lithology of the catchment is dominated by clays, silts and sands overlayed by quaternary deposits (loesses, fluvial, glacial and lacustrine deposits). The dominant soils are podzols in forest areas and histosols in peatlands.
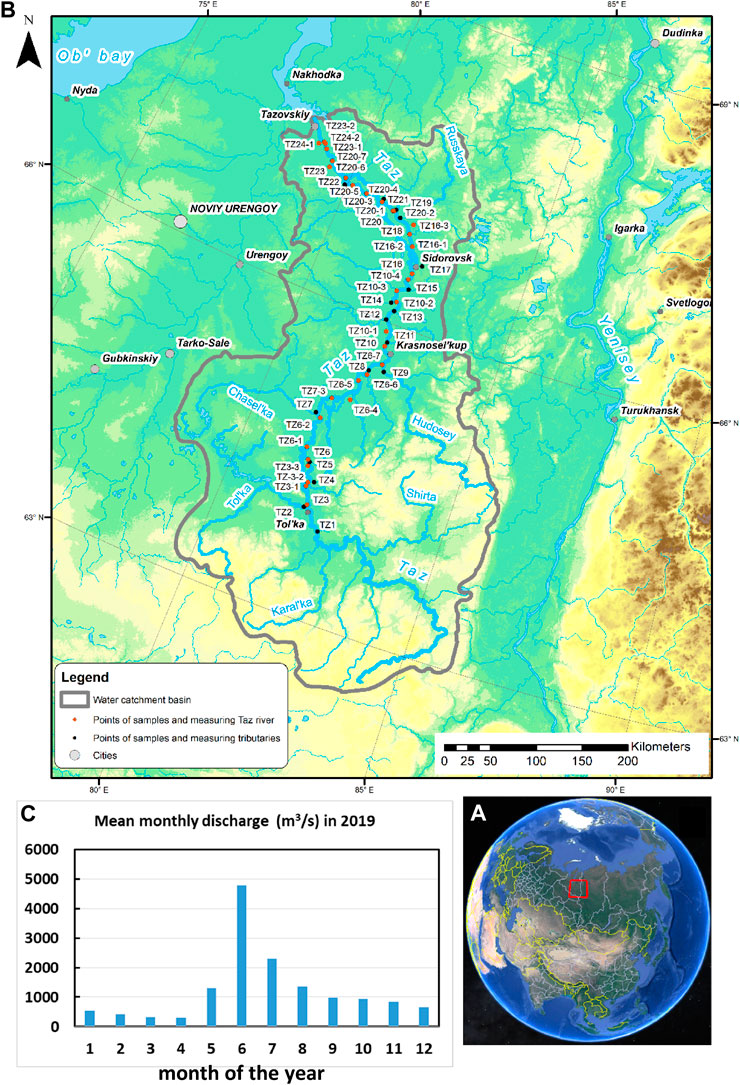
FIGURE 1. Map of the studied Taz River watershed. (A) location of the Taz River basin in the Northern Eurasia; (B) Detailed map of the Taz River and tributaries with sampling points; (C) Monthly discharge (m3 s−1) at the terminal gauging station (Tazovsky) in 2019. See Supplementary Table S1 for sampling point identification.
The peak of annual discharge in 2019 occurred in the middle of June (5,600 m3 s−1; in August, the discharge was five times lower, Figure 1). In this regard, the month of July (average discharge is 2,300 m3 s−1; range 1,920–3,370 m3 s−1) can be considered as the end of the spring flood period. From 10 July to 16 July 2019, we started the boat trip from the mouth zone of the Taz River (Gaz-Sale town), and moved, first, 800 km upstream the Taz river till its most headwaters (Tol’ka village), and then moved the same route downstream till the river mouth, with an average speed of 30 km h−1. We stopped each ∼50–100 km of the boat route and sampled for CO2 and CH4, major hydrochemical parameters, river suspended matter and total bacterial number of the main stem. We also moved 500–1,500 m upstream of selected tributaries to record CO2 concentrations for at least 1 h and to sample for river hydrochemistry. In one site of the Taz River main stem and two tributaries, the measurements of FCO2 were continued from late afternoon/evening to the next morning.
Surface water CO2 concentration was measured in-situ by deploying a portable infrared gas analyzer (IRGA, GMT222 CARBOCAP® probe, Vaisala®; accuracy ±1.5%) of two ranges (2,000 and 10,000 ppm) as described in previous work of our group on the Lena River (Vorobyev et al., 2021). For CH4 analyses, unfiltered water was sampled in 60-ml Serum bottles and closed without air bubbles using vinyl stoppers and aluminum caps and immediately poisoned by adding 0.2 ml of saturated HgCl2 via a two-way needle system. Headspace of N2 (30% of the total vial volume) was created in the laboratory and CH4 concentrations were analyzed using a Bruker GC-456 gas chromatograph (GC) equipped with flame ionization and thermal conductivity detectors. Further details of CH4 analyses are described elsewhere (Serikova et al., 2019; Vorobyev et al., 2021).
The CO2 fluxes were measured via two floating CO2 chambers equipped with non-dispersive infrared SenseAir CO2 loggers (Bastviken et al., 2015), at each of the nine sampling location of the main stem and 16 tributaries following the procedure described in details in Serikova et al. (2019) and Krickov et al. (2021). The CO2 accumulation rate inside the chamber was calculated by linear regression (r2 > 0.95) for 10–20 min exposure time. In addition to in-situ chamber measurements, the CO2 flux was calculated from measured CO2 concentration using standard approaches (Wanninkhof, 1992; Cole and Caraco, 1998; Guérin et al., 2007) as described in details in Vorobyev et al. (2021). For consistency with previous assessments, we used a gas transfer velocity (KT) value of 4.46 m d−1 measured in the four largest rivers of Western Siberian Lowland in June 2015 (Ob’, Pur, Pyakupur and Taz rivers, Karlsson et al., 2021).
The dissolved oxygen (CellOx 325; accuracy of ±5%), specific conductivity (TetraCon 325; ±1.5%), and water temperature (±0.2°C) were measured in situ at 20 cm depth using a WTW 3320 Multimeter. The pH was measured using portable Hanna instrument via combined Schott glass electrode calibrated with NIST buffer solutions (4.01, 6.86 and 9.18 at 25°C), with an uncertainty of 0.01 pH units. The water was sampled in pre-cleaned polypropylene bottle from 20 to 30 cm depth in the middle of the river and immediately filtered on the boat through disposable single-use sterile Sartorius filter units (0.45 µm pore size). The first 20 ml of filtrate was discarded. The DOC and Dissolved Inorganic Carbon (DIC) were determined by a Shimadzu TOC-VSCN Analyzer (Kyoto, Japan) with an uncertainty of 3% and a detection limit of 0.1 mg/L. Blanks of Milli-Q water passed through the filters demonstrated negligible release of DOC from the filter material. For calculating SUVA254, we measured ultraviolet absorbance at 254 nm (UV254) using a 10-mm quartz cuvette on a Bruker CARY-50 UV-VIS spectrophotometer.
The nutrient (N, P) analyses in filtered samples were based on colorimetric assays (Koroleff, 1983a; Koroleff, 1983b). Total dissolved nitrogen was measured by persulfate oxidation and the dissolved inorganic nitrogen forms (NH4+, NO2− and NO3−) were measured with spectrophotometry. Uncertainties on nutrient analyses were between 5 and 10%.
The concentrations of particulate organic carbon and nitrogen (POC and PON, respectively) in the suspended material were determined via filtration of freshly collected river water (1–2 L) on-site (at the river bank or in the boat) with pre-weighted GFF filters (47 mm, 0.45 µm) and Nalgene 250-ml polystyrene filtration units using a Mityvac® manual vacuum pump. The C and N concentration in RSM was measured using catalytic combustion with Cu-O at 900°C with an uncertainty of ≤0.5% using Thermo Flash 2000 CN Analyzer at EcoLab, Toulouse. The samples were analyzed before and after 1:1 HCl treatment to distinguish between total and inorganic C; however the ratio of Corganic: Ccarbonate in RSM was always above 20 and the contribution of carbonate C to total C in the RSM was equal in average 0.3% ± 0.3% (2 s.d., n = 30).
Total microbial cell concentration was measured after sample fixation in glutaraldehyde, by a flow cytometry (Guava® EasyCyteTM systems, Merck). Cells were stained using 1 µl of a 10 times diluted SYBR GREEN solution (10000x, Merck), added to 250 µl of each sample before analysis. Particles were identified as cells based on green fluorescence and forward scatter (Marie et al., 1999).
The daily discharge of the Taz River at Tazovsky site (river mouth in the freshwater zone) was calculated from daily discharges measured by the Russian Hydrological Survey (AIS GMVO, 2020) gauging station at Sidorovsk (150 km upstream of Tazovsky, without any major tributary on this river section), following the methodology elaborated for Western Siberia (Rozhdestvensky et al., 2003; Kopysov et al., 2020) and taking into account daily precipitation and temperature from the nearest meteorological stations (Bulygina et al., 2021). The daily discharge reconstruction for the year of 2019 at the Tazovsky sampling site was performed via Windows-based HBV-light model (Bergström, 1992; Seibert and Vis, 2012).
Over full year of 2019 at the Tazovsky terminal gauging station, during high flow of the spring flood (May), we sampled the river every 2–3 days, whereas during summer, autumn and winter baseflow we sampled weekly. Altogether, 20 samples during spring flood, 36 samples during summer-autumn baseflow and 19 samples under ice in winter were collected. Water samples were taken 200 m offshore from 0.3 m depth in pre-cleaned polypropylene bottles and were immediately filtered through sterile, single use Minisart® filter units (Sartorius, acetate cellulose filter) with a pore size of 0.45 μm. The DOC and DIC concentrations were measured as described in Section 2.3 above.
Annual DOC and DIC fluxes were estimated similar to LOADEST method (https://water.usgs.gov/software/loadest/, Holmes et al., 2012) from calculated daily element loads. The latter were obtained from a calibration regression, applied to daily discharge from the RHS. The calibration regression was constructed from time series of paired streamflow and measured element concentration data for 2017–2020 following the methodology elaborated for similar data set of another medium-size Arctic river, the Severnaya Dvina (Chupakov et al., 2020). This permafrost-free river is similar to Taz in terms of runoff and land cover, dominated by bogs and forest.
The physio-geographical and landscape characteristics of the 16 tributaries and the six points at the Taz main stem were determined by applying available digital elevation model (DEM GMTED 2010), soil, vegetation and lithological maps (Supplementary Table S1). The landscape parameters were typified using TerraNorte Database of Land Cover of Russia (Bartalev et al., 2011, http://terranorte.iki.rssi.ru). This included various type of forest (evergreen, deciduous, needleleaf/broadleaf), grassland, tundra, wetlands, water bodies and other area. The climatic parameters of the watershed were obtained from CRU grids data (1950–2016) (Harris et al., 2014) and NCSCD data (doi:10.5879/ecds/00000001, Hugelius et al., 2013), respectively, whereas the biomass and soil OC content were obtained from BIOMASAR2 (Santoro et al., 2010) and NCSCD databases. The lithology layer was taken from GIS version of Geological map of the Russian Federation (scale 1: 5 000 000, http://www.geolkarta.ru/). We calculated the area-weighted average values of the mentioned landscape parameters inside the sampled areas of the Taz River main stem and tributaries based on DEM GMTED 2010, using the Zonal Statistics Methods (ESRI ArcGIS 10.1). We quantified river water surface area using the global SDG database with 30 m2 resolution (Pekel et al., 2016) including both seasonal and permanent water for the open water period of 2016 and for the multiannual average (reference period 2000–2004). We also used a more recent GRWL Mask Database which incorporates first order wetted streams (Allen and Pavelsky, 2018). The Pearson rank order correlation coefficient (RPearson, p < 0.05) was used to determine the relationship between CO2 concentrations and emission fluxes and main landscape parameters of the Taz River tributaries, as well as other potential drivers such as DIC, DOC, SUVA, POC, macronutrients, and total bacterial number.
The concentrations of organic and inorganic carbon, CO2 and CH4 concentrations, and CO2 emission fluxes of the Taz River and its tributaries (DOC, DIC, CO2, CH4, and FCO2) are listed in Table 1 and Supplementary Table S2. Continuous measurements of CO2 concentration in the Taz River main stem using submersible Vaissala sensor could be performed only for a part of the river route (Supplementary Figure S1). The pCO2 variations over several hundred km distance were quite low which allowed interpolating the discrete measurements of CO2 concentrations and fluxes over the full length of the boat route. The CO2 measurements in the main stem demonstrated approximately two times higher concentrations in the southern part of the basin (upper 400 km) compared to the lower part and ranged from ca. 5,000–6,000 µatm (200–240 µM) in the south to 3,000–3,500 µatm (120–140 µM) in the north (Figure 2A). The CH4 concentrations were low (0.16 ± 0.05 μmol L−1 in the Taz River main stem and 0.57 ± 0.09 μmol L−1 in the tributaries) without any systematic spatial pattern across the basin; Figure 2B). These values are several hundred times lower than those of CO2. Consequently, diffuse CH4 emissions constituted less than 0.2%–0.5% of total C emissions and are not discussed in further detail.
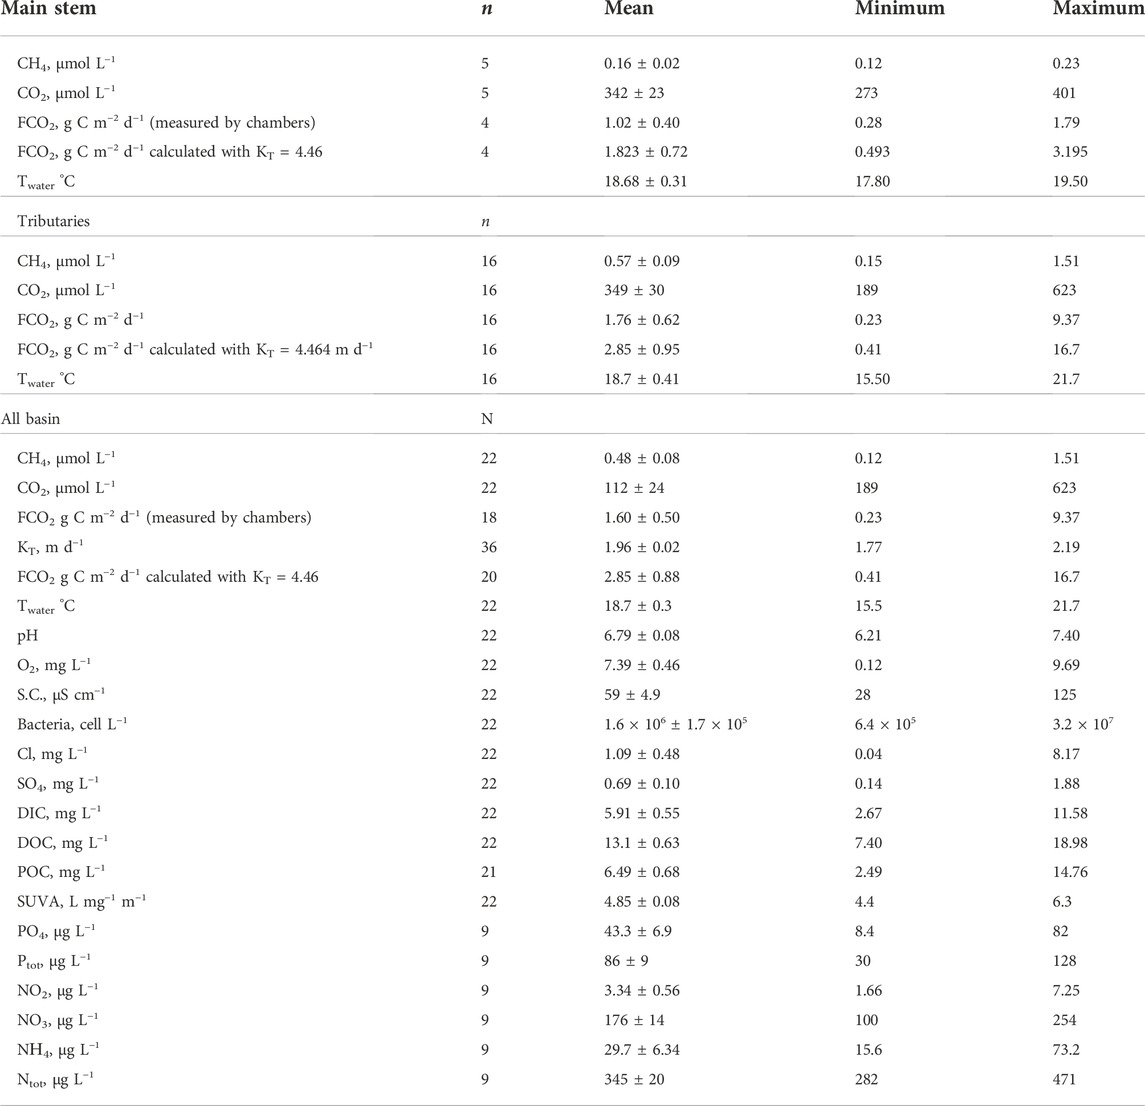
TABLE 1. Measured water temperature, pCO2, calculated CO2 flux, CH4, DOC, and DIC concentrations, pH and other hydrochemical parameters in the Taz River main stem and tributaries [mean ± s.d.; (n) is number of measurements].
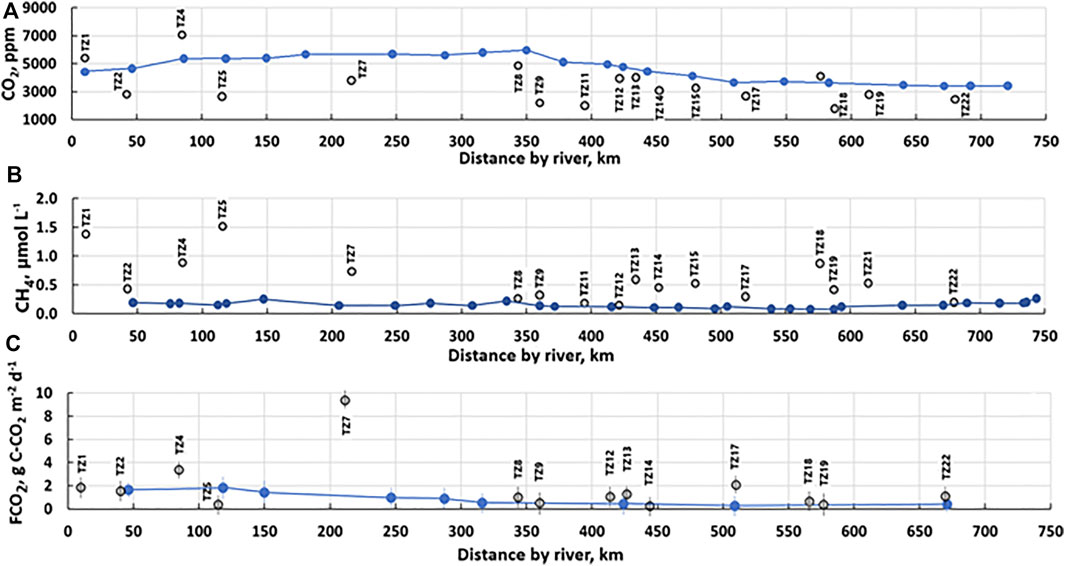
FIGURE 2. The CO2 and CH4 concentrations (A,B) and CO2 fluxes (C) profile of the Taz River main stem (solid circles) and tributaries (open circles). See Figure 1 and Supplementary Table S1 for identification of tributaries number. Headwaters to the river mouth, from left to right.
The CO2 emission flux measured by chambers yielded CO2 transfer velocity (KT) of 1.96 ± 0.09 m d−1 with generally weak spatial variations (1.77–2.19 m d−1) including those among the tributaries and the main stem (Supplementary Table S2). During study period, chamber-measured CO2 fluxes of the main stem ranged from 0.3 to 1.8 g C m−2 d−1 in the Taz River (mean 1.0 ± 0.4 g C m−2 d−1), and from 0.2 to 9.4 g C m−2 d−1 (mean 1.8 ± 0.6 g C m−2 d−1) in the tributaries (Table 1; Figure 2C). The mean CO2 emissions in the upper (southern) part of the Taz main stem and tributaries were about two times higher than those in the low reaches (2.17 ± 0.85 and 0.88 ± 0.22 g C m−2 d−1, respectively).
The diel measurements of CO2 flux by floating chambers in the tributaries of the Taz River demonstrated negligible impact of day/night period on emission fluxes (±0.5 g C m−2 d−1, or about 30% Figure 3). Although we did not acquire full 24-h time lapse, there was no statistically significant difference in measured CO2 flux between short night period and preceding or following morning or evening time. Altogether, rather minor or non-systematic spatial and diel variations in both CO2 concentration and emission fluxes support the chosen sampling strategy and allow reliable extrapolation of obtained results to full surface of lotic waters of the Taz River basin, during open water period.
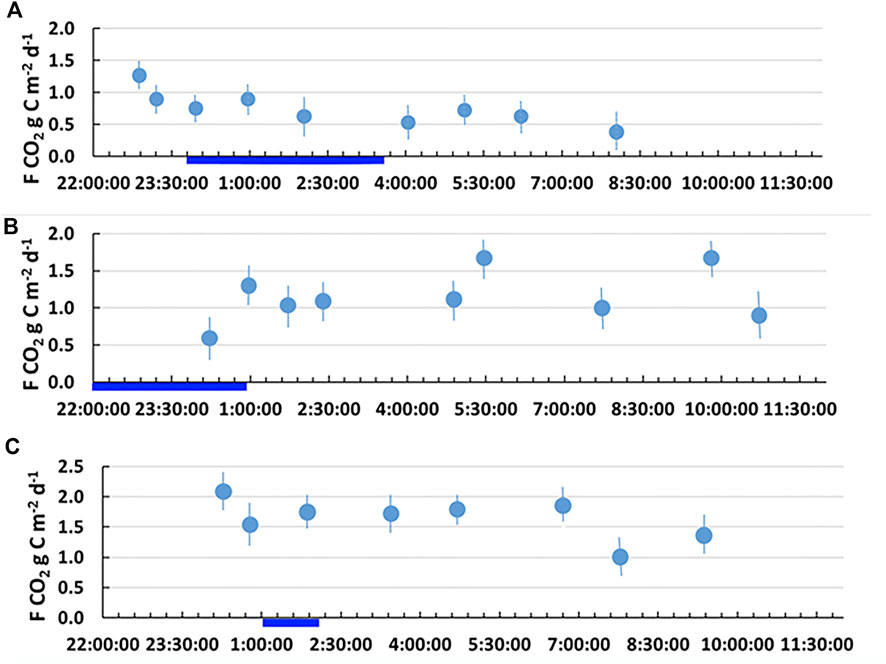
FIGURE 3. Discrete chamber-based fluxes in the Taz River [(A): 46.3 km, main stem (Tz-3), 64.07712°N, 81.93293°E] and two tributaries [(B): Chaselka (Tz-7), 211 km, 64.9391°N, 81.3651°E: (C) Soryakha, 566 km, 66.982628°N, 81.519432°E] including night time measurements (thick black line). Variations of water temperature did not exceed 2°C.
The Dissolved Organic Carbon (DOC) concentrations ranged from 12 to 13 mg L−1 in the main stem (without any latitudinal pattern over 800 km) to 7.4–19.0 mg L−1 in the tributaries (Supplementary Figure S2). The SUVA254 ranged from 4.5 to 5.0 L mg C−1 m−1, Supplementary Figure S2). The DIC concentrations ranged from 4.4 to 8.6 in the main stem to 2.7–11.6 in the tributaries, and pH was between 6.2 and 7.4 without significant difference between main stem and tributaries (Supplementary Table S2). The POC concentration was generally higher in the main stem compared to tributaries and ranged from 3 to 15 mg L−1. The total bacterial number ranged from (0.6–3.3) × 106 cell ml−1 for the main stem and tributaries without systematic spatial variability (Supplementary Table S2).
The C export flux (May to October) from the Taz basin was calculated based on monthly-averaged discharge at the river mouth in 2019 available from Russian Hydrological Survey and 6-month averaged DOC and DIC concentrations measured at the Tazovsky gauging station (9.8 ± 2.1 and 10.7 ± 4.5 mg L−1, respectively; which is in good agreement with DOC and DIC concentrations assessed in July 2019 in this study at the river mouth (Supplementary Table S3). These values are also consistent with 3-season sampling of the Taz River low reaches in 2016 by Serikova et al. (2018). The resulting export of C during 6 months of open water period amounts to 0.329 Tg DOC and 0.189 Tg DIC. The former value is in agreement with DOC yield of the Taz watershed (1.9 t C km−2 y−1 for Swatershed = 150,000 km2, or 0.285 Tg C y−1; which is based on mean multi-annual values from long-term monitoring, Pokrovsky et al., 2020; Gordeev et al., 1996). This confirms the validity of simplified mean monthly/seasonal calculation for the year of 2019, employed in the present study. Note that the contribution of POC to overall C export from the Taz River watershed does not exceed 10% because the typical yield of POC in WSL rivers of continuous and discontinuous zone is between 100 and 150 kg C km−2 y−1 (Krickov et al., 2018).
Spatial variations of main hydrochemical parameters, nutrients and total bacterial count of the Taz River main stem and tributaries are illustrated in Supplementary Figure S2 of the Supplement. It can be seen that these variations were mostly pronounced for the tributaries and there was no detectable northward or southward trend of DIC, DOC, SUVA and POC in the main stem, from the headwaters to the mouth.
Pearson correlations between GHG and the main parameters of the water column which are likely to control CO2 and CH4 pattern (DOC, DIC, O2, pH, Specific Conductivity, POC, TBC, macro-nutrients, SUVA and optical/molecular characteristics of DOM) did not reveal sizable links between these variables with rare exceptions (Table 2; Figure 4). The CO2 concentration positively correlated (p < 0.05) with concentrations of DOC and its aromaticity/humification (RPearson = 0.47, 0.55, respectively). The CO2 was also positively correlated with POC, SUVA, nutrients (Ptot, Ntot, Si) and bacterial number but these correlations were not significant (0.27 ≤ R ≤ 0.40; p > 0.05). Total dissolved N, DOC, SUVA254 and POC positively impacted FCO2 but statistically-significant correlation was only pronounced for Ntot (RPerason = 0.69, p < 0.05). In contrast, there was a positive correlation (p < 0.05) between the CH4 concentration and that of macro-nutrients (Ptot, NO2, NO3, NH4, Ntot).
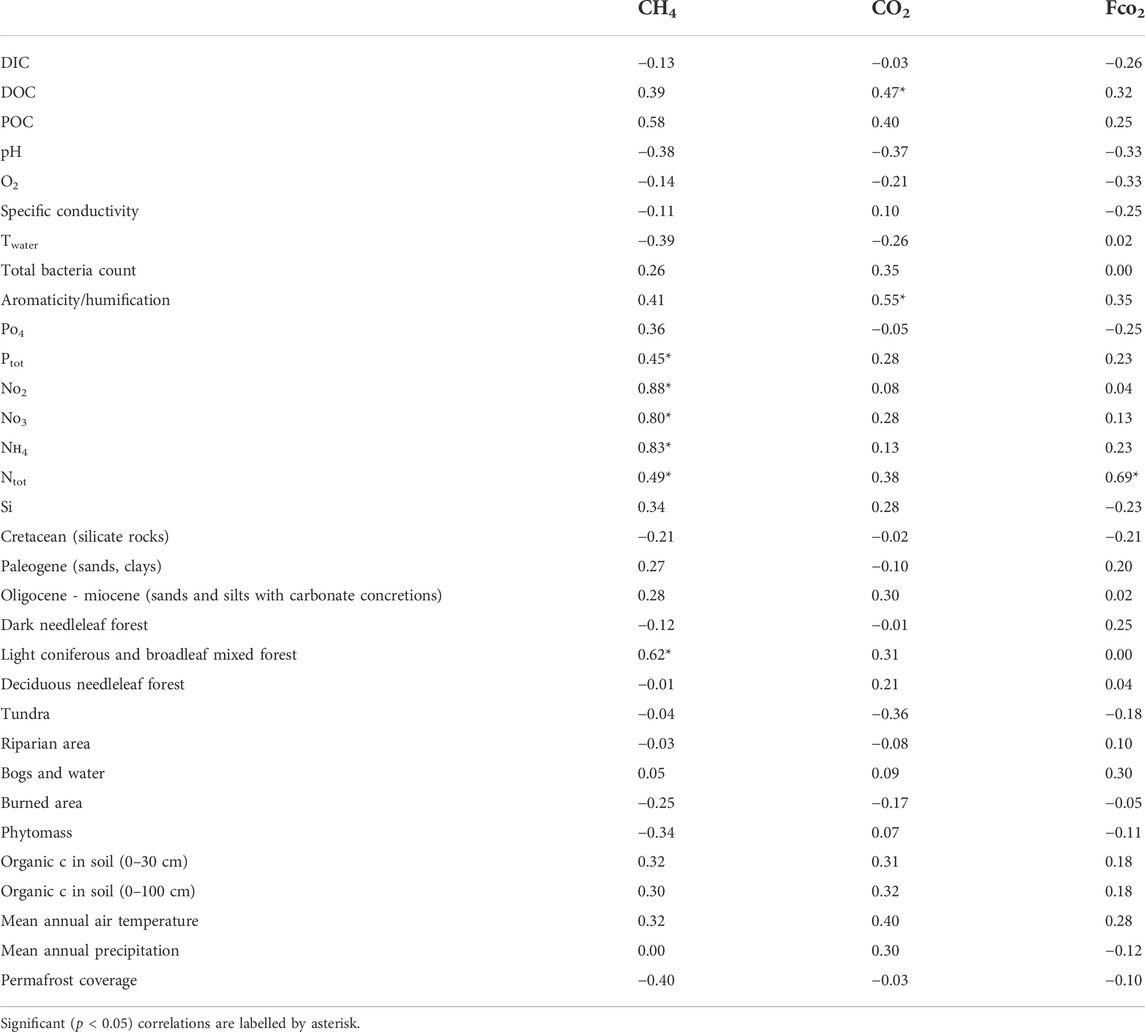
TABLE 2. Pearson correlation matrix of measured FCO2, CO2, and CH4 concentrations with hydrochemical parameters of the water column and landscape parameters of the tributaries and the main stem of the Taz River.
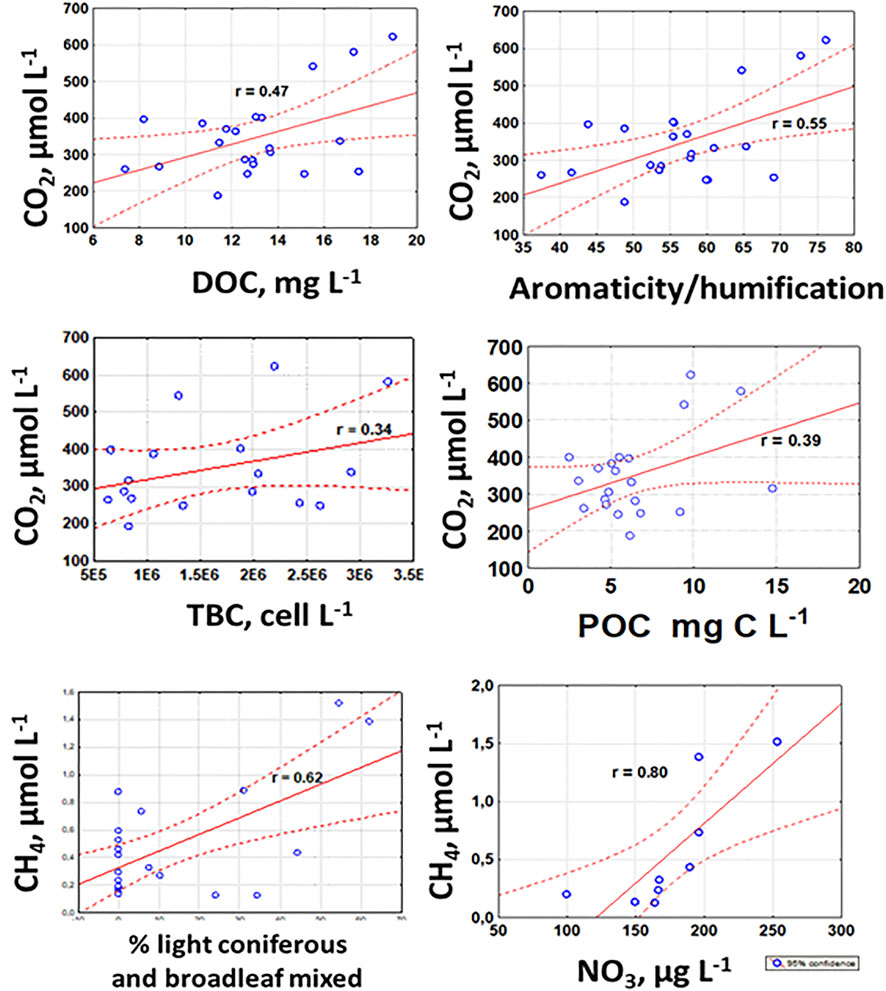
FIGURE 4. Significant (p < 0.05) positive control of river water hydrochemical parameters (DOC, POC, Aromaticity, nutrients), bacterial number (TBC) and land cover parameters (forest) on CO2 and CH4 concentrations in the Taz River main stem and tributaries.
The majority of land cover factors that are known to control the CO2 concentration and evasion in river waters (organic carbon stock in soil, proportion of peatland and bogs, tundra coverage, total aboveground vegetation, type of permafrost, annual precipitation and river watershed area) were not correlated with CO2 or CH4 concentration and FCO2. Only the watershed coverage by light coniferous and broadleaf mixed forest was significantly (RPearson = 0.62, p < 0.05) correlated with concentration of CH4 (Table 2).
The areal emissions of C (99.8%–99.5% CO2; 0.2%–0.5% CH4) from the lotic waters of the Taz River basin were assessed based on total water (lake excluded) coverage of the Taz river system in 2019 (4,845 km2, of which 3,239 km2 is seasonal water, according to the Global SDG database (6.6.1); https://www.nature.com/articles/nature20584). Given that the measurements were performed at the end of spring flood in 2019 during still high water period, we used the 3,224 km2 as seasonal average of the river basin (permanent +½ of seasonal lotic waters). We admit that the uncertainty on this value is as high as ± 500 km2. Of this water coverage value, we note that the main stem contributes to 24% of total water area.
For areal emission calculations, we used the values of measured CO2 emissions in the main stem (1.02 ± 0.40 g C m−2 d−1 for 774 km2) and tributaries (1.76 ± 0.62 g C m−2 d−1 for 2,450 km2). Similar approach has been used for the Lena River basin (Vorobyev et al., 2021) and it allows to account for variability of both tributaries and the Taz River main channel according to the partial contribution of different water courses (Table 1). Considering 180 days of open water period (May to October), the main stem and tributaries emit 0.142 Tg and 0.776 Tg C-CO2, respectively, with total emission of the Taz basin equaled to 0.916 ± 0.326 Tg C-CO2. Overall, the C emissions from lotic waters of the Taz watershed during open-water period sizably (about a factor of 2) exceeded the C downstream export.
Lateral variations of CO2 concentrations and emission fluxes along the ∼800 km of the main stem of the Taz River were rather low, although we noted about two times higher C concentrations and emissions in the southern part of the basin compared to its northern part. This, together with also constant pattern of organic and inorganic solutes -DOC, SUVA254, nutrients and total bacterial number (Supplementary Figure S2) -suggest high homogeneity of landscape (external) factors responsible for C emission and transport in the Taz river.
The variability of CO2 concentration and emission flux in the tributaries was much larger compared to the main stem, and a number of land cover features (deciduous needle-leaf forest, C stock in soil, mean annual temperature and precipitation) and water column parameters (dissolved N, bacterial number, POC) exhibited positive correlations (0.2 < RPearson < 0.4) with CO2 concentration (Table 2). These correlations, however, were too weak (p > 0.05) to speculate about direct drivers of C pattern. Only DOC, its aromaticity and total N concentration demonstrated sizable (p < 0.05) links to CO2 concentration. We believe that organic-rich bog water feeding the river can be responsible for positive correlations of CO2 with DOC and aromaticity, as reflected in its optical properties. A positive correlation with dissolved N may be due to CO2 diffusion from N-rich sediments to the water column, as it is known for thermokarst lakes of the permafrost peatlands in this region (Audry et al., 2011; Manasypov et al., 2022). Although the CH4 concentration pattern in both the main stem and tributaries was less variable than that of CO2, there were positive correlations with some nutrients such as nitrate and ammonia (p < 0.01) and total phosphorus (p < 0.05). These correlations could reflect co-mobilization of methane and these nutrients from river sediments to the water column in some stagnant and shallow zones of the river, its riparian zone, of partially flooded floodplain.
Another important result of this study is a lack of diel FCO2 variation (Figure 3). This contrasts the report on diel variations of CO2 emissions from low-DOC, shallow Arctic streams of N Sweden (Rocher-Ros et al., 2019), where the primary productivity/respiration cycles strongly override photodegradation of DOC. Presumably, lack of substantial productivity/mineralization processes in the water column of the Taz River and tributaries is due to shallow photic layer of organic-rich waters and essentially allochthonous nature of DOM (high SUVA254) originated from surrounding peatlands. Therefore, lack of measurable diel variations in CO2 pattern may be consistent with negligible bio-and photo-degradability of DOM in the Taz River. Although the DOC bio-and photodegradation processes in large Arctic Rivers are strongly understudied, the only case of quite similar river draining permafrost peatlands, the Pechora River of NE Europe, demonstrated a negligible (0%–5%) bio- and photodegradation of DOC in the water column (Shirokova et al., 2019). Other studies of surface waters in permafrost peatlands also demonstrated that DOM photo- and bio-degradation are low and cannot sizably contribute to observed net CO2 evasion from humic waters (Payandi-Rolland et al., 2020; Laurion et al., 2021).
Overall, the observed stable and temporal pattern in CO2 concentrations and emissions could not be attributed to any specific environmental factor studied here, but may be explained by a combination of land cover of the watershed and riverine organic matter source. First, the Taz River catchment is represented by essentially homogeneous landscapes, and similar lithology and Quaternary deposits of the whole river basin (50% forest, 30% wetlands). As a result, the variations in land cover parameters among studied tributaries and at the several sampling points of the main stem are rather minor. Second, there is a strong dominance of allochthonous source in both dissolved and particulate organic matter. This terrestrial source could be either forest soil litter leachates or, more likely, bog water at the end of spring flood when the river water is substantially derived from adjacent bogs (i.e., Ala-aho et al., 2018). The main argument for overall constant input of terrestrial material is spatially-stable values of SUVA254 (from 4.4 to 5.1 L mg−1 m−1; Supplementary Figure S2; Table 1). Such high values, together with stable and low variable humification, aromaticity and normal molecular weight are indicative of overwhelming terrestrial signal.
Therefore, rather than local processes in the water column (respiration, primary productivity, photo- and bio-degradation of DOM and POM), we hypothesize the dominance of external input to the river water as the main governing factor of C emission pattern. Such input may include a lateral influx from the shores and shallow subsurface waters, sediment resuspension and respiration. In particular, in small peatland streams, the CO2-rich peat water is known to be the major source of aquatic CO2 under low flow conditions (Dinsmore and Billett, 2008; Dinsmore et al., 2013). At the same time, given essentially permafrost context of the Taz River basin, the discharge of deep underground, CO2-rich fluids in the river bed (hyporheic zone) as it is known in other regions of the world (i.e., Duvert et al., 2018) is less likely. Instead, a two-fold increase in the CO2 concentration and emission flux in the main stem and tributaries between the low reaches in the north and the headwaters in the south may reflect progressive increase in the feeding of the river basin by DOC- and CO2-rich mire waters and an increase in the proportion of forest at the watershed.
In the present study, in addition to direct chamber measurements, we also calculated the CO2 emission fluxes using KT value of the Ob River main stem, following the approach to other large rivers of Siberia (4.46 m d−1; Karlsson et al., 2021). Note that this value is close to that used for the boreal and Arctic streams (Aufdenkampe et al., 2011), and it is at the lower end of fluvial KT values, but at the high end of inland water KT values in general (Dean et al., 2020). Thus calculated FCO2 values were typically 1.6–1.8 times higher than those measured directly by chambers (Table 1). However, because of the smaller size and shorter fetch of the Taz River and its tributaries, we believe that lower values of KT are more pertinent to the studied river basin. Given that the Taz River has very extensive floodplain, this is consistent with observations in other regions that in flooded land, a canopy of riparian vegetation protects the water-air interface from wind stress thus rendering the gas transfer velocity lower compared to open water such as large river (i.e., Foster-Martinez and Variano, 2016; Ho et al., 2018; Abril and Borges, 2019). It is worth noting that the range of KT values measured by floating chambers in this study (2.0 ± 0.2 m d−1) are consistent with transfer coefficients for western Siberia calculated by Liu et al. (2022) based on reach-slope and flow velocity of the rivers of this region (i.e., ≤2 m d−1).
We found that the range of CH4 concentrations in the Taz tributaries and the main channel are several hundred times lower than those of CO2. Given that, on a short-term scale (20 years), the GWP of methane can be as high as 96 (Alvarez et al., 2018), and the majority of methane is evaded from lakes, not assessed in this study, the role of CH4 in climate regulation may become comparable to that of the CO2. This has to be taken into account for climate modeling of the region at the scale of the Taz River basin.
The chamber-measured emissions (>99.8% CO2) from the Taz River main channel over 750 km distance (0.5–2.0 g C m−2 d−1, respectively) are comparable to the range of values reported by Serikova et al. (2018) for the low reaches of the Taz and Pur Rivers in summer and spring (1.2–1.6 g C m−2 d−1) and CO2 flux in small rivers of continuous/discontinuous permafrost zone of the WSL (2.2 ± 1.6 and 2.6 ± 0.6 g C m−2 d−1 in spring and summer, respectively). The obtained fluxes are also in agreement with CO2 evasion from the Kolyma River (0.35 g C m−2 d−1 in the main stem; 2.1 g C m−2 d−1 for lotic waters of the basin, Denfeld et al., 2013), the Ob River main channel (1.32 ± 0.14 g C m−2 d−1 in the permafrost-free zone, Karlsson et al., 2021) and the Lena River along a 2,800 km profile (0.8–1.7 g C m−2 d−1, Vorobyev et al., 2021). The CO2 emissions in Taz’s tributaries (0.3–9 g C m−2 d−1) are within the range reported for small rivers and streams of the continuous and discontinuous permafrost zone of western Siberia (2.0–3.2 g C m−2 d−1; Serikova et al., 2018), forest and wetland headwater streams of northern Sweden (0.5–5 g C m−2 d−1, Gomez-Gener et al., 2021; Rocher-Ros et al., 2019), and small boreal streams in Canada and Alaska (0.8–5.2 g C m−2 d−1, Teodoru et al., 2009; Koprivnjak et al., 2010; Crawford et al., 2013; Campeau et al., 2014). Total watershed surface area-normalized C emissions from the water surfaces of the Taz River basin assessed in this study (6.2 g C-CO2 m(land)−2 y−1 assuming no emission under ice) are higher than those of the average lotic waters of western Siberia (2–5 g C-CO2 m(land)−2 y−1, Karlsson et al., 2021), but comparable to the boreal portions of the Yukon River (7–9 g C m−2 y−1; Striegl et al., 2012; Stackpoole et al., 2017).
Taken together, our regional estimations are based on direct chamber measurements and as such provide rigorous basis for assessment of CO2 emissions from still understudied lotic waters of permafrost-free zone of Western Siberia. The C evasion from the Taz River basin assessed in the present work is sizably higher than the total dissolved carbon (DOC + DIC) lateral export by this river to the Arctic Ocean. The coverage of the Taz River watershed by lakes is about the same as that of rivers (5,350 and 4,845 km2, respectively, as estimated from Global SDG database). The areal CO2 evasion from lakes in the north of the WSL is generally higher than that of rivers (Karlsson et al., 2021). Therefore, accounting the C evasion from lakes can double the total emissions from the Taz basin and thus increase the C emission: C export ratio for this territory to as high as 3–5, still a bit lower than the global average value of the WSL inland waters (7–9, Karlsson et al., 2021). Together with available data on Ob (Karlsson et al., 2021), Pur (Serikova et al., 2018), Kolyma (Denfeld et al., 2013), and Lena River (Vorobyev et al., 2021), results of the present study will help to upscale C emission and export from Siberian rivers on the territory of several million km2.
Taking advantage of the highly pristine character of the Taz River (in contrast to the neighboring Pur River basin, strongly impacted by gas and oil industry), the Taz catchment was used to approximate the future changes in riverine C emissions linked to on-going climate change and permafrost thaw. For this, we will use a “substituting space for time” approach which postulates, in a broad context, that spatial phenomena which are observed today can be used to describe past and future events (Blois et al., 2013). Such an approach has been successfully used in western Siberia (Frey and Smith, 2005) to model the possible future changes in small (Krickov et al., 2018) and medium-size (Pokrovsky et al., 2022) rivers, lakes (Manasypov et al., 2022), soil waters (Raudina et al., 2018) and permafrost ice (Lim et al., 2021). Indeed, with permafrost boundary shift northward (Romanovsky et al., 2010) and tundra greening over next decades as it is observed generally through the Arctic and subarctic regions (Tape et al., 2006; Garcia Criado et al., 2020; Mauclet et al., 2022), the northern part of the Taz River (tundra and forest-tundra of continuous to discontinuous permafrost) can be entirely transformed into southern part-like territory of taiga and forest-tundra biome with discontinuous to sporadic permafrost. Given that the CO2 flux in the upper (southern) 400 km of the river main stem and tributaries is a factor of 2–3 higher than that in the lower (northern) part of the basin, one can expect a 2 to 3-fold increase in the CO2 emission from the Taz River basin due to on-going climate warming and permafrost thaw. These estimations are important because local scale heterogeneity of CO2 emission across the south-north gradient of the Taz River basin is not accounted for in most recent global models of fluvial CO2 emissions (Liu et al., 2022). In the latter study, a very broad range of CO2 emissions for this region, not reflecting latitudinal heterogeneity, was reported (0.2–2.0 g C-CO2 m−2 d−1), which is compatible with the values of the present work but does not allow quantitative space for time substitution scenario. For such an approach, local high resolution studies of the whole riverine basin with main tributaries are needed, as it was demonstrated in the present work. At the same time, our estimations of possible CO2 emission increase in the northern part of the Taz River basin are consistent with anticipated northward shift in the maximum of C emissions from the WSL rivers as inferred from recent study of small rivers (Serikova et al., 2018).
Via employing an unprecedented spatial coverage of C pattern in a pristine permafrost-affected river and combining discrete hydrochemical measurements with continuous CO2 and floating chamber assessment of fluxes, we tested the magnitude of riverine C fluxes in relation to various hydrochemical, climatic (temperature, permafrost) and landscape (type of biome) drivers. The obtained results allowed quantifying rates and source contribution of emission and downstream C export, and how they change across different permafrost conditions and landscape (vegetation) type. Among possible CO2 emission drivers, we identified some hydrochemical parameters of the river water (DOC and its aromaticity) whereas land cover features (watershed coverage by forest, bogs, C stock in soil and climate parameters) did not significantly correlate with CO2 concentrations and emissions. The CH4 concentration positively correlated with POC, all dissolved N forms, Ptot, and light coniferous forest coverage.
Together with available data on other Siberian rivers, results of the present study will help to upscale riverine C emission and export from the territory of several million km2. This should provide a better understanding of permafrost response to climate warming in Siberia and mechanisms of negative feedback of CO2 emissions from inland waters to the rise of air temperature and vegetation shift northward. Via substituting space for time approach, and taking the advantage of gradients in temperature, vegetation and permafrost across the Taz river main stem and tributaries, we estimate a 2 to 3-fold increase in CO2 emission from the Taz River basin over next decades, linked to northward vegetation and permafrost boundary shift.
The datasets presented in this study can be found in Pokrovsky and Korets (2022).
SV and OP designed the study and wrote the paper; SV and OP performed sampling, analysis and their interpretation; LS performed DOC and bacteria analysis and interpretation; MK performed landscape characterization of the Taz River basin and calculated water surface area.
We acknowledge support from the TSU Development Program “Priority-2030”, the RSF grant No. 22-17-00253, and grant “Kolmogorov” of MES (Agreement No. 075-15-2022-241). SV is grateful to support from URI “System of experimental bases located along the latitudinal gradient TSU (Agreement No. 0.75-15-2021-672). We thank Sergey Kopysov for providing the discharge data and Olga Moreva for help with nutrient analyses.
The authors declare that the research was conducted in the absence of any commercial or financial relationships that could be construed as a potential conflict of interest.
All claims expressed in this article are solely those of the authors and do not necessarily represent those of their affiliated organizations, or those of the publisher, the editors and the reviewers. Any product that may be evaluated in this article, or claim that may be made by its manufacturer, is not guaranteed or endorsed by the publisher.
The Supplementary Material for this article can be found online at: https://www.frontiersin.org/articles/10.3389/fenvs.2022.987596/full#supplementary-material
Abril, G., and Borges, A. V. (2019). Ideas and perspectives: Carbon leaks from flooded land: Do we need to replumb the inland water active pipe? Biogeosciences 16, 769–784. doi:10.5194/bg-16-769-2019
AIS GMVO (2020). AIS GMVO avtomatizirovannaya informatsionnaya sistema gosudarstvennogo monitoring vodnykh ob’еktov [automated information system of state monitoring of water bodies. Electronic Resource Available online: https://gmvo.skniivh.ru/(accessed on July 20, 2022).
Ala-Aho, P., Soulsby, C., Pokrovsky, O. S., Kirpotin, S. N., Karlsson, J., Serikova, S., et al. (2018). Permafrost and lakes control river isotope composition across a boreal Arctic transect in the Western Siberian lowlands. Environ. Res. Lett. 13 (3), 034028. Art No. doi:10.1088/1748-9326/aaa4fe
Allen, G. H., and Pavelsky, T. M. (2018). Global extent of rivers and streams. Science 361, 585–588. doi:10.1126/science.aat0636
Alvarez, R. A., Zavala-Araiza, D., Lyon, D. R., Allen, D. T., Barkley, Z. R., Brandt, A. R., et al. (2018). Assessment of methane emissions from the U.S. oil and gas supply chain. Science 361, 186–188. doi:10.1126/science.aar7204
Audry, S., Pokrovsky, O. S., Shirokova, L. S., Kirpotin, S. N., and Dupré, B. (2011). Organic matter mineralization and trace element post-depositional redistribution in Western Siberia thermokarst lake sediments. Biogeosciences 8, 3341–3358. doi:10.5194/bg-8-3341-2011
Aufdenkampe, A. K., Mayorga, E., Raymond, P. A., Melack, J. M., Doney, S. C., Alin, S. R., et al. (2011). Riverine coupling of biogeochemical cycles between land, oceans, and atmosphere. Front. Ecol. Environ. 9, 53–60. doi:10.1890/100014
Bartalev, S. A., Egorov, V. A., Ershov, D. V., Isaev, A. S., Lupyan, E. A., Plotnikov, D. E., et al. (2011). Remote mapping of vegetation land cover of Russia based on data of MODIS spectroradmeter. Mod. Problems Earth Remote Sens. Space 8, 285–302. Available at: http://d33.infospace.ru/d33_conf/2011v8n4/285-302.pdf (Accessed November 19, 2022).
Bastviken, D., Sundgren, I., Natchimuthu, S., Reyier, H., and Gålfalk, M. (2015). Technical Note: Cost-efficient approaches to measure carbon dioxide (CO2) fluxes and concentrations in terrestrial and aquatic environments using mini loggers. Biogeosciences 12, 3849–3859. doi:10.5194/bg-12-3849-2015
Bergström, S. (1992). “The HBV model,” in Structure and applications (Norrköping, Sweden: Swedish Meteorological and Hydrological Institute, 35.
Blois, J. L., Williams, J. W., Fitzpatrick, M. C., Jackson, S. T., and Ferrier, S. (2013). Space can substitute for time in predicting climate-change effects on biodiversity. Proc. Natl. Acad. Sci. U. S. A. 110, 9374–9379. doi:10.1073/pnas.1220228110
Bulygina, O. N., Razuvaev, V. N., and Alexsandrova, T. M. (2021). Description of daily air temperature and precipitation data set from Russian meteorological stations and from some meteorological stations over the former USSR. Territory (TTTR) [Electronic Resource]. Available online: http://meteo.ru/english/climate/descrip11.htm (accessed on July 20, 2022).
Butman, D., and Raymond, P. A. (2011). Significant efflux of carbon dioxide from streams and rivers in the United States. Nat. Geosci. 4, 839–842. doi:10.1038/ngeo1294
Campeau, A., and Del Giorgio, P. A. (2014). Patterns in CH4 and CO2 concentrations across boreal rivers: Major drivers and implications for fluvial greenhouse emissions under climate change scenarios. Glob. Chang. Biol. 20 (4), 1075–1088. doi:10.1111/gcb.12479
Campeau, A., Lapierre, J.-F., Vachon, D., and del Giorgio, P. A. (2014). Regional contribution of CO2 and CH4 fluxes from the fluvial network in a lowland boreal landscape of Québec. Glob. Biogeochem. Cycles 28, 57–69. doi:10.1002/2013GB004685
Castro-Morales, K., Canning, A., Körtzinger, A., Göckede, M., Küsel, K., Overholt, W. A., et al. (2022). Effects of reversal of water flow in an Arctic floodplain river on fluvial emissions of CO2 and CH4. J. Geophys. Res. Biogeosciences 127. doi:10.1029/2021JG006485
Chupakov, A. V., Pokrovsky, O. S., Moreva, O. Y., Shirokova, L. S., Neverova, N. V., Chupakova, A. A., et al. (2020). High resolution multi-annual riverine fluxes of organic carbon, nutrient and trace element from the largest European Arctic river, Severnaya Dvina. Chem. Geol. 538, 119491. doi:10.1016/j.chemgeo.2020.119491
Cole, J. J., and Caraco, N. F. (1998). Atmospheric exchange of carbon dioxide in a low-wind oligotrophic lake measured by the addition of SF6. Limnol. Oceanogr. 43, 647–656. doi:10.4319/lo.1998.43.4.0647
Cooper, L. W., McClelland, J. W., Holmes, R. M., Raymond, P. A., Gibson, J. J., Guay, C. K., et al. (2008). Flow-weighted values of runoff tracers (δ18O, DOC, Ba, alkalinity) from the six largest Arctic rivers. Geophys. Res. Lett. 35, L18606. doi:10.1029/2008GL035007
Crawford, J. T., Striegl, R. G., Wickland, K. P., Dornblaser, M. M., and Stanley, E. H. (2013). Emissions of carbon dioxide and methane from a headwater stream network of interior Alaska. J. Geophys. Res. Biogeosci. 118, 482–494. doi:10.1002/jgrg.20034
Dawson, J. J. C., Billett, M. F., Hope, D., Palmer, S. M., and Deacon, C. M. (2004). Sources and sinks of aquatic carbon in a peatland stream continuum. Biogeochemistry 70, 71–92. doi:10.1023/b:biog.0000049337.66150.f1
Dean, J. F., Meisel, O. H., Rosco, M. M., Marchesini, L. B., Garnett, M. H., Lenderink, H., et al. (2020). East Siberian Arctic inland waters emit mostly contemporary carbon. Nat. Commun. 11, 1627. Art No 1627. doi:10.1038/s41467-020-15511-6
Denfeld, B. A., Frey, K. E., Sobczak, W. V., Mann, P. J., and Holmes, R. M. (2013). Summer CO2 evasion from streams and rivers in the Kolyma River basin, north-east Siberia. Polar Res. 32, 19704. Art No. doi:10.3402/polar.v32i0.19704
Dinsmore, K. J., and Billett, M. F. (2008). Continuous measurement and modeling of CO2 losses from a peatland stream during stormflow events. Water Resour. Res. 44. Art No W12417. doi:10.1029/2008wr007284
Dinsmore, K. J., Billett, M. F., and Dyson, K. E. (2013). Temperature and precipitation drive temporal variability in aquatic carbon and GHG concentrations and fluxes in a peatland catchment. Glob. Chang. Biol. 19, 2133–2148. doi:10.1111/gcb.12209
Duvert, C., Butman, D., Marx, A., Ribolzi, O., and Hutley, L. (2018). CO2 evasion along streams driven by groundwater inputs and geomorphic controls. Nat. Geosci. 11, 813–818. doi:10.1038/s41561-018-0245-y
Foster-Martinez, M. R., and Variano, E. A. (2016). Air-water gas exchange by waving vegetation stems. J. Geophys. Res. Biogeosci. 121, 1916–1923. doi:10.1002/2016jg003366
Frey, K. E., and Smith, L. C. (2005). Amplified carbon release from vast West Siberian peatlands by 2100. Geophys. Res. Lett. 32, L09401. doi:10.1029/2004GL022025
García Criado, M., Myers-Smith, I. H., Bjorkman, A. D., Lehmann, C. E. R., and Stevens, N. (2020). Woody plant encroachment intensifies under climate change across tundra and savanna biomes. Glob. Ecol. Biogeogr. 29, 925–943. doi:10.1111/geb.13072
Gómez-Gener, L., Hotchkiss, E. R., Laudon, H., and Sponseller, R. A. (2021). Integrating discharge-concentration dynamics across carbon forms in a boreal landscape. Water Resour. Res. 57, e2020WR028806. doi:10.1029/2020WR028806
Gordeev, V. V., Martin, J.-M., Sidorov, I. S., and Sidorova, M. V. (1996). A reassessment of the Eurasian river input of water, sediment, major elements, and nutrients to the Arctic Ocean. Am. J. Sci. 296, 664–691. doi:10.2475/ajs.296.6.664
Griffin, C. G., McClelland, J. W., Frey, K. E., Fiske, G., and Holmes, R. M. (2018). Quantifying CDOM and DOC in major Arctic rivers during ice-free conditions using Landsat TM and ETM+ data. Remote Sens. Environ. 209, 395–409. doi:10.1016/j.rse.2018.02.060
Guérin, F., Abril, G., Serça, D., Delon, C., Richard, S., Delmas, R., et al. (2007). Gas transfer velocities of CO2 and CH4 in a tropical reservoir and its river downstream. J. Mar. Syst. 66, 161–172. doi:10.1016/j.jmarsys.2006.03.019
Harris, I., Jones, P. D., Osborn, T. J., and Lister, D. H. (2014). Updated high-resolution grids of monthly climatic observations – The CRU TS3.10 dataset. Int. J. Climatol. 34, 623–642. doi:10.1002/joc.3711
Holmes, R. M., Coe, M. T., Fiske, G. J., Gurtovaya, T., McClelland, J. W., Shiklomanov, A. I., et al. (2013). “Climate change impacts on the hydrology and biogeochemistry of Arctic Rivers,” in Climatic changes and global warming of inland waters: Impacts and mitigation for ecosystems and societies. Editors C. R. Goldman, M. Kumagi, and R. D. Robarts (United States: John Wiley & Sons), 1–26.
Holmes, R. M., McClelland, J. W., Peterson, B. J., Tank, S. E., Bulygina, E., Eglinton, T. I., et al. (2012). Seasonal and annual fluxes of nutrients and organic matter from large rivers to the Arctic Ocean and surrounding seas. Estuaries Coast. 35 (2), 369–382. doi:10.1007/s12237-011-9386-6
Hotchkiss, E. R., Hall, R. O., Sponseller, R. A., Butman, D., Klaminder, J., Laudon, H., et al. (2015). Sources of and processes controlling CO2 emissions change with the size of streams and rivers. Nat. Geosci. 8, 696–699. doi:10.1038/ngeo2507
Hugelius, G., Tarnocai, C., Broll, G., Canadell, J. G., Kuhry, P., and Swanson, D. K. (2013). The northern circumpolar soil carbon database: Spatially distributed datasets of soil coverage and soil carbon storage in the northern permafrost regions. Earth Syst. Sci. Data 5, 3–13. doi:10.5194/essd-5-3-2013
Hutchins, R. H. S., Prairie, Y. T., and del Giorgio, P. A. (2019). Large-scale landscape drivers of CO2, CH4, DOC and DIC in boreal river networks. Glob. Biogeochem. Cycles 33 (2), 125–142. doi:10.1029/2018GB006106
Ji, X., Abakumov, E., Polyakov, V., and Xie, X. (2020). Mobilization of geochemical elements to surface water in the active layer of permafrost in the Russian Arctic. Water Resour. Res. 57, e2020WR028269. doi:10.1029/2020wr028269
Karlsson, J., Serikova, S., Rocher-Ros, G., Denfeld, B., Vorobyev, S. N., and Pokrovsky, O. S. (2021). Carbon emission from Western Siberian inland waters. Nat. Commun. 12, 825. doi:10.1038/s41467-021-21054-1
Koprivnjak, J.-F., Dillon, P. J., and Molot, L. A. (2010). Importance of CO2 evasion from small boreal streams. Glob. Biogeochem. Cycles 24 (4), 1–9. doi:10.1029/2009GB003723
Kopysov, S. G., Zemtsov, V. A., Matsuyama, H., and Eliseev, A. O. (2020). River flow hydrograph simulation in the Western Siberia lowland north for the extreme flood flow prediction based on the HBV-Light model. Geosph. Res. 4, 98–107. doi:10.17223/25421379/17/9
Koroleff, F. (1983a). “Total and organic nitrogen,” in Methods for seawater analysis. Editors K. Grasshoff, M. Ehrhardt, and K. Kremling (United States: Wiley), 162–168. Verlag Chemie Weinheim.
Koroleff, F. (1983b). “Determination of phosphorus,” in Methods for seawater analysis. Editors K. Grasshoff, M. Ehrhardt, and K. Kremling (United States: Wiley), 125–136. Verlag Chemie Weinheim.
Krickov, I. V., Lim, A. G., Manasypov, R. M., Loiko, S. V., Shirokova, L. S., Kirpotin, S. N., et al. (2018). Riverine particulate C and N generated at the permafrost thaw front: Case study of Western Siberian rivers across a 1700 km latitudinal transect. Biogeosciences 15, 6867–6884. doi:10.5194/bg-15-6867-2018
Krickov, I. V., Serikova, S., Pokrovsky, O. S., Vorobyev, S. N., Lim, A. G., Siewert, M. B., et al. (2021). Sizable carbon emission from the floodplain of Ob River. Ecol. Indic. 131, 108164. doi:10.1016/j.ecolind.2021.108164
Lauerwald, R., Laruelle, G. G., Hartmann, J., Ciais, P., and Regnier, P. A. G. (2015). Spatial patterns in CO2 evasion from the global river network. Glob. Biogeochem. Cycles 29, 534–554. doi:10.1002/2014GB004941
Laurion, I., Massicotte, P., Mazoyer, F., Negandhi, K., and Mladenov, N. (2021). Weak mineralization despite strong processing of dissolved organic matter in Eastern Arctic tundra ponds. Limnol. Oceanogr. 66 (S1), S47–S63. doi:10.1002/lno.11634
Leith, F. I., Dinsmore, K. J., Wallin, M. B., Billett, M. F., Heal, K. V., Laudon, H., et al. (2015). Spatiotemporal variations of nitrogen isotopic records in the Arabian Sea. Biogeosciences 12, 1–14. doi:10.5194/bg-12-1-2015
Lim, A. G., Loiko, S. V., Kuzmina, D. M., Krickov, I. V., Shirokova, L. S., Kulizhsky, S. P., et al. (2021). Dispersed ground ice of permafrost peatlands: Potential unaccounted carbon, nutrient and metal sources. Chemosphere 266, 128953. Art No 128953. doi:10.1016/j.chemosphere.2020.128953
Liu, S., Kuhn, C., Amatulli, G., Aho, K., Butman, D. E., Allen, G. H., et al. (2022). The importance of hydrology in routing terrestrial carbon to the atmosphere via global streams and rivers. Proc. Natl. Acad. Sci. U. S. A. 119, e2106322119. doi:10.1073/pnas.2106322119
Lundin, E. J., Giesler, R., Persson, A., Thompson, M. S., and Karlsson, J. (2013). Integrating carbon emissions from lakes and streams in a subarctic catchment. J. Geophys. Res. Biogeosci. 118 (3), 1200–1207. doi:10.1002/jgrg.20092
Luo, J., Li, S., Maofei, N., and Zhang, J. (2019). Large spatiotemporal shifts of CO2 partial pressure and CO2 degassing in a monsoonal headwater stream. J. Hydrol. X. 579, 124135. Art No 124135. doi:10.1016/j.jhydrol.2019.124135
Mack, M., Connon, R., Makarieva, O., McLaughlin, J., Nesterova, N., and Quinton, W. (2021). Heterogenous runoff trends in peatland-dominated basins throughout the circumpolar North. Environ. Res. Commun. 3, 075006. Art No. doi:10.1088/2515-7620/ac11ed
Manasypov, R. M., Lim, A. G., Krickov, I. V., Shirokova, L. S., Shevchenko, V. P., Aliev, R. A., et al. (2022). Carbon storage and burial in thermokarst lakes of permafrost peatlands. Biogeochemistry 159, 69–86. doi:10.1007/s10533-022-00914-y
Marie, D., Partensky, F., Vaulot, D., and Brussaard, C. (1999). Enumeration of phytoplankton, bacteria, and viruses in marine samples. Curr. Protoc. Cytom. 10 (1), 11111–111115. doi:10.1002/0471142956.cy1111s10
Mauclet, E., Agnan, Y., Hirst, C., Monhonval, A., Pereira, B., Vandeuren, A., et al. (2022). Changing sub-arctic tundra vegetation upon permafrost degradation: Impact on foliar mineral element cycling. Biogeosciences 19, 2333–2351. doi:10.5194/bg-19-2333-2022
McClelland, J. W., Déry, S. J., Peterson, B. J., Holmes, R. M., and Wood, E. F. (2006). A pan-Arctic evaluation of changes in river discharge during the latter half of the 20th century. Geophys. Res. Lett. 33, L06715. doi:10.1029/2006GL025753
McClelland, J. W., Holmes, R. M., Peterson, B. J., and Strieglitz, M. (2004). Increasing river discharge in the Eurasian Arctic: Consideration of dams, permafrost thaw, and fires as potential agents of change. J. Geophys. Res. 109 (D18), D18102. Art No D18102. doi:10.1029/2004JD004583
Ni, M., Li, S., Luo, J., and Lu, X. (2019). CO2 partial pressure and CO2 degassing in the Daning River of the upper Yangtze River, China. J. Hydrol. X. 569, 483–494. doi:10.1016/j.jhydrol.2018.12.017
Payandi-Rolland, D., Shirokova, L. S., Nakhle, P., Tesfa, M., Abdou, A., Causserand, C., et al. (2020). Aerobic release and biodegradation of dissolved organic matter from frozen peat: Effects of temperature and heterotrophic bacteria. Chem. Geol. 536, 119448. Art No 119448. doi:10.1016/j.chemgeo.2019.119448
Pekel, J. F., Cottam, A., Gorelick, N., and Belward, A. S. (2016). High-resolution mapping of global surface water and its long-term changes. Nature 540, 418–422. doi:10.1038/nature20584
Pokrovsky, O., and Korets, M. (2022). Physio-geographical and landscape (GIS-based) parameters of the Taz River watershed, western Siberia. Elsevier, Amsterdam: Mendeley Data. V1 Available at: https://data.mendeley.com/datasets/5b77njbymz. doi:10.17632/5b77njbymz.1
Pokrovsky, O. S., Lim, A. G., Krickov, I. V., Korets, M. K., Shirokova, L. S., and Vorobyev, S. N. (2022). Hydrochemistry of medium-size pristine rivers in boreal and subarctic zone: Disentangling effect of landscape parameters across a permafrost, climate and vegetation gradient. Water (MDPI) 14, 2250. Art No 2250. doi:10.3390/w14142250
Pokrovsky, O. S., Manasypov, R. M., Kopysov, S. G., Krickov, I. V., Shirokova, L. S., Loiko, S. V., et al. (2020). Impact of permafrost thaw and climate warming on riverine export fluxes of carbon, nutrients and metals in Western Siberia. Water (MDPI) 12, 1817. doi:10.3390/w12061817
Raudina, T. V., Loiko, S. V., Lim, A., Manasypov, R. M., Shirokova, L. S., Istigechev, G. I., et al. (2018). Permafrost thaw and climate warming may decrease the CO2, carbon, and metal concentration in peat soil waters of the Western Siberia Lowland. Sci. Total Environ. 634, 1004–1023. doi:10.1016/j.scitotenv.2018.04.059
Raymond, P. A., McClelland, J. W., Holmes, R. M., Zhulidov, A. V., Mull, K., Peterson, B. J., et al. (2007). Flux and age of dissolved organic carbon exported to the Arctic Ocean: A carbon isotopic study of the five largest arctic rivers. Glob. Biogeochem. Cycles 121. Art No GB4011. doi:10.1029/2007GB002934
Rocher-Ros, G., Sponseller, R. A., Lidberg, W., Mörth, C-M., and Giesler, R. (2019). Landscape process domains drive patterns of CO2 evasion from river networks. Limnol. Oceanogr. Lett. 4, 87–95. doi:10.1002/lol2.10108
Romanovsky, V. E., Drozdov, D. S., Oberman, N. G., Malkova, G. V., Kholodov, A. L., Marchenko, S. S., et al. (2010). Thermal state of permafrost in Russia. Permafr. Periglac. Process. 21, 136–155. doi:10.1002/ppp.683
Rozhdestvensky, A. V., Buzin, V. A., Dobroumov, B. M., Lobanova, A. G., Lobanov, V. A., Plitkin, G. A., et al. (2003). SP 33-101-2003. Svod Pravil. Opredelenie Osnovny Khraschetnykh Gidrologicheskikh Kharakteristik [Set of Rules. Determination of Basic Design Hydrological Characteristics]. Available: https://files.stroyinf.ru/Data2/1/4294815/4294815038.htm (accessed on July 20, 2022).
Santoro, M., Beer, C., Cartus, O., Schmullius, C., Shvidenko, A., McCallum, I., et al. (2010). “The BIOMASAR algorithm: An approach for retrieval of forest growing stock volume using stacks of multi-temporal SAR data,” in Proceedings of ESA Living Planet Symposium, Bergen, Norway, June-2 July 2010, 28. Available at: https://www.researchgate.net/publication/230662433http://pure.iiasa.ac.at/id/eprint/9430/.
Seibert, J., and Vis, M. J. P. (2012). Teaching hydrological modeling with a user-friendly catchment-runoff-model software package. Hydrol. Earth Syst. Sci. 16, 3315–3325. doi:10.5194/hess-16-3315-2012
Serikova, S., Pokrovsky, O. S., Ala-aho, P., Kazantsev, V., Kirpotin, S. N., Kopysov, S. G., et al. (2018). High riverine CO2 emissions at the permafrost boundary of Western Siberia. Nat. Geosci. 11, 825–829. doi:10.1038/s41561-018-0218-1
Serikova, S., Pokrovsky, O. S., Laudon, H., Krickov, I. V., Lim, A. G., Manasypov, R. M., et al. (2019). High carbon emissions from thermokarst lakes of Western Siberia. Nat. Commun. 10, 1552. doi:10.1038/s41467-019-09592-1
Shirokova, L. S., Chupakov, A. V., Zabelina, S. A., Neverova, N. V., Payandi-Rolland, D., Causseraund, C., et al. (2019). Humic surface waters of frozen peat bogs (permafrost zone) are highly resistant to bio- and photodegradation. Biogeosciences 16, 2511–2526. doi:10.5194/bg-16-2511-2019
Stackpoole, S. M., Butman, D. E., Clow, D. W., Verdin, K. L., Gaglioti, B. V., Genet, H., et al. (2017). Inland waters and their role in the carbon cycle of Alaska. Ecol. Appl. 27 (5), 1403–1420. doi:10.1002/eap.1552
Striegl, R. G., Dornblaser, M. M., McDonald, C. P., Rover, J. R., and Stets, E. G. (2012). Carbon dioxide and methane emissions from the Yukon River system. Glob. Biogeochem. Cycles 26, 2012GB004306GB0E05. doi:10.1029/2012GB004306
Tape, K., Sturm, M., and Racine, C. (2006). The evidence for shrub expansion in Northern Alaska and the Pan-Arctic. Glob. Chang. Biol. 12, 686–702. doi:10.1111/j.1365-2486.2006.01128.x
Teodoru, C. R., del Georgio, P. A., Prairie, Y. T., and Camire, M. (2009). Patterns in pCO2 in boreal streams and rivers of northern Quebec, Canada. Glob. Biogeochem. Cycles 23 (2), 1–11. doi:10.1029/2008GB003404
Vorobyev, S. N., Karlsson, J., Kolesnichenko, Y. Y., Korets, M. A., and Pokrovsky, O. S. (2021). Fluvial carbon dioxide emission from the Lena River basin during the spring flood. Biogeosciences 18, 4919–4936. doi:10.5194/bg-18-4919-2021
Wallin, M. B., Grabd, T., Buffam, I., Laudon, H., Agren, A., Oquist, M. G., et al. (2013). Evasion of CO2 from streams - the dominant component of the carbon export through the aquatic conduits in a boreal landscape. Glob. Change Biol. 19 (3), 785–797. doi:10.1111/gcb.12083
Wanninkhof, R. (1992). Relationship between wind speed and gas exchange over the ocean revisited. Limnol. Oceanogr. Methods 97, 351–362. doi:10.4319/lom.2014.12.351
Keywords: CO2, river, export, landscape, Siberia, CH4 (methane), flux, vegetation
Citation: Vorobyev SN, Pokrovsky OS, Korets M and Shirokova LS (2022) A snap-shot assessment of carbon emission and export in a pristine river draining permafrost peatlands (Taz River, Western Siberia). Front. Environ. Sci. 10:987596. doi: 10.3389/fenvs.2022.987596
Received: 06 July 2022; Accepted: 16 November 2022;
Published: 01 December 2022.
Edited by:
Daniel F. McGinnis, Université de Genève, SwitzerlandReviewed by:
Siyue Li, Wuhan Institute of Technology, ChinaCopyright © 2022 Vorobyev, Pokrovsky, Korets and Shirokova. This is an open-access article distributed under the terms of the Creative Commons Attribution License (CC BY). The use, distribution or reproduction in other forums is permitted, provided the original author(s) and the copyright owner(s) are credited and that the original publication in this journal is cited, in accordance with accepted academic practice. No use, distribution or reproduction is permitted which does not comply with these terms.
*Correspondence: Oleg S. Pokrovsky, b2xlZy5wb2tyb3Zza3lAZ2V0Lm9tcC5ldQ==
Disclaimer: All claims expressed in this article are solely those of the authors and do not necessarily represent those of their affiliated organizations, or those of the publisher, the editors and the reviewers. Any product that may be evaluated in this article or claim that may be made by its manufacturer is not guaranteed or endorsed by the publisher.
Research integrity at Frontiers
Learn more about the work of our research integrity team to safeguard the quality of each article we publish.