 Qiuyue Zheng
 Guanghui Jiang1*
 Yaya Tian
- 1School of Natural Resources, Faculty of Geographical Science, Beijing Normal University, Beijing, China
- 2College of Urban and Environmental Sciences, Peking University, Beijing, China
- 3Land Consolidation and Rehabilitation Center, Ministry of Natural Resources, Beijing, China
The construction of infrastructure and public services is the core of countryside planning. As the carrier of rural public services, the evolutionary pattern and efficiency of rural public service land (RPSL) can directly reflect the development of rural public services. However, existing studies have mainly characterized public service space through the number of public service facilities rather than the area of land occupied. Furthermore, research on public service land in rural settlements is lacking. Taking 273 villages in the Pinggu District of Beijing as an example, this article integrated multi-dimensional data, including geospatial data, big data, and socio-economic data, to analyze the spatio-temporal evolution characteristics of RPSL from 2004 to 2019. The bi-dimensional allocation efficiency index addressing qualitative and quantitative development was introduced to measure the allocation efficiency of RPSL. The results show that the area of RPSL in Pinggu District has increased by 57.28 ha, and the internal land use structure of RPSL has become balanced. The evolution pattern of RPSL was characterized by both agglomeration and dispersion, as well as by a significant tendency to expand along main roads. The uneven distribution of public service facilities and the significant differences in accessibility reflected the non-equalization of public services. The allocation efficiency of RPSL in 79.23% of the villages was at a low level, which is mainly due to the mismatch between the rural public service land area and the population, the non-differentiated allocation of public service facilities, the uneven public service quality, and the low accessibility of RPSL. In the future, policymakers should plan rural public service land rationally from the perspective of the actual situation, such as setting flexible indicators, building a living circle of rural settlements, and so on. This research will not only enrich the research perspective of rural public services but also provide a reference for the study on the utilization and optimization of rural settlements.
1 Introduction
Rural public service land (RPSL) is a land use type of rural construction land and the main part of rural residential areas (Ma et al., 2018). With the new urbanization, the lifestyle of the rural population has gradually changed from rural to urban, and the demand for public services has become stronger (Li et al., 2006). As the carrier of rural public services (Han et al., 2015), the area and structure of RPSL are bound to change significantly (Qu et al., 2018; Qu et al., 2021). It has become an important research field of rural geography and urban–rural planning to grasp the evolutionary patterns of RPSL scientifically.
The definition and scope of public service land vary in countries and regions, but the connotation is similar (Sun and Liang, 2002). Public service land is a unique category of land use in China, which covers a wide range of land with public service functions (for example, education, administration, and healthcare). However, there is no land use type named “public service land” in the land use classification systems of Britain, the United States, Hong Kong, and other countries and regions. Instead, it is split or combined according to public service functions. For instance, in the UK, land for education is classified as non-residential institutions along with land for healthcare, childcare, museums, and libraries, while in Hong Kong, it is classified as a separate category named educational land (Gao and Su, 2010; Marjan et al., 2011). The classification of public service land is usually based on function (Sun and Liang, 2002), profitability (Xu and Li, 2012), resident demand (Xu et al., 2013), spatial distribution (Yang and Zhao, 2002), and availability (Lineberry, 1974).
Due to the different definitions of public service land, the research on the utilization of public service land has gradually shifted to specific and microscopic by focusing on public service facilities (PSFs) (Gao and Zhou, 2009; Robert et al., 2018). Generally, research objects are hospitals, parks, schools, etc. (Meier et al., 1991; Talen, 1997; Aseel and Vincent, 2020). The research content mainly includes PSF’s provision (Greenhut and Mai, 1980; Mohammad, 1995; Gao et al., 2010; Zhou and Gao, 2011; Luis et al., 2019), accessibility (Austin, 1974; Orloff, 1977; Tsou et al., 2005; Song et al., 2010), location selection (Teitz, 1968; John, 1981; Liu and Li, 2010), efficiency and fairness (Church and ReVelle, 1976; McAllister, 1976; Bigman and ReVelle, 1978; Zhang and Zhou, 2020), layout (Wolpert, 1976; Rich, 1979; Perl and Ho, 1990; Barbera and Bevia, 2006; Han et al., 2019), effectiveness (Lan et al., 2018; Xu et al., 2022) and so on. In recent years, the equalization of public services has become a hot research topic (Thisse and Wildasin, 1992; Hosseini et al., 2021). The primary research approach is to measure the equality of public services through spatial distribution (Zhu et al., 2010; Song et al., 2012; Sui et al., 2015; Davis et al., 2020; Luo and Sun, 2020; Lee, 2021) or quality (Le Huu et al., 2011; Tervo et al., 2013; Fauster et al., 2017; Liu et al., 2019) of public service facilities and then to propose ways of rationally allocating public service land (Miranda and Tunyavong, 1994; Talen, 1998).
Although the relevant studies have been conducted intensively and achieved rich results, most of them take the urban settlements as the study areas (Meng et al., 2021). In other words, there is a research gap related to public service land in rural settlements. With the introduction of various policies that focus on rural issues, such as the rural revitalization strategy in China, studies on rural settlements have received increasing attention (Ma et al., 2022). Correspondingly, the internal land use structure of rural settlements has been a major focus (Tian et al., 2022). As one land use type of rural residential land, RPSL’s area and distribution directly impact the efficiency of rural residential land, as well as the effectiveness and fairness of rural public services (Gao and Tang, 2018) (Luo and Sun, 2020). Therefore, it is necessary to study public service land in rural settlements.
Through literature review, scholars have mainly considered public facilities as a point. The scale of public service facilities is represented through the number of points rather than the area of land occupied (Luo and Wang, 2003; Lv and Yan, 2018; Wei, 2021). As a result, a few studies examine public service spaces by land use data. In addition, most of the existing studies focus on the status of public service facilities in a particular year and lack evolution over a long period (Samuelson, 1954; Demsetz, 1970; Fei and Yao, 2009). From the perspective of geography, this article attempts to study the spatio-temporal evolution of rural public service land by land use data spanning 15 years.
The description of the evolution pattern and utilization characteristics of rural public service land can enrich the research results of rural geography. On the other hand, it can guide the spatial allocation of rural settlements from the equalization of public services. Given this, taking 273 villages in the Pinggu District of Beijing as an example, this article analyzed the spatio-temporal evolution characteristics of RPSL from 2004 to 2019 by integrating multi-dimensional data, including geospatial data, network big data, and socio-economic data. The bi-dimensional allocation efficiency index addressing qualitative and quantitative development was introduced to measure the allocation efficiency of RPSL.
The rest of this article is organized as follows: Section 2 introduces the study area, research methods, and data sources. Section 3 describes the spatio-temporal pattern and the allocation efficiency of RPSL. Section 4 discusses the phenomena involved and suggests an appropriate development direction. Section 5 summarizes the findings by referring to existing literature and the key implications for policymakers and researchers are highlighted.
2 Methodology and data
2.1 Study area
As the capital of China, Beijing is the national center of politics, culture, international intercourse, and technological innovation, as well as a modern international metropolis. Pinggu District is one of the suburbs of Beijing. Driven by the radiation of the central area of Beijing, Pinggu District has seen rapid urbanization and non-agriculturalization. The rising living standards of inhabitants have placed higher demands on public services such as hospitals and schools. Therefore, Pinggu District can be used as a typical case to study the rural public service land in metropolitan suburbs.
Pinggu (40°02′–40°22′N, 116°55′21″–117°24′07″E) lies in the northeast of Beijing (Figure 1). The widest distance from east to west is 40.25 km, and the longest distance from north to south is 38.5 km. It locates at the junction of Beijing, Tianjin, and Hebei provinces, with an advantaged location and traffic conditions. In terms of topography, Pinggu District is low in the southwest and high in the northeast. Pinggu District is surrounded by mountains on three sides, showing topographic features of 1:1:1, with mountains of 1/3 (in the north), shallow mountains of 1/3 (in the southeast), and plains of 1/3 (in the southwest). Pinggu District consists of 16 towns and 273 administrative villages. According to the 2019 Pinggu Statistical Bureau, the population was approximately 456 thousand, of which the rural population was about 192 thousand.
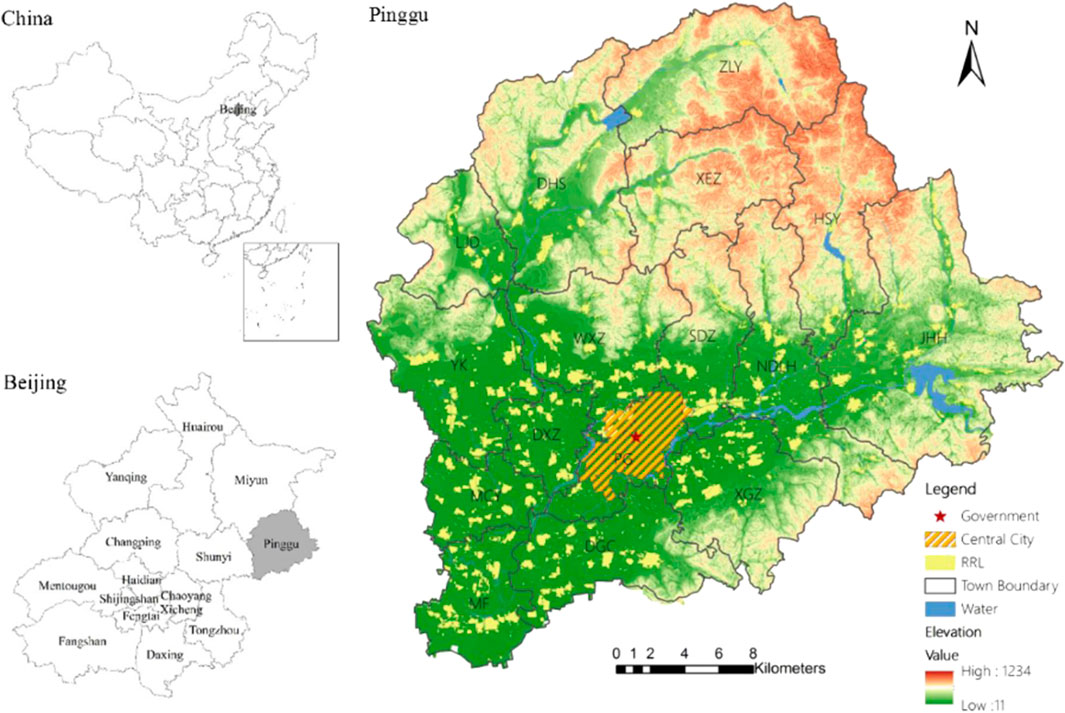
FIGURE 1. The geographical location of Pinggu.
2.2 Research methods
2.2.1 Characterizing the spatial differentiation of rural public service land
Kernel density analysis takes a certain regular area around any point in space as the calculation range. It analyzes the spatial distribution trend of the observed objects by calculating the density of the observed data in the area. The data points close to the center point are given a higher weight, otherwise a lower weight. The estimated density of each point is the weighted average density of all points in the region. We used the kernel density analysis tool in ArcGIS 10.2 to analyze the kernel density of rural public service land in Pinggu District and visualize its spatial clustering.
In formula (1), Pi is the kernel density of any rural public service land. Kj is the weight of the object j. Dij is the distance between point i and object j. R is the bandwidth of the selected regular area (Dij < R). n is the number of objects within the range of bandwidth R.
2.2.2 Evaluating the basic public service capacity
Basic public service capacity (BPSC) represents the quality of public services provided by the local government through finance and other ways. It is also a vital indicator to reflect the utilization efficiency of public service land. We construct an evaluation system consisting of 15 indicators (Table 1) to evaluate the BPSC of 273 villages in Pinggu District in 2019. The evaluation index system covers three dimensions of BPSC: guaranteed service capacity, essential service capacity, and developmental service capacity.
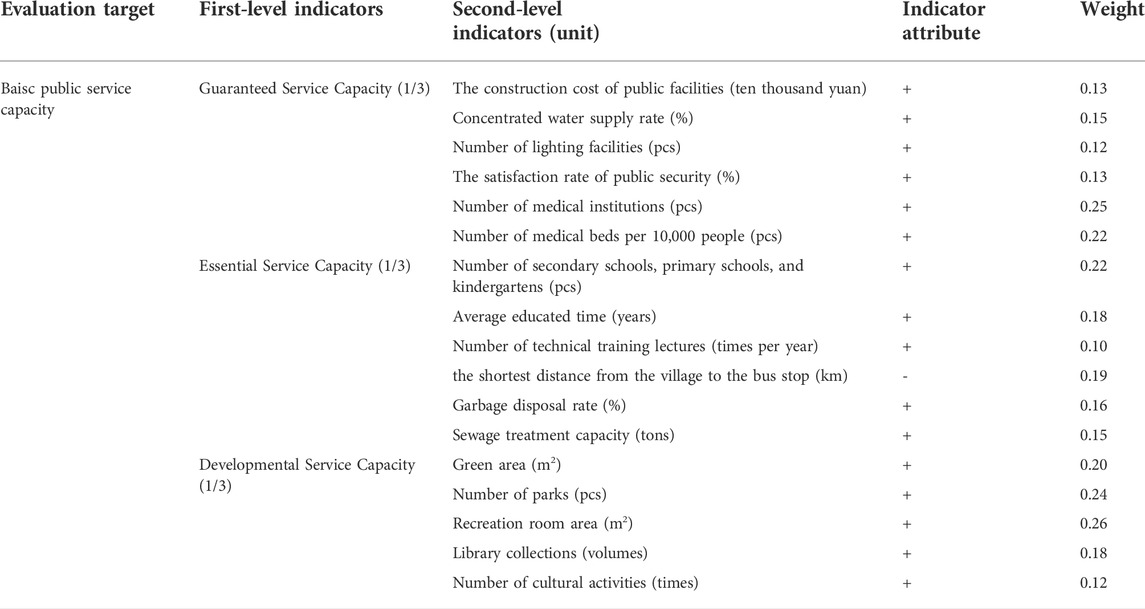
TABLE 1. Evaluation index system of basic public service capacity.
The guaranteed service capacity refers to the ability to ensure the residents’ survival and security, mainly reflected in infrastructures and medical resources. The construction cost of public facilities represents the government’s financial investment in public services and is selected as a positive indicator. Water, electricity, and security are critical to modern life. Three indicators were selected to characterize: concentrated water supply rate, the number of lighting facilities, and the satisfaction rate of public security, with higher values indicating greater guaranteed service capacity. The supply of medical resources is reflected by the number of medical institutions and the number of medical beds per 10,000 people, both of which are positive indicators.
The essential service capacity refers to the ability to meet the residents’ living and production needs, including four aspects: education, convenient transportation, employment security, and sanitation. In terms of education, this article selected two indicators. Specifically, the number of educational institutions (secondary schools, primary schools, and kindergartens) was selected to represent the government’s investment in public education. Moreover, the average educated time characterized the educational attainment of the population. Both of them are positive indicators. The higher the value, the better the public education services. Travel convenience is measured by the shortest distance from the village to the bus stop. It is a negative indicator. The greater the value, the longer the distance, and the lower the ease of access. Technical training seminars are one method of enhancing employment, so this article selected the number of technical training lectures as a positive indicator. In terms of sanitation, waste disposal and sewage treatment are particularly important, so the garbage disposal rate and the sewage treatment capacity were chosen as positive indicators.
With the improvement of material living standards, people are gradually focusing on the enjoyment of the spiritual world. The developmental service capacity refers to the ability to meet the residents’ entertainment and social needs (Xu et al., 2013). We chose five indicators: green area, number of parks, recreation room area, library collections, and the number of cultural activities, respectively. All five indicators are positive, with the first two reflecting the space of residents’ activities and the last three representing the diversity of their recreational choices.
Regardless of the dimension of basic public service capacity, it is closely related to people’s life and social development, and there is no difference in importance. Therefore, the three dimensions in the above index system are given the same weight, i.e., 1/3. The entropy method was used to determine the weight of each second-level indicator. The formula for calculating the basic public service capacity is given as follows:
where Mi is the basic public service capacity of i village, Wj is the weight of j indicators, and X’ij is the standardized value of j indicators.
2.2.3 Constructing the accessibility model of rural public service land
Generally, accessibility can be divided into geospatial accessibility and traffic accessibility (Penchansky and Thomas, 1981). Geospatial accessibility is measured by calculating the spatial distance between the demand point and the supply point. Traffic accessibility refers to calculating the shortest distance between traffic networks based on the impedance and capacity of each class of road. In this research, Voronoi was used to measure the geospatial accessibility of rural public service land in Pinggu District and the gravity model was used to measure traffic accessibility.
2.2.3.1 Geospatial accessibility based on Voronoi
Voronoi (Thiessen polygon) can break the boundary of administrative division and truly reflect the spatial accessibility of rural public service land. Only one generator exists in a Thiessen polygon, and the distance from any point in the polygon to the generator is closer than its distance to a generator in another polygon. In this research, the generator refers to the rural public service land parcels. People will prioritize the nearest public service land to obtain public services. Therefore, the area of the Thiessen polygon can be used as an indicator to measure geospatial accessibility. The smaller the area of the Thiessen polygon, the higher the level of geospatial accessibility.
2.2.3.2 Traffic accessibility based on the gravity model
The improved gravity model will be introduced to calculate the traffic accessibility of rural public service land (Yang and Xu, 2015), which consists of three elements: origin, destination, and connectivity, as illustrated in the following formula:
where Si indicates the gravitational accessibility from village i to RPSL, and the larger the Si, the better; n and m are the number of RPSL and village centroids in the study area, respectively; Mj indicates the attractiveness of RPSL j, which is expressed by the area of RPSL; Dij indicates the shortest path distance from village i to RPSL j; Vj is the influencing factor of population size; Pk indicates the resident population of the village; It is generally believed that the value of β changes according to the changes of various influencing factors. By referring to previous studies, it can be found that the value of β is generally concentrated in the range of 0.90–2.29, and when the value of β is between 1.5 and 2, the influence on the research results is weak. Therefore, the value of β is 2 in this article.
2.2.4 Measuring the allocation efficiency of rural public service land
Rural public service land is a kind of non-profit land type. The efficiency of rural public service land is not marked by maximizing economic output but rather by the values of rural public service. Hence, this study considers the allocation efficiency of RPSL as the public service value produced per unit area of RPSL. Furthermore, this study created a model for allocation efficiency of rural public service land, which takes the area of RPSL per capita as an input factor and the public service values of RPSL as an output factor. The public service values of RPSL are mainly reflected in both quantity and quality. The former is represented by the number of rural public service facilities, while the latter is mainly reflected in two aspects, namely the accessibility of rural public service land and the level of basic public services capacity. A system of indicators for evaluating the allocation efficiency of rural public service land is detailed in Table 2.
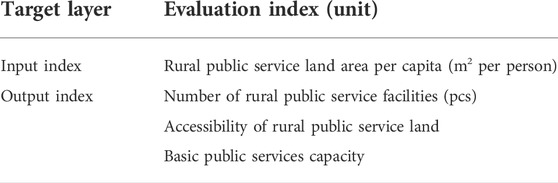
TABLE 2. Evaluation index system of allocation efficiency of RPSL.
The model for measuring the allocation efficiency of rural public service land is shown as follows:
where Ei is the allocation efficiency of RPSL of village i, S’i is the accessibility of RPSL of village i after normalization, M’i is the basic public service capacity of village i after normalization, F’i is the number of public service facilities of village i after normalization, L’i is the per capita area of RPSL in village i after normalization.
2.3 Data
2.3.1 Data source
Land use change data of Pinggu in 2004 and 2019 were obtained from the Beijing Municipal Commission of Planning and Natural Resources, with the accuracy of 1:10000. The socio-economic data of Pinggu in 2004 and 2019 were obtained from the socio-economic statistical yearbooks and economic management stations of Pinggu District. The POI data in 2019 was crawled from Google Maps by data crawler technology, including six attributes: longitude, latitude, name, address, type, and administrative region (Table 3).
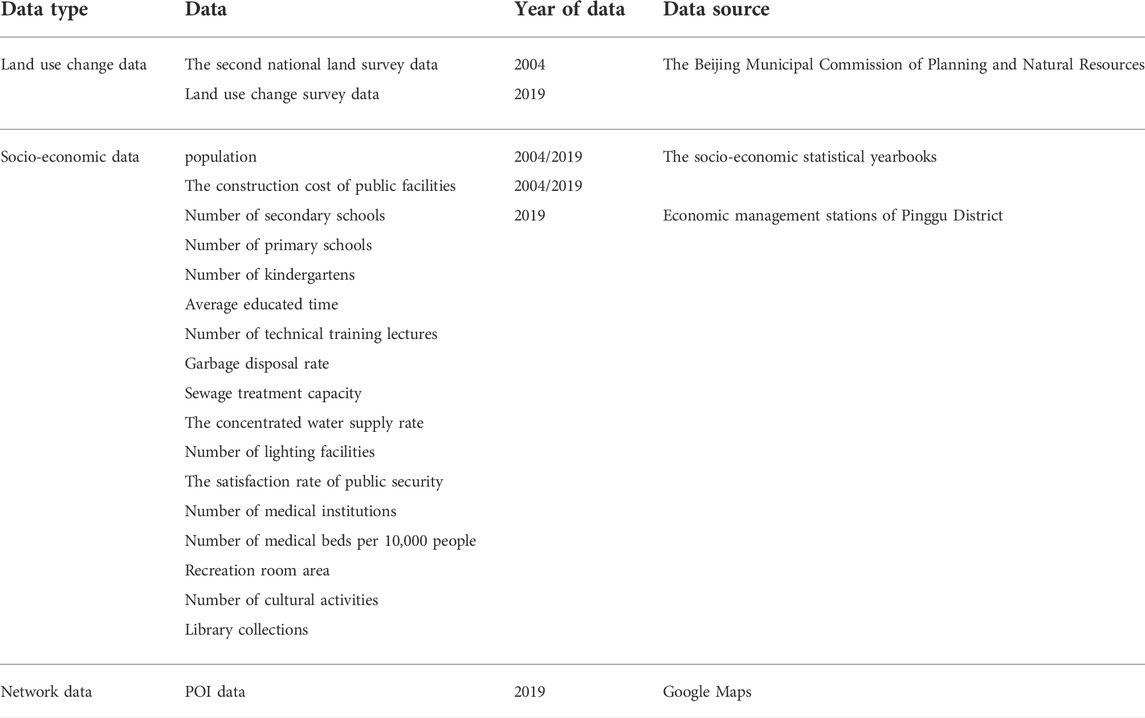
TABLE 3. Dataset.
2.3.2 Data processing
This research defined rural public service land (RPSL) as independent rural settlements’ land used for healthcare, public facilities, public education, administration, sports entertainment, parks, and green space. From the attributes perspective, rural public service land belongs to rural residential areas. Therefore, the spatial data of RPSL can be extracted from land use change survey data. First, we used ArcGIS to extract rural settlements in Pinggu District in 2004 and 2019 (the field is CZCSXM and the code is 203). And then, we extract the public service land from the rural settlements (the field is DLDM and the code is 08). Thus, the database of rural public service land in Pinggu District is established, including public facilities land, park and green space, organization land, science and education land, sports and recreation land, health and charity land, and scenic land.
3 Results and analysis
3.1 Spatio-temporal evolution characteristics of rural public service land
3.1.1 Time series change of rural public service land
During the study period, the area of rural settlements in the Pinggu District expanded (from 5,536.09 ha to 6,075.97 ha). Meanwhile, the area of rural public service land also increased, expanding from 329.24 ha in 2004 to 386.53 ha in 2019. The increase in RPSL was 57.28 ha, accounting for 10.61% of the total expansion of rural settlements. The proportion of RPSL in rural residential areas has also increased, from 5.95% to 6.36%. Among the 273 villages in Pinggu District, 193 villages have increased the rural public service land area. The rural public service land area per capita decreased from 10.22 m2 per person in 2004 to 9.57 m2 per person in 2019, but it is still higher than the maximum of 7.6 m2 per person in CECS354:2013 (Standardization Corporate Average Fuel Economy, 2013). In 2019, 153 villages had more than 7.6 m2 per person of the rural public service land area per capita, representing 58.85% of the total number of villages.
In terms of internal structural changes, in 2004, the rural public service land in Pinggu District was dominated by land for science, education, culture, and health, with a high proportion of 54.00%, and its share declined to 43.8% in 2019. Accordingly, the proportion of public facilities land and administration land increased from 4.33% to 20.01%–30.60% and 22.71%, respectively. It indicates that the structure of rural public service land is becoming more balanced and diversified. In the early years, rural residents’ demand for public services mainly revolved around basic public services such as medical treatment and education. In 2004, China launched the construction of a new socialist countryside with the main focus on the cleanliness of villages and the improvement of facilities. Basic public service facilities such as water, roads, electricity, gas, and networks have been continuously improved, and the land for public facilities has significantly increased. In addition, Pinggu, as a suburb of the metropolis, has seen a continuous rise in social and economic development and the material living standards of its people. Rural residents have also developed higher demands for the residential environment, public safety, culture, and recreation, as evidenced by the increased area of administration land.
Over the 15 years, the rural public service land in Pinggu District has expanded by about 17.40%. Comparing the changes in different towns, we can find that the expansion of rural public service land in towns located in remote mountainous areas is significantly higher than that in other towns. For instance, XEZ increased by 83.99% and DHS by 66.65%, while the growth rate of DXZ, which is located around the central city, is relatively low at 10.08%. To some extent, this significant regional difference can reflect the local government’s support for the construction of public services in remote areas. The villages located in the central area benefit from the radiating effect of the central city and already have a good foundation for public services construction. The rural public service land is no longer obsessed with the expansion of area but is developing in the direction of improving quality and efficiency.
3.1.2 Spatial pattern of rural public service land
This study analyzed the spatial distribution characteristics of rural public service land in the Pinggu District. As shown in Figure 2A, the rural public service land in Pinggu District shows a clear pole-nucleus distribution, with a spatial pattern of dense in the southwest and sparse in the northeast, which is consistent with the low topography in the southwest and high in the northeast of Pinggu District. The high-density poles concentrate in the PG urban fringe, the MF industrial zone, and the center of townships. These areas have obvious commonalities, that is, excellent location, convenient transportation, and a high level of socio-economic development, which can provide material conditions for the construction of rural public services and guarantee the development of public services. In contrast, the low-density poles are distributed in the mountainous areas of the northeast, where the transport network is irregular, and the rural settlements are scattered due to the mountainous terrain. As a result, rural public service land is also relatively scattered and fails to show some agglomeration.

FIGURE 2. The spatial distribution of RPSL in Pinggu.
According to Figure 2B, the density of high-density poles has increased continuously over 15 years. It formed a large medium-density area with the surrounding areas, showing a trend of concentrated contiguity. It means that the public service centers in Pinggu District are being improved, and their functions are being upgraded during the study period. At the same time, the diffusion pattern of rural public service land is reflected in the formation of many new agglomerations in the northern mountainous areas. It can be seen that the planning and development of rural public service land in the Pinggu District have gradually shifted to the periphery areas of the central city, which is constantly filling up the shortage of rural public service land in the northern mountain areas. In general, the spatial distribution of public service land in Pinggu District has become increasingly balanced over the study period under agglomeration and diffusion. The agglomeration evolutionary pattern is formed by the fact that the central town has an absolute advantage in terms of gathering the best public services. Conversely, the pattern of diffuse evolution is shaped by the forced marginalization of remote rural areas, which constrain the development of public services.
By extracting the rural public service land within 200m and 400 m of the main roads (Figure 2C), we found that more than 85% of the rural public service land in the Pinggu district distribute along major transport routes. The proportion of rural public service land within 200 m along the main roads is as high as 50%, which is getting larger during the study period, reaching more than 62.56% in 2019. This result implies a significant trend in expanding rural public service land along major roads. As for the reasons, topography and accessibility are factors that are taken into account when planning and developing rural public service land. Rural public service land is often planned in areas that are easily accessible in order to cover a larger area, such as on both sides of main roads and at village entrances on flat terrain.
According to Figure 3A, there are significant regional differences in rural public service land area per capita in Pinggu District. There are two high-value areas, one of which is located in the northern mountainous, such as DW village, whose RPSL area per capita was as high as 124.56 m2 per person in 2019. DW village has a small population of only 146 people, which is one of the reasons for its high rural public service land area per capita. Another high-value area is the edge of the central city, such as XSQ village, with a rural public service land area per capita of 51.94 m2 per person, which is close to the central city and has an adequate supply of rural public service land. Accordingly, rural public service land area per capita is at a high level in XSW village. It is urgent to strengthen intensive utilization.
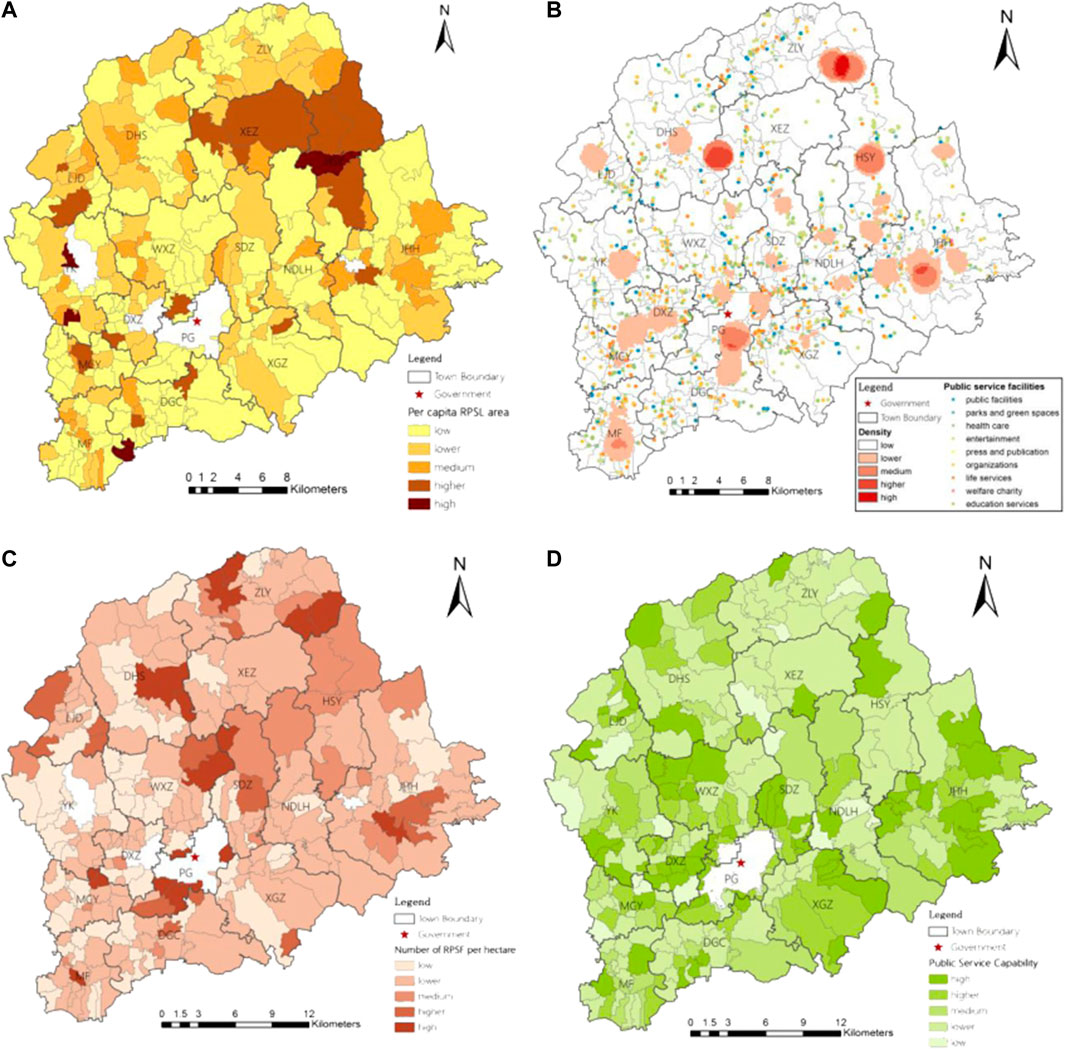
FIGURE 3. The public service values of RPSL in Pinggu.
3.2 Public service values of rural public service land
3.2.1 Construction of rural public service facilities
According to statistics, in 2019, the number of public service facilities built within rural settlements in Pinggu District totaled 3,721, including nine types of public facilities, parks and green spaces, healthcare, welfare charity, education services, organization, entertainment, press and publication, and living services. The spatial distribution of rural public service facilities in Pinggu District is closely related to the village system, with a number of clusters (Figure 3B). In other words, the rural public service facilities are clustered around the town centers, and the aggregation is weakened with the reduction of the village system level.
In 2019, the number of rural public service facilities in the Pinggu District was 3.27 pcs per hectare. According to Figure 3C, there is a significant spatial difference in the number of rural public service facilities per hectare, showing a spatial pattern of high in the north and low in the south. On the one hand, for the northern mountainous areas, due to the topography and socio-economic level, it is difficult to develop and utilize the land, and the construction of rural public service facilities can only be concentrated on the limited land. On the other hand, the central and southern regions have a larger area of rural public service land and well-equipped rural public service facilities. However, the rural public service facilities are scattered, which reduces the number of rural public service facilities per hectare to a certain extent. With limited rural public service land, the Pinggu district is relatively well served by public service facilities, but there are also significant differences between villages.
3.2.2 Level of the basic public service capacity
Basic public service capacity represents the quality of public services provided by the local government through finance and other ways (Wang, 2010). In this study, it is regarded as one of the indicators reflecting the public service values of RPSL in the Pinggu District. The basic public service capacity level is measured according to the index system (Table 1) shown in Figure 3D.
The evaluation score for basic rural public service capacity in Pinggu District is about 2.027. There are great differences between villages, the village with the highest evaluation score is located in WJZ village at 3.272, while the lowest score is only 0.620, which is LHS village in JHH township. The gap in scores between the two villages reached more than five times. According to Figure 3D, basic public service capacity is higher in peri-urban villages than in remote villages and higher in plain villages than in mountainous villages. To summarize, basic public service capacity in the Pinggu District is characterized by “towns > villages” and “central villages > peripheral villages.” Under China’s dualistic urban-rural structure, advantageous resources tend to tile towards the central cities and towns. In the case of Pinggu, the central towns have absolute regional advantages in providing public services such as education and healthcare. In addition, most of the road networks in the central towns arrange in a grid, which contributes to even distribution and high overall coverage of public service facilities. Accordingly, the basic public service capacity is high.
3.2.3 Accessibility of rural public service land
With the help of the Voronoi model, this study measures the accessibility of rural public service land in Pinggu District under ideal conditions. The results show that the geographical accessibility of rural public service land in the Pinggu District is seriously polarized. Specifically, the smallest Tyson polygon is only 90 m2 in YGZ village around the urban area of Pinggu, which means that people can access public services within a 90 m2 area. However, in HY village, the nearest public services available to residents are up to 10^6m2. The gap in geographical accessibility between the two villages is great. According to Figure 4A, geographical accessibility shows a circled expansion that gradually decays outwards from the central town. Specifically, the Tyson polygons in Pinggu town and MF town are small in area but large in number, while the Tyson polygons in the northern areas are much larger than the former but smaller in number. It indicates that the closer to the center area of Pinggu, the greater the accessibility of residents to public services.
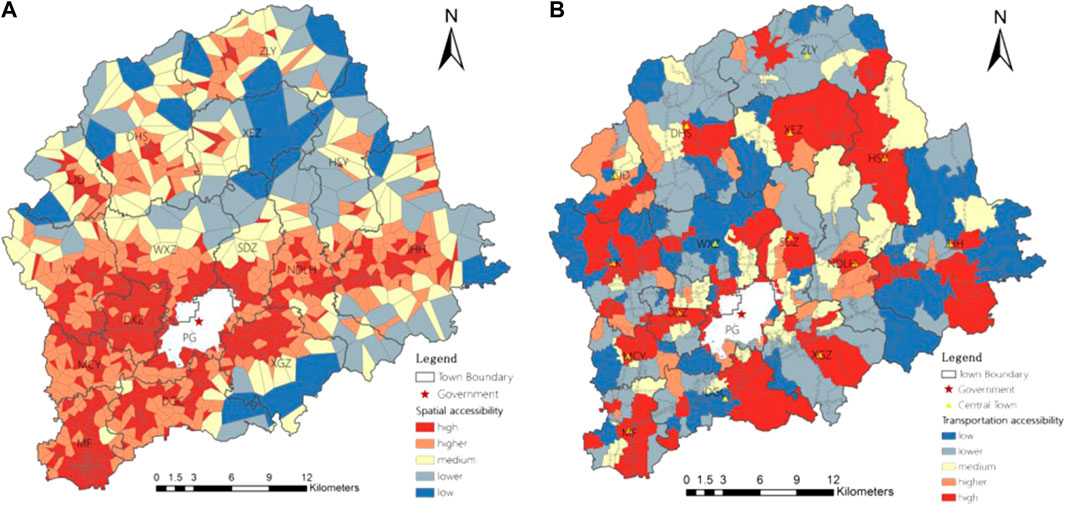
FIGURE 4. The accessibility of RPSL in Pinggu.
The above is the ideal accessibility of rural public service land. In fact, the accessibility of rural public service land will not be ideal due to the influence of the traffic road network and the slope of the terrain. Therefore, this study further describes the traffic accessibility of RPSL in the Pinggu District by analyzing the shortest distance between traffic networks. The visualization results are shown in Figure 4B. The results show that the average traffic accessibility of RPSL in Pinggu District is about 52.69. The highest value of 345.28 is located in LY village of MF town, and the lowest value is in DYS village of ZLY town at only 2.32, a difference of nearly 150 times. There is a large gap in traffic accessibility of RPSL between villages. It also reflects, to a certain extent, the uneven distribution of rural public service land in the Pinggu District.
According to Figure 4B, there is a consistency between the areas with high traffic accessibility of RPSL and the township centers. In other words, the spatial pattern of traffic accessibility of RPSL in Pinggu is centered on the central town. In addition, it is not difficult to see that the areas with high traffic accessibility are obviously distributed along the main traffic routes, and their levels are closely related to the density of the road network. On the one hand, the well-developed transport infrastructure and transport road network in the central towns bring convenience in accessing public services, thus enabling the public services in the central towns to serve both the local area and the surrounding area. On the other hand, villages with poor economic development lack public services, as well as the roads can only be built according to the terrain, making the road network within the village irregular, which has a significant impact on the accessibility of public services.
3.3 Allocation efficiency of rural public service land
According to the model for allocation efficiency of rural public service land, the allocation efficiency of RPSL in Pinggu District is measured, and we divided it into five levels: high level, higher level, medium level, lower level, and low level. The number and proportion of villages at different levels are shown in Table 4.
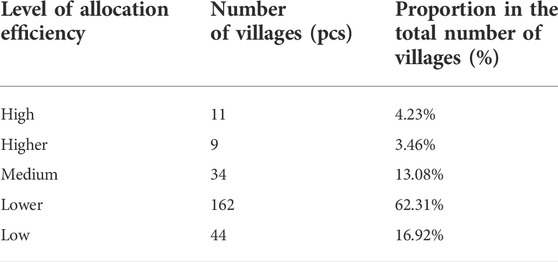
TABLE 4. The allocation efficiency of rural public service land in Pinggu.
In 2019, the allocation efficiency index of rural public service land in Pinggu District was 0.690. Only 54 villages reached the medium level and above (with an allocation efficiency index of 0.690 or above), accounting for 20.77% of the total number of villages. Only 4.23% of the villages had high allocation efficiency, while 79.23% were below the lower level. Clearly, the rural public service land has not been fully and rationally utilized, and there is a waste of resources with a mismatch between inputs and outputs. Significant differences are found when comparing the allocation efficiency of rural public service land in different villages. For example, there is a large disparity in the allocation efficiency index between the XNJY village and TZY village, also located in the DHS town, with the former being as high as 7.181, while the latter is only 0.015. This regional difference is also visually reflected in space. According to Figure 5, the areas with low allocation efficiency occupy most of the Pinggu District, while the high-level areas show a circled distribution centered on the central town.
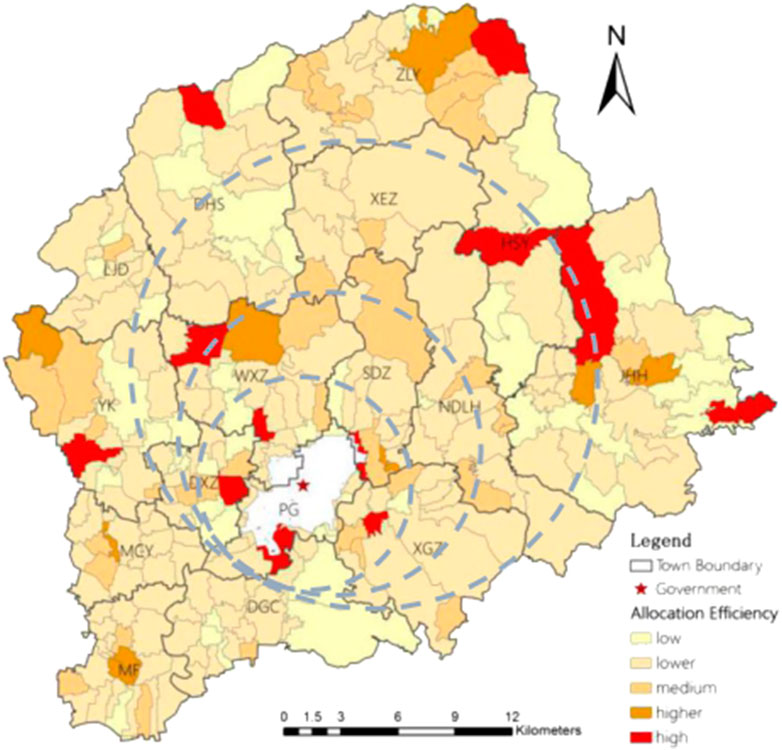
FIGURE 5. The allocation efficiency of RPSL in Pinggu.
Obviously, the use of rural public service land in the Pinggu District is inefficient. In recent years, China has increased investment in rural public services in the context of building a new socialist countryside. Moreover, rural public service land has been planned and developed, which has contributed to an effective improvement of public services in the suburbs of metropolitan areas such as Pinggu. However, excessive development, extensive utilization, and poor quality of public services will make the low allocation efficiency of rural public service land. These three scenarios are explained in detail below.
First, there may be a mismatch between the planned rural public service land and the actual situation. Although the government has planned a large area of land to construct public service facilities, only a small proportion of the land area is actually utilized, or even a large area of land is idle. Alternatively, undifferentiated planning between villages has resulted in the land area not matching the actual population, resulting in the crude and inefficient use of rural public service land. Second, in some areas, even though there is a suitable area of RPSL, there may be problems with public service facilities, such as a small number of facilities, poor equipment, low coverage, and substandard quality. In addition, the undifferentiated scale and content of the facilities may lead to homogenization and a lack of personalized services. Rural residents prefer to spend time and money to enjoy quality public services in the central town rather than settle for less. This results in an inefficient situation where facilities are available but not used. Third, Pinggu has a large mountainous and semi-mountainous area with relatively complex topographical conditions, which limit the development of rural public service land in villages in mountainous areas. The rural public service land is often concentrated on the sides of main roads or at the entrances to villages with flat terrain. Moreover, the accessibility of rural public service land in remote villages is low. It would somewhat impact the efficiency of rural public service land use.
4 Discussion
4.1 Growing and diversified demand for rural public service land
During the study period, the increase in rural public service land in Pinggu District accounted for 10.61% of the total increase in rural residential areas. In fact, the expansion of rural public service land has become a common phenomenon in the metropolitan suburbs with rapid urbanization represented by Pinggu. Since the 21st century, China has started to follow the development path of promoting agricultural development through industry and rural development through urban development. To realize it, China has begun to pay attention to the issues relating to agriculture, rural areas, and farmers. The government has provided policy preference to the development of agriculture, rural areas, and farmers, including increased public financial support for agriculture. Since 2004, China launched a new socialist countryside construction and has taken a series of measures to strengthen the public services, including strengthening the construction of rural infrastructures such as irrigation and water conservancy and rural roads and increasing financial investment in compulsory education and medical conditions in rural areas, etc. These measures aim to allow public services to reach more rural areas and benefit farmers. Public financial support for rural public services has directly contributed to expanding and restructuring rural public service land as a spatial carrier of various public facilities.
Although the national supply of public services is increasing, there is still a great demand for public service land in most rural areas. Villages located in the suburbs of metropolitan areas are more likely to be driven by the radiation of the metropolis than other remote areas. As a result, these villages tend to have a more pressing need for road network improvements, infrastructure construction, and improved educational and medical resources. It also requires the government to plan more rural public service land to ensure the physical basis for constructing public service systems. However, in Pinggu District, a metropolis suburb with a population of over 400,000, the proportion of rural public service land in rural residential areas has increased from 5.95% to 6.36% but still falls short of the standard line (10%) (Standardization Corporate Average Fuel Economy, 2013). The supply of rural public service land in remote areas is still critical, given the inadequate area of rural public service land in the metropolis suburb.
In the future, the relevant government departments should dynamically adjust the supply of rural public service land to adapt to the increasingly diversified demand for public services. In the early years, people’s demand for public services was elementary, mainly for basic public services such as medical treatment and education for children. Rural public service land was mainly used for rural infrastructure construction, such as road hardening, installation of street lights, conversion of toilets and kitchens, and construction of rubbish disposal stations. In recent years, with the development of humanism, the connotation of farmers has begun to change substantially. Farmers are no longer passive identities traditionally bound to the land but modern individuals with an independent spirit. Especially in the rural areas of well-developed regions such as metropolitan suburbs, the non-agriculturalization and the rise in material living standards have prompted a significant shift in the farmers’ demand for public services. Not only do farmers have a strong demand for basic public services, but they also have more diversified needs in terms of spiritual and emotional experiences such as the living environment, public safety, and recreation. Moreover, they even put forward higher requirements for the quality of public services. Therefore, policymakers and planners should plan rural public service land rationally from the perspective of rural residents in the future. It can be done by setting flexible indicators for rural public service land to adapt to the changing public service needs of residents dynamically.
4.2 Spatial imbalance in the allocation of rural public service land
The rural public service land in Pinggu District presents a clear pole-nucleus distribution, with a spatial pattern of dense in the southwest and sparse in the northeast. The rural public service land area per capita is obviously polarized. In addition, the public service values of RPSL in Pinggu District show significant regional differences, which are inflected in three aspects: the rural public service facilities are clustered around the town centers, and the aggregation weakened with the reduction of the village system level; basic public service capacity in the Pinggu District is characterized by “towns > villages” and “central villages > peripheral villages”; the high-level traffic accessibility of RPSL in Pinggu centers on the central town. It is not difficult to find that these high-value areas are all areas with good location, transportation, and socio-economic development. To some extent, it also reflects the uneven spatial allocation of rural public service land due to differences in the socio-economic development of the countryside.
The uneven spatial allocation of rural public service land reveals the reality of the non-equalization of public services. Under China’s dualistic urban-rural structure, advantageous resources tend to tile towards the central cities and towns, which has also brought about the non-equalization of public services (Gao and Tang, 2018). In general, as the forerunner areas of urbanization, the central towns have an absolute advantage in supplying rural public service land. It also can gather the best educational, cultural, and medical resources in the region. Also, with the advantages of a dense road network, a wide range of public service facilities, and a high overall coverage rate, it can naturally radiate to the surrounding villages and drive basic public service capacity. However, remote rural areas are forced to be marginalized due to the limited radiation range. The backwardness of economic development affects the supply of social resources, which in turn makes the high-quality resources scarce, as evidenced by the lack of rural public service land, the low standard of public service facilities, and the low quality of public services. Furthermore, the low level of economic development has led to a massive outflow of the population in rural areas, which has restricted the development of public services. Rural areas are trapped in a situation where the quality of public services is low and difficult to improve. For example, a village is well-equipped for medical care, but there are no doctors or doctors with no specialist skills. In this way, the gap is gradually widened.
The equalization of public services is a critical path to realizing the integrated development of urban and rural areas. The rational allocation of rural public service land is the cornerstone for realizing the equalization of public services. In the future, it is proposed to build a living circle of rural settlements based on the public service needs of residents and to optimize the allocation of rural public service land based on the living circle. Second, it is suggested that the government should improve the planning for the construction of public service systems to build a public service system with a clear hierarchy and complete content, thereby promoting an even spatial distribution of public service facilities. Last but not least, the urban-rural disparity is inevitable to a certain extent, so it is recommended that policymakers appropriately shift their focus from the urban-rural disparity to the rural-rural disparity. To achieve the goal of equalization of public services by giving preferential policies to remote and backward villages.
4.3 Inefficient utilization of rural public service land
In Pinggu District, 79.23% of the villages have a low allocation efficiency of rural public service land. It indicates that the rural public service land has not been fully and rationally utilized and that there is a waste of resources with a mismatch between inputs and outputs. Specifically, it is evident in four aspects. First, there is a mismatch between the area of rural public service land and the population. Second, there is no differentiated way of allocating public service facilities. Third, the quality of public services varies. Fourth, the accessibility of rural public service land is low. It means that the allocation of rural public service land in Pinggu District is not reasonable, and its growth and imbalance coexist.
In recent years, the Chinese government has been planning and developing rural public service land to ensure infrastructure construction, thereby strengthening the public service system. In fact, the function of rural public service land and the type of public service facilities are also essential parts of the public service system construction, directly affecting the allocation efficiency of rural public service land (Zhan et al., 2015). Driven by the goal of equalization of public services, rural areas tend to refer to cities in the construction of public services in order to reduce the difference between them and cities as soon as possible. It can result in a negative outcome, namely, that the public service system is constructed exactly according to the standards of the cities, ignoring the actual situation in rural areas and the actual needs of residents. Such an undifferentiated approach to the construction of public service systems often results in a mismatch between supply and demand for resources, leading to idle and inefficient use of rural public service land.
In order to maximize the efficiency of rural public service land use, the government should plan rural public service land reasonably according to the actual situation of village development to avoid the source problem of mismatch between supply and demand. For villages with poor natural background conditions, issues such as population outflow and demographic imbalance should be properly considered in land use planning and development, and the area of rural public service land should not be expanded blindly. Meanwhile, it is also possible to supply on demand by surveying the individual needs of residents regarding public services. On the other hand, for the rural areas of the metropolitan suburbs, it is necessary to allocate various public service facilities reasonably, given the limited rural public service land, so that it can serve the local population on a larger scale and at a higher quality. In addition, the quality of public services can be strengthened by improving existing public service facilities, thereby increasing the efficiency of rural public service land utilization. For instance, renovating and reusing old public service facilities that are structurally intact and of good quality.
5 Conclusion
Rural public service land is the carrier of rural public services. Understanding the spatio-temporal pattern and allocation efficiency of rural public service land is the basis for promoting the efficiency of rural residential land and the equalization of rural public services. Taking 273 villages in the Pinggu District of Beijing as an example, this article integrated multi-dimensional data, including geospatial data, network big data, and socio-economic data, to analyze the spatio-temporal evolution characteristics of RPMSL from 2004 to 2019. The bi-dimensional allocation efficiency index addressing qualitative and quantitative development was introduced to measure the allocation efficiency of RPSL. The conclusion is as follows:
The demand for public services in rural areas is increasing and diversifying. During the study period, the area of rural public service land in Pinggu increased by 57.28 ha, accounting for 10.61% of the total expansion of rural settlements, and the expansion rate of the northern mountainous areas was higher than that in other areas. The proportion of rural public services land in rural residential areas has increased from 5.95% to 6.36%. The rural public service land area per capita decreased from 10.22 m2 per person in 2004 to 9.57 m2 per person in 2019, and the intensive utilization needs strength. The rural public service land in Pinggu District was dominated by land for science, education, culture, and health, and the structure of rural public service land is becoming more balanced and diversified. The rural public service land in Pinggu District presents a clear pole-nucleus distribution, with a spatial pattern of dense in the southwest and sparse in the northeast. Rural public service land is characterized by both agglomeration and dispersion, as well as by a significant tendency to expand along main roads.
The number of public service facilities built within rural settlements in Pinggu District totaled 3,721 and is 3.27 pcs per hectare. The spatial distribution of rural public service facilities in the Pinggu District is closely related to the village system. The rural public service facilities are clustered around the town centers, and the aggregation is weakened with the reduction of the village system level. The level of basic public service capacity and the public service accessibility vary considerably between villages, with the former reaching a high of 3.272 and the lowest 0.620, and the latter reaching a high of 345.28 and a low of 2.32. Significant regional differences exist in the public service values of rural public service land, and the spatial distribution of high-value areas is closely related to the urban system. It shows the uneven spatial allocation of rural public service land. Furthermore, the uneven spatial allocation of rural public service land reveals the reality of the non-equalization of public services.
The mismatch between supply and demand could lead to inefficient rural public service land use. The overall allocation efficiency index of rural public service land in Pinggu District is 0.690.79.23% of the villages are below the lower level, which indicates that the rural public service land has not been fully and rationally utilized and that there is a waste of resources with a mismatch between inputs and outputs. It is mainly reflected in the mismatch between the rural public service land area and the population, the non-differentiated allocation of public service facilities, the uneven public service quality, and the low accessibility of rural public service land.
In the future, policymakers should plan rural public service land rationally from the perspective of the actual situation in the future. First, it is possible to dynamically adapt to changes in residents’ public service needs by setting flexible indicators for rural public service land. Second, it is proposed to build a living circle of rural settlements to optimize the allocation of rural public service land. Third, the mismatch between supply and demand can be avoided by surveying residents’ individual needs for public services. Finally, the allocation efficiency of rural public service land can be improved by improving existing public service facilities.
The contribution of this study is not only to enrich the research perspective of rural public services but also to provide a reference for the study on the utilization and optimization of rural settlements. The scientific originalities of the article are to understand the development of rural public services by exploring the evolution pattern and allocation efficiency of RPSL using land use data.
Data availability statement
The original contributions presented in the study are included in the article/supplementary material; further inquiries can be directed to the corresponding author.
Author contributions
QZ: conceptualization, methodology, investigation, writing—original draft, and writing—review and editing. GJ: writing—review and editing, supervision, and funding acquisition. YT: investigation, formal analysis, and data curation. LM: investigation and formal analysis. LY: visualization.
Funding
This research was supported by the Second Qinghai-Tibetan Plateau Scientific Expedition and Research Program(2019QZKK0405), and the National Natural Science Foundation of China (Grant Nos.42071249, 41671519).
Conflict of interest
The authors declare that the research was conducted in the absence of any commercial or financial relationships that could be construed as a potential conflict of interest.
Publisher’s note
All claims expressed in this article are solely those of the authors and do not necessarily represent those of their affiliated organizations, or those of the publisher, the editors, and the reviewers. Any product that may be evaluated in this article, or claim that may be made by its manufacturer, is not guaranteed or endorsed by the publisher.
References
Aseel, B. K., and Vincent, O. (2020). A GIS-based assessment of green space accessibility: Case study of dundee. Appl. Geomat. 12, 491–499. doi:10.1007/s12518-020-00314-7
Austin, C. M. (1974). The evaluation of urban public facility location: An alternative to benefit‐cost analysis. Geogr. Anal. 6 (2), 135–145. doi:10.1111/j.1538-4632.1974.tb00503.x
Barbera, S., and Bevia, C. (2006). Locating public facilities by majority: Stability, consistency and group formation. GAMES Econ. Behav. 56 (1), 185–200. doi:10.1016/j.geb.2005.08.002
Bigman, D., and ReVelle, C. (1978). The theory of welfare considerations in public facility location problems. Geogr. Anal. 10 (3), 229–240. doi:10.1111/j.1538-4632.1978.tb00652.x
Church, R. L., and ReVelle, C. S. (1976). Theoretical and computational links between the p‐median, location set‐covering, and the maximal covering location problem. Geogr. Anal. 8 (4), 406–415. doi:10.1111/j.1538-4632.1976.tb00547.x
Davis, W., Massa, K., Kiberiti, S., Mnzava, H., Venczel, L., and Quick, R. (2020). Evaluation of an inexpensive handwashing and water treatment program in rural health care facilities in three districts in Tanzania, 2017. Water 12 (5), 1289. doi:10.3390/W12051289
Demsetz, H. (1970). The private production of public goods. J. Law Econ. 13 (2), 293–306. doi:10.1086/466695
Fauster, A., Abraham, M. N., and Alfred, D. (2017). Accessibility mapping of health facilities in rural Ghana. J. Transp. Health 6, 73–83. doi:10.1016/j.jth.2017.04.010
Fei, G., and Yao, G. (2009). Analysis on the incentive mechanism for enhancing rural public service ability. Int. J. Bus. Manag. 2, 5.
Gao, F., and Tang, L. (2018). Discussion on classification and valuation method of public service land——analysis based on public goods theory. Price:Theory Pract. 7, 155–158. doi:10.19851/j.cnki.cn11-1010/f.2018.07.039
Gao, J., and Su, H. (2010). Progress of the supply of urban public service facilities in western countries and its enlightenment to China. Trop. Geogr. 30 (01), 8–12. doi:10.13284/j.cnki.rddl.001330
Gao, J., Zhou, C., Jiang, H., and Ye, C. (2010). The research on the spatial differentiation of the urban public service facilities distribution in guangzhou. Hum. Geogr. 25 (03), 78–83. doi:10.13959/j.issn.1003-2398.2010.03.002
Gao, J., and Zhou, C. (2009). The progress of the theory and research on the supply of urban public service facilities in western countries. World Reg. Stud. 18 (04), 81–90. doi:10.3969/j.issn.1004-9479.2009.04.011
Greenhut, M. L., and Mai, C. C. (1980). Towards a general theory of public and private facility location. Ann. Reg. Sci. 14 (2), 1–11. doi:10.1007/BF01284199
Han, Z., Li, B., and Zhang, K. (2015). Evaluation and spatial analysis of the equalization of basic public service in urban and rural areas in China. Geogr. Res. 11, 2035–2048. doi:10.11821/dlyj201511003
Han, Z., Li, Y., Liu, T., and Dong, M. (2019). Spatial differentiation of public service facilities’ configuration in community life circle: A case study of shahekou district in dalian city. Prog. Geogr. 38 (11), 1701–1711. doi:10.18306/dlkxjz.2019.11.006
Hosseini, A., Farhadi, E., Hussaini, F., Pourahmad, A., and Seraj Akbari, N. (2021). Analysis of spatial (in)equality of urban facilities in tehran: An integration of spatial accessibility. Environ. Dev. Sustain. 24, 6527–6555. doi:10.1007/s10668-021-01715-3
John, H. M. (1981). The location of public facilities intermediate to the journey to work. Eur. J. OPERATIONAL Res. 6 (2), 199–204. doi:10.1016/0377-2217(81)90208-3
Lan, F., Wu, Q., Zhou, T., and Da, H. (2018). Spatial effects of public service facilities accessibility on housing prices: A case study of xi’an, China. Sustainability 10 (12), 4503. doi:10.3390/su10124503
Le Huu, A., Giam, Q. D., Bui, T. L., Vu, N. H., and Tran, H. C. (2011). Equitability in access to rural public services in vietnam: An outlook from the red river delta. Int. Bus. Manag. 2 (1), 16. doi:10.3968/j.ibm.1923842820110201.016
Lee, K. (2021). Relationship between public service satisfaction and intention of continuous residence of younger generations in rural areas: The case of jeonbuk, korea. Land 10 (11), 1203. doi:10.3390/land10111203
Li, Q., Luo, R., Liu, C., and Zhang, L. (2006). What do villagers really want? Understanding villagers' willingness to invest in rural public services. Issues Agric. Econ. 27 (10), 15–20. doi:10.3969/j.issn.1000-6389.2006.10.004
Lineberry, R. L. (1974). Mandating urban equality: The distribution of municipal public services. Tex. LAW Rev. 53 (1), 26.
Liu, M., and Li, X. (2010). A pareto genetic algorithm for multi-objective site search problem: A case study on hospital location in shenzhen city. Trop. Geogr. 30 (06), 650–655. doi:10.13284/j.cnki.rddl.001418
Liu, S., Qin, Y., and Xu, Y. (2019). Inequality and influencing factors of spatial accessibility of medical facilities in rural areas of China: A case study of henan province. Int. J. Environ. Res. Public Health 16 (10), 1833. doi:10.3390/ijerph16101833
Luis, C., Pedro, G., Alba, C., Usama, B., Jose, A. S., Hannah, B., et al. (2019). Access to and availability of exercise facilities in madrid: An equity perspective. Int. J. Health Geogr. 18 (1), 15. doi:10.1186/s12942-019-0179-7
Luo, F., and Sun, C. (2020). Measure the efficiency of rural public service and analyse its determinants: Taking the case of hubei province, China. BASIC & CLINICAL PHARMACOLOGY & TOXICOLOGY.
Luo, W. W., and Wang, F. F. (2003). Measures of spatial accessibility to health care in a GIS environment: Synthesis and a case study in the chicago region. Environ. Plann. B. Plann. Des. 30 (6), 865–884. doi:10.1068/b29120
Lv, J., and Yan, T. (2018). Research on optimization of public service facilities land efficiency in changchun city based on compact city. Am. J. Civ. Eng. 6 (4), 123. doi:10.11648/j.ajce.20180604.13
Ma, W., He, X., Jiang, G., Li, Y., and Zhang, R. (2018). Land use internal structure classification of rural settlements based on land use function. Trans. Chin. Soc. Agric. Eng. 34 (04), 269–277. doi:10.11975/j.issn.1002-6819.2018.04.033
Ma, W., Jiang, G., Zhou, T., and Zhang, R. (2022). Mixed land uses and community decline: Opportunities and challenges for mitigating residential vacancy in peri-urban villages of China. Front. Environ. Sci. 10, 887988. doi:10.3389/fenvs.2022.887988
Marjan, J., Hanieh, S., and Mostafa, M. (2011). Application of sustainable urban development in environmental suitability analysis of educational land use by using ahp and gis in tehran. Procedia Eng. 21, 72–80. doi:10.1016/j.proeng.2011.11.1989
McAllister, D. M. (1976). Equity and efficiency in public facility location. Geogr. Anal. 8 (1), 47–63. doi:10.1111/j.1538-4632.1976.tb00528.x
Meier, K. J., Stewart, J., and England, R. E. (1991). The politics of bureaucratic discretion: Educational access as an urban service. Am. J. POLITICAL Sci. 35 (1), 155–177. doi:10.2307/2111442
Meng, Y., Li, Y., Liu, H., and Huang, Y. (2021). Study on evaluation of urban and rural high-quality living space based on accessibility analysis——taking shahe city, Hebei province as an example. IOP Conf. Ser. Earth Environ. Sci. 769 (2), 022075. doi:10.1088/1755-1315/769/2/022075
Miranda, R. A., and Tunyavong, I. (1994). Patterned inequality?: Reexamining the role of distributive politics in urban service delivery. Urban Aff. Q. 29 (4), 509–534. doi:10.1177/004208169402900402
Mohammad, M. A. (1995). Provision of urban public facilities through the development of public commercial land in Iran. HABITAT Int. 19 (3), 269–278. doi:10.1016/0197-3975(94)00069-e
Orloff, C. S. (1977). A theoretical model of net accessibility in public facility location. Geogr. Anal. 9 (3), 244–256. doi:10.1111/j.1538-4632.1977.tb00577.x
Penchansky, R., and Thomas, J. W. (1981). The concept of access: Definition and relationship to consumer satisfaction. Med. CARE 19 (2), 127–140. doi:10.1097/00005650-198102000-00001
Perl, J., and Ho, P. (1990). Public facilities location under elastic demand. Transp. Sci. 24 (2), 117–136. doi:10.1287/trsc.24.2.117
Qu, Y., Dong, X., Zhan, L., Si, H., Ping, Z., and Zhu, W. (2021). Scale transition and structure–function synergy differentiation of rural residential land: A dimensionality reduction transmission process from macro to micro scale. Land 10 (6), 647. doi:10.3390/land10060647
Qu, Y., Jiang, G., Yang, Y., Zheng, Q., Li, Y., and Ma, W. (2018). Multi-scale analysis on spatial morphology differentiation and formation mechanism of rural residential land: A case study in shandong province, China. HABITAT Int. 71, 135–146. doi:10.1016/j.habitatint.2017.11.011
Rich, R. C. (1979). Neglected issues in the study of urban service distributions: A research agenda. URBAN Stud. 16 (2), 143–156. doi:10.1080/00420987920080221
Robert, R., Joan, C. L., and Joaquim, M. F. (2018). A comparison study on space-use analysis techniques and proposal of a novel method for determining space needs in public facilities. Sustain. Cities Soc. 39, 326–334. doi:10.1016/j.scs.2018.02.032
Samuelson, P. A. (1954). The pure theory of public expenditure. Rev. Econ. statistics 36 (4), 387–389. doi:10.2307/1925895
Song, X., Ma, X., Zhu, C., and Li, H. (2012). An analysis of regional disparitise of rural public service level in jiangsu. Econ. Geogr. 32 (12), 133–139. doi:10.15957/j.cnki.jjdl.2012.12.023
Song, Z., Chen, W., Zhang, G., and Zhang, L. (2010). Spatial accessibility to public service facilities and its measurement approaches. Prog. Geogr. 29 (10), 1217–1224. doi:10.11820/dlkxjz.2010.10.009
Standardization Corporate Average Fuel Economy (2013). Standard for planning of rural area public facilities. Tianjin: Standardization Corporate Average Fuel Economy.
Sui, D., Zhang, S., and Liu, W. (2015). The rural public service quality assessment and promotion strategy research:based on the modified servqual model. J. Statistics Inf. 30 (04), 83–89. doi:10.3969/j.issn.1007-3116.2015.04.014
Sun, H., and Liang, J. (2002). By planning or by market? A discussion on the land classification standard for public facilities. City Plan. Rev. 7, 14–18. doi:10.3321/j.issn:1002-1329.2002.07.006
Talen, E. (1997). The social equity of urban service distribution: AN exploration of park access in pueblo, Colorado, and macon, Georgia. URBAN Geogr. 18 (6), 521–541. doi:10.2747/0272-3638.18.6.521
Talen, E. (1998). Visualizing fairness: Equity Maps for planners. J. Am. Plan. Assoc. 64 (1), 22–38. doi:10.1080/01944369808975954
Teitz, M. B. (1968). Toward a theory of urban public facility location. Pap. Reg. Sci. 21, 35–51. doi:10.1111/j.1435-5597.1968.tb01439.x
Tervo, M., Kotavaara, O., Antikainen, H., and Rusanen, J. (2013). Accessibility analysis of public services in rural areas under restructuring. Nord. Geogr. Publ. 42 (2), 39–52.
Thisse, J., and Wildasin, D. E. (1992). Public facility location and urban spatial structure: Equilibrium and welfare analysis. J. PUBLIC Econ. 48 (1), 83–118. doi:10.1016/0047-2727(92)90043-f
Tian, Y., Jiang, G., Zhou, D., Zhou, T., and Ma, W. (2022). A refined rural settlements simulation considering the competition relationship among the internal land use types: A case study of Pinggu district. Land 11 (5), 661. doi:10.3390/land11050661
Tsou, K., Hung, Y., and Chang, Y. (2005). An accessibility-based integrated measure of relative spatial equity in urban public facilities. CITIES 22 (6), 424–435. doi:10.1016/j.cities.2005.07.004
Wang, Y. (2010). Appraisal of equalization and ability to urban basic public services in China. Urban Probl. 8, 9–16. doi:10.13239/j.bjsshkxy.cswt.2010.08.012
Wei, L. (2021). Research progress of urban public service at home and abroad. Archit. Eng. Sci. 2 (3), 475. doi:10.32629/aes.v2i3.475
Xu, R., Yue, W., Wei, F., Yang, G., He, T., and Pan, K. (2022). Density pattern of functional facilities and its responses to urban development, especially in polycentric cities. Sustain. Cities Soc. 76, 103526. doi:10.1016/j.scs.2021.103526
Xu, X., Zhou, Y., and Zhao, X. (2013). Reclassification of public management-service land. J. Anhui Agric. Sci. 41 (33), 13021–13022. doi:10.13989/j.cnki.0517-6611.2013.33.101
Xu, Y., and Li, X. (2012). Exploration on reclassification of commercial and public facilities in China. City Plan. Rev. 36 (04), 61–68. doi:10.1016/J.SCS.2021.103526
Yang, Q., and Xu, J. (2015). An analysis model of public service facilities based on attraction accessibility. Planners 31 (07), 96–101. doi:10.3969/j.issn.1006-0022.2015.07.016
Yang, Z., and Zhao, M. (2002). On the provision of the public facilities in Housing Areas under the market economy. City Plan. Rev. 5, 14–19. doi:10.3321/j.issn:1002-1329.2002.05.003
Zhan, J., Li, C., Zhou, G., Shen, Q., and Ma, Z. (2015). The evolution pattern and mechanism of public service facilities lands in Changchun. Acta Geogr. Sin. 70 (12), 1939–1952. doi:10.11821/dlxb201512007
Zhang, B., and Zhou, E. (2020). The evaluation of spatial distribution equity of public service facilities in coastal cities. J. Coast. Res. 103, 1060. doi:10.2112/si103-221.1
Zhou, C., and Gao, J. (2011). Provision pattern of urban public service facilities and its formation mechanism during transitional China. Sci. Geogr. Sin. 31 (03), 272–279. doi:10.13249/j.cnki.sgs.2011.03.003
Keywords: rural public service land, rural settlements, allocation efficiency, metropolitan suburbs, spatio-temporal pattern
Citation: Zheng Q, Jiang G, Tian Y, Meng L and Yang L (2022) Spatio-temporal pattern and allocation efficiency of public service land in rural settlements. Front. Environ. Sci. 10:986417. doi: 10.3389/fenvs.2022.986417
Received: 05 July 2022; Accepted: 14 September 2022;
Published: 04 October 2022.
Edited by:
Luis A. Ruiz, Universitat Politècnica de València, SpainReviewed by:
Mengqiu Cao, University of Westminster, United KingdomMaros Finka, SPECTRA CE EU at STU in Bratislava, Slovakia
Copyright © 2022 Zheng, Jiang, Tian, Meng and Yang. This is an open-access article distributed under the terms of the Creative Commons Attribution License (CC BY). The use, distribution or reproduction in other forums is permitted, provided the original author(s) and the copyright owner(s) are credited and that the original publication in this journal is cited, in accordance with accepted academic practice. No use, distribution or reproduction is permitted which does not comply with these terms.
*Correspondence: Guanghui Jiang, bWFjcm9waGFnZUAxMjYuY29t