 Yongchun Sun
94% of researchers rate our articles as excellent or good
Learn more about the work of our research integrity team to safeguard the quality of each article we publish.
Find out more
ORIGINAL RESEARCH article
Front. Environ. Sci., 14 October 2022
Sec. Environmental Economics and Management
Volume 10 - 2022 | https://doi.org/10.3389/fenvs.2022.984203
This article is part of the Research TopicFinancial and Trade Globalization, Greener Technologies and Energy TransitionView all 46 articles
Drawing on balanced panel data of 30 Chinese provinces in 2000–2020, this paper uses the Panel Smooth Transformation Regression (PSTR) model to explore the impact of financial development and foreign trade on carbon emissions under different regional economic development levels. The empirical results show that: 1) Financial development and foreign trade have a non-linear impact on carbon emissions under different economic development levels; 2) As the level of economic development exceeds the threshold, the positive effect of financial development on carbon emissions will weaken, while the effect of foreign trade on carbon emissions will change from negative to positive; 3) The sub-sample estimates further found that the impact on carbon emissions in southern and northern regions are different. The threshold in the south is lower than that in the north, but all the conversion speed is faster.
Climate change has become a global problem faced by mankind. Zhao and Yang (2020) believe that CO2 emissions are seriously damaging the atmosphere and account for 58.8% of greenhouse gases. A large amount of carbon emissions is one of the main culprits of global warming. It has brought huge challenges to people’s life and production activities. Resulting in a reduction in productivity and labor, and issues of economic output and political stability (Azam et al., 2016; Presley et al., 2017; Lin and Zhu, 2019). Governments around the world are prioritizing the reduction of greenhouse gas emissions to slow climate change. As the largest CO2 emitter, China actively responds to climate change, On 22 September 2020, President Xi Jinping solemnly announced at the 75th United Nations General Assembly, The new goal of carbon neutrality is another sublimation based on the commitment to peak carbon emissions in 2030. It is China’s solemn commitment to the international community, demonstrating China’s determination to actively respond to climate change and take a green and low-carbon development path. It provides a Chinese solution for all countries in the world to jointly address global challenges, jointly protect the earth home on which human beings depend, and jointly build a global community with a shared future for mankind, and a community of shared future between man and nature, which is widely recognized and highly praised by the international community Chen et al. (2022). Since the carbon neutrality goal was proposed, it has also attracted extensive attention from the academic circles at home and abroad. Fully affirming the significance of China’s carbon neutrality goal to the world and China’s own sustainable development, it is expected to reduce global warming by 0.2–0.3°C (Zhongming et al., 2020), Promoting China’s GDP growth rate to reach 5% in the next decade, and by reducing clean energy costs, etc., will indirectly have positive “spillover effects” on other countries (Pollitt, 2020).
In this context, the relationship between carbon emissions and other greenhouse gas emissions and economic development has become a hot research topic for scholars around the world Azam et al. (2016). The link between financial development (FD) and economic growth is crucial, and economic growth cannot be achieved without financial development (FD), the two are inseparable (Le and Ozturk, 2020). Many scholars believe that with the progress of the financial sector, the level of financial development will promote CO2 emissions, because it relies mainly on energy sources that can exacerbate carbon dioxide emissions. For example, technological upgrading and increased industrial activities caused by the expansion of financial products, services, institutions and intermediaries stimulate more energy consumption and ultimately increase CO2 emissions (Ehigiamusoe and Lean, 2019; Lahiani, 2020). Therefore, the biggest challenge faced by both developed and developing countries is to protect the ecological environment while promoting economic development. Because it is difficult for human activities to develop and upgrade technology without destroying the environment at present, but some authors have also concluded in the study that in stable economic development, when the country has sufficient resources, they started focusing on reducing CO2 emissions (Khaskheli et al., 2021). For example, China has changed from high-speed development to focusing on high-quality development. China’s current documents have repeatedly appeared in various documents such as “carbon peak”, “carbon neutrality” and carbon emission trading, and in 2021, the “two sessions” will include “carbon peak” and “carbon neutrality” in the government work report for the first time. As a practitioner of ecological civilization, it shows the determination of the Chinese government to protect the ecological environment.
The environmental problems caused by carbon CO2 emissions are not only the result of financial development (FD) and rapid economic growth, but are also affected by other economic activities. Therefore, the author also includes foreign trade (TRD) into the main body of the research. Foreign trade is a double-edged sword in carbon emissions: on the one hand, the liberalization of trade promotes the transfer of advanced environmental protection technologies, which helps to improve environmental quality and reduce pollution; on the other hand, the increase in trade activities promotes industrial activities and economic growth, but also leads to an increase in environmental pollution Muhammad et al. (2020). It can be seen that trade-related CO2 emissions are also a key factor in environmental degradation. Therefore, the author reviewed relevant literature and found that the impact of foreign trade on CO2 emissions is one of the focuses of scholars. For details, see Literature Review 2.2. In addition, this paper also includes factors such as industrial structure (IRR), innovation (INN), urbanization level (URB), population (POP), and regional economic development level (PGDP).
The contribution of this paper to the existing literature is mainly manifested in two aspects. First, in the literature, many scholars have studied the linear relationship between income, energy, financial development, economic growth, real estate and other different entry points and carbon emissions (Yang et al., 2020; Jahanger et al., 2021; Yang et al., 2021; Kamal et al., 2021; Usman and Jahanger, 2021; Qashou et al., 2022; Samour et al., 2022; Jahanger et al., 2022a; Usman et al., 2022a; Jahanger et al., 2022b; Jiang et al., 2022; Ke et al., 2022; Li et al., 2022; Usman et al., 2022b). The relationship between the variables is often not necessarily linear, there is a nonlinear relationship. Therefore, this paper adopts a nonlinear panel smooth transition regression (PSTR) threshold model to explore the relationship between financial development (FD), foreign trade (TRD), regional economic development level (PGDP) and carbon dioxide (CO2), which makes up and enriches the current literature research.
Second, existing studies (Zhang and Lin, 2012; Essandoh et al., 2020; Li and Wei, 2021) believe that China is vast, with regional heterogeneity and differences in economic level. Based on this, this paper explores the mechanism of financial development, foreign trade and other factors on carbon emissions and considers the impact of regional economic development level, that is, there is a threshold effect. This is the current literature on carbon emissions (Ehigiamusoe and Lean, 2019; Khaskheli et al., 2021; Yang et al., 2021; Kamal et al., 2021; Usman and Jahanger, 2021; Samour et al., 2022; Usman et al., 2022a; Jahanger et al., 2022a) are rarely considered, so the results of this paper enrich the content of existing research.
This paper is divided into six main parts: the first part is the research background and questions, see the introduction for details; the second part is the literature review; the third part describes the research methods; the fourth part is the data description; the fifth part is the empirical results Analysis; finally, conclusions and recommendations about the research.
Regarding the relationship between financial development, foreign trade, regional economic development level and carbon emissions, there have been relevant studies in the previous literature. The following discussion is divided into three parts: 1) the relationship between financial development and carbon emissions; 2) the relationship between foreign trade and carbon emissions; 3) the relationship between the level of regional economic development and carbon emissions.
As an important part of national or regional economic growth, the link between financial development and economic growth is crucial. Therefore, financial development may have a profound impact on China’s regional CO2 emissions.
According to the current literature research, the relationship between financial development and CO2 emissions is quite controversial, Many researchers believe that in stable economies, when countries have sufficient resources, they begin to focus on reducing CO2 emissions. For example, while financial development promotes economic growth, it also promotes the adoption of green, environmental protection and energy-saving new technologies in various countries, thereby improving environmental performance. Consequently, environmental pollutants including CO2 emissions will be reduced (Pata, 2018; Lahiani, 2020; Usman et al., 2022b).
This conclusion has been questioned by some scholars. Because financial development may reduce the cost of credit and make it more accessible (Nkundabanyanga et al., 2014), this is beneficial for expanding output and accelerating industrial growth, but at the expense of increased energy use and CO2 emissions. Related studies (Sadorsky, 2010; Tang and Tan, 2015; Shahbaz et al., 2019; Charfeddine and Kahia, 2019; Zaidi et al., 2019; Khan et al., 2020; Yang et al., 2020,2021; Jahanger et al., 2021; Kamal et al., 2021;Usman and Jahanger, 2021) established this hypothesis. They all show that financial development, while rapidly promoting economic growth, leads to more CO2 emissions. The empirical research in this paper is consistent with the view that financial development will lead to an increase in CO2 emissions at the same time.
In addition, China has a vast territory, and there are differences between the north and the south as well as regional differences in the level of economic development, which will affect the relationship between financial development and carbon emissions. For example Zhao and Yang (2020) studied the relationship between financial development and carbon emissions at the provincial level in China. The results of the study show that with the surge in financial development, CO2 emissions fell by 4%–5%. However, in Sichuan, Zhejiang, Xinjiang, Fujian, Shaanxi, Yunnan and other places, CO2 emissions have increased. There is a bidirectional causal relationship between regional financial development and CO2 emissions, but not in the short term. Carbon dioxide emissions are significantly affected by regional financial development. Therefore, it is suggested that it is necessary to emphasize the development of China’s financial sector at the regional level to prevent CO2 emissions.
Many scholars believe that foreign trade is a key factor affecting economic growth and environmental quality. But researchers have not reached a consistent conclusion on the relationship between foreign trade and the environment.
The correlation between international trade and air pollution can be explained by three theories: scale effect, technology effect and structure effect. Scale effects suggest that increased trade activity accelerates economic growth and industrial activity, leading to increased environmental pollution. The technology effect argues that trade liberalization facilitates the transfer of advanced and environmentally friendly technologies, thereby improving environmental quality and reducing pollution. According to structural effects, trade activities in the early stages of development pollute the environment due to weak environmental regulations. However, trade activities tend to reduce environmental pollution in the later stages of strong environmental policy development (Antweiler et al., 2001; Muhammad et al., 2020; Kamal et al., 2021). This is a good explanation for why in the empirical evidence of this paper, in the model estimation of the entire sample and each region, the estimated coefficient of foreign trade in the second location is positive, that is, in the early stage of China’s development, economic development was at the expense of the environment, but with the improvement of the level of economic development, The Chinese government and people are more and more aware of the importance of the environment, which is why China has implemented a series of policies in recent years, adhering to the concept that lucid waters and lush mountains are invaluable assets.
Some scholars have subdivided the relationship between foreign trade and carbon emissions into the impact of imports and exports on carbon emissions. First, from the import side, some researchers believe that the production and manufacture of imported goods are completed in a third country and will not directly affect the environment of the host country, so imports reduce environmental pollution (Cole et al., 2014). Other scholars have questioned this, arguing that more imports will lead to increased transportation activities, which in turn will require more fuel consumption and ultimately increase environmental pollution, among them Liddle (2017) studied the impact of imports on CO2 in 102 countries from 1990 to 2013, and found that imports lead to more CO2 emissions. Secondly, in terms of exports, there are also two schools of thought. One believes that exports enhance trade competition between countries to improve the efficiency of the use of scarce resources and encourage the use of green technologies to reduce environmental pollution (Davis, 1995; Helpman, 1998). However, another school of thought argues that exports lead to faster depletion of natural resources, leading to increased carbon dioxide emissions and environmental pollution (Schmalensee et al., 1998; Hossain, 2011).
More and more studies have confirmed that the sharp increase in China’s regional CO2 emissions is closely related to the corresponding economic development (Wang et al., 2011; Govindaraju et al., 2013). Grossman and Krueger (1991) believed that the level of environmental pollution is related to countries with different income levels. In low-income countries, it will increase with the increase of per capita GDP, and in high-income countries, it will decrease with the increase of GDP. Further, for regions with a low level of economic development, the industrial competitiveness is relatively weak, which requires relying on the secondary industry to drive economic growth, which is not conducive to the development of clean industries. For regions with a high level of economic development, there will be more funds and people for green innovation and reduce pollution. Therefore, financial development, foreign trade and carbon emissions are constrained by the level of regional economic development.
In addition, Onuonga (2020) expounded the relationship between air pollution and economic growth in the literature, Among them, the theory of Grossman and Krueger. (1995) holds that the relationship between air pollution and economic growth is non-linear, showing an inverted U-shaped curve, which is called the Environmental Kuznets Curve Hypothesis (EKC). Since then, many scholars believe that EKC exists, such as (Mohammadi, 2017; Omri et al., 2015; Ozatac et al., 2017; Marques et al., 2018; Asumadu-Sarkodie and Owusu, 2017; Usman and Jahanger, 2021; Li et al., 2022). If the theory is correct, the economy contributes to an improved environment in the long run. However, some scholars believe that EKC does not exist (Aye and Edoja, 2017; Simiyu, 2017; Mikayilov et al., 2018). In addition, some scholars found that environmental EKC exists in some countries and not in some countries, such as Jahanger et al. (2022b) that the environmental Kuznets curve hypothesis has been verified in African, Latin American and Caribbean countries, but not in Asia Country is not verified.
This paper also includes the impact of innovation, industrial structure upgrade, urbanization level and other factors on carbon emissions. Innovation is an important driver of economic growth, especially for countries that are seriously lagging behind in economic development. However, innovation is a double-edged sword. On the one hand, it stimulates economic growth in a short period of time, and on the other hand, it also causes air pollution to economic development and the urban environment Zhang et al. (2018). However, most scholars believe that technological innovation is beneficial to reduce CO2 emissions and improve environmental quality (Gerlagh, 2006; Ang, 2009; Yang and Li, 2017; Chen and Lee, 2020; Jahanger et al., 2022a; Li et al., 2022) and the empirical analysis in this paper confirms that innovation can help reduce CO2 emissions, as shown in Table 7. In addition, there are relatively few literatures on industrial structure and urbanization level. However, for China, which is in a critical period of industrial structure upgrading, these two indicators cannot be ignored.
In addition, Rios and Gianmoena (2018) argue that regional analysis is of considerable importance when considering pathways to achieve national emission reduction targets. Zhao and Yang (2020) believe that it is of great significance to explore the impact on China’s carbon dioxide emissions at the regional level. However, only a few scholars have studied the influencing factors of carbon dioxide emissions at the regional level. These studies define regions differently due to different research perspectives. Some people divide China’s provinces into two regions, namely developed regions and underdeveloped regions Xiong et al. (2017). Some merged Chinese provinces into three districts: east, middle, and west Huang and Zhao. (2018). Considering the issue of regional differences, this paper divides China’s provinces into southern and northern regions, and uses the regional economic development level as the threshold variable to explore the mechanism of financial development and foreign trade on carbon emissions.
In order to estimate the impact of various factors on carbon emissions, this paper draws on the PSTR model of (González et al., 2005, 2017; Li and Wei, 2021), the advantage of this model is that it has a flexible nonlinear form, which allows continuous smooth transition between different states. The model uses the regional economic development level as a threshold variable to estimate a threshold value. The level of regional economic development will affect the impact of financial development and foreign trade on carbon emissions. It is helpful to determine the target of regional energy saving and emission reduction, and the model has the characteristics of fixed-effect models for individuals and time. The constructed PSTR model is as follows:
Among them, i = 1,2, … … ,N; t = 1,2, … … , T, N represents the cross section, and T represents the time dimension, yit is the explained variable, and the dependent variable in this article is carbon emissions (CO2), xit is an independent variable, including financial development and foreign trade, but also includes industrial structure, innovation, energy consumption, urbanization level, population, αi represents the fixed effect of individual (province), β0 is the coefficient of the linear regression part of the explanatory variable, β1 is the coefficient of the nonlinear regression part of the explanatory variable, εit is the error term set to iid, g (qit, γ, c) is the transition function between 0 and 1. It is usually a logistic function, according to González et al. (2017) proposed and Li and Wei (2021) defined the transfer function used as follows:
qit is a conversion variable or threshold variable, γ is a smooth slope parameter, γj>0, it determines the conversion speed from one location to another location, cj is a threshold parameter, c1≤ c2 ≤… ≤ cm, It is the threshold value in nonlinear state (in Equation 1). And qit > cj represents the model transition from one location to another. m is the number of thresholds, usually m takes values 1 and 2.
González et al. (2005) initially constructed the PSTR model and used the demean method to remove individual fixed effects. Besides, he also used nonlinear least squares (NLS) to estimate the coefficients, since then, a large amount of literature on this research has emerged (Inglesi-Lotz et al., 2020; Li and Wei, 2021). Before estimating the PSTR model, the linearity and residual nonlinearity of the data are judged to verify whether the state transition is statistically significant, and to determine the number of transition functions and the number of thresholds.
First, perform a linear test. The original hypothesis H0: γ = 0 or H0:β1 = 0, the alternative hypothesis H1: γ ≥1 means that the PSTR model has one or more conversion functions. According to the first-order Taylor expansion near y = 0 of g (qit,γ, c) derived by (González et al., 2017; Li and Wei, 2021), the corresponding auxiliary regression function is obtained:
The coefficient β corresponds to γ,
The test formulas of
In the above equation, SSR0 and SSR1 are the sum of squared residuals in H0 and H1, respectively, K is the number of explanatory variables, N is the number of provinces, and T is time.
Secondly, if the null hypothesis of linear relationship is rejected, it means that the relationship between the variables in the model is non-linear. Then determine the order m of g (qit, γ, c) according to the auxiliary regression Equation 3. According to the methods described by (González et al., 2005,2017; Li and Wei, 2021), this article also chooses m = 3 to test the significance of the null hypothesis according to the auxiliary function, the null hypothesis
Finally, after determining the order m value of the transfer function, perform a heterogeneity test to determine the number of transfer functions:
Among them,
This article uses the annual data of 30 provinces in China from 2000 to 2020. Due to the lack of corresponding data, the sample data of Taiwan, Hong Kong, Macau and Tibet are excluded. The data sources are “China Statistical Yearbook”, “China Energy Statistical Yearbook”, “China Financial Statistical Yearbook”, “China Environment Statistical Yearbook”, “Statistical Yearbook of Provinces”, “Statistical Bulletin of National Economic and Social Development of Provinces, Autonomous Regions and Municipalities”, “China Emission Accounting and Data Collection”, Wind database and CEADs database.
In order to explore the factors and mechanisms affecting carbon emissions (CO2), this paper constructs a series of variables including:
1) The explained variable (CO2)
According to the current literature, for carbon emissions indicators, many literatures are mainly based on the measurement method proposed by the United Nations IPCC Wang et al. (2019), and t this paper uses the data of carbon dioxide (CO2) emissions in the CEADs database as the explained variable (million tons of carbon dioxide emissions), which adopt the measurement method proposed by the United Nations IPCC.
2) Core explanatory variables (X)
The core explanatory variables are financial development (FD) and foreign trade (TRD). Among them, financial development (FD) is represented by deposits and loans; foreign trade (TRD) is represented by imports and exports.
3) Control variable (Z)
Control variables include industrial structure (IRR), innovation (INN), urbanization level (URB), population (POP), and regional economic development level (GDP). Among them, Industrial Structure (IRR) uses industry as a percentage of GDP as an indicator of industrial structure; innovation (INN) uses the number of patents per 1 million people in each province to represent; the urbanization level (URB) is expressed by the proportion of urban population in the regional population; the population (POP) is expressed in millions of people; the regional economic development level (GDP) uses the actual GDP of each province as a measurement indicator.
This paper uses the regional economic development level (GDP)as the threshold variable to examine the impact of financial development (FD), foreign trade (TRD) and regional economic development level (GDP)on carbon emissions (CO2), all variables are expressed in logarithmic form. Table 1 lists the descriptive statistics of all variables.
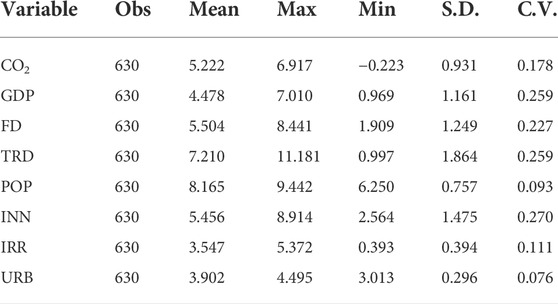
TABLE 1. Descriptive statistics.
The results show that the average value of carbon emissions (CO2) is 5.222, while observing the maximum and minimum values of each variable. The average value is not affected by extreme values. For the coefficient of variation, the value of regional economic development, financial development, foreign trade and innovation are 0.259, 0.227, 0.259, and 0.270, respectively, which have a higher coefficient of variation.
In order to avoid incorrect regression caused by the non-stationarity of the data, this paper uses LLC and Fisher for unit root test. As shown in Table 2, all variables are stable (The p-values of LLC and Fisher’s tests are both less than 10%, rejecting the null hypothesis, with statistical significance). Therefore, the requirements of the PSTR model for panel data stationarity are met.
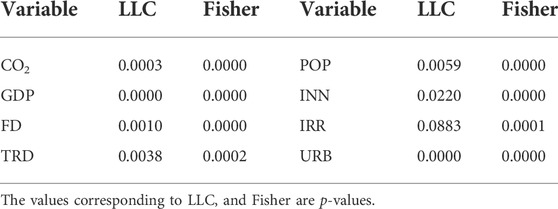
TABLE 2. Unit root test.
In order to measure the impact of financial development and foreign trade on carbon emissions, this paper examines the panel data of 30 provinces and cities in China, and uses the level of regional economic development as the threshold variable to examine whether the impacts of financial development and foreign trade on carbon emissions are the same at different levels of economic development. For the PSTR model analysis, the following three steps are used. The first is to check the linear relationship, the second is to determine the number of threshold parameters m and the corresponding optimal
This paper has carried out a linearity test, as shown in Table 3, for the order m = 1, 2, 3, the corresponding
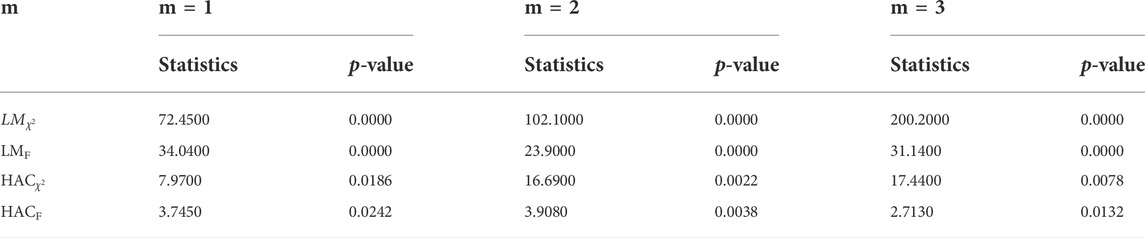
TABLE 3. Homogeneity tests.
Based on the analysis of 5.2.1, in order to determine the order m of g (qit, γ, c), this paper does a sequence homogeneity test as shown in Table 4 to determine the optimal order of the transfer function m = 1. At the same time, to ensure For the robustness of the PSTR model constructed by the transfer function, we have done a robustness test and no residual heterogeneity test: H0: γ = 1, H1: γ = 2, as shown in Table 5 and Table 6, the results showed that the p values of heteroscedasticity robustness statistics were 0.0921, 0.1535, 0.1062 and 0.1723, respectively. Accept the null hypothesis that the optimal order of the transfer function is m = 1. For the test of H0: γ = 2, H1: γ = 3, it is obvious that the heteroscedasticity robustness test is not significant. Therefore, the PSTR model we set has only one transfer function, two zones, and one threshold parameter.
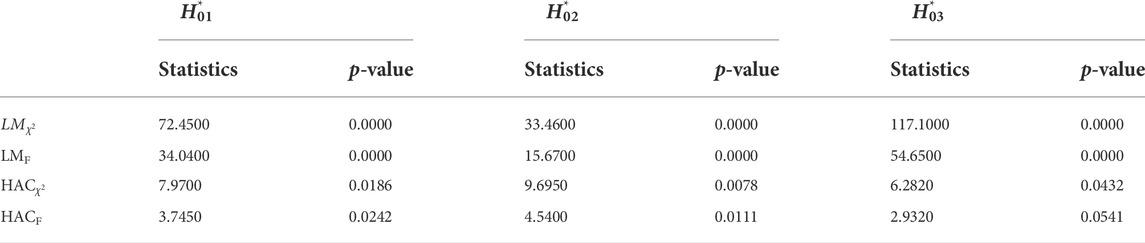
TABLE 4. Sequence of homogeneity tests.

TABLE 5. Parameter constancy test.
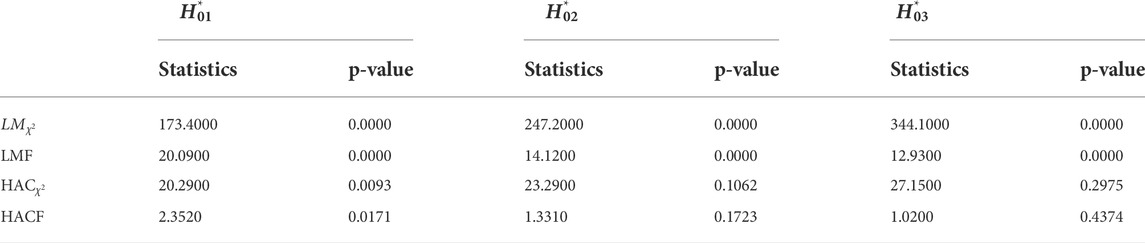
TABLE 6. No remaining (heterogeneity) test.
Through the above linear test, threshold parameters and the determination of the optimal conversion function, we determined that the suitable model is the logistic conversion model in Eq. 1. The results of our estimated PSTR model are shown in Table 7. Among them, the optimal threshold parameter c is 5.700, which means that when the threshold variable is lower than 5.700, the estimated model will be in the first location, otherwise it will be in the second location. As shown in Figure 1, there are many continuous points between the first location and the second location, and the smooth transition process of the sample data can be seen intuitively. With the rapid development of China’s economy, finance and foreign trade have also developed rapidly, and the impact on carbon emissions has gradually increased. When reaching a certain height, there will be a peak, the so-called “carbon peak”, so how to achieve “carbon neutral”? This is the problem that we are concerned about and must be solved. While studying the impact of financial development and foreign trade on carbon emissions, this paper also considers the level of regional economic development, and incorporates factors such as innovation, industrial structure, population, and urbanization level.
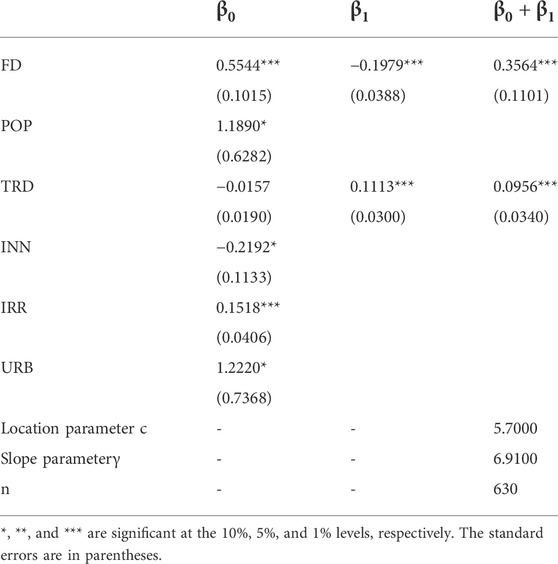
TABLE 7. Results of the PSTR estimation.
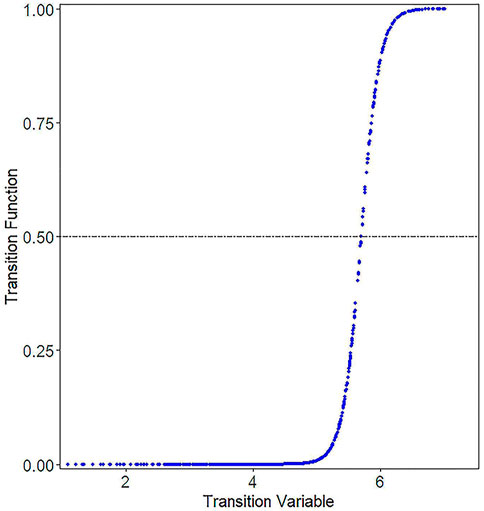
FIGURE 1. Smooth transition function.
In the foreign trade and financial development in Table 7, the sign of the coefficient of the linear part (β0) and the coefficient of the nonlinear part (β1) are opposite. When the threshold variable (regional economic development level) is lower than the optimal threshold (5.700), the linear relationship dominates, that is, the model is in the first location. In this location, the regional economic development level is not very high, due to the blind excessive expansion and disorderly development of finance (similar to P2P financial products, etc.), This leads to an increase in the level of carbon emissions, that is, the faster the financial development, the more it will destroy the balance of the ecological environment, especially when the environmental protection policy is relatively loose. This is consistent with the research results of scholars (Yang et al., 2020; Jahanger et al., 2021; Yang et al., 2021; Usman and Jahanger, 2021), that is, financial development will lead to an increase in carbon emissions, But unlike the above scholars Usman et al. (2022a), these scholars believe that finance is considered to be an important indicator that greatly helps to alleviate environmental degradation and promote economic growth. Then, when the financial development is in the second position (that is, higher than the threshold value of 5.700), the positive effect of financial development on carbon emissions will offset the weakened impact on carbon emissions due to the negative nonlinearity (the coefficient changes from 0.5544 to 0.3564). This situation is very similar to the Environmental Kuznets Curve Hypothesis (EKC) confirmed by some scholars such as Grossman and Krueger (1995), that is, the economy is conducive to improving the environment in the long run. At the same time, this shows that it is inseparable from the implementation of high-quality development of the Chinese economy. With the continuous improvement of China’s economic level and the transformation of financial development to green, a series of green investment and financing measures have been proposed to facilitate the green transformation of financial development, thereby reducing the impact of financial development on carbon emissions.
Foreign trade is known as one of the troikas that promote China’s economic growth, and has made a lot of contributions to the development of China’s economy. With the continuous expansion of trade and the take-off of China’s economy, the impact of foreign trade on carbon emissions is shown in 1 and Table 7, it can be seen that, when the level of regional economic development exceeds the threshold (5.700), foreign trade will lead to an increase in carbon emissions, and will lead to an increase in carbon emissions due to positive nonlinear effects (coefficient of 0.0956). With the rapid development of China’s economy and the further expansion of its opening to the outside world, foreign trade has become more frequent and convenient due to the improvement of the level of regional economic development. This is inevitably accompanied by the emergence of negative problems that accelerate the effect of environmental damage, and even the spread of carbon emissions across borders. How to avoid the increase in carbon emissions caused by foreign trade? We can draw inspiration from the theories of the following scholars, such as Walter and Ugelow. (1979)’s “pollution haven effect” that when investment goes into pollution-intensive industrial sectors, foreign direct investment will increase carbon emissions, and later scholars have confirmed the hypothesis (Cole, 2004; Lan et al., 2012; Long et al., 2018);and Zarsky. (1999)’s “pollution halo effect” that foreign trade tends to reduce environmental pollution and improve environmental quality when investment goes into green and technologically advanced industries, scholars (Lee, 2009; Govindaraju et al., 2013) also confirmed this view.
It is also found from Table 7 that the linear part of innovation is negatively related to carbon emissions, as stated by scholars Jahanger et al. (2022a), technological innovation has been shown to play a moderating role to reduce the negative environment related to natural resource consumption Consequences, that is to say, the development of innovation is helpful to reduce carbon emissions. The current hotly debated “carbon neutrality”, in the final analysis, also requires innovation, accelerating ecological innovation and the green development of various industries, and promoting the formation of a consensus on environmental protection among the whole people is the direction of our future efforts.
In addition, in terms of industrial structure, from the statistical data, industrial structure and carbon emissions are positively correlated (the coefficient is 0.1518). Therefore, the adjustment of the industrial structure should pay attention to the effect of the ecological environment, so China is indeed making efforts in this regard, such as adjusting the structure of industrial energy, developing green industries and then promoting the development of circular economy, making the governance of the ecological environment qualitatively A leap forward to truly achieve a beautiful China.
Taking into account the difference between the north and the south, according to Li and Wei. (2021), this paper also divides the 30 provinces and cities in China into the northern regions (Heilongjiang, Jilin, Liaoning, Inner Mongolia, Xinjiang, Gansu, Qinghai, Ningxia, Shanxi, Shaanxi, Hebei, Tianjin, Beijing, Shandong, Henan)and southern regions (Jiangsu, Chongqing, Sichuan, Hubei, Shanghai, Anhui, Zhejiang, Jiangxi, Hunan, Guizhou, Yunnan, Fujian, Guangdong, Guangxi, Hainan), Taking the level of economic development as the threshold variable, the impact of financial development and foreign trade on carbon emissions was calculated respectively. The specific screening process is the same as above, further details are provided in the Appendix, Supplementary Appendix Table A1 and Supplementary Appendix Table A2 establish the optimal order of the transfer function m = 1, Supplementary Appendix Table A3 shows no residual heterogeneity, and Supplementary Appendix Table A4 is the estimated result of the PSTR model, the smoothing threshold effect presented in Supplementary Appendix Figure A1 and Supplementary Appendix Figure A1.
It can be seen from Supplementary Appendix Table A4 that the level of regional economic development does affect the relationship between financial development, foreign trade and carbon emissions. Threshold values vary by region, the thresholds in northern and southern China are 5.418 and 4.883, respectively, and the thresholds in southern China are lower than those in northern China, indicating that the southern region is more likely to have a threshold effect. As can be seen from Supplementary Appendix Figure A1 and Supplementary Appendix Figure A2, compared with the southern region, most of the points in the northern region are in the first location, perhaps the economic development of the northern region is not as good as that of the southern region. The impact of financial development and foreign trade on carbon emissions is not as large as that of the south, which has better economic development. In addition, we also found that the conversion speed of the slope parameter γ in the northern region is higher than that in the southern region, which further indicates that the impact of financial development and foreign trade on carbon emissions varies with the level of regional economic development. The results of the empirical analysis are consistent with the idea of scholars (Rios and Gianmoena, 2018; Zhao and Yang, 2020), that is, it is of great significance to explore the impact on China’s carbon dioxide emissions and national emission reduction targets at the regional level. Generally speaking, the development of finance and foreign trade will aggravate the generation of carbon emissions and deteriorate the natural environment. But the economic development of the south is relatively less than the impact of the north, because the economy has developed to a certain extent, people pay more attention to the problem of environmental quality. Therefore, promoting green low-carbon and even “zero-carbon economy” will be an important issue for enterprises to think about in the future.
In order to test the robustness of the model, according to the robustness test method of (Wang and Wei, 2020; Li and Wei, 2021), the financial development indicator in this paper is replaced by per capita deposits and loans, and then the entire sample is re-tested.
The results of the robustness test in Table 8 and Figure 2 are consistent with the results in Table 7 and Figure 1 of the Chinese full-sample test. The indicator of financial development is re-tested, and the results show that it is still significant. From Figure 2, it can be intuitively seen that the transition is smooth, so it can be concluded that the model estimation is robust.
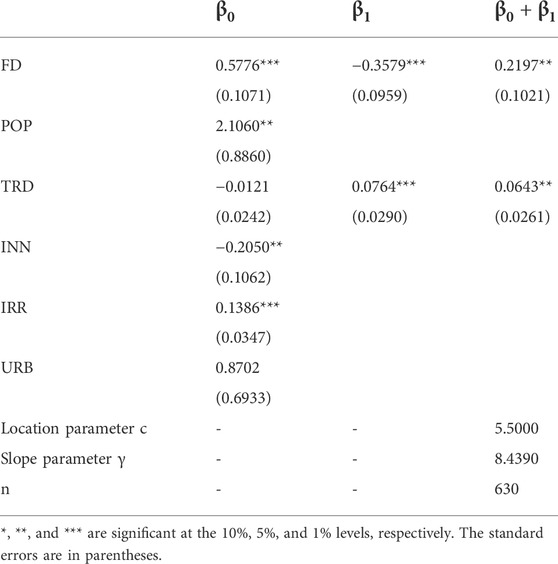
TABLE 8. Results of the PSTR estimation.
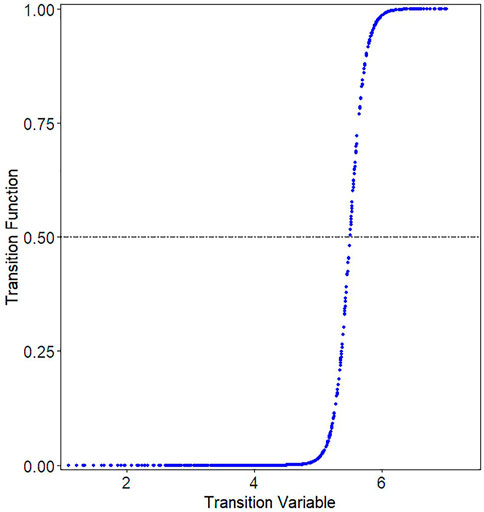
FIGURE 2. Smooth transition function.
Different from previous studies on the linear relationship of carbon emissions (Yang et al., 2020; Jahanger et al., 2021; Yang et al., 2021; Kamal et al., 2021; Usman and Jahanger, 2021; Qashou et al., 2022).
In this paper, the nonlinear panel smooth transition regression (PSTR) threshold model is used to deeply explore the interaction mechanism between financial development, foreign trade, regional economic development level and carbon emissions. In addition, considering China’s vast territory, vast land and abundant resources, complex and diverse natural environment, and large differences in the level of regional economic development, the total sample of the country, the southern and northern regions of China were analyzed respectively. The research results show that changes in the level of regional economic development will affect the mechanism of financial development and foreign trade on carbon emissions, and it varies from region to region. Especially when the level of regional economic development is high and higher than the optimal threshold, financial development will reduce carbon emissions due to the high level of regional economic development, but foreign trade will increase carbon emissions more frequently. However, when examining sub-regions, both financial development and foreign trade will lead to an increase in carbon emissions, which is in line with the research views of some international scholars (Schmalensee et al., 1998; Sadorsky, 2010; Hossain, 2011;Tang and Tan 2015; Shahbaz et al., 2019; Zaidi et al., 2019; Khan et al., 2020; Yang et al., 2020,2021;Jahanger et al., 2021; Kamal et al., 2021). Therefore, the author believes that after obtaining a sufficient level of development, more attention should be paid to environmental-related issues, at the same time, with the improvement of development, the level of education and awareness has also increased, and people’s awareness of environmental protection has become stronger and stronger, all of which contribute to reducing pollution.
Further, it also illustrates another problem, that is, the relationship between financial development and carbon emissions is not stable. Because carbon emissions can only be reduced when the level of economic development reaches a certain threshold, which means that we should improve the level of regional economic development while strengthening financial development. This coincides with the environmental Kuznets curve hypothesis Grossman and Krueger (1995), that is, the economy contributes to an improved environment in the long run. Recent studies (Omri et al., 2015; Mohammadi, 2017; Ozatac et al., 2017; Marques et al., 2018; Asumadu-Sarkodie and Owusu, 2017; Usman and Jahanger, 2021; Li et al., 2022) also confirmed this. In addition, innovation is negatively correlated with carbon emissions, which means that the development of innovation helps to reduce carbon emissions, and population, industrial structure, and urbanization levels all lead to an increase in carbon emissions.
These findings deserve the attention of policymakers. Therefore, we make the following recommendations.
First, improve the supervision of laws and regulations. Specific measures: First, form a “smart” carbon emission regulatory legal mechanism Han and Lu (2021). Give full play to the advantages of big data and other technologies, monitor carbon emissions and key enterprises with carbon emissions in real time, and accurately identify illegal entities and behaviors, so as to ensure economic development and the protection of the ecological environment. Second, strengthen the legal connection and coordination mechanism of low-carbon legislation and environmental protection, and establish a legal supervision system for carbon emission trading, forming a diversified legal supervision mechanism for the government, enterprises, and service platforms.
Secondly, due to the differences in the level of regional economic development, the impact of financial development and foreign trade on carbon emissions is also different. Therefore, when solving the carbon emission problem, relevant departments should take measures according to local conditions, take multiple measures in a step-by-step manner, and explore effective solutions for energy conservation and emission reduction in the region. At the same time, to continuously improve the level of regional economic development, in the process of opening up the financial industry to the outside world, the government should cooperate with rating agencies to effectively select investments, require financiers to share information on carbon emissions, and limit CO2 emissions in the form of contracts, develop green finance and transform to green. Encourage investment, financing and cooperation among multinational companies that use and nurture clean and green technologies.
Finally, innovation and carbon emissions are negatively correlated, so domestic and foreign companies should be encouraged to use capital for efficient and high-tech production, invest in green technologies for technological upgrading, and transform existing industries into low-carbon industries or a “zero-carbon economy”. Population is also an important factor affecting carbon emissions. It is recommended that government departments implement relevant policies to improve the public’s use of green renewable energy, green travel, and green life. In addition, there is another important factor, economic level, regional economic development will increase carbon dioxide emissions, but with the improvement of regional economic development level, carbon dioxide begins to decrease. Therefore, while promoting economic development, revising and formulating appropriate policies is conducive to environmental protection. For example, extreme rainstorm events like the one encountered in Henan in mid-July 2021 are warning us of the importance of protecting the environment.
Publicly available datasets were analyzed in this study. This data can be found here: China Statistical Yearbook; China Energy Statistical Yearbook; China Financial Statistical Yearbook; China Environmental Statistical Yearbook; Provincial Statistical Yearbooks; Statistical Bulletins on National Economic and Social Development of Provinces and Municipalities; China Emissions Accounting and Data Set; wind database; CEADs database, etc.
YS conceived conception, data collection and statistical analysis, contributed to the writing of the manuscript, and provided guidance throughout the study. All authors have read and agree to the published version of the manuscript.
I thank the editors and the three reviewers for their highly valuable comments on an earlier version of this paper. I am very grateful to the Guangzhou Office of Philosophy and Social Science (2021GZGJ29), Guangdong Provincial Key Scientific Research Platform Project (2020ZDZX1064), and Guangdong Educational Science Planning Project (2022GXJK673).
The author declares that the research was conducted in the absence of any commercial or financial relationships that could be construed as a potential conflict of interest.
All claims expressed in this article are solely those of the authors and do not necessarily represent those of their affiliated organizations, or those of the publisher, the editors and the reviewers. Any product that may be evaluated in this article, or claim that may be made by its manufacturer, is not guaranteed or endorsed by the publisher.
The Supplementary Material for this article can be found online at: https://www.frontiersin.org/articles/10.3389/fenvs.2022.984203/full#supplementary-material
Ang, J. B. (2009). CO2 emissions, research and technology transfer in China. Ecol. Econ. 68 (10), 2658–2665. doi:10.1016/j.ecolecon.2009.05.002
Antweiler, W., Copeland, B. R., and Taylor, M. S. (2001). Is free trade good for the environment? Am. Econ. Rev. 91 (4), 877–908. doi:10.1257/aer.91.4.877
Asumadu-Sarkodie, S. M., and Owusu, P. A. (2017). Carbon dioxide emissions, GDP percapita, industrialization and Population: An Evidence from Rwanda. Environ. Eng. Res. 22 (1), 116–124. doi:10.4491/eer.2016.097
Aye, G. C., and Edoja, P. E. (2017). Effect of economic growth on CO2 emission in developing countries: Evidence from a dynamic panel threshold model. Cogent Econ. Finance 5 (1), 1379239. doi:10.1080/23322039.2017.1379239
Azam, M., Khan, A. Q., Abdullah, H. B., and Qureshi, M. E. (2016). The impact of CO2 emissions on economic growth: Evidence from selected higher CO2 emissions economies. Environ. Sci. Pollut. Res. 23 (7), 6376–6389. doi:10.1007/s11356-015-5817-4
Charfeddine, L., and Kahia, M. (2019). Impact of renewable energy consumption and financial development on CO2 emissions and economic growth in the mena region: A panel vector autoregressive (pvar) analysis. Renew. Energy 139, 198–213. doi:10.1016/j.renene.2019.01.010
Chen, M., Cheng, J., Zhou, Y., Ding, Z., and Ma, H. (2022). Origin, realization path and key scientific issues of carbon neutrality: Climate change and sustainable urbanization. J. Nat. Resour. 37 (5), 1233–1246. doi:10.31497/zrzyxb.20220509
Chen, Y., and Lee, C. C. (2020). Does technological innovation reduce CO2 emissions? Cross-country evidence. J. Clean. Prod. 263, 121550. doi:10.1016/j.jclepro.2020.121550
Climate Action Tracker (2020). China going carbon neutral before 2060 would lower warming projections by around 0.2 to 0.3 degrees C. Avaliable at: https://climateactiontracker.org/press/china-carbon-neutral-before-2060-would-lower- warming- projections-by-around-2-to-3-tenths-of-a-degree/.
Cole, M. A., Elliott, R. J., and Okubo, T. (2014). International environmental outsourcing. Rev. World Econ. 150 (4), 639–664. doi:10.1007/s10290-014-0193-6
Cole, M. A. (2004). Trade, the pollution haven hypothesis and the environmental Kuznets curve: Examining the linkages. Ecol. Econ. 48 (1), 71–81. doi:10.1016/j.ecolecon.2003.09.007
Davis, G. (1995). Freer trade, protected environment: Balancing trade liberalization and environmental interests. Resour. Policy 21 (1), 74–75. doi:10.1016/0301-4207(95)90031-4
Ehigiamusoe, K. U., and Lean, H. H. (2019). Effects of energy consumption, economic growth, and financial development on carbon emissions: Evidence from heterogeneous income groups. Environ. Sci. Pollut. Res. 26 (22), 22611–22624. doi:10.1007/s11356-019-05309-5
Essandoh, O. K., Islam, M., and Kakinaka, M. (2020). Linking international trade and foreign direct investment to CO2 emissions: Any differences between developed and developing countries? Sci. Total Environ. 712, 136437. doi:10.1016/j.scitotenv.2019.136437
Gerlagh, R. (2006). Measuring the value of induced technological change. Energy Policy 35 (11), 5287–5297. doi:10.1016/j.enpol.2006.01.034
González, A., Teräsvirta, T., and Van Dijk, D. (2005). Panel smooth transition regression models. SEE/EFI Working Paper Series in Economics and Finance.
González, A., Teräsvirta, T., and Van Dijk, D. (2017). Panel smooth transition regression models. Department of Economics and Business Economics, Aarhus University, 36. Available at: https://ideas.repec.org/p/aah/create/2017-36.html.
Govindaraju, V. G. R., Chandran, H., and Tang, C. F. (2013). The dynamic links between CO2 emissions, economic growth and coal consumption in China and India. Appl. Energy 104, 310–318. doi:10.1016/j.apenergy.2012.10.042
Grossman, G. M., and Krueger, A. B. (1995). Economic growth and the environment. Q. J. Econ. 110 (2), 353–377. doi:10.2307/2118443
Grossman, G. M., and Krueger, A. B. (1991). Environmental impacts of a North American free trade agreement. National Bureau of Economic Research Working Paper Series. 3914. doi:10.3386/w3914
Han, L. X., and Lu, D. (2021). Reflections on the perfection of legislation to achieve carbon peaking and carbon neutrality—take tackling climate change as an entry point. Price Theory & Pract. 12, 31–34. doi:10.19851/j.cnki.CN11-1010/F.2021.12.453
Helpman, E. (1998). Explaining the structure of foreign trade: Where do we stand? Weltwirtschaftliches Arch. 134 (4), 573–589. doi:10.1007/BF02773288
Hossain, M. S. (2011). Panel estimation for CO2 emissions, energy consumption, economic growth, trade openness and urbanization of newly industrialized countries. Energy Policy 39 (11), 6991–6999. doi:10.1016/j.enpol.2011.07.042
Huang, L., and Zhao, X. (2018). Impact of financial development on trade-embodied carbon dioxide emissions: Evidence from 30 provinces in China. J. Clean. Prod. 198, 721–736. doi:10.1016/j.jclepro.2018.07.021
Inglesi-Lotz, R., Hakimi, A., Karmani, M., and Boussaada, R. (2020). Threshold effects in the patent growth relationship: A PSTR approach for 60 developed and developing countries. Appl. Econ. 52 (32), 3512–3524. doi:10.1080/00036846.2020.1713295
Jahanger, A., Usman, M., and Ahmad, P. (2022a). A step towards sustainable path: The effect of globalization on China’s carbon productivity from panel threshold approach. Environ. Sci. Pollut. Res. 29, 8353–8368. doi:10.1007/s11356-021-16317-9
Jahanger, A., Usman, M., and Balsalobre-Lorente, D. (2021). Autocracy, democracy, globalization, and environmental pollution in developing world: Fresh evidence from STIRPAT model. J. Public Aff. 2021, e2753. doi:10.1002/pa.2753
Jahanger, A., Usman, M., Murshed, M., Mahmood, H., and Balsalobre-Lorente, D. (2022b). The linkages between natural resources, human capital, globalization, economic growth, financial development, and ecological footprint: The moderating role of technological innovations. Resour. Policy 76, 102569. doi:10.1016/J.resourpol.2022.102-569
Jiang, T., Yu, Y., Jahanger, A., and Balsalobre Lorente, D. (2022). Structural emissions reduction of China's power and heating industry under the goal of "double carbon": A perspective from input-output analysis. Sustain. Prod. Consum. (prepublish) 31, 346–356. doi:10.1016/J.spc.2022.03.003
Kamal, M., Usman, M., Jahanger, A., and Balsalobre-Lorente, D. (2021). Revisiting the role of fiscal policy, financial development, and foreign direct investment in reducing environmental pollution during globalization mode: Evidence from linear and nonlinear panel data approaches. Energies (Basel). 14, 6968. doi:10.3390/en14216968
Ke, J., Jahanger, A., Yang, B., Usman, M., and Ren, F. (2022). Digitalization, financial development, trade, and carbon emissions; implication of pollution haven hypothesis during globalization mode. Front. Environ. Sci. 10. doi:10.3389/fenvs.2022.873880
Khan, M. I., Teng, J. Z., and Khan, M. K. (2020). The impact of macro- economic and financial development on carbon dioxide emissions in Pakistan: Evidence with a novel dynamic simulated ARDL approach. Environ. Sci. Pollut. Res. 27 (31), 39560–39571. doi:10.1007/s11356-020-09304-z
Khaskheli, A., Jiang, Y., Raza, S. A., Khan, K. A., and Qureshi, M. A. (2021). Financial development, international trade, and environmental degradation: A nonlinear threshold model based on panel smooth transition regression. Environ. Sci. Pollut. Res. 28 (21), 26449–26460. doi:10.1007/S11356-020-11912-8
Lahiani, A. (2020). Is financial development good for the environment? An asymmetric analysis with CO2 emissions in China. Environ. Sci. Pollut. Res. 27 (8), 7901–7909. doi:10.1007/s11356-019-07467-y
Lan, J., Kakinaka, M., and Huang, X. (2012). Foreign direct investment, human capital and environmental pollution in China. Environ. Resour. Econ. (Dordr). 51 (2), 255–275. doi:10.1007/s10640-011-9498-2
Le, H. P., and Ozturk, I. (2020). The impacts of globalization, financial development, government expenditures, and institutional quality on CO2 emissions in the presence of environmental Kuznets curve. Environ. Sci. Pollut. Res. 27 (18), 22680–22697. doi:10.1007/s11356-020-08812-2
Lee, C. G. (2009). Foreign direct investment, pollution and economic growth: Evidence from Malaysia. Appl. Econ. 41 (13), 1709–1716. doi:10.1080/00036840701564376
Li, G., and Wei, W. (2021). Financial development, openness, innovation, carbon emissions, and economic growth in China. Energy Econ. 97, 105194. doi:10.1016/J.ENECO.2021.105194
Li, S., Yu, Y., Jahanger, A., Usman, M., and Ning, Y. (2022). The impact of green investment, technological innovation, and globalization on CO2 emissions:evidence from MINT countries. Front. Environ. Sci. 156, 868704. doi:10.3389/fenvs.2022.868704
Liddle, B. (2017). Consumption-based accounting and the trade-carbon emissions nexus. Energy Econ. 69, 71–78. doi:10.1016/j.eneco.2017.11.004
Lin, B., and Zhu, J. (2019). The role of renewable energy technological innovation on climate change: Empirical evidence from China. Sci. Total Environ. 659, 1505–1512. doi:10.1016/j.scitotenv.2018.12.449
Long, X., Luo, Y., Wu, C., and Zhang, J. (2018). The influencing factors of CO2 emission Intensity of Chinese agriculture from 1997 to 2014. Environ. Sci. Pollut. Res. 25, 13093–13101. doi:10.1007/s11356-018-1549-6
Marques, A. C., Fuinhas, J. A., and Leal, P. A. (2018). The impact of economic growth on CO2 emissions in Australia: The environmental Kuznets curve and the decoupling index. Environ. Sci. Pollut. Res. 25 (27), 27283–27296. doi:10.1007/s11356-018-2768-6
Mikayilov, J., Geleotti, M., and Hasanov, F. (2018). The impact of economic growth on CO2 emissions in Azerbaijan. J. Clean. Prod. 197 (1), 1558–1572. doi:10.1016/j.jclepro.2018.06.269
Mohammadi, T. (2017). Economic growth, financial development and CO2 emission:PSTR approach Iranian. J. Econ. Stud. 5 (2), 145–171. doi:10.22099/ijes.2017.25858.1336
Muhammad, S., Long, X., Salman, M., and Dauda, L. (2020). Effect of urbanization and international trade on CO2 emissions across 65 belt and road initiative countries. Energy 196, 117102. doi:10.1016/j.energy.2020.117102
Nkundabanyanga, S. K., Kasozi, D., Nalukenge, I., and Tauringana, V. (2014). Lending terms, financial literacy and formal credit accessibility. Int. J. Soc. Econ. 41 (5), 342–361. doi:10.1108/IJSE-03-2013-0075
Omri, A., Daly, S., Rault, C., and Chaibi, A. (2015). Financial development, environmental quality, trade and economic growth: What causes what in MENA countries. Energy Econ. 48, 242–252. doi:10.1016/j.eneco.2015.01.008
Onuonga, S. M. (2020). The impact of financial development and economic growth on environmental quality of Kenya. J. Econ. Sustain. Dev. 11 (12), 15–26. Avaliable at: https://scholar.googleusercontent.cn/scholar?q=cache: 8wXwhQjL0Y8J: scholar.google.com/&hl=zh-CN&as_sdt=0.
Ozatac, N., Gokmenoglu, K. K., and Taspinar, N. (2017). Testing the EKC hypothesis by considering trade openness, urbanization, and financial development:the case of Turkey. Environ. Sci. Pollut. Res. 24 (20), 16690–16701. doi:10.1007/s11356-017-9317-6
Pata, U. K. (2018). Renewable energy consumption, urbanization, financial development, income and CO2 emissions in Turkey: Testing EKC hypothesis with structural breaks. J. Clean. Prod. 187, 770–779. doi:10.1016/j.jclepro.2018.03.236
Pollitt, H. (2020). Analysis: Going carbon neutral by 2060 ‘will make China richer’. Carbon Brief, 24. Avaliable at: https://reparti.free.fr/ pollitt920.
Presley, K., Wesseh, , and Lin, B. (2017). Climate change and agriculture under CO2 fertilization effects and farm level adaptation: Where do the models meet? Appl. Energy 195, 556–571. doi:10.1016/j.apenergy.2017.03.006
Qashou, Y., Samour, A., and Abumunshar, M. (2022). Does the real estate market and renewable energy induce carbon dioxide emissions? Novel evidence from Turkey. Energies 15, 763. doi:10.3390/en15030763
Rios, V., and Gianmoena, L. (2018). Convergence in CO2 emissions: A spatial economic analysis with cross- country interactions. Energy Econ. 75, 222–238. doi:10.1016/j.eneco.2018.08.009
Sadorsky, P. (2010). The impact of financial development on energy consumption in emerging economies. Energy Policy 38 (5), 2528–2535. doi:10.1016/j.enpol.2009.12.048
Samour, A., Baskaya, M. M., and Tursoy, T. (2022). The impact of financial development and FDI on renewable energy in the UAE:A path towards sustainable development. Sustainability 14, 1208. doi:10.3390/su14031208
Schmalensee, R., Stoker, T. M., and Judson, R. A. (1998). World carbon dioxide emissions: 1950–2050. Rev. Econ. Statistics 80 (1), 15–27. doi:10.1162/003465398557294
Shahbaz, M., Haouas, I., and Van Hoang, T. H. (2019). Economic growth and environmental degradation in Vietnam: Is the environmental Kuznets curve a complete picture? Emerg. Mark. Rev. 38, 197–218. doi:10.1016/j.ememar.2018.12.006
Simiyu, N. H. (2017). Environmental quality, trade openness and economic growth in Kenya: An implication of the environmental Kuznets curve. University of Nairobi. Doctoral dissertation. Avaliable at: https://erepository.uonbi.ac.ke/handle/11295/102955.
Tang, C. F., and Tan, B. W. (2015). The impact of energy consumption, income and foreign direct investment on carbon dioxide emissions in Vietnam. Energy 79, 447–454. doi:10.1016/j.energy.2014.11.033
Usman, M., Balsalobre-Lorente, D., Jahanger, A., and Ahmad, P. (2022b). Pollution concern during globalization mode in financially resource-rich countries: Do financial development, natural resources, and renewable energy consumption matter? Renew. Energy 183, 90–102. doi:10.1016/J.renene.2021.10.067
Usman, M., and Jahanger, A. (2021). Heterogeneous effects of remittances and institutional quality in reducing environmental deficit in the presence of EKC hypothesis: A global study with the application of panel quantile regression. Environ. Sci. Pollut. Res. 28, 37292–37310. doi:10.1007/s11356-021-13216-x
Usman, M., Jahanger, A., Makhdum, M. S., Balsalobre-Lorente, D., and Bashir, A. (2022a). How do financial development, energy consumption, natural resources, and globalization affect arctic countries' economic growth and environmental quality? An advanced panel data simulation. Energy 241, 122515. doi:10.1016/J.energy.2021.122515
Walter, I., and Ugelow, J. L. (1979). Environmental policies in developing countries. AMBIO A J. Hum. Environ. 8 (2), 102–109. Avaliable at: http://www.jstor.org/stable/4312437.
Wang, G., Deng, X., Wang, J., Zhang, F., and Liang, S. (2019). Carbon emission efficiency in China: A spatial panel data analysis. China Econ. Rev. 56, 101313. doi:10.1016/j.chieco.2019.101313
Wang, H., and Wei, W. (2020). Coordinating technological progress and environmental regulation in CO2 mitigation: The optimal levels for OECD countries & emerging economies. Energy Econ. 87, 104510. doi:10.1016/j.eneco.2019.104510
Wang, S. S., Zhou, D. Q., Zhou, P., and Wang, Q. W. (2011). CO2 emissions, energy consumption and economic growth in China: A panel data analysis. Energy Policy 39 (9), 4870–4875. doi:10.1016/j.enpol.2011.06.032
Xiong, L., Tu, Z., and Ju, L. (2017). Reconciling regional differences in financial development and carbon emissions: A dynamic panel data approach. Energy Procedia 105, 2989–2995. doi:10.1016/j.egypro.2017.03.716
Yang, B., Jahanger, A., and Khan, M. A. (2020). Does the inflow of remittances and energy consumption increase CO2 emissions in the era of globalization? A global perspective. Air Qual. Atmos. Health 13, 1313–1328. doi:10.1007/s11869-020-00885-9
Yang, B., Jahanger, A., Usman, M., and Khan, M. A. (2021). The dynamic linkage between globalization, financial development, energy utilization, and environmental sustainability in GCC countries. Environ. Sci. Pollut. Res. 28, 16568–16588. doi:10.1007/s11356-020-11576-4
Yang, L., and Li, Z. (2017). Technology advance and the carbon dioxide emission in China Empirical research based on the rebound effect. Energy Policy 101, 150–161. doi:10.1016/j.enpol.2016.11.020
Zaidi, S. A. H., Zafar, M. W., Shahbaz, M., and Hou, F. (2019). Dynamic linkages between globalization, financial development and carbon emissions: Evidence from Asia Pacific Economic Cooperation countries. J. Clean. Prod. 228, 533–543. doi:10.1016/j.jclepro.2019.04.210
Zarsky, L. (1999). Havens, halos and spaghetti: Untangling the evidence about foreign direct investment and the environment. Foreign direct Invest. Environ. 13 (8), 47–74.
Zhang, C., and Lin, Y. (2012). Panel estimation for urbanization, energy consumption and CO2 emissions: A regional analysis in China. Energy Policy 49, 488–498. doi:10.1016/j.enpol.2012.06.048
Zhang, J., Chang, Y., Zhang, L., and Li, D. (2018). Do technological innovations promote urban green development? —a spatial econometric analysis of 105 cities in China. J. Clean. Prod. 182, 395–403. doi:10.1016/j.jclepro.2018.02.067
Zhao, B., and Yang, W. (2020). Does financial development influence CO2 emissions? A Chinese province-level study. Energy 200, 117523. doi:10.1016/j.energy.2020.117523
Zhongming, Z., Linong, L., Xiaona, Y., Wangqiang, Z., and Wei, L. (2020). China going carbon neutral before 2060 would lower warming projections by around 0.2 to 0.3 degrees C. Available at: http://119.78.100.173/C666/handle/2XK7JSWQ/296144.
Keywords: financial development, foreign trade, carbon emissions, regional economic development level, panel smooth transition regression model
Citation: Sun Y (2022) Financial development, foreign trade, regional economic development level and carbon emissions. Front. Environ. Sci. 10:984203. doi: 10.3389/fenvs.2022.984203
Received: 01 July 2022; Accepted: 27 September 2022;
Published: 14 October 2022.
Edited by:
Enzo Barberio Mariano, São Paulo State University, BrazilReviewed by:
Ahmed Samour, Near East University, CyprusCopyright © 2022 Sun. This is an open-access article distributed under the terms of the Creative Commons Attribution License (CC BY). The use, distribution or reproduction in other forums is permitted, provided the original author(s) and the copyright owner(s) are credited and that the original publication in this journal is cited, in accordance with accepted academic practice. No use, distribution or reproduction is permitted which does not comply with these terms.
*Correspondence: Yongchun Sun, eml4aWFvcm9uZ2VyQDE2My5jb20=
Disclaimer: All claims expressed in this article are solely those of the authors and do not necessarily represent those of their affiliated organizations, or those of the publisher, the editors and the reviewers. Any product that may be evaluated in this article or claim that may be made by its manufacturer is not guaranteed or endorsed by the publisher.
Research integrity at Frontiers
Learn more about the work of our research integrity team to safeguard the quality of each article we publish.