 Taylor B. Craft
 Anne Beaulieu
 Theunis Piersma
 Ruth A. Howison
95% of researchers rate our articles as excellent or good
Learn more about the work of our research integrity team to safeguard the quality of each article we publish.
Find out more
ORIGINAL RESEARCH article
Front. Environ. Sci. , 02 November 2022
Sec. Conservation and Restoration Ecology
Volume 10 - 2022 | https://doi.org/10.3389/fenvs.2022.982925
This article is part of the Research Topic Biodiversity Mapping in Ecology and Conservation: Pitfalls, Uncertainties, and Creative Ways Forward View all 4 articles
Mapping is a core approach used to investigate and display spatial dynamics of biological diversity and habitats. In the Netherlands, agricultural lands occupy nearly two-thirds of the land surface and provide the greatest potential for habitat restoration; particularly in grassland-based dairy production systems, which comprise the largest share of these agricultural lands. When a crop rotation is applied to a long-term grassland, the resulting disruption of ecological complexity requires years–if not decades–to restore, even after reconversion. The availability of high-quality land-use data for measuring the spatio-temporal distribution of grassland legacies is thus essential for monitoring the dynamics of biodiversity in production grasslands. In this study, we reflect on the Basic Crop Registration (BRP) of the Netherlands, an open spatial data infrastructure developed for parcel-level crop registration and examine how it shapes our spatio-temporal understanding of land use. The BRP serves as an administrative basis for numerous national and local-level regulatory and financial arrangements, mainly aimed at agricultural actors. In this study, we repurposed BRP data to introduce a new perspective on depicting the stability of grasslands in a high-intensity agricultural region. We used this data to map the frequency of grassland-to-cropland conversions using 17 years of longitudinal crop records in southwest Friesland, Netherlands. The legacy effects of grassland-to-cropland conversion were investigated in a field study, where significant differences were found between new and long-term grasslands in plant community composition, soil organic matter content, bulk density, soil penetration resistance, and pH. In our analysis of BRP data, we discovered a significant number of grasslands that were recently converted from cropland but that were recorded as long-term grasslands. This affected approximately 12% of the study area from 2005–2021, which prevents the accurate tracking of grassland stability over time. This misclassification also adds uncertainty to the temporal context of the decline in grassland-dependent species in the region. However, using a spatially-explicit mapping approach, these misclassifications can be corrected and help produce an effective measure of grassland stability with potential as an agroecosystem monitoring tool for researchers, land-use planners, and policymakers.
As habitat loss from agricultural conversion has accelerated the global decline of biodiversity over the past century (Reidsma et al., 2006; Davison et al., 2021), monitoring trends and identifying patterns in land-use change have become foundational elements in ecological research, governance, and restoration. Mapping is a proven strategy to explore the spatial dimensions of changes in land use (Treitz and Rogan, 2004). Given that change over time, as well as magnitude, is crucial to monitoring and intervening, adding a temporal context to agroecosystem management is essential for assessing biodiversity trends and the adoption of effective nature conservation and restoration schemes. The distribution of biodiversity in farmed regions is intricately linked to both current and past agricultural management practices (Reidsma et al., 2006). The legacy effects of past land use, although difficult to describe in the absence of high-quality temporal data, are measurable through the biotic and abiotic qualities of present-day environments (Foster et al., 2003). For instance, while the immediate impact of cropland-to-grassland conversion is most visible in aboveground spaces due to the change in vegetation, numerous studies have also demonstrated that land-use legacies are evident in soils through their structural properties, the presence (or absence) of living organisms, and their chemical properties (Bürgi et al., 2017; Abraha et al., 2018; Glass et al., 2021).
Conventional row crop cultivation is typically an intensive process that disrupts the cycling of nutrients (Benbi and Brar, 2009; Scotti et al., 2015) and reduces the capacity of soil to perform regulating functions (Carter, 2002). In intensive farming systems, nutrient-depleted soils are maintained through high levels of chemical inputs that enable soils to support a limited number of plant species that tend to be functionally similar (Le Provost et al., 2020). Plant diversity is particularly relevant in the high-intensity agricultural landscapes of the Netherlands, where most biodiversity is restricted to the few extant herb-rich grassland meadows (Kleijn et al., 2001), and where borders between nature reserves and production land are blurry (Schekkerman et al., 2008). Industrialization of the Dutch agricultural landscape over the last several decades has led to the replacement of herb-rich meadows with monocultures of fast-growing ryegrasses (Lolium perenne and Lolium multiflorum) planted on polders with groundwater levels lowered by efficient underground drainage systems (Groen et al., 2012). Nearly two-thirds of the land area in the Netherlands is used for agriculture, the majority of which is dairy production grassland (EUROSTAT, 2021). These agricultural grasslands represent 25% of total land area (Schils et al., 2007). They are the largest potential provider of habitat for the nation’s biodiversity, which has become dependent on constructed and semi-natural landscapes following decades of natural habitat loss, in line with broader European trends (Henle et al., 2008; Kentie et al., 2015).
Defining and mapping grasslands are therefore crucial contributions to the development of nature-inclusive agroecosystems. The EU defines permanent grasslands as land used for at least five consecutive years to produce grasses or other herbaceous fodder (EUROSTAT, 2019). Before the 5-year period has been reached, these lands are otherwise defined as temporary grasslands. Mandates under the Common Agricultural Policy (CAP) require that EU member states maintain a ratio of permanent grasslands to total agricultural area that does not fall below 5%, in relation to a reference point designated in 2015 (OJEU, 2013). In areas where this condition is not met, EU member states have the authority to impose obligations for certain farmers to reconvert arable land to permanent grasslands.
Maintaining a stable balance between permanent grasslands and total agricultural area requires close monitoring. This monitoring should capture the grassland-to-cropland conversion frequencies at the parcel level and track the proportional area of temporary grasslands each year to determine future balances of permanent grassland and arable land. While some EU member states such as Germany require farmers to receive authorization before converting permanent grasslands–likely restricting the loss of permanent grasslands (Hart, 2015)—farmers in the Netherlands are informed of their reconversion obligation only after the 5% threshold has been reached (OJEU, 2013).
Mapping the distribution of biodiversity is an important target for ecologists (Turner et al., 2003; Secades et al., 2014; O’Connor et al., 2015; Malavasi, 2020). However, other kinds of maps, such as land use maps, are also significant to help address the current biodiversity crisis, since they enable the exploration of the interactions between different factors that shape the distribution and health of habitats. The work on which we report here is part of a larger set of inter-related projects on landscape ecology in the Netherlands. The use of maps, and in particular, maps of geographically-explicit farming operations, plant diversity, soil functioning, arthropod and soil macrofauna abundance, predator distributions, and demography of grassland breeding birds, enables us to use spatial reference systems as an integrative space to combine insights from different sub-projects (Kentie et al., 2016; Howison et al., 2018; De Felici et al., 2019; Hooijmeijer et al., 2021). Spatially explicit mapping has the advantage of supporting the combination of different kinds of data created in the course of our ongoing research, carried out by a large, multidisciplinary team, and promises to facilitate the integration of existing data about the area of interest in our work. However, as different types of spatial data are combined, we become increasingly aware of the need to reflect on and make explicit issues of early-stage data production in the spatial data systems on which we rely.
In our work of creating maps of changing biodiversity in an area of intensive study in the Netherlands, the legacy of existing systems and data shapes our understanding of the context of biodiversity–particularly in agricultural landscapes. Loosely arranged farming structure data in the Netherlands go back as far as 1851 (CBS, 2022a). However, the first systematic land-use record-keeping enterprise began when Statistics Netherlands (CBS) initiated an annual agricultural census following WWII–a system that continues to the present day. Additionally, land-use data in the Netherlands are available (for a fee) by the Land Use Database of the Netherlands (LGN), which has produced 10 land-use maps using classified optical (satellite and aerial) imagery since 1986 (Thunnissen and de Wit, 2000).
In this study, we combined multiple years of spatially-explicit crop records using a unique land-use database to depict the frequency of grassland-to-cropland conversions and the share of permanent grasslands in a region where biodiversity is intricately linked to agricultural grasslands. We created an attribute table of parcel-level crop registrations from 2005–2021 to track the conversion frequency of permanent grassland to arable land (and vice versa), and mapped these frequencies at a regional scale.
Further, we demonstrated the ecological effects of grassland-to-cropland conversion through a field-based case study in southwest Friesland, the Netherlands. To assess the persistence of land-use legacies and to determine whether past land use offers explanatory power for the ecological properties of current landscapes, we surveyed vegetation and analyzed soil samples from grassland parcels across a range of land-use histories.
Using proven approaches to the study of classifications (Bowker and Star 1999) and responsible data science (Beaulieu and Leonelli 2021), we extended their application by exploring the tensions and compromises needed to use these data to support biodiversity mapping. We conducted a critical evaluation of how assumptions made in the data collection and architecture of the database affect the spatialization of biodiversity knowledge (Malavasi, 2020). We explicitly designed our study with the inclusion of the data curators and hereby contribute to the movement for critical reflection on the limitations of proxies for biodiversity (Turnhout and Purvis 2020) by documenting the advantages and pitfalls of acquiring, processing, and analyzing spatial data for use in biodiversity research.
In this study, we examine the Basic Registration of Crop Parcels (BRP) National Database, which has provided publicly available vector data of all agricultural parcels registered in the Netherlands since 2009. The level of granularity and the time-frequency of land-use data in this system make the BRP an attractive source for agricultural data, and national-level open land-use data such as the BRP have applications for a wide range of end-users. Numerous publications use various inputs from the BRP database (Table 1), and an even greater number of references can be found in the grey literature. Advisory services, such as 1 Boerenbunder, 2 Groenmonitor, and the LGN connect directly to the BRP for their consultancy data on crop information and spatial attributes of both individual parcels and large-scale holdings. Perhaps most consequentially, the Netherlands draws from BRP data to satisfy EU agricultural reporting requirements (CBS, 2022b). Data from the BRP are made publicly available online with curation collaboration through an assortment of government agencies, including the Netherlands Enterprise Agency (RVO), Public Mapping Service (PDOK), CBS, and others. Therefore, the BRP plays an important role in providing data for research, land governance, and a large number of public-private partnerships in the Netherlands. Hence, the BRP shows great potential as a tool for agroecosystem monitoring.
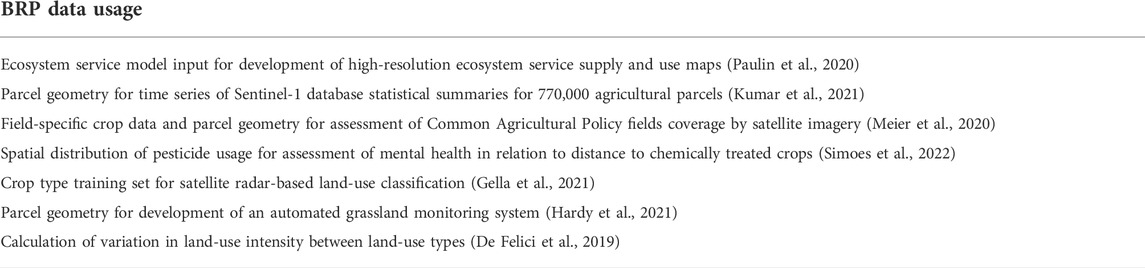
TABLE 1. Indicative table of publications that implement BRP data.
To provide insight into the spatio-temporal composition of Dutch grasslands and farmland biodiversity, we used a GIS-based approach (Figure 1) to quantify the frequency of grassland-to-cropland conversions and identify misclassified parcels, coupled with a local case study that examines the linkages between grassland-to-cropland conversion and landscape characteristics. BRP crop registration data were downloaded from the Dutch national geodata platform 3 PDOK as file geodatabases (2009–2019) and GeoPackages (2020–2021). Data from 2005–2008 are not publicly available but were acquired directly through correspondence with the RVO (the primary data curators) as shapefiles. We clipped BRP data to the municipality of southwest Friesland (i.e., Gemeente Súdwest-Fryslân, administrative boundaries also downloaded from PDOK) as this area is both heavily dominated by grassland agriculture and supports a key aspect of Dutch grassland biodiversity, such as the national bird of the Netherlands, the Black-tailed Godwit Limosa limosa (Kentie et al., 2016). We study this area intensively (Groen et al., 2012; Kentie et al., 2014; Howison et al., 2018; Hooijmeijer et al., 2021) and have established contacts with landowners, agricultural collective representatives, and collected information on past and current land management practices.
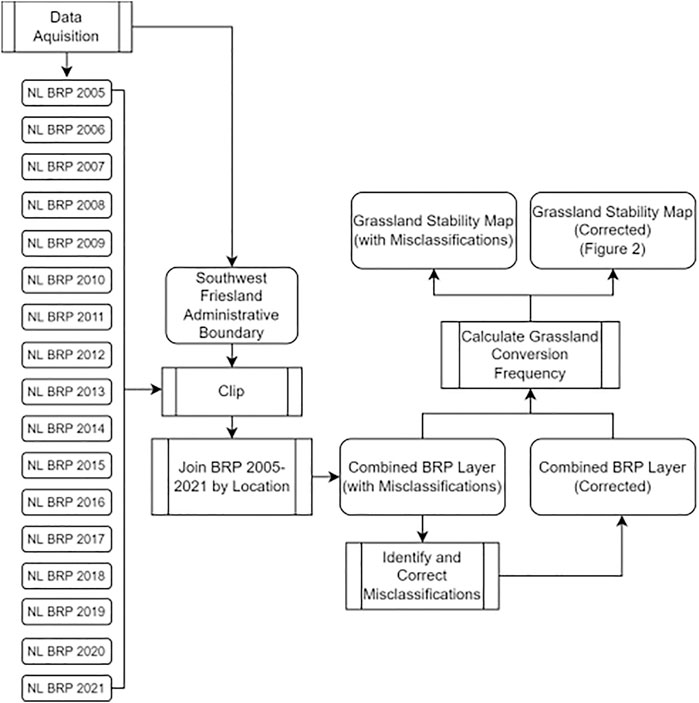
FIGURE 1. Generalized GIS-based workflow for calculating the frequency of grassland-to-cropland conversions in an intensive agriculture region of the Netherlands using open-source BRP land-use data.
Land-use histories for individual parcels within the study area were configured by joining consecutive years of BRP layers, resulting in a combined feature class of all crop registrations between 2005 and 2021. Registrations were not available each year for every parcel. An exact cause for these missing data could not be pinned down precisely, as the explanation provided by the RVO was that the uploading of certain crop registrations was unsuccessful in some years, particularly in 2020. As adding interpolation for classifying the missing crop records would likely compound any existing errors in the dataset, our further analyses only considered parcels with the full range of consecutive registrations throughout the study period. In this manner, we minimized sources of uncertainty that could influence the calculation of land-use statistics. For other purposes, comprehensiveness may weigh more heavily, so that inclusion of these inconsistently documented parcels can be warranted, for instance in our use of maps as the basis for integrating insights across our multi-disciplinary work on this specific region.
The number of years each parcel was registered as a long-term grassland was calculated by adding each record of permanent and natural grassland registrations within our combined BRP dataset. Natural grasslands, similar to permanent grasslands, also require 5 years of separation following arable crop cultivation. However, in the case of natural grasslands, grass yield is restricted to 5 tons ha−1 year−1. Here we define both permanent and natural grasslands as long-term grasslands and describe the cumulative time a parcel has spent as a long-term grassland as grassland stability. A natural breaks algorithm (Jenks, 1967) was used to minimize variation within groups while maximizing variation between groups in order to classify agricultural land-use into four categories of grassland stability: 1) arable lands (no long-term grassland records), frequent crop rotation (1-5 long-term grassland records), 2) intermittent crop rotation (6–16 years of long-term grassland records), and 3) long-term grasslands (long-term grassland throughout the study period).
We identified temporary grasslands that were misclassified as long-term grasslands by querying all instances of long-term grassland parcels with an arable crop rotation within the preceding 1–5 years. Crop registrations from 2005 were used as the reference year, as this was the earliest year from which crop data were available. Therefore, misclassifications were only identifiable beginning in 2006 with a 1-year reference, 2007 with a 2-year reference, and so on. Given that 2010 was the first year of crop records that we could validate with the full 5 years of past crop records, the number of identified misclassifications is likely to be an underestimation.
We created layers of misclassified parcels separated by year and selected the equivalent parcels in our combined BRP layer using ‘Select by Location’. From this selection, we reclassified the long-term grasslands as temporary grasslands. To calculate the total percentage of misclassified parcels, we divided the total area of misclassified parcels by the total area of the combined BRP layer. Analyses were performed in QGIS 3.16 and R (R Core Team, 2017).
In spring 2022, we surveyed 21 agricultural grasslands grown on clay soils in southwest Friesland, Netherlands with a mean area of 4.6 ha ± 2.3 SD (min: 1.6, max: 11.4). This 90,787 ha study area is primarily agricultural grasslands used for dairy production, interspersed with fields of arable crops such as maize (also grown as fodder), and potatoes, tulips, and sugar beets as cash crops. Using the combined BRP map, we selected fields along a gradient of grassland stability which ranged from grasslands established as recently as 2020 to long-term grasslands with no cropland records (see Supplementary Table S1 in Supplementary Material for the land-use history of surveyed parcels).
In each selected parcel, plant species were identified using a line-intercept sampling method along a 30 m transect beginning from 10 m away from the edge of each field towards the center. 30 m transects were chosen based on experience garnered from researchers who previously conducted plant surveys in the study area (see Groen et al., 2012; Howison et al., 2018). Given the homogenous vegetation and flat topography of fields in the region (particularly within larger parcels), a 30 m transect was found to accurately capture the variation of vegetation in each field. In addition, as management is carried out at the field level, low variation was encountered. At every transect, a rod was placed at 1 m increments and each plant touching the rod was identified. Transects were placed perpendicular to foot drains (when present) to capture variation in surface topography and moisture. Species richness was calculated as the total number of species found per field. Vegetation height was recorded every 2 m for 20 m along the transect (10 total points). At every point, a ruler was placed and the highest vegetation touching the ruler was stretched to its maximum height along the ruler. Vegetation density was measured at the same 10 points by observing the lowest visible marking on the ruler when placed on the ground.
A handheld penetrometer (Eijkelkamp Type IB) was used to obtain a direct measure of soil penetration resistance along the same 10 points as vegetation height and density. We collected soil samples at random locations from the topsoil (0–5 cm) as this profile is most relevant for farmland biodiversity, such as Dutch meadow birds which probe for food items within the upper soil layer. Soil bulk density (BD) was measured to indicate the degree of soil compaction and other structural support factors related to the movement of belowground water, air, and microorganisms. BD was sampled using a metal ring (5 cm diameter X 5 cm depth) and calculated as the dry mass of soil per volume. We calculated soil organic matter (SOM) content using loss-on-ignition (Hoogsteen et al., 2015) at 550°C for 3.5 h. Analyses of pH and salinity were conducted in the laboratory using a well-mixed 1:3 soil and distilled water solution.
Similar to the map of grassland stability, surveyed grassland parcels were classified using a Natural Breaks classification (Jenks, 1967) based on their cumulative number of years (between 2005 and 2022) as long-term grassland. However, as only grassland parcels were surveyed, a class for arable fields was not required, resulting in three classes: 1) frequent crop rotation (≤5 years), 2) intermittent crop rotation (6–17 years), and 3) long-term grassland (18 years). Although 2021 was the most recent year of available BRP data (17 total years available) we were able to configure 18 years of land-use data for the surveyed fields since we could validate their 2022 land use in the field.
Non-metric multidimensional scaling (NMDS) with a Bray-Curtis dissimilarity measure was used to visualize patterns between plant communities of the three classes of surveyed grasslands with the package vegan (Oksanen et al., 2017). A Hellinger transformation (Legendre and Gallagher, 2001) was applied to convert raw abundance values into relative abundance and the function envfit was used to fit projections of environmental variables correlated with the plant community ordination. The adonis function was used to conduct a permutational multivariate analysis of variance (PERMANOVA), which tests differences between the centroids of the dissimilarity matrix. A pairwise adonis test based on Bray-Curtis distances was used to establish multilevel pairwise comparisons between grassland stability classes.
Since the ordination revealed little difference between sites with frequent crop rotations and intermittent crop rotations (but showed a distinct difference between frequent crop rotation and long-term grassland), the surveyed fields were reclassified into two new classes: new (n = 10) (used as cropland at least once throughout the study period) and mature (n = 11) (no crop rotations during the study period). Between these two groups, we used independent T-tests to compare means of SOM, BD, penetration resistance, pH, salinity, plant species richness, and variation in plant height/density. Diversity indices and functional group diversity were not considered in this study as the limited number of species found in our study area limits the clear differentiation of these additional measures between grassland stability classes. A Shapiro-Wilk normality test for each t-test and an F-test were used to verify homogeneity in variances between the two classes. All statistical analyses were performed in R (R Core Team, 2017).
Between 2005 and 2021, the agricultural landscape of southwest Friesland comprised an area of 68% long-term grassland, 14% grassland with an intermittent crop rotation, 12% grassland with a frequent crop rotation, and 4% cultivated fields (Figure 2). From 2006 to 2021, approximately 12% of the study area consisted of parcels erroneously classified as long-term grassland within 5 years following an annual crop. Most misclassifications (93%) occurred between 2006 and 2014 (Figure 3). The corrected classification data led to a marginal change in the area of both arable fields and long-term grasslands (0.61% increase and 0.38% decrease, respectively), while a more significant change after the correction was found between fields classified with intermittent crop rotations (4.21% decrease) and frequent crop rotations (3.97% increase). In total, approximately 3,500 ha of newly-established grassland was misclassified as permanent or natural grassland from 2005 to 2021. Since many of these parcels were misclassified for several years, a cumulative 15,000 ha of temporary grassland in southwest Friesland was misclassified as long-term grassland (Figure 3). While the change in the area of long-term grassland has remained stable from 2006–2021, an increase in the rate of change was found between 2006 and 2014 (Figure 4). Although reported results from the original BRP data are comparable to our corrected findings, we find that the original dataset consistently overestimates the long-term grassland area throughout the study period, particularly in 2010 where an 8% difference can be seen (Figure 4). Moreover, an area of 12,315 ha (5,781 parcels) lacked registration for at least 1 year between 2005 and 2021, representing nearly 30% of the total study area (grey parcels in Figure 2).
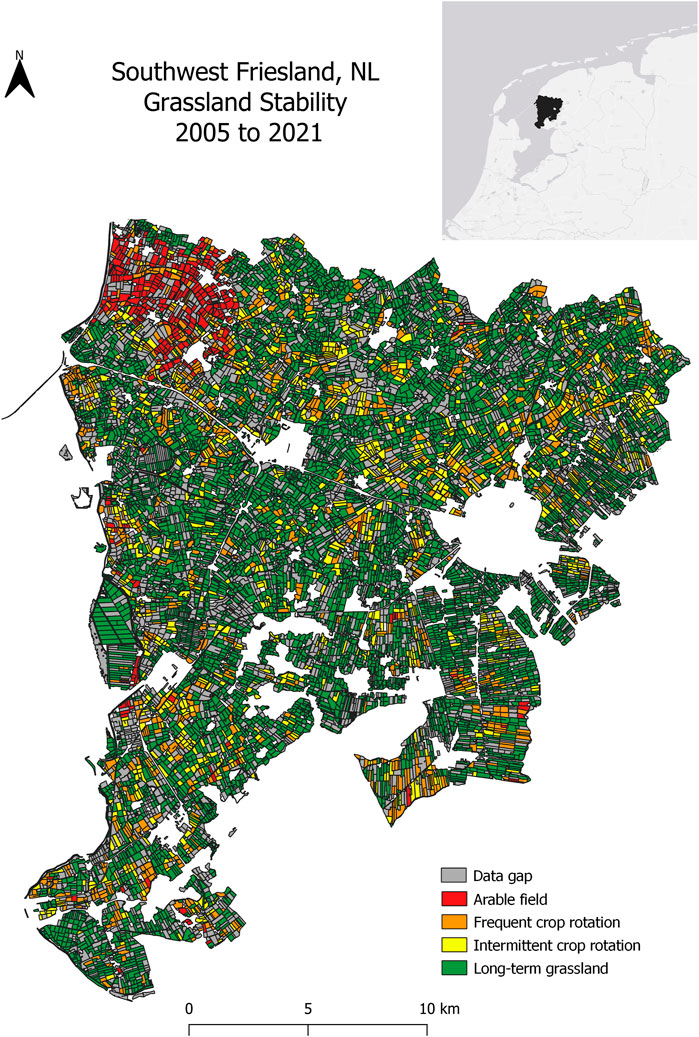
FIGURE 2. Grassland stability map described by the frequency of grassland-to-cropland conversions from 2005–2021 in southwest Friesland, NL. Gray parcels indicate the absence of crop registrations in at least 1 year. Other parcels are colored by their number of records as long-term grassland between 2005 and 2021: Arable fields = no records; Frequent crop rotation = 1–5 years; Intermittent crop rotation = 6–16 years; Long-term grassland = 17 years (full duration of study period).
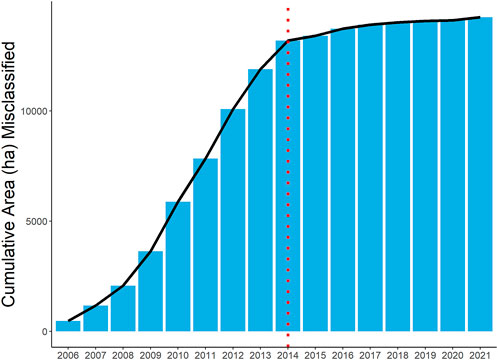
FIGURE 3. The cumulative area of grassland parcels misclassified as long-term grasslands within 5 years of an arable crop rotation in southwest Friesland, NL. 93% of misclassifications occurred before the vertical red line between 2006 and 2014.
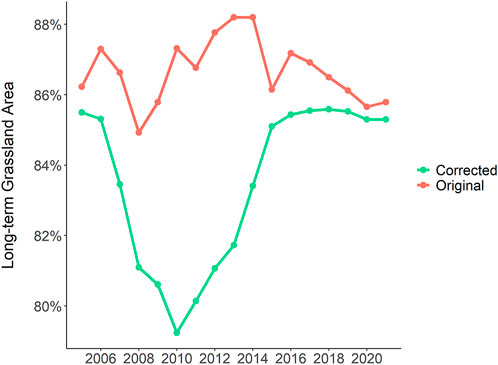
FIGURE 4. Percentages of long-term grassland cover from 2005–2021 in southwest Friesland, NL calculated from original BRP data (red line) and corrected BRP data (green line). See Supplementary Table S5 in Supplementary Table for annual change in long-term grassland area.
Non-metric multidimensional scaling ordination results (Figure 5) show that plant species with greater abundances such as L. perenne, S. media, P. annua, and T. officinale separate grasslands with frequent and intermittent crop rotations from long-term grasslands. In long-term grasslands, the plant community associations appear to be more loosely arranged, compared to the tighter groupings found in grasslands with frequent and intermittent crop rotations. Environmental variables with a strong correlation to plant communities were soil bulk density, the number of cumulative years as a long-term grassland, soil organic matter, and penetration resistance (see Supplementary Table S2 in Supplementary Material for complete regression table). In total, 29 plant species were identified. NMDS results reported a 2D stress value of 0.1, indicating a stable fit. PERMANOVA results (Supplementary Table S3 in Supplementary Material) indicate a significant (F = 2.52, r2 = 0.23, p = 0.04) difference between the plant communities found in fields with frequent crop rotations, intermittent crop rotations, and those with long-term grasslands. Pairwise comparisons showed significant differences between parcels with frequent crop rotations and long-term grassland (p = 0.04), but not between long-term grasslands and intermittent crop rotations, or frequent crop rotations and intermittent crop rotations (Supplementary Table S4 in Supplementary Material).
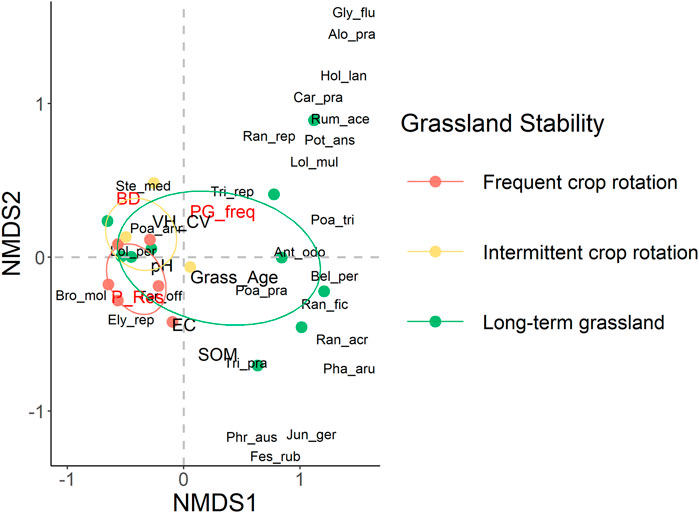
FIGURE 5. Grassland plant community ordination plot with results of non-metric multidimensional scaling analysis (NMDS) of abundance data (see Supplementary Table S6 in Supplementary Material for full species names). Environmental variables are fitted to visualize their correlation with the ordination: soil bulk density (BD), cumulative years as a permanent grassland (PG_freq), years since last conversion (Grass_Age), soil penetration resistance (P_Res), soil organic matter content (SOM), coefficient of variation in plant height (VH_CV), electroconductivity (EC), and pH. Environmental variables significantly correlated (p < 0.05) with the ordination are indicated in red.
Independent t-tests seen in Figure 6 showed that mature grasslands contained significantly (p = 0.0059) higher levels of SOM than new grasslands. Soil bulk density was found to be significantly (p = 0.002) higher in new grasslands, as well as soil penetration resistance (p = 0.019). Electroconductivity (EC) showed weak ties to grassland maturity (see Supplementary Figure S1 in Supplementary Material for full t-test results) but pH reacted significantly (p = 0.005) with new grasslands displaying a higher range of pH. Very few plant species were found within new grasslands parcels, with only six species being the highest number identified and just a single species, L. Perenne, found in multiple parcels. Plant species richness increased significantly (p = 0.048) in mature grasslands, with a maximum of 13 species present. The coefficient of variation in plant height was significantly (p = 0.015) higher in mature grasslands, although the coefficient of variation in plant density was similar between both classes.
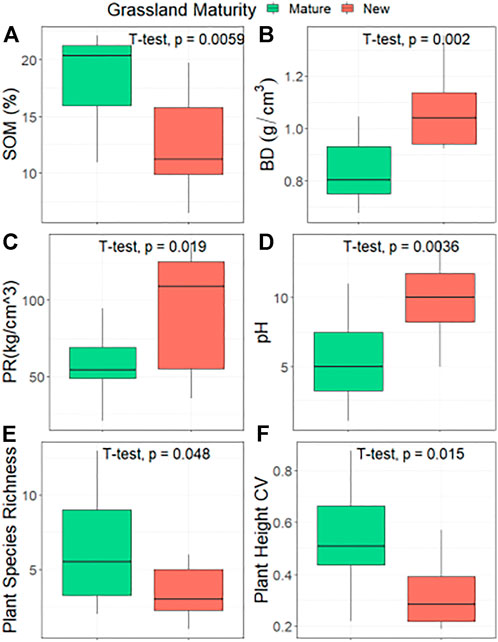
FIGURE 6. Independent T-tests comparing differences in soil properties and vegetation communities between two levels of grassland maturity: mature grasslands (no records of arable cropping between 2005 and 2021) and new grasslands (at least one crop rotation between 2005 and 2022). Labels (A) SOM - soil organic matter; (B) BD–bulk density; (C) PR–penetration resistance; (D) pH; (E) Plant Species Richness; (F) Plant Height CV–coefficient of variation in plant height.
The land-use legacy analysis of BRP data served dual purposes: 1) we demonstrated the potential of mapping ecological data using tools developed by and for an intensive agricultural system; and 2) we indicated how inconsistencies in the current BRP data infrastructure can be identified with a spatial query-based approach. Using a measure of landscape stability, we introduce a novel perspective on identifying ecologically valuable areas outside of the Natura 2000 network and other conventionally protected areas. As ecosystem functioning differs between temporary and long-term grassland, it is therefore imperative to accurately monitor their spatio-temporal distribution and maintain a balance to support the continuous delivery of ecosystem services provided by grasslands.
The land-use legacy analysis indicates that over two-thirds of agricultural land in southwest Friesland is grassland that has not been turned over for arable cropping since at least 2005. Conversely, a third of agricultural land has been used either continuously for cropland or included at least one crop rotation between 2005 and 2021. Throughout this period, over 3,500 ha of temporary grassland has been misclassified as a long-term grassland, representing 12% of the study area. Most of the parcels within these 3,500 ha were misclassified for multiple years, resulting in a cumulative misclassified area of nearly 15,000 ha (52% of the total surface area). We also expect that the area of misclassified parcels is underestimated between 2006 and 2010, as the full 5-year reference period of preceding crop registrations was unavailable. The total area of long-term grasslands was largely unaffected by the corrections because only parcels with crop rotations required 5 years of temporary grassland registration. Therefore, most misclassifications occurred in parcels with at least one crop rotation, with fewer corrections needed for parcels registered as continuously arable or continuously long-term grassland. To ascertain the extent to which parcels of grassland without crop rotations have been correctly registered, additional documentation and verification on the part of RVO would be invaluable. In other words, metadata and data curation are once again shown to be essential to the responsible use of data.
The conversion of a perennial grassland to an arable field is an ecologically disruptive process that requires time for soil dynamics and floral communities to return to their baseline state after they are restored to grasslands (Bruun et al., 2001; Bürgi et al., 2017; Le Provost et al., 2020). The land-use legacy analysis performed here shows that for several years, the BRP did not fully capture the area of recovering grasslands, resulting in an incomplete outlook of the status of long-term grasslands in the Netherlands on a year-by-year basis. Based on this, as well as the significant area of unregistered parcels, we recommend that the BRP database be updated accordingly. While existing BRP data is sufficient for most agricultural actors, existing misclassifications pose a challenge in terms of quantifying and mapping grassland coverage throughout the Netherlands, and those interested in monitoring the evolution of grassland land cover require an updated land-use database.
The variation we found between soil and plant communities in grasslands with different land-use histories emphasizes the importance of considering land-use legacy effects in ecological studies and land-use planning decisions. Clear differences in soil bulk density and penetration resistance were found between long-term grasslands and newly-established grasslands, indicating that the frequency of grassland-to-cropland conversion is a significant determinant of soil structure within agricultural grasslands. Maintaining sufficient organic matter content is fundamentally important for soil life, nutrient cycling, drainage, and numerous other ecosystem functions that directly affect human livelihoods (Zhang et al., 2007; Wilkinson et al., 2009; Jhariya and Singh, 2021; Haj-Amor et al., 2022). In line with other studies (Pulleman et al., 2000), we found soil organic matter content is greatly reduced in recently converted grasslands compared to long-term perennial grasslands. In addition, we found that grasslands with a history of recent conversions displayed a relatively narrower range of soil pH, while the pH of long-term grasslands had a wider and more acidic pH range, potentially creating habitat for less productive–but more diverse–plant species (Stevens et al., 2010).
In the aboveground space, we found that higher grassland-to-cropland conversion frequencies are linked to reduced plant species richness and height variation and ordination showed that grasslands grouped by their past conversion frequencies display a clear distinction between the composition and quality of their plant communities with greater relative abundances of perennial species in grasslands with histories of crop rotations. The considerable overlap seen in plant communities between sites with frequent and intermittent crop rotations suggests that even a low number of grassland-to-cropland conversions can result in similar plant communities as frequently-converted grassland.
The multi-generational challenge of rapidly declining soil health and biodiversity in agricultural lands (Brown, 1984; Gebremedhin et al., 2022) continues to persist. While it is impractical to propose the complete stoppage of grassland-to-cropland conversion, we recommend that deliberate consideration be applied regarding the spatio-temporal scales of mature grassland loss in relation to ecologically-sensitive landscapes, such as meadow bird reserves. Known havens of grassland plant species should be maintained as long-term grasslands and when necessary, crop rotations should be added in phases that allow sufficient recovery time of adjacent grasslands and within areas that have a stable balance between permanent grasslands and cropland, while ensuring an ample buffer area of long-term grassland. In regions with agriculture-dependent wildlife, accurate monitoring, and inventorying of these agroecosystems–with consideration for the soil recovery timeline and current landscape configuration–is essential, especially in the present case of the Netherlands where the knowledge infrastructure exists to do so.
The procedure for combining BRP data and rectifying past misclassifications of long-term grasslands is feasible at the national level. We expect that the upscaling of this land-use legacy analysis can reveal pockets of stable or unstable grasslands around the country, which may be informative for the planning of nature reserve buffers and evaluating the ratio of long-term to temporary grasslands at regional or local scales. Currently, most EU member states (including the Netherlands) maintain their ratio of permanent grasslands at the national level (Hart, 2015). However, the configuration of landscapes–in relation to biodiversity–matters at different scales and reducing trends to the national level may misrepresent the on-the-ground threats faced by vulnerable wildlife populations. Directives from Article 45 of EU REG No 1307/2013 (OJEU, 2013) allow member states to require prior authorization for landowners before grassland-to-cropland conversion. In order to implement the authorization system effectively, authorities should identify priority areas based on evidence-based criteria. We contend that the frequency of past conversions, based on ecological merit as demonstrated in the current study, fits into a scheme of evidence-based criteria for prior authorization. By adopting a measure of grassland stability, we would expect a marked improvement in the Dutch agricultural inventory infrastructure that can help optimize green payments, better inform agricultural consultants, and provide a relevant and accountable foundation for building biodiversity-supporting agroecosystems. Future work will involve upscaling the grassland stability measure to the national level, expanding the field surveys to account for different arable crop types, nutrient input regimes, and soil types, and measuring more indicators of biodiversity.
Our extension of the use of BRP data, originally created to prepare the agricultural census, reveals that different dimensions of the data become crucial when we engage in assessments of land use in terms of biodiversity rather than agricultural administration. However, several issues arise when this infrastructure, developed and used to document agricultural activities, is used as a source to elaborate insights on biodiversity trends. Such tensions have been identified as general issues in earlier work.
In a key contribution, Malavasi (2020) notes three kinds of issues that challenge reliance on contemporary mapping technologies and conventions for territorially-focused conservation practice. The first two are preferential mapping, where elements that are easier to map are also more likely to be mapped, and unequal mapping, where some types of knowledge (indigenous knowledge) remain undocumented. Given the highly enculturated, regulated, and monitored state of the Dutch territory, neither issue was prominent in our case. A third issue identified by Malavasi, the effectiveness, and effect of mapped conservation spaces does manifest in our case. There is an implicit hierarchy in the classification of protected and non-protected areas and of land used for crops rather than grassland, and these classifications foreground a certain perspective on agriculture as distinct from, but transformable into, nature.
Our case foregrounds a fourth kind of issue that arises as a result of a data journey when data produced in one context is repurposed for use in a different one (Leonelli and Tempini 2020). As we incorporated data about land use produced in an administrative context from an agricultural perspective, we were able to discover and document a set of important organizing assumptions about BRP as a source for biodiversity mapping. As noted above, what counts as permanent/long-term grassland in agricultural and biodiversity understandings reveals ontological differences, as well as different priorities between the administrative and scientific use of this data infrastructure. The data needed to administer financial compensation and to show compliance with EU regulations must answer different standards of accuracy and relevance and involves different kinds of biases (if only because of the financial incentives in recording land use). Our struggles with uncertainties deriving from technical implementation (the “year 2020” issue) or omission (data voids in the form of unregistered parcels) and lack of meta-data further reveal the contrasting aims of data production and use have very real consequences for empirical work.
These issues all result in what we could term misclassifications of agricultural parcels. But the sources and implications for research differ across these issues, and that is why we have attempted to signal the various shortcomings as precisely as possible. They are the responsibility of different actors and arise at different points in the use of the mapping infrastructure so that there is no single solution to address them all. For each issue, we therefore documented their effect on the data collected and on our repurposing of these data. As such, our work is placed at the intersection of critical cartography (Turnbull, 1994) and counter-mapping (Peluso, 1995), in that it reveals errors through critical analysis while also seeking to connect to existing mapping efforts through careful, situated approaches to data (Dalton and Stallmann, 2018).
Site history in agricultural grasslands is an influential element in ecosystem functioning and along with human drivers, should be recognized in measures toward safeguarding biodiversity. Spatially explicit land-use data that include a temporal component are important for assessing patterns at multiple scales and providing policymakers with a more well-developed context for decision-making in agricultural regions. Mapping can therefore play an important role in understanding land-use dynamics. Malavasi (2020, page 2) notes that “Overall, high technological performances, dominant scientific paradigms, and cartographic assumptions make biodiversity maps appear to be reliable, legitimate and truthful picture [s] of the natural world….” Our aim is to make explicit and address the issues that arise not only in the production but also in the flow and repurposing of data. This reflexive, comprehensive approach contributes to credible (because evidence-based), responsible (because accountable), and actionable (because relevant) knowledge for biodiversity.
The original contributions presented in the study are included in the article/Supplementary Material, further inquiries can be directed to the corresponding author.
All authors contributed to the conceptualization of the study; TC and RH collected and analyzed the data; TC wrote and prepared the original draft; all authors contributed to manuscript revision.
Funding for this research was through LIFE IP GrassBirdHabitats (LIFE19 IPE/DE/000004), the 2014 Spinoza Award to T.P. from the Netherlands Organisation for Scientific Research, and Gieskes-Strijbis.
We would like to thank the following people for their helping in the field and lab: Floor Hoevers, Michella Ligtelijn, Renée Veenstra, Jos Hooijmeijer, and Nelly Eck. We thank individual landowners, farmers, Staatsbosbeheer, and It Fryske Gea for giving us access to their land.
The authors declare that the research was conducted in the absence of any commercial or financial relationships that could be construed as a potential conflict of interest.
All claims expressed in this article are solely those of the authors and do not necessarily represent those of their affiliated organizations, or those of the publisher, the editors and the reviewers. Any product that may be evaluated in this article, or claim that may be made by its manufacturer, is not guaranteed or endorsed by the publisher.
The Supplementary Material for this article can be found online at: https://www.frontiersin.org/articles/10.3389/fenvs.2022.982925/full#supplementary-material
1Boerenbunder (2022). Boerenbunder. Available at: https://boerenbunder.nl/[Accessed 20 June 2022].
2Groenmonitor (2022). Groenmonitor. Available at: https://www.groenmonitor.nl/[Accessed 20 June 2022].
3PDOK (2021). National georegister. Basisregistratie Gewaspercelen (BRP) ATOM. Available at: https://www.nationaalgeoregister.nl/geonetwork/srv/dut/catalog.search#/metadata/b812a145-b4fe-4331-8dc6-d914327a87ff?tab=contact [Accessed 20 June 2022].
Abraha, M., Gelfand, I., Hamilton, S. K., Chen, J., and Robertson, G. P. (2018). Legacy effects of land use on soil nitrous oxide emissions in annual crop and perennial grassland ecosystems. Ecol. Appl. 28, 1362–1369. doi:10.1002/eap.1745
Beaulieu, A., and Leonelli, S. (2021). Data and society: A critical introduction. Los Angeles, CA: SAGE Publications Sage CA.
Benbi, D. K., and Brar, J. S. (2009). A 25-year record of carbon sequestration and soil properties in intensive agriculture. Agron. Sustain. Dev. 29, 257–265. doi:10.1051/agro/2008070
Bowker, G. C., and Star, S. L. (1999). Sorting things out: Classification and its consequences. Cambridge, MA, USA: MIT Press.
Bruun, H. H., Fritzbøger, B., Rindel, P. O., and Hansen, U. L. (2001). Plant species richness in grasslands: The relative importance of contemporary environment and land-use history since the iron age. Ecography 24, 569–578. doi:10.1111/j.1600-0587.2001.tb00491.x
Bürgi, M., Östlund, L., and Mladenoff, D. J. (2017). Legacy effects of human land use: Ecosystems as time-lagged systems. Ecosystems 20, 94–103. doi:10.1007/s10021-016-0051-6
Carter, M. R. (2002). Soil quality for sustainable land management. Agron. J. 94, 38–47. doi:10.2134/agronj2002.3800
CBS (2022a). Agricultural census. Statistics Netherlands. Available at:https://www.cbs.nl/en-gb/our-services/methods/surveys/brief-survey-description/agricultural-census.(Accessed 27 June 2022).
CBS (2022b). Landbouw. Agriculture; from 1851. Available at: https://opendata.cbs.nl/statline/#/CBS/nl/dataset/71904ned/table?ts=1655984025375. (Accessed 23 June 2022).
Dalton, C. M., and Stallmann, T. (2018). Counter-mapping data science. Can. Geogr./Le Géogr. Can. 62, 93–101. doi:10.1111/cag.12398
Davison, C. W., Rahbek, C., and Morueta-Holme, N. (2021). Land-use change and biodiversity: Challenges for assembling evidence on the greatest threat to nature. Glob. Chang. Biol. 27, 5414–5429. doi:10.1111/gcb.15846
De Felici, L., Piersma, T., and Howison, R. A. (2019). Abundance of arthropods as food for meadow bird chicks in response to short- and long-term soil wetting in Dutch dairy grasslands. PeerJ 7, e7401–e7422. doi:10.7717/peerj.7401
EUROSTAT (2021). Database - Agriculture - Eurostat. Eurostat: your key to European statistics. Available at: https://ec.europa.eu/eurostat/web/agriculture/data/database. (Accessed 27 June 2022).
EUROSTAT (2019). Glossary: Permanent grassland. Glossary: Permanent grassland. Available at: https://ec.europa.eu/eurostat/statistics-explained/index.php?title=Glossary:Permanent_grassland. (Accessed 17 June 2022).
Foster, D., Swanson, F., Aber, J., Burke, I., Brokaw, N., Tilman, D., et al. (2003). The importance of land-use legacies to ecology and conservation. BioScience 53, 77–88. doi:10.1641/0006-3568(2003)053
Gebremedhin, M., Coyne, M. S., and Sistani, K. R. (2022). How much margin is left for degrading agricultural soils? The coming soil crises. Soil Syst. 6, 22. doi:10.3390/soilsystems6010022
Gella, G. W., Bijker, W., and Belgiu, M. (2021). Mapping crop types in complex farming areas using SAR imagery with dynamic time warping. ISPRS J. Photogramm. Remote Sens. 175, 171–183. doi:10.1016/j.isprsjprs.2021.03.004
Glass, N., Molano-Flores, B., Dias de Oliveira, E., Meraz, E., Umar, S., Whelan, C. J., et al. (2021). Does pastoral land-use legacy influence topsoil carbon and nitrogen accrual rates in tallgrass prairie restorations? Land 10, 735. doi:10.3390/land10070735
Groen, N. M., Kentie, R., De Goeij, P., Verheijen, B., Hooijmeijer, J. C. E. W., and Piersma, T. (2012). A modern landscape ecology of Black-tailed Godwits: Habitat selection in southwest Friesland, The Netherlands. Ardea 100, 19–28. doi:10.5253/078.100.0105
Haj-Amor, Z., Araya, T., Kim, D. G., Bouri, S., Lee, J., Ghiloufi, W., et al. (2022). Soil salinity and its associated effects on soil microorganisms, greenhouse gas emissions, crop yield, biodiversity, and desertification: A review. Sci. Total Environ. 843, 156946. doi:10.1016/j.scitotenv.2022.156946
Hardy, T., Kooistra, L., Domingues Franceschini, M., Richter, S., Vonk, E., and van den Eertwegh, G. (2021). Sen2Grass: A Cloud-Based Solution to Generate Field-Specific Grassland Information Derived from Sentinel-2 Imagery. Agri Engineering 3, 118–137. doi:10.3390/agriengineering3010008
Hart, K. (2015). Green direct payments: Implementation choices of nine member states and their environmental implications. Institute for European Environmental Policy.
Henle, K., Alard, D., Clitherow, J., Cobb, P., Firbank, L., Kull, T., et al. (2008). Identifying and managing the conflicts between agriculture and biodiversity conservation in Europe–A review. Agric. Ecosyst. Environ. 124, 60–71. doi:10.1016/j.agee.2007.09.005
Hoogsteen, M. J. J., Lantinga, E. A., Bakker, E. J., Groot, J. C. J., and Tittonell, P. A. (2015). Estimating soil organic carbon through loss on ignition: Effects of ignition conditions and structural water loss. Eur. J. Soil Sci. 66, 320–328. doi:10.1111/ejss.12224
Hooijmeijer, J., van der Velde, E., Fokkema, R., Howison, R., Onrust, J., Rakhimberdiev, E., et al. (2021). Grutto landschap project: Jaarverslag 2020. University of Groningen.
Howison, R. A., Piersma, T., Kentie, R., Hooijmeijer, J. C. E. W., and Olff, H. (2018). Quantifying landscape-level land-use intensity patterns through radar-based remote sensing. J. Appl. Ecol. 55, 1276–1287. doi:10.1111/1365-2664.13077
Jenks, G. F. (1967). The data model concept in statistical mapping. Int. Yearb. Cartogr. 7, 186–190.
Jhariya, M. K., and Singh, L. (2021). Effect of fire severity on soil properties in a seasonally dry forest ecosystem of Central India. Int. J. Environ. Sci. Technol. (Tehran). 18 (12), 3967–3978. doi:10.1007/s13762-020-03062-8
Kentie, R., Both, C., Hooijmeijer, J. C. E. W., and Piersma, T. (2014). Age-dependent dispersal and habitat choice in Black-Tailed Godwits Limosa limosa limosa across a mosaic of traditional and modern grassland habitats. J. Avian Biol. 45, 396–405. doi:10.1111/jav.00273
Kentie, R., Both, C., Hooijmeijer, J. C. E. W., and Piersma, T. (2015). Management of modern agricultural landscapes increases nest predation rates in Black-tailed Godwits Limosa limosa. Ibis 157, 614–625. doi:10.1111/ibi.12273
Kentie, R., Senner, N. R., Hooijmeijer, J. C. E. W., Márquez-Ferrando, R., Figuerola, J., Masero, J. A., et al. (2016). Estimating the size of the Dutch breeding population of Black-tailed Godwits from 2007-2015 using resighting data from spring staging sites. Ardea 104, 213–225. doi:10.5253/arde.v104i3.a7
Kleijn, D., Berendse, F., Smit, R., and Gilissen, N. (2001). Agri-environment schemes do not effectively protect biodiversity in Dutch agricultural landscapes. Nature 413, 723–725. doi:10.1038/35099540
Kumar, V., Huber, M., Rommen, B., and Steele-Dunne, S. C. (2021). Agricultural sandbox NL: A national-scale database of parcel-level, processed sentinel-1 sar data. Available at: https://eartharxiv.org/repository/view/2541/(Accessed April 7, 2022).
Le Provost, G., Badenhausser, I., Le Bagousse-Pinguet, Y., Clough, Y., Henckel, L., Violle, C., et al. (2020). Land-use history impacts functional diversity across multiple trophic groups. Proc. Natl. Acad. Sci. U. S. A. 117, 1573–1579. doi:10.1073/pnas.1910023117
Legendre, P., and Gallagher, E. D. (2001). Ecologically meaningful transformations for ordination of species data. Oecologia 129, 271–280. doi:10.1007/s004420100716
Leonelli, S., and Tempini, N. (Editors) (2020). Data journeys in the sciences (Springer Nature). doi:10.1007/978-3-030-37177-7
Malavasi, M. (2020). The map of biodiversity mapping. Biol. Conserv. 252, 108843. doi:10.1016/j.biocon.2020.108843
Meier, J., Mauser, W., Hank, T., and Bach, H. (2020). Assessments on the impact of high-resolution-sensor pixel sizes for common agricultural policy and smart farming services in European regions. Comput. Electron. Agric. 169, 105205. doi:10.1016/j.compag.2019.105205
O’Connor, B., Secades, C., Penner, J., Sonnenschein, R., Skidmore, A. K., Burgess, N. D., et al. (2015). Earth observation as a tool for tracking progress towards the Aichi Biodiversity Targets. Remote Sens. Ecol. Conserv. 1, 19–28. doi:10.1002/rse2.4
OJEU (2013). Regulation (EU) No 1307/2013 of the European Parliament and of the Council of 17 December 2013 establishing rules for direct payments to farmers under support schemes within the framework of the common agricultural policy and repealing Council Regulation (EC) No 637/2008 and Council Regulation (EC) No 73/2009.
Oksanen, F. J., Blanchet, F. G., Friendly, M., Kindt, R., Legendre, P., McGlinn, D., et al. (2017). Vegan: Community ecology package. R package version 2.5-6. 2019. Available at: https://CRAN.R-project.org/package=vegan.
Paulin, M. J., Remme, R. P., de Nijs, T., Rutgers, M., Koopman, K. R., de Knegt, B., et al. (2020). Application of the Natural Capital Model to assess changes in ecosystem services from changes in green infrastructure in Amsterdam. Ecosyst. Serv. 43, 101114. doi:10.1016/j.ecoser.2020.101114
Peluso, N. L. (1995). Whose woods are these? Counter-mapping forest territories in kalimantan, Indonesia. Antipode 27, 383–406. doi:10.1111/j.1467-8330.1995.tb00286.x
Pulleman, M. M., Bouma, J., van Essen, E. A., and Meijles, E. W. (2000). Soil organic matter content as a function of different land use history. Soil Sci. Soc. Am. J. 64, 689–693. doi:10.2136/sssaj2000.642689x
R Core Team (2017). R: A language and environment for statistical computing. Vienna, Austria: R Foundation for Statistical Computing.
Reidsma, P., Tekelenburg, T., van den Berg, M., and Alkemade, R. (2006). Impacts of land-use change on biodiversity: An assessment of agricultural biodiversity in the European Union. Agric. Ecosyst. Environ. 114, 86–102. doi:10.1016/j.agee.2005.11.026
Schekkerman, H., Teunissen, W., and Oosterveld, E. (2008). The effect of “mosaic management” on the demography of Black-tailed Godwit Limosa limosa on farmland. J. Appl. Ecol. 45, 1067–1075. doi:10.1111/j.1365-2664.2008.01506.x
Schils, R. L. M., Aarts, H. F. M., Bussink, D. W., Conijn, J. G., Corre, V. J., Dam, A. M. van, et al. (2007). Grassland renovation in the Netherlands; agronomic, environmental and economic issues, 9–24.Grassl. resowing grass-arable crops rotations.
Scotti, R., Bonanomi, G., Scelza, R., Zoina, A., and Rao, M. A. (2015). Organic amendments as sustainable tool to recovery fertility in intensive agricultural systems. J. Soil Sci. Plant Nutr. 15, 0–352. doi:10.4067/S0718-95162015005000031
Secades, C., O’Connor, B., Brown, C., Walpole, M., Skidmore, A., Wang, T., et al. (2014). Earth observation for biodiversity monitoring: A review of current approaches and future opportunities for tracking progress towards the aichi biodiversity targets: E-Book. Secretariat of the convention on biological diversity.
Simoes, M., Huss, A., Janssen, N., and Vermeulen, R. (2022). Self-reported psychological distress and self-perceived health in residents living near pesticide-treated agricultural land: A cross-sectional study in The Netherlands. Occup. Environ. Med. 79, 127–133. doi:10.1136/oemed-2021-107544
Stevens, C. J., Thompson, K., Grime, J. P., Long, C. J., and Gowing, D. J. G. (2010). Contribution of acidification and eutrophication to declines in species richness of calcifuge grasslands along a gradient of atmospheric nitrogen deposition. Functional Ecology 24, 478–484. doi:10.1111/j.1365-2435.2009.01663.x
Thunnissen, H., and de Wit, A. (2000). The national land cover database of The Netherlands. Int. Soc. Photogramm. Remote Sens. 33, 8.
Treitz, P., and Rogan, J. (2004). Remote sensing for mapping and monitoring land-cover and land-use change—An introduction. Prog. Plann. 61, 269–279. doi:10.1016/S0305-9006(03)00064-3
Turnbull, D. (1994). Maps are territories: Science is an atlas. 1st edition. University Of Chicago Press.
Turner, W., Spector, S., Gardiner, E., Fladeland, M., Sterling, E., and Steininger, M. (2003). Remote sensing for biodiversity science and conservation. Trends Ecol. Evol. 18, 306–314. doi:10.1016/S0169-5347(03)00070-3
Turnhout, E., and Purvis, A. (2020). Biodiversity and species extinction: Categorisation, calculation, and communication. Griffith Law Rev. 29, 669–685. doi:10.1080/10383441.2020.1925204
Wilkinson, M. T., Richards, P. J., and Humphreys, G. S. (2009). Breaking ground: Pedological, geological, and ecological implications of soil bioturbation. Earth. Sci. Rev. 97, 257–272. doi:10.1016/j.earscirev.2009.09.005
Keywords: land-use legacy, biodiversity mapping, permanent grasslands, temporary grasslands, grassland-to-cropland conversion, open data, agricultural biodiversity
Citation: Craft TB, Beaulieu A, Piersma T and Howison RA (2022) Mapping Agricultural Biodiversity: Legacy data and tensions between ways of seeing fields. Front. Environ. Sci. 10:982925. doi: 10.3389/fenvs.2022.982925
Received: 30 June 2022; Accepted: 13 October 2022;
Published: 02 November 2022.
Edited by:
Marco Malavasi, Czech University of Life Sciences Prague, CzechiaReviewed by:
Pedro Laterra, Consejo Nacional de Investigaciones Científicas y Técnicas (CONICET), ArgentinaCopyright © 2022 Craft, Beaulieu, Piersma and Howison. This is an open-access article distributed under the terms of the Creative Commons Attribution License (CC BY). The use, distribution or reproduction in other forums is permitted, provided the original author(s) and the copyright owner(s) are credited and that the original publication in this journal is cited, in accordance with accepted academic practice. No use, distribution or reproduction is permitted which does not comply with these terms.
*Correspondence: Taylor B. Craft, dC5iLmNyYWZ0QHJ1Zy5ubA==
Disclaimer: All claims expressed in this article are solely those of the authors and do not necessarily represent those of their affiliated organizations, or those of the publisher, the editors and the reviewers. Any product that may be evaluated in this article or claim that may be made by its manufacturer is not guaranteed or endorsed by the publisher.
Research integrity at Frontiers
Learn more about the work of our research integrity team to safeguard the quality of each article we publish.