 Ye Duan
 Huimin Zhao1
 Yuming Qin
- 1School of Geography, Liaoning Normal University, Dalian, China
- 2Center for Studies of Marine Economy and Sustainable Development, Liaoning Normal University, Dalian, China
While the research on industrial agglomeration has received more attention, there has been little research on its spatial effect and impact mechanism from the micro perspective. On the basis of the industrial cluster data of 600 counties in the Yellow River basin (YRB) from 2010 to 2020, this article investigates the spatial effect of industrial agglomeration in the YRB from the two aspects of time and space via center of gravity analysis and exploratory spatial data analysis and uses the spatial econometric method to research the drivers of county-level industrial agglomeration. The results reveal the following. During the study period, the industrial center of gravity in the YRB presented a moving tendency from east to west, and 2016 was an important turning point. The county-level industrial distribution in the YRB showed an unbalanced trend, but its unbalanced degree exhibited a weakening trend. In terms of the temporal dimension, the county-level industrial agglomeration degree in the YRB presented a significant downward trend and emerged an evolution process of “diffusion–agglomeration–re-diffusion.” Specifically, it gradually diffused from Shandong and Henan to southern Shanxi and Shaanxi. In the spatial dimension, the county-level industrial agglomeration in the YRB was found to have conspicuous spatial autocorrelation, and the spatial spillover effect was prominent. The number of counties with high–high cluster gradually increased and shifted to the west, while the number of counties with low–low agglomeration exhibited a decreasing trend. The degree of government intervention restrains county-level industrial agglomeration, while the external industry level, regional market demand, and urbanization level promote county-level industrial agglomeration. In terms of river basins, in the upstream, the degree of government intervention and industrial structure adjustment inhibit industrial agglomeration, while the regional market demand and urbanization level promote industrial agglomeration. In the midstream, the degree of government intervention inhibits industrial agglomeration, while the external industry level, regional market demand, and industrial structure adjustment promote industrial agglomeration. In the downstream, the external industry level and industrial structure adjustment restrain industrial agglomeration, while the regional market demand and urbanization level promote industrial agglomeration. The conclusions provide a significant reference for the industrial transformation and high-quality economic development of the YRB.
1 Introduction
Since its reform and opening up, China’s industrial economy has grown rapidly and has become an important engine and driving force of national economic development. In the face of an increasingly complex international environment, the domestic COVID-19 epidemic, and other factors, China’s industrial growth momentum remained strong in 2021; its industrial-added value increased by 9.6% over the previous year, driving economic growth by 3.0% points. In addition, with its rapid economic development, China’s industries have gradually exhibited agglomeration. As an important type of agglomeration, industrial agglomeration not only promotes the rapid development of the regional economy but also brings about an imbalance of regional economic development. Factors such as geographical location and resource endowments cause industries to gather in areas with superior conditions. The increasing returns to scale and the positive externalities generated by agglomeration promote the persistent amplification of the scope of agglomeration, and the concentration of the industry in a few areas indirectly widens the regional economic development gap. Moreover, different industrial cluster levels in different regions lead to significant differences in the spatial effects of industrial clustering. Correctly understanding the spatial effect of industrial agglomeration in the new era is of great practical significance for promoting the coordinated development of a high-quality and high-level economy1.
Industry is a critical engine of national economic development (Li et al., 2021), an important reason for the continuously improved level of China’s sustained economic growth, and a key way to enhance regional competitiveness. At present, the research on industrial agglomeration mostly includes the following four aspects. The first is the measurement of the level of industrial agglomeration. Based on the data envelopment analysis model combined with the meta-Frontier infrastructure framework and Malmquist–Luenberger index analysis, Zhong et al. (2022) discovered that the urban industrial green total factor productivity in the Yangtze River Economic Belt presented a tendency of first descending and then increasing from 2009 to 2016; Zhang and Zhang (2022) used edge computing technology to analyze the categories of industrial cities, and three patterns were developed to research the evolution pattern of the industrial structure; using the center of gravity model, Hu et al. (2019) found that the center of gravity of China’s industrial agglomeration moved south year-by-year and exhibited the spatial distribution characteristics of “strong in the south and weak in the north”; Huang and Sun (2021) used the Duranton–Overman index to find that the manufacturing industry in the Beijing–Tianjin–Hebei region had the tendency to spread from Beijing and Tianjin to Hebei from 2004 to 2013. The second is the spatial effect of industrial agglomeration. Shen and Peng (2021) used the meta-constrained efficiency model to measure the environmental efficiency of industries and found that industrial agglomeration has obvious spatial spillover effects); Tanaka and Managi (2021) found that in the paper and pulp industries, the same industrial agglomeration contributes to energy efficiency; however, the agglomeration effect was found to be negative for the energy efficiency of the cement industry. Tu et al. (2018) found that the center of gravity of China’s industrial agglomeration moved south year-by-year from 1996 to 2015; He and Hu (2019) pointed out that since its reform and opening up, China’s industry has generally experienced a process of spreading inland, agglomerating in coastal areas, and then dispersing inland; via the analysis of the standard deviation ellipse method of spatial statistics, Zhao (2021) found that the secondary industry has accelerated the development of spatial agglomeration from coastal areas to inland areas, and that the degree of spatial agglomeration has increased and is higher than that of the tertiary industry. The third aspect is the economic effect of industrial agglomeration. Davis and Hashimoto (2015) found that the industrial concentration affects the increase or decrease of the economic growth rate by affecting market entry; via analysis, Dauth and Suedekum (2016) found that the initial size of the industry will affect the growth and change of the regional economy; Zhang and Wang (2018) used the exploratory spatial data analysis method to show that industrial agglomeration can promote economic growth in the region, while it will have negative spatial spillovers to other regions. The fourth aspect is the influencing factors of industrial agglomeration. Fan and Scott (2015) conducted a substantial amount of research and data analysis from different perspectives and confirmed that the agglomeration of industries has a certain impact on economic development; Luo et al. (2015) and Zhang and Li (2021) found that both economic policy and new economic geography influence the steric effect of industrial agglomeration. In China, because of the significant diversity on the basis of economic development and the geographical locations of different regions, the process of industrialization throughout the country has evolved in an unbalanced spatial pattern (Hu, 2019).
Throughout the history of civilization, the YRB and the districts through which the Yellow River passes have been extremely important for the development of the country and the nation, as well as for the scientific and technological development, industrial development and human resources at the current stage (Lu and Sun, 2019). The “Outline of the YRB Ecological Protection and High-quality Development Plan” has been identified as a national strategic priority, and the YRB has also entered a new development stage (Lu et al., 2022). The YRB still faces problems such as the low overall development level and the widening development gap within the basin. The economic development level of the YRB presents an obvious spatial differentiation pattern of high in the east and low in the west. The economic differences between different regions are obvious, and the spatial aggregation and spatial polarization are significant (Zhang and Zhang, 2020). As an important support for the economy of northern China, the YRB is in the stage of rapid industrialization, and the industrial system is improving day by day. However, the combination of the high proportion of the heavy chemical industry, backward underdeveloped production technology, a fragile ecosystem background, and low environmental capacity makes cause the industrial development of the YRB show to exhibit obvious characteristics of high consumption, high emissions, and high pollution. Problems such as resource shortages, environmental pollution, and ecological damage are becoming increasingly prominent (Lu and Sun, 2019). In addition, the industrial development in the YRB is highly unbalanced (Zhao et al., 2021). The industry is a momentous component of the economy of the YRB. The healthy development of the industry can drive economic development and is the guarantee for the sustainable, rapid, and healthy growth of the economy of the YRB.
As an important support for the economy of northern China, the industrialization process of the YRB is accelerating, and the industrial system is improving day-by-day (Li et al., 2021). However, the phenomenon of unbalanced industrial development in the YRB is more significant. The research on the industrial development of the YRB has been relatively rich. However, at present, the research on the high-quality development of the YRB mainly includes “water resources allocation in the YRB” (Gong et al., 2020; Liu et al., 2020; Guan et al., 2021; Wei et al., 2021) and “the relationship between ecological protection and high-quality development” (Cui et al., 2020; Feng et al., 2021; Hua and Huan, 2021; Li and Miao, 2022). Research on industrial agglomeration in the YRB is comparatively rare (Geng et al., 2020; Hu et al., 2021). In terms of industrial agglomeration in the YRB, using environmental total factor productivity (ETFP) as the measurement standard, Ju et al. (2020) calculated and analyzed the industrial development level of major cities and urban agglomerations in the YRB from 2006 to 2016 via the super-efficiency data envelopment analysis (DEA) and Malmquist index models. Based on the measurement of the level and types of industrial structure transformation in provinces and regions in the YRB, Geng et al. (2020) used econometric models to discuss the spatial and temporal characteristics of industrial structure transformation in cities and regions in the YRB and its response to spatial agglomeration models such as specialization and diversification. Hu et al. (2021) constructed an econometric model from the two levels of resistance and resilience to investigate the impacts of different industrial agglomeration types such as specialization, diversity, related diversity, and non-related diversity on industrial resilience in the YRB. Jia et al. (2021) studied the spatial interaction of industrial agglomeration and pollution agglomeration in the YRB via spatial statistical methods and spatial simultaneous equation pattern. On the basis of investigating the basic situation of the industrial layout of nine provinces (regions) in the YRB, Zhao et al. (2021) proposed an industrial layout plan that matched the high-quality development of the different reaches of the Yellow River and discussed the effect of optimization plan after implementation. Miao (2022) proposed a way to build an advanced manufacturing corridor and a high-quality development axis in the midstream and downstream regions of the Yellow River via the industrial status of the YRB. Based on the industrial economic development data of Qinghai Province from 2006 to 2014, Wang (2016) comprehensively used both quantitative analysis and qualitative analysis methods to study the current situation and problems of Qinghai Province’s industrial layout and proposed principles and countermeasures for its optimization. Zhu et al. (2021) took nine provinces along the YRB as the research objects, established measurement indicators of carbon emissions, the industrial structure and ecological benefits, and analyzed their temporal and spatial trends. Du et al. (2022) analyzed and revealed the spatial characteristics and drivers of water pollution-intensive industries in the YRB from 2003 to 2013. To date, there have been few studies on industrial agglomeration in the YRB. Moreover, the research scales are mainly provinces, urban agglomerations, and cities, and research is largely conducted from the perspective of the whole region. There have been few studies on industrial agglomeration in the YRB from the perspective of county and regional heterogeneity. The main contributions of this study include the following. First, the county-level economy is the basic unit of the national economy. If the county is stable, the overall situation will be stable; if the county is active, it will be fully active; and if the county is strong, the river basin will be strong. The high quality of the county reflects the good quality of the basin (Wu, 2021). However, the recent research on industrial agglomeration has mainly focused on the national, regional, provincial, and municipal levels, and there have been few studies on industrial agglomeration in the YRB conducted from the county perspective. The basis for accelerating conservation ecology and high-quality development in the YRB lies in the counties. Thus, the analysis of the spatial and temporal evolution layouts and drivers of industrial agglomeration in the YRB, the clarification of the differences in industrial development in the YRB, and pushing forward the optimization of the industrial spatial structure are conducive to the better performance of the ecological conservation and high-quality development strategies of the YRB. Second, most past studies have analyzed the YRB from the global perspective of the region, but there is not enough research on the spatial heterogeneity of the region. This study analyzes the regional heterogeneity of the YRB from the perspective of the upstream, midstream, and downstream areas, which is significant to the industry and economy. Third, in the empirical analysis, this study focuses on the YRB, considering its ecological, economic, and geographical importance in China, to supply targeted management and policy recommendations for the region.
The structure of the remainder of this essay is as follows. Section 2 presents the research methods and data sources of county-level industrial agglomeration in the YRB. Section 3 reports the results of empirical research, including the analyses of the change of the county-level industrial center of gravity, the county-level industrial balance, the county-level industrial agglomeration in the YRB, and the factors affecting county-level industrial agglomeration in the entire YRB and its internal basins (upstream, midstream, and downstream). Finally, Section 4 presents the conclusion and discussion.
2 Methods and data
2.1 Research methods
2.1.1 Calculation method of the center of gravity
The term “center of gravity” originates from the field of physics, and originally referred to the point of action of the resultant force of gravity on all fulcrums when an object is in any orientation in a gravitational field. If the center of gravity of the object is determined, from the perspective of the effect of force, it can be assumed that all the mass of the object is concentrated at this point. In recent years, increasingly more scholars have borrowed the concept of the center of gravity and applied it to the research and analysis of economic and social issues, such as the population center of gravity and employment center of gravity. These studies have effectively analyzed the changes in the spatial patterns of regional social and economic development by finding the dynamic change trajectory of the center of gravity (Ma et al., 2017).
In this work, the geometric center of gravity method is used to study the spatial layout of the county-level industry in the YRB. The calculation formula is as follows:
In the formula: X and Y, respectively, represent the longitude and latitude of the industrial center of gravity in the YRB, and accurately express the geographical location of the industrial center of gravity of the counties in the YRB. Moreover, Xi and Yi, respectively, represent the longitude and latitude of the county-level administrative unit government in the YRB, and Mi is the county-level total industrial output value above a designated size. It can be seen from the formula that the factors affecting the transfer of the industrial center of gravity in the counties of the YRB are the geographical coordinates of the location of the government of each county-level administrative unit and the total industrial output value above a designated size. It directly determines the transformation of the position of the center of gravity. Correspondingly, the changes in the industrial center of gravity of the counties in the YRB also clearly reflect the trajectories, spatial differences, and degrees of equilibrium of industrial development and changes in the counties in the YRB.
2.1.2 Disequilibrium index
The disequilibrium index is used to study whether the industrial distribution of a certain geographical unit is balanced and concentrated. Therefore, the disequilibrium index is adopted in this essay to study the time-balanced change characteristics of industrial density in the YRB and simulate the tendency of industrial concentration or dispersion. The calculation formula is as follows:
In the formula: S means the disequilibrium index, n means the number of counties in the YRB, and Yi means the cumulative percentage of the ith place in the YRB in descending order of the proportions of the counties in the YRB. The smaller the value of S is, the more balanced is the industrial spatial structure in the YRB, and vice versa.
2.1.3 Density of the gross industrial output value
In this work, the industrial output value density is used to research the industrial economic scale of each county in the YRB to reflect the degree of industrial spatial agglomeration in the YRB. The formula is as follows:
In the formula: Di is the industrial output value density of enterprises above a designated size in county i in the YRB; Gi means the total industrial output value of enterprises above a designated size in county i in the YRB, and Li presents the administrative division area of county i.
2.1.4 Moran index
The Moran index is an important research index with which the potential interdependence between research objects in a region can be studied. The Moran index includes the global Moran index and local Moran index. The global Moran index reflects the overall distribution of the research objects in the region and is used to judge whether the research objects have agglomeration characteristics in the internal space of the region. However, it is not possible to point out where the agglomeration occurs, and this can be performed by the local Moran index.
This work studies the spatial dependence and spatial heterogeneity among the county-level industry in the YRB by using the Moran’s I index to investigate its spatial correlation characteristics.
(1) The global Moran index describes the spatial relationship of the industrial distribution in counties in the YRB. The formula is as follows:
In the formula: k and j represent two different counties in the YRB, n means the total number of counties in the YRB, xk and xj mean the total industrial output value of each county above a designated size, Wkj means the spatial weight matrix, where one indicates that k and j are adjacent to each other, zero means k and j are not adjacent. S2 is the sample variance. The global Moran index range is [−1, 1]. At the level of statistical significance, Moran’s I > 0 means that the county-level industry in the YRB presents a trend of spatial agglomeration, otherwise it presents a trend of spatial differentiation. If Moran’s I = 0, it indicates that the industrial spatial distribution in the YRB area is random (Zhang et al., 2021).
(2) The local Moran’s I index reports the degree of industrial difference of the counties in the YRB and local neighboring counties. The formula is as follows:
In the formula:
The preceding content is presented in a visual way, and Moran’s I scatter plot can be obtained. The local Moran’s I scatter plot takes Zi as the X-axis and
2.1.5 Spatial econometric analysis methods
The spatial econometric model used in this work mainly incorporates spatial correlation and spatial heterogeneity. It is suitable for the spatial constant-coefficient regression model of section data and contains the spatial lag model (SLM) and the spatial error model (SEM) (Jia and Gu, 2019).
(1) SLM: this work mostly discusses whether the county-level industrial cluster in the YRB has a diffusion phenomenon. The general expression of the model is:
In the formula: Y means the explained variable, X means the exogenous explanatory variable matrix of n×k, ρ is the regression coefficient of the spatial lag term of the explained variable, Wy means the spatial weight matrix of the dependent variable, WyY means the space of the dependent variable lag term, β is the coefficient of the explanatory variable, and ε is the random error term vector.
(2) SEM: this work measures the influence of spatial spillover caused by the error of the explained variables in the neighboring counties of the YRB on the county. The general expression of the model is:
In the formula: Y means the explained variable, X means the exogenous explanatory variable matrix of n×k, β means the coefficient of the explanatory variable, ε means the casual error term vector, λ means the regression coefficient of the spatial error term, Wε means the space of the error term weight matrix; Wεε means the spatial error term, and μ means the random error vector of the normal distribution.
2.2 Data sources
The “Outline of the Yellow River Basin Ecological Protection and High-quality Development Plan” indicates that the YRB covers the relevant county-level administrative regions of Qinghai, Sichuan2, Gansu, Ningxia, Inner Mongolia, Shanxi, Shaanxi, Henan, and Shandong provinces, where the trunk and tributaries of the Yellow River flow (The State Council, 2021). The basin scope determined in this article refers to the natural basin scope defined by the Yellow River Water Conservancy Commission of the Ministry of Water Resources, and counties, county-level cities, banners, and districts were selected as the research scale. This scope ensures the integrity of administrative divisions. Furthermore, on the basis of data accessibility, 600 counties, county-level cities, banners, and districts in the YRB were selected as the study object. In China’s administrative divisions, counties, county-level cities, banners, and districts all belong to county-level administrative regions. Therefore, this article collectively refers to counties, county-level cities, banners, and districts as counties. In the past 10 years, the administrative divisions of the YRB have been greatly adjusted. According to the situation of the Yellow River and its tributaries flowing through counties and regions, by respectively taking Tuoketuo County, the Inner Mongolia Autonomous Region, and Xingyang City, Henan Province, as the dividing points of the upstream, midstream, and downstream areas of the Yellow River, the spatial scope of these regions of the YRB was divided (Cui et al., 2021). To facilitate horizontal comparison, the administrative divisions of 2020 were taken as the benchmark, the administrative divisions of the remaining years were matched with 2020, and the counties with changes were merged. The data on social and economic variables were mainly sourced from the 2010–2020 “China Statistical Yearbook (county-level)" and the “Statistical Bulletin of National Economic and Social Development” of districts and counties. The missing data of individual years were filled in by the interpolation method. The map data were sourced from BIGEMAP.
3 Empirical results
3.1 Spatiotemporal effect analysis
3.1.1 Changes in the industrial center of gravity
It can be seen from its path evolution (Figure 1) that the industrial center of gravity of the YRB was always located at 114°97,802′E-115°156,587′E, 36°314,645′N-36°499,716′N from 2010 to 2015. This shows that over the years, the industry in the downstream area of the YRB has grown rapidly, and the overall distribution of the industry in the YRB is uneven. The natural resources in the counties in the downstream area of the YRB are not dominant compared with those in the western regions of the upstream and midstream areas, but they are located in coastal areas with convenient traffic conditions, and the consumption market of industrial products is worldwide. Therefore, the county-level industry in the downstream area of the YRB began earlier and developed rapidly. Although the counties in the upstream and midstream regions of the YRB are rich in industrial resources and raw materials, due to their remote geographical location and poor traffic conditions, their industry began late and developed slowly. Since 2016, the industrial center of gravity has begun to move westward and has gradually shifted to the geographic geometric center of the YRB. With the rise of the central region, the Great Western Development, the advancement of the Belt and Road Initiative, and the development of China’s transportation industry, the number of industrial enterprises in the upstream and midstream areas of the Yellow River has increased, and the industry in these areas has developed rapidly. Although the industrial center of gravity exhibits the trend of moving to the upstream and midstream areas of the YRB, it has always been located in the downstream area of the YRB. This is determined by the strong industrial strength of the downstream area. The counties in the downstream area of the YRB have a high spatially dominant position in the economic and industrial pattern of the YRB and are the long-term location of the industrial center of gravity of the YRB.
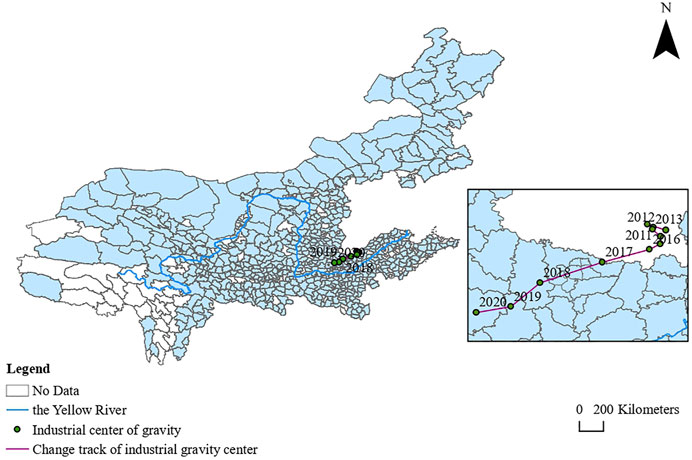
FIGURE 1. Changes in the industrial economic center of the YRB from 2010 to 2020.
3.1.2 Analysis of industrial equilibrium
There are two components of the study of industrial equilibrium analysis in the YRB, the first of which is the use of the disequilibrium index to study the degree of equilibrium of county-level industrial distribution in the YRB over time. The second is to draw the industrial density map by using the density of the total industrial output value of each county in the YRB to analyze the degree of equilibrium of the county industrial distribution in the YRB in space.
The disequilibrium index of the industrial distribution in the YRB is relatively high (Table 1), revealing that the industrial distribution in the YRB is unbalanced. Specifically, the disequilibrium index of the county-level industrial distribution in the YRB exhibited a downward tendency from 2010 to 2012. From then, the disequilibrium index continued to increase, reaching a maximum value in 2015. From 2015 to 2020, the disequilibrium index exhibited a fluctuating downward trend. However, on the whole, the disequilibrium index dropped from 0.7673 to 0.7329, implying the weakening of the degree of disequilibrium of industrial distribution in counties in the YRB. In recent years, with the advancement of the high-quality development strategy of the YRB, the industry in the upstream and midstream areas of the YRB has undergone rapid development, and the difference between the industrial distributions of the counties in the YRB has tended to shrink.

TABLE 1. Unbalanced index of industrial distribution in counties in the YRB.
ArcGIS software was used to draw the density maps of the total industrial output value of counties in the YRB (Figure 2) in 2010 (Figure 2A), 2015 (Figure 2B), and 2020 (Figure 2C), which were uniformly divided into four grades for time series comparison between 2010 and 2020.
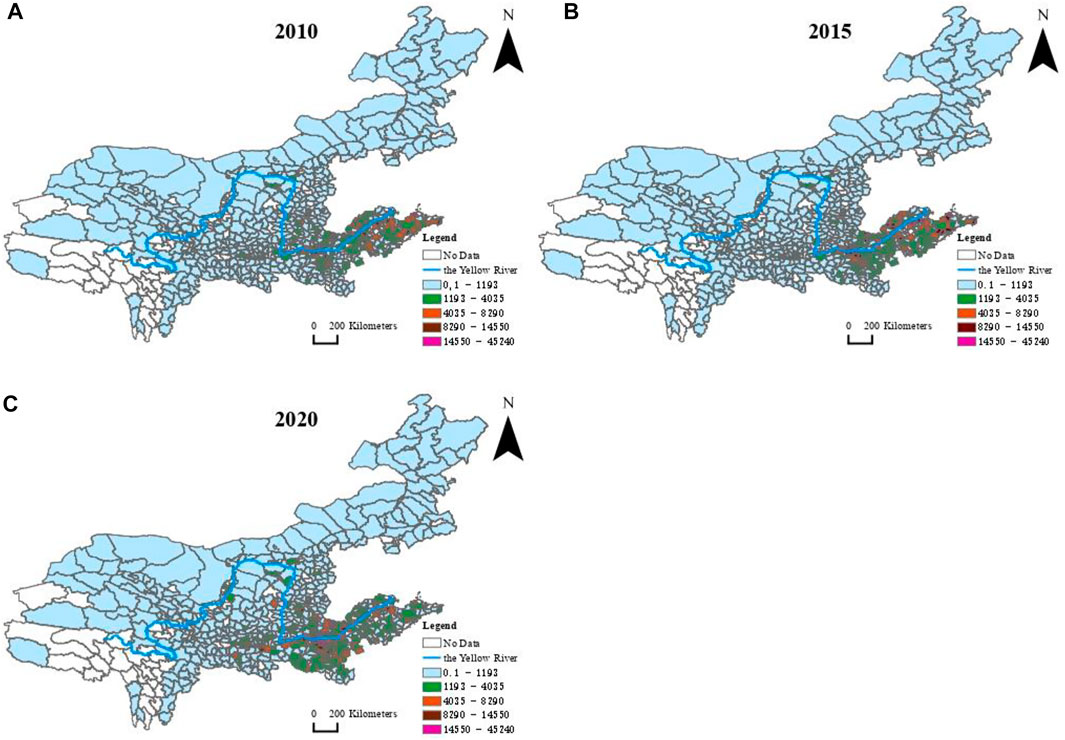
FIGURE 2. Changes in the density of total industrial output value in the counties of the YRB in 2010 (A), 2015 (B), and 2020 (C).
The spatial distribution of the county-level industry in the Yellow River was found to have obvious gradients along the river. There are obvious differences in the upstream, midstream, and downstream areas of the YRB, and the overall industrial center of gravity has been constantly east by south. The county-level industry of the YRB in 2010 (Figure 2A) was mainly concentrated in the Shandong and Henan regions in the downstream area of the YRB. In addition to Shandong, which was the region with the highest density of the total industrial output value, the counties and districts with a high industrial output value density were in Henan Province, including Anyang County, Bo’ai County, Xinxiang County, Gongyi City, and Xinzheng City. The densities of the total industrial output value in the upstream and midstream areas of the YRB were inferior, which were evidently different from that in the lower reaches.
Based on the change from 2010 to 2015, the density of the industrial gross output value exhibited an upward trend on the whole (Figures 2A,B). In 2010, the density of the total industrial output value in the counties was between 0.37 and 268.70 ten thousand yuan/km2, but, in 2015, it increased to the range of 0.14–368.35 ten thousand yuan/km2. The minimum value was relatively lower, but the maximum value was greatly increased. With the overall increase of the degree of industrial agglomeration, the industrial agglomeration areas with counties in Shandong as the core tended to expand outward. In 2015, the density of the gross industrial output value experienced no remarkable transformation as compared with that in 2010, and the counties in Shandong and Henan Provinces were still high-value agglomeration areas of the total industrial output value. Zouping City and Guangrao County in Shandong Province belonged to the high-value areas of the total industrial output value density in 2010, and the density of the gross industrial output value further increased in 2015. Henan Province gradually expanded from areas with a good industrial foundation to the surrounding counties. The industrial density of some counties in southeastern Henan Province increased to varying degrees, including Qi County, Taikang County, and Xihua County.
In 2020 (Figure 2C), the area with a high density of the industrial output value expanded to some counties in southern Shanxi and Shaanxi, and the density of the total industrial output value was further enhanced. Compared with 2015, the density of the total industrial output value of the counties in 2020 increased to the range of 0.51–452.38 ten thousand yuan/km2, and the minimum and maximum values increased to varying degrees. Among them, some areas with a high output value density also appeared in Shanxi and Shaanxi, such as Quwo County, Wugong County, and Lantian County. This shows that from 2015 to 2020, the degree of industrial agglomeration in the YRB gradually weakened.
In summation, from 2010 to 2020, the spatial evolution effect brought about by county-level industrial agglomeration in the YRB directly promoted the growth of the industrial economy, and the output value density continuously increased. In addition, the county-level industry in the YRB presented a tendency of agglomeration in the downstream area of the YRB and gradually spread to the midstream and upstream areas of the YRB.
3.1.3 Analysis of industrial agglomeration
3.1.3 1 Global spatial autocorrelation
According to the global Moran’s I index of industrial agglomeration in the counties of the YRB (Table 2), the Moran’s I index for the industrial economy was positive from 2010 to 2020, the Z values were all greater than the critical value of 1.96, and the p values all passed the 1% significance level test. The test reveals that the spatial distribution of the industrial level of the counties in the YRB is not random, but there is a significant positive spatial correlation. This shows that the counties in the YRB with higher and lower industrial development levels have formed the spatial agglomeration of similar regions around each other. With the evolution of time, this trend has generally weakened. However, the Moran’s I value fluctuated significantly over time from 2010 to 2020. Specifically based on the Moran’s I change map of county-level industrial agglomeration in the YRB (Figure 3), from 2010 to 2012, the Moran’s I value curve exhibited a downward trend, and it dropped to the lowest value of 0.3765 in 2012. This indicates that the polarization influence on industrial clusters in the county areas of the YRB continued to weaken during these 2 years, and the degree of industrial spatial agglomeration decreased, and the spatial heterogeneity gradually increased. From 2013 to 2015, the Moran’s I value presented an upward trend and increased to 0.4015. The counties in the downstream area of the YRB developed rapidly depending on their geographical position and industrial advantages, and the industrial space of counties in the YRB again presented the trend of agglomeration. From 2015 to 2020, the Moran’s I value curve again presented a downward fluctuation tendency. With the economic transformation and development of some counties in the YRB and the implementation of the “Outline of the Yellow River Basin Ecological Protection and High-Quality Development Plan,” the differences between the industrial growth of the counties in the YRB were gradually reduced. The spatial agglomeration of the county-level industry tended to weaken, and the spatial heterogeneity gradually increased. On the whole, the industrial agglomeration in the counties of the YRB presented a gradual weakening tendency and the evolution process of “diffusion–aggregation–re-diffusion.”
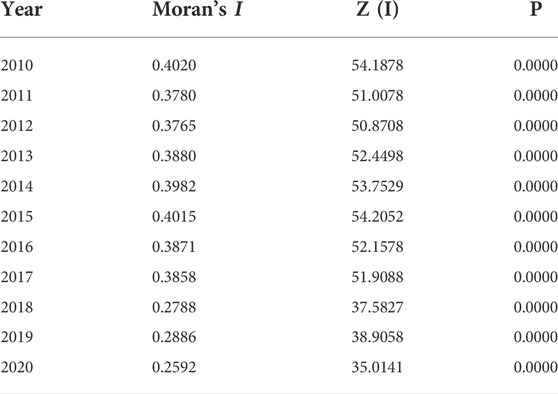
TABLE 2. Global Moran’s I index of industrial agglomeration in counties in the YRB.
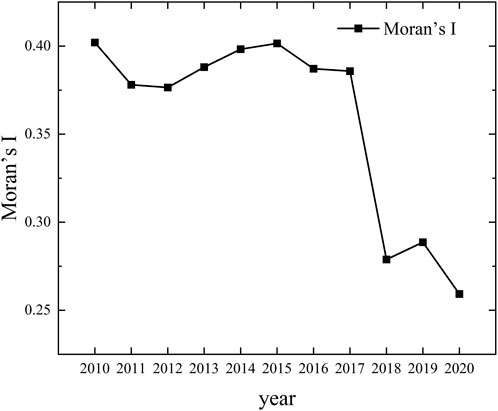
FIGURE 3. Moran’s I variation map of industrial agglomeration of the counties in the YRB.
3.1.3.2 Local spatial autocorrelation
The years 2010, 2015, and 2020 were selected as the time sections to analyze the local spatial autocorrelation characteristics. The local spatial autocorrelation analysis of county-level units in the YRB was carried out by using GEODA and ArcGIS spatial statistical software, and the Moran scatter plot (Figure 4) and LISA cluster map (Figure 5) generated from the results explain the local spatial autocorrelation of the county-level industry in the YRB from different perspectives.
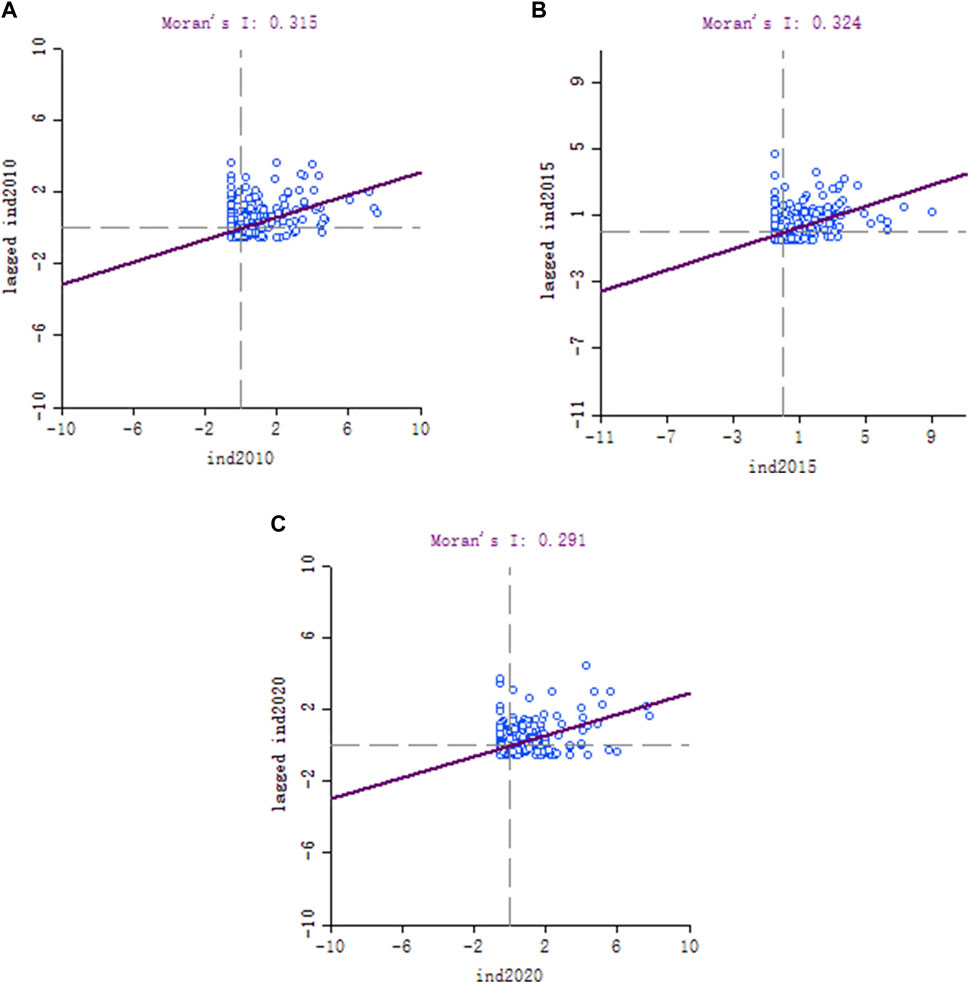
FIGURE 4. Moran scatter plot of industrial agglomeration in the YRB in 2010 (A), 2015 (B), and 2020 (C).
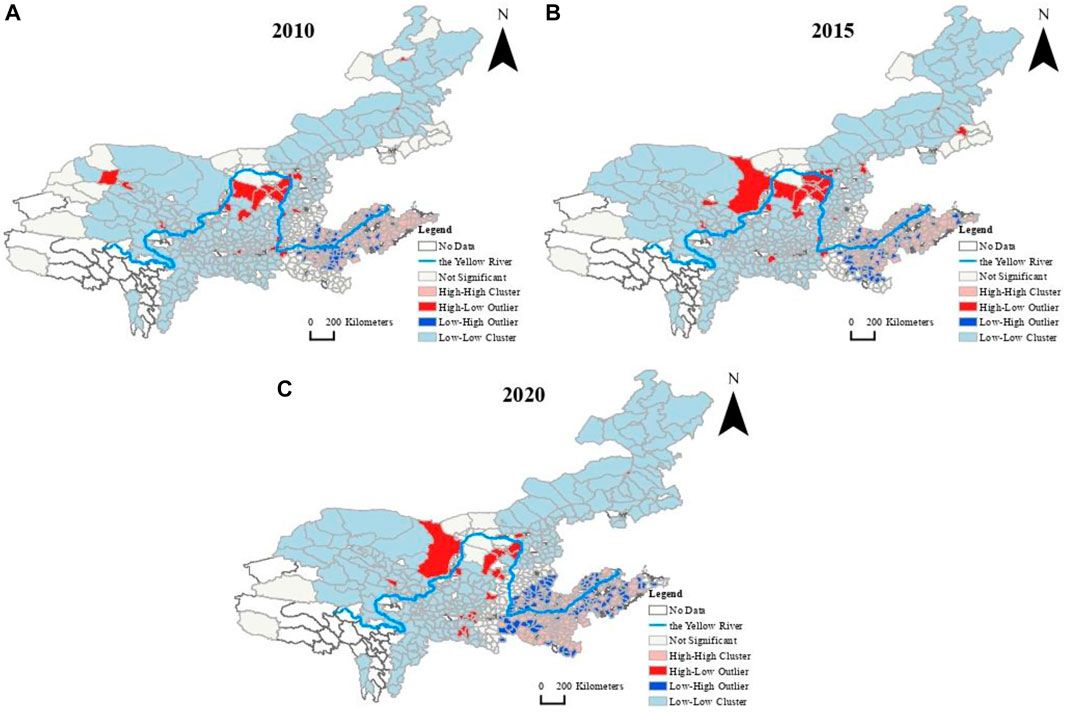
FIGURE 5. Industrial agglomeration map in the YRB in 2010 (A), 2015 (B), and 2020 (C).
In the Moran scatter plot (Figure 4) of the total industrial output value density of the counties in the YRB, generally speaking, the vast majority of regions are in the first and third quadrants, and there are more regions in the third quadrant than in the first quadrant. In addition, the first quadrant is scattered and the third quadrant is densely distributed. It can be seen that the number of counties in the YRB with the underdeveloped industry is greater than the number of counties with the developed industry, indicating that the county-level industry in the YRB exhibits a trend of polarization that forms two types of convergence, namely, high-level and low-level. According to the Moran scatter plot of county-level industrial agglomeration in the YRB in 2010 (Figure 4A), most of the counties fell in the high–high and low–low agglomeration areas. In other words, there was a positive spatial autocorrelation between most counties. The counties with a high gross industrial output value are surrounded by other counties with a high gross industrial output value, while the counties with a low gross industrial output value are surrounded by other counties with a low gross industrial output value. The degree of industrial agglomeration increased in 2015 (Figure 4B), and the local Moran index value increased from 0.315 in 2010 to 0.324 in 2015. Moreover, the area points of the first and third quadrants were found to be increased. Due to factors such as a large geographical span, a complex topography, the accumulation of mineral resources, cultural transportation, and others, the economic linkages of the provinces along the Yellow River have always been low, the awareness of regional division of labor and cooperation is not strong, and the efficient and coordinated development mechanism is not yet perfect; this has resulted in the unbalanced growth of the YBR and certain spatial differences in its industrial development (Zhen and Chen, 2021). Compared with 2015, most counties in 2020 (Figure 4C) were found to remain in the first and third quadrants, but the slope of the fitted straight line of the Moran scatter was lower than that in 2015, indicating that the spatial autocorrelation between the county-level industry in the YRB had gradually weakened over time. In recent years, the industrial development of the counties in the upstream and midstream areas of the YRB has accelerated, and the leading role of the regional economy has been strengthened. Therefore, the degree of industrial distribution and agglomeration in the YRB is weakening.
The 2010 county-level industrial agglomeration map (Figure 5A) is spatially divided into four types of areas, namely, those with high–high, high–low, low–high, and low–low agglomeration, which respectively correspond to the four quadrants in the Moran scatter diagram. The local Moran’s I of 109 counties was not significant and did not exhibit the form of spatial agglomeration. There were 118 counties belonging to the high–high area, which were located in Shandong and Henan in the downstream area of the YRB; this indicates that there were obvious local spatial autocorrelation characteristics in this area, and county-level industrial agglomeration had a strong spatial spillover effect. There were 25 counties belonging to the high–low agglomeration area, which were located in the upstream and midstream areas of the YRB. The industrial agglomeration levels of counties were slightly higher than the average value of the YRB, but the industrial agglomeration level of the surrounding counties was generally low. There were 50 counties belonging to the low–high agglomeration area, which were located in Shandong and Henan in the downstream area of the YRB; this indicates that the density of the gross industrial output value of the counties in these areas was in low-lying areas surrounded by neighboring counties, with a high density of the gross industrial output value and had negative spatial autocorrelation with neighboring counties. There were 298 counties belonging to the low–low agglomeration area, which were mostly located in the upstream and midstream areas of the YRB. This indicates that there were obvious spatial autocorrelation characteristics between counties in this region, and they were in the low-speed development stage of the industry.
According to the county-level industrial agglomeration map in 2015 (Figure 5B), the local Moran’s I of 68 counties was not significant and did not present the form of spatial agglomeration. Compared with 2010, the number of insignificant counties had decreased; this is consistent with the increase in the global Moran’s I value, showing that the degree of industrial agglomeration of the counties in the YRB had strengthened. Among them, 128 counties belonged to the high–high agglomeration area, an increase of 10 counties compared with 2010. The newly added counties were still mainly concentrated in Shandong and Henan in the downstream area of the YRB. For example, Lanling County and Huimin County, which were distributed in the low–high area in 2010, entered the high–high agglomeration area in 2015. Similar to 2010, 25 counties belonged to the high–low agglomeration area, but the counties had changed. The high–low units were mainly county-level cities, playing the role of “a big horse pulling a small car,” and the surrounding counties had extremely low levels of industrial economic development. The number of counties belonging to the low–high zone remained unchanged at 50, but the counties changed. For example, Lanling County and Huiming County, which were distributed in the low–high area in 2010, both entered the high–high agglomeration area in 2015, while Liangshan County and Gaoqing County, which were distributed in the high–high area in 2010, entered the low–high agglomeration area in 2015. There were 329 counties belonging to the low–low agglomeration area, which were still mostly distributed in the upstream and midstream areas, and there were 31 more counties than those belonging to the low–low cluster area in 2010. Specifically, the counties with the increase of the low–low cluster area were mainly distributed in Shanxi Province. This shows that the industrial development of Shanxi Province is still in a relatively primary stage, and that Shanxi is still a region with a relatively weak industrial base and lagging industrial development. The reason for this may be the unsuccessful transformation of some resource-based cities in Shanxi (Wu, 2021).
From 2015 to 2020, the number and pattern of high–high agglomeration county-level units changed greatly. According to the 2020 county-level industrial agglomeration map (Figure 5C), the high–high agglomeration county-level units were increased by 14 from 2015 to 2020. Huimin County, Fei County, Dongming County, and Yichuan County of the Shandong Peninsula urban agglomeration were still in the high–high concentration area. Moreover, Huaxian County, Xiping County, and Tongxu County in the Henan Zhongyuan urban agglomeration and Qinshui County in southern Shanxi newly became the high–high agglomeration type, implying that the industrial level of these counties and adjacent areas had been significantly improved. Although the counties in this type of area primarily spread to the downstream Shandong and Henan regions, compared with 2015, the spatial spillover effect had a tendency to spread to the midstream region. However, the number of low–low agglomeration county units decreased by 91 between 2015 and 2020. These mainly included Dulan County, Minqin County, Huachi County, and Wuchuan County, indicating that the industrial output value of this type of county and the adjacent areas was relatively low. These places are located in the upstream and midstream areas of the YRB. The industrial levels of the surrounding counties and urban areas had an amplitude difference, but both were below the average level; this shows that in the past 5 years, the industrial level of the middle and upper reaches had developed significantly, gradually emerging from the original low-speed development stage, and many counties had begun to break away from the low–low agglomeration type area. The distribution center of the counties with high–high agglomeration gradually shifted to the west during the study period. However, the industrial transfer from the downstream to the midstream and upstream regions was mainly high-consumption and high-emission industries, and the western region gradually became an important energy base in China (Wang et al., 2021). Therefore, the distribution center of high–high cluster counties has shifted to the west, while the number of low–low cluster counties is also decreasing.
3.2 Spatial econometric analysis
The preceding analyses reveal that the industrial production of the 600 counties in the YRB had a significant positive spatial autocorrelation, indicating that the county-level industry in the YRB is not randomly spatially distributed, but exhibits strong spatial dependence and a spatial spillover effect. Therefore, when using county-level industrial agglomeration as the explained variable, the spatial econometric pattern is introduced to estimate the elements that influence county-level industrial clustering. In addition, because of the difference between the industrial clusters in the upstream, midstream, and downstream areas, the YRB was divided into three regions to research the influencing elements of county-level industrial agglomeration.
3.2. 1 Selection of variable indicators
When selecting variable indicators, reference was made to the articles of Chinese scholars (Jin et al., 2006; Luo et al., 2015; Zhang and Li., 2021). Jin et al. (2006) used China’s provincial panel data with spatial econometric analysis methods to analyze the factors affecting China’s industrial agglomeration. Luo et al. (2015) used spatial econometric methods to discuss the factors affecting county-level industrial cluster in the Yangtze River Delta. Zhang and Li (2021) revealed the drivers of industrial agglomeration in China based on panel data from China. In this study, based on the availability of the data, five indicators were selected: the degree of government intervention, the level of industrial externality, the regional market demand, industrial structure adjustment, and the urbanization level.
(1) Degree of government intervention (lngov): due to the lag of the government’s policy intervention, the logarithm of the weighted sum of the proportion of government expenditure of the GDP of each county in 2018 and 2019 (where the proportion in 2018 is 0.6, and the proportion in 2019 is 0.4) is used to study the relative degree of government intervention in the industry (Luo et al., 2015).
(2) Industrial externality level (lnfirm): the logarithm of the number of industrial companies above the county scope in the whole region is used to measure the impact of industrial externalities. The closer the forward and backward links of county-level industrial enterprises and the more enterprises there are, the stronger are the knowledge and technology externalities.
(3) Regional market demand (lnGDP): the logarithm of the GDP per capita of each county is used to reflect the relative purchasing power of regional consumers. The higher the per capita GDP is, the more developed is the county economy and the stronger is the purchasing power of regional consumers. Therefore, the greater the market demand is, the easier it is to attract labor, enterprises, and industries to gather in the region.
(4) Industrial structure adjustment (lnstr): the logarithm of the output value of the tertiary industry in the GDP of each county reflects the adjustment of the industrial structure. If a region transforms its economic development mode and adjusts its industrial structure, it will eliminate underdeveloped industrial production capacity. Therefore, the adjustment of the industrial structure affects the degree of industrial grouping in the region.
(5) The level of urbanization (lnurb): the urbanization rate of each county is determined by using the census data in 2020, and the logarithm of the urbanization rate of each county characterizes the urbanization level of the county. A high level of urbanization will attract more labor, high-level talents, technology, capital, and other production factors to flow to cities and towns, and a high level of urbanization can also reflect the great market potential of the region.
According to the selection of variable indicators affecting industrial agglomeration, the logarithm of the density of the total industrial output value of each county in the YRB in 2020 characterizes the degree of industrial grouping, and the influencing factors are selected as the explanatory variables. Therefore, a spatial regression equation with the degree of industrial agglomeration (Ylndensity) as the explanatory variable is established as
In the formula: Y represents the explained variable; β represents the regression coefficient; i represents 1, 2,…, 599, 600 counties, and ε represents the random error term.
The spatial statistical analysis Moran index method examines whether the dependent variables have spatial autocorrelation. The Moran index in this study has passed the significance test, which signifies that there is spatial autocorrelation between the county industrial agglomeration and drivers in the YRB. Therefore, the spatial econometric pattern can be estimated and the spatial econometrics can be tested. In this article, the ordinary least squares (OLS) model, the SLM, and the SEM were selected to study the factors affecting county-level industrial agglomeration in the YRB. Table 3 exhibits the estimation results of the OLS and spatial econometric models. The Lagrange multiplier (LM) test was conducted on the OLS model. Because the LM test and R-LM test of the SLM and SEM estimation results were statistically significant, it is not possible to use a spatial dependency test to judge which model is appropriate. According to the judgment criteria of logL and the Akaike information criterion (AIC) and Schwarz criterion (SC), among the three models, the SEM was found to have the largest logL value and the smallest AIC and SC values, and its goodness of fit (R2 value) was the highest (0.90); thus, the SEM is the most appropriate model.
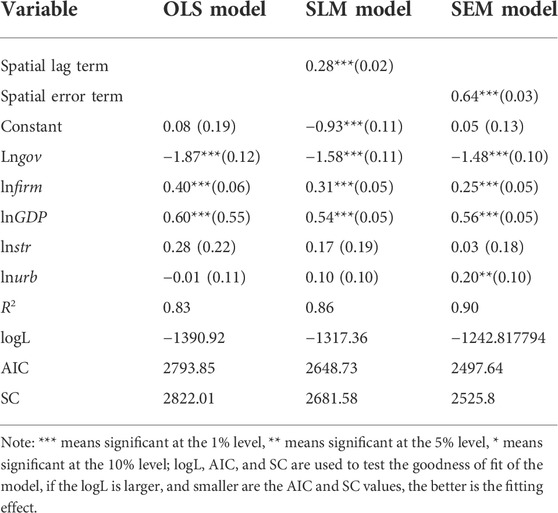
TABLE 3. OLS and spatial econometric model estimation results.
3.2.2 Analysis of the results of the whole basin
The best pattern obtained by the test was that of the SEM, and the results were calculated. The estimated results (Table 3) of the drivers of industrial agglomeration in the YRB are analyzed as follows.
(1) From the perspective of the spatial interaction among counties, all terms ρ and λ passed the test at the 1% level, which shows that the county-level industry in the YRB has a prominent positive spatial autocorrelation. In other words, there is a positive spillover effect in the county-level industrial agglomeration in the adjacent geographical space. Without considering other factors, an increase of 1% in the degree of industrial agglomeration of neighboring counties will increase the degree of industrial agglomeration of the county by 0.28, while the positive ripple degree generated by the error term is 0.64.
(2) The degree of government intervention is significant at the level of 0.01, and is negative (−1.48); this indicates that the regional development strategy implemented by the government has a noteworthy inhibitory effect on the county-level industrial agglomeration. This may be because the implementation of the “Outline of the Yellow River Basin Ecological Protection and High-Quality Development Plan” has weakened the role of traditional economic and geographical factors in the downstream region of the Yellow River. Therefore, industrial enterprises can carry out location selection and layout in a larger spatial range and execute industrial production activities to a greater degree. The industrial externalities measured by the number of regional enterprises and regional market demand were found to have significant positive effects on the forward and backward linkages of county-level industrial agglomeration. The greater the number of regional industrial companies, the closer is the forward and backward links between enterprises, and the stronger is the knowledge and technology externalities, which will promote the agglomeration of industrial enterprises. Industrial structure adjustment was found to have no prominent positive effect on county-level industrial agglomeration in the YRB. Therefore, at the county level, the effect of industrial structure adjustment on industrial agglomeration in the YRB cannot be determined, which requires further discussion and research. Urbanization affects county-level industrial agglomeration in the YRB. Urbanization attracts more labor, high-level talents, technology, capital, and other production factors to flow to cities and towns, which provides conditions for higher-level industrial agglomeration.
3.2.3 Regional heterogeneity analysis
Because of the differences in the economic and industrial development in the upstream, midstream, and downstream regions of the YRB, the factors affecting industrial agglomeration are also different. The research object was divided into three regions, namely, the upstream, midstream, and downstream areas, the factors affecting county-level industrial agglomeration were further analyzed, and the drivers of county-level industrial agglomeration in different regions of the YRB were explored.
In this study, the Moran indexes of the upstream, midstream, and downstream areas of the YRB passed the significance test, which implies that the county-level industrial agglomeration in the upstream, midstream, and downstream areas has spatial autocorrelation and influencing factors. Therefore, the spatial econometric pattern can be established for spatial econometric estimation. In the spatial econometric analysis of different reaches of the YRB, the OLS model was tested by the LM. The SLM and SEM models both passed the LM test, but R-LM-LAG was not statistically significant, while R-LM-ERR was statistically significant. Among the three models, the SEM had the largest logL value, the smallest AIC and SC values, and the highest goodness of fit (R2 value). Therefore, the SEM is the most appropriate model. The results are presented in Table 4.
(1) Upstream area: the degree of government intervention and industrial structure adjustment both passed the significance test and were negative, indicating that these factors have an inhibitory effect on industrial agglomeration in the upstream counties. The level of industrial externality was found to have no significant negative impact on industrial agglomeration, so its effect on county-level industrial agglomeration cannot be determined. The regional market demand and urbanization level passed the significance test and were positive,. these factors play a significant role in promoting county-level industrial agglomeration.
(2) Midstream area: the degree of government intervention passed the significance test; in other words, the implementation of government policies places restrictions on industrial agglomeration. The level of industrial externality and the regional market demand can promote industrial agglomeration in the county. The industrial enterprises in the midstream area gather, and the forward and backward links between enterprises will attract technology and knowledge agglomeration, which is conducive to industrial agglomeration. The adjustment of the industrial structure can promote industrial agglomeration. The adjustment of the industrial structure causes the industry in the downstream area to transfer to the midstream area, and promotes the industrial agglomeration in the midstream area. The level of urbanization did not pass the significance test, so the impact of this factor on the industrial agglomeration in the midstream counties cannot be presently determined, and further research is needed.
(3) Downstream area: the degree of government intervention was found to have no significant positive impact on county-level industrial agglomeration, so the effect of this factor cannot be determined. The level of industrial externality and the adjustment of the industrial structure were found to have a restraining effect on the county-level industrial agglomeration in the downstream area of the YRB, which may be due to the negative externality caused by the excessive agglomeration of industrial enterprises in this area. In addition, the downstream of the YRB has changed the mode of economic development, adjusted the industrial structure, eliminated underdeveloped industrial production capacity, transferred industry to the upstream and midstream, and weakened industrial agglomeration. The impacts of the regional market demand and the urbanization level on county-level industrial agglomeration were found to be significantly positive. The downstream economy is developed, the urbanization level is high, and the infrastructure is perfect, which will reduce the cost of enterprise development. Moreover, it is easier to obtain more intellectual, human, and information resources, which has the external economic effect of promoting industrial agglomeration.
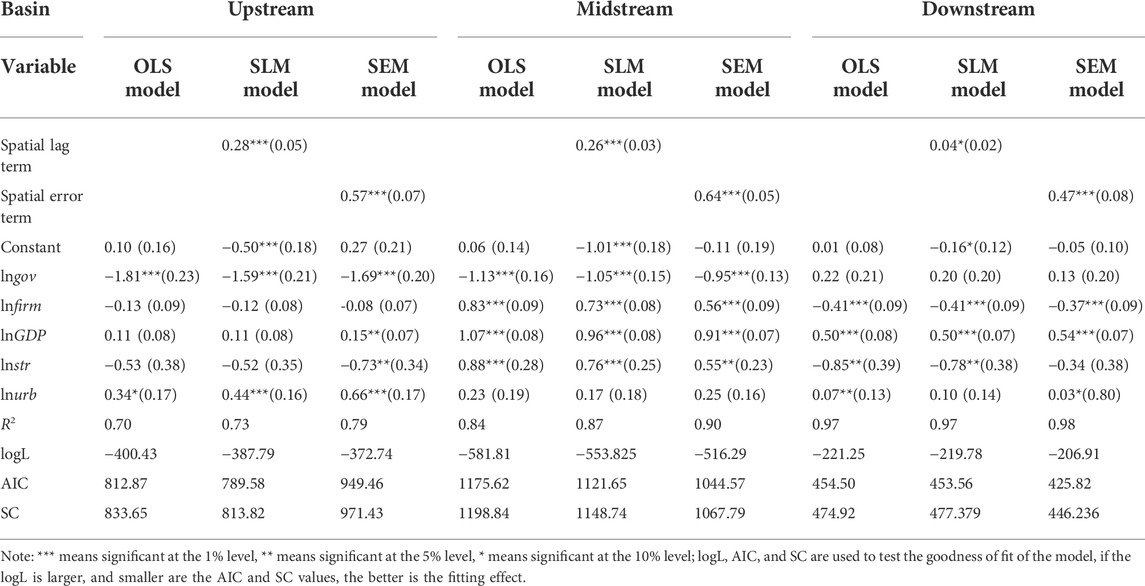
TABLE 4. Estimated results of OLS and spatial econometric models in the upstream, midstream, and downstream of the YRB.
4 Conclusion and discussion
4.1 Conclusion
On the basis of data on industrial clusters of 600 counties in the YRB from 2010 to 2020, this work investigated the spatial effect of industrial agglomeration in the YRB from the two aspects of time and space by using the center of gravity analysis and exploratory spatial data analysis methods, and examined the drivers of county-level industrial agglomeration via the spatial econometric method.
First, the industrial center of gravity in the YRB was found to present a tendency of shifting from east to west, and 2016 was an important turning point. From 2010 to 2020, the county-level industrial distribution in the YRB presented an unbalanced tendency; the unbalanced index decreased from 0.7673 to 0.7329, and its unbalanced degree presented a weakening tendency. Moreover, via the analysis of the density of the total industrial output value of counties in the YRB, the county-level industry in the YRB was found to be concentrated in the downstream area of the YRB. However, from 2010 to 2020, a tendency of diffusion to the upstream and midstream areas emerged, and the county-level industrial agglomeration in the YRB was weakened.
Second, the spatial autocorrelation of county-level industrial agglomeration in the YRB was tested by the Moran index. In terms of the temporal dimension, the degree of county-level industrial agglomeration in the YRB exhibited a conspicuous downward trend and presented a temporal evolution process of “diffusion–agglomeration–re-diffusion.” Specifically, it gradually diffused from Shandong and Henan to southern Shanxi and Shaanxi. In the spatial dimension, the county-level industrial agglomeration in the YRB exhibited obvious spatial autocorrelation, and the spatial spillover effect was apparent. The number of counties in a high–high cluster gradually increased and shifted to the west, while the number of counties in a low–low agglomeration area exhibited a decreasing trend.
Third, using the spatial measurement method, under the premise of taking the spatial spillover effect into account, the study of the drivers of county-level industrial agglomeration in the YRB revealed that the degree of government intervention has a restraining effect on county-level industrial agglomeration, while the level of industrial externality, the regional market demand, and the urbanization level have promoting effects on county-level industrial agglomeration. In terms of the river basin area, in the upstream area, the degree of government intervention and industrial structure adjustment inhibit industrial agglomeration, while regional market demand and the urbanization level promote industrial agglomeration. In the midstream area, the degree of government intervention inhibits industrial agglomeration, while the level of industrial externality, the regional market demand, and industrial structure adjustment promote industrial agglomeration. In the downstream area, the level of industrial externality and industrial structure adjustment restrain industrial agglomeration, while the regional market demand and urbanization level promote industrial agglomeration.
4.2 Discussion
Relevant enlightenments were also obtained via this research, and the following four suggestions are put forward for research on industrial agglomeration in the counties of the YRB. First, the counties in the YRB affect each other, but the connection between the counties is not close enough. The YRB should continue to strengthen economic exchanges among the counties, strengthen regional linkages, break down the economic trade barriers and local protectionism caused by administrative divisions, and accelerate the process of regional economic integration in the YRB region. Second, in the study of influencing factors, it was found that the areas with close forward and backward ties between enterprises and strong economic vitality play a prominent role in accelerating the development of the local industry. Local governments should provide enterprises with a good production and innovation environment and attract high-quality enterprises to settle in, as the forward and backward links brought about by the input and output among enterprises will promote technology upgrading and knowledge accumulation. This will form a self-reinforcing virtuous circle, which will bring more diversified spatiotemporal effects to the industrial growth of the counties in the YRB. Third, in the study of the influencing factors, it was found that the effect of regional market demand on county-level industrial agglomeration is significantly positive. However, the development of marketization in the YRB remains low at present (Li and Bao, 2021). Thus, the YRB should speed up the establishment and improvement of the marketization mechanism in combination with the situation of the basin, actively use the marketization mechanism to fully tap the advantageous resources of each county in the basin, and accelerate the industrial growth of each county. Fourth, the upstream, midstream, and downstream areas of the YRB must take advantage of each region and implement classified policies. Moreover, the industrial agglomeration in the YRB is in the downstream area. Compared with the downstream area, the upstream and midstream should make further efforts to improve the level of industrial agglomeration and develop toward a higher quality.
The findings of this study help further understanding of industrial agglomeration and its drivers, highlight the promotion of the industrial development of the YRB and other similar watersheds via industrial agglomeration, and provide a paradigm for the investigation of industrial agglomeration in other similar watersheds.
This study mainly analyzed the spatiotemporal evolution and drivers of industrial agglomeration in the county area of the YRB in the form of charts, and yielded some useful information and conclusions. However, due to the availability of data, it is insufficient to analyze the changes in the regional industrial pattern only from the total industrial output value above the designated size. In the future, it will be necessary to conduct further analysis with the help of population flow and the development of science, education, culture and health, the ecological environment, etc., to better reveal the impact mechanism and future development trend of the unbalanced spatiotemporal evolution of industrial development in the YRB.
Data availability statement
The original contributions presented in the study are included in the article/Supplementary Material; further inquiries can be directed to the corresponding author.
Author contributions
Several authors made the most widely varied contributions. In particular, HuZ had original ideas for this study and conceived and designed the methodology. The manuscript was drafted by HuZ, revised by HaZ, YQ, YD, ZH, and YD provided financial support. All authors read and agreed to the published version of the manuscript.
Funding
This research was funded by Social Science Foundation of Liaoning Province (L19CJY006). L19CJY006.
Acknowledgments
The author of this article thanks the School of Geography of Liaoning Normal University for their assistance in developing this research.
Conflict of interest
The authors declare that the research was conducted in the absence of any commercial or financial relationships that could be construed as a potential conflict of interest.
Publisher’s note
All claims expressed in this article are solely those of the authors and do not necessarily represent those of their affiliated organizations, or those of the publisher, the editors, and the reviewers. Any product that may be evaluated in this article, or claim that may be made by its manufacturer, is not guaranteed or endorsed by the publisher.
Supplementary material
The Supplementary Material for this article can be found online at: https://www.frontiersin.org/articles/10.3389/fenvs.2022.982904/full#supplementary-material
Footnotes
1There are 11,912 words in this article, and 9,975 words in the body excluding the title, author information, keywords, abstract, chapter title, chart title, funding statement, acknowledgments, and references
2As the Yellow River flows through the Aba Prefecture and Ganzi Prefecture in Sichuan Province, this work studies the county areas of these prefectures in Sichuan Province
References
Cui, P., Zhao, Y., Xia, S., and Yan, J. (2020). Space-time coupling characteristics of ecological environment and high-quality development measures in the YRB. Econ. Geogr. 40 (05), 49–57+80.
Cui, Z., Li, E., and Liu, C. (2021). Spatial-temporal evolution and mechanism of green agricultural specialized villages in the YRB. Econ. Geogr. 41 (12), 158–166.
Dauth, W., and Suedekum, J. (2016). Globalization and local profiles of economic growth and industrial change. J. Econ. Geogr. 5 (16), 1007–1034. doi:10.1093/jeg/lbv028
Davis, C., and Hashimoto, K. (2015). Industry concentration, knowledge diffusion and economic growth without scale effects. Economica 82 (328), 769–789. doi:10.1111/ecca.12129
Du, H., Ji, X., and Chuai, X. (2022). Spatial differentiation and influencing factors of water pollution-intensive industries in the Yellow River basin, China. Int. J. Environ. Res. Public Health 19 (1), 497. doi:10.3390/ijerph19010497
Fan, C. C., and Scott, A. J. (2015). Industrial agglomeration and development: A survey of spatial economic issues in east asia and a statistical analysis of Chinese regions. Econ. Geogr. 79 (3), 295–319. doi:10.1111/j.1944-8287.2003.tb00213.x
Feng, L., Sang, J., and Zhang, Z. (2021). A study on the coordinated development of ecological environment, urbanization and high-quality economy in the YRB. Int. J. Econ. Energy Environ. 6 (6), 174–181. doi:10.11648/j.ijeee.20210606.15
Geng, F., Miao, C., and Hu, Z. (2020). Industrial structural transformation in the YRB and its response to spatial agglomeration patterns. Econ. Geogr. 40 (06), 30–36.
Gong, C., Xu, C., and Zhang, X. (2020). Spatial and temporal evolution and influencing factors of water resource utilization efficiency in cities long the middle and lower reaches of the Yellow River. Geogr. Sci. 40 (11), 1930–1939.
Guan, X., Wang, B., Zhang, W., and Du, Q. (2021). Study on water rights allocation of irrigation water users in irrigation districts of the Yellow River basin. Water 13 (24), 3538. doi:10.3390/w13243538
He, C., and Hu, X. (2019). The evolution of China's industrial geography since the reform and opening up in 1978. Acta Geogr. 74 (10), 1962–1979.
Hu, W., Chen, X., and Li, C. (2019). The evolution of the spatial pattern of China's industrial economic development since the reform and opening up. Jiangsu Soc. Sci. (02), 43–53+257258.
Hu, W. (2019). The regional characteristics of China's industrial economic development in the 40 Years of reform and opening up. Reg. Econ. Rev. 01, 69–83.
Hu, Z., Hu, C., Xiong, X., Li, R., and Feng, L. (2021). Study on the impact of industrial agglomeration on the industrial toughness of the YRB. Geogr. Sci. 41 (05), 824–831.
Hua, G., and Huan, Z. (2021). Study on coordination and quantification of ecological protection and high quality development in the Yellow River Basin. IOP Conf. Ser. Earth Environ. Sci. 647 (1), 012168. doi:10.1088/1755-1315/647/1/012168
Huang, Y., and Sun, W. (2021). Spatiotemporal change characteristics and differences of manufacturing industry agglomeration in the Beijing-Tianjin-Hebei region. Prog. Geogr. 40 (12), 2011–2024. doi:10.18306/dlkxjz.2021.12.003
Jia, Z., and Gu, G. (2019). Evaluation of the imbalance level of economic structure in northeast China and its impact on economic growth -- analysis based on spatial econometric model. Geogr. Sci. 39 (04), 636–643.
Jia, Z., Yang, Y., Zhao, J., and Chen, X. (2021). Spatial interaction effects of industrial agglomeration and pollution agglomeration in lanxi urban agglomeration in the YRB. Geogr. Study 40 (10), 2897–2913.
Jin, Y., Li, Z., and Lu, M. (2006). Regional industrial agglomeration in China: Economic geography, new economic geography and economic policy. Econ. Res. 8 (04), 79–89.
Ju, H., Li, T., and Zhai, Z. (2020). Spatial-temporal differentiation of high-quality industrial development level in the Yellow River Basin based on ecological total factor productivity. Resour. Sci. 42 (06), 1099–1109. doi:10.18402/resci.2020.06.08
Li, B., Hu, Z., Miao, C., Zhang, B., and Kang, W. (2021). Spatial differentiation characteristics and influencing factors of industrial eco-efficiency in the YRB. Geogr. Study 40 (08), 2156–2169.
Li, F., and Miao, Q. (2022). Spatial network characteristics of coupling between urban ecological protection and high-quality economic development in the YRB. Statistics Decis. 38 (05), 80–84.
Li, L., and Bao, S. (2021). Policy suggestions on exploring and improving the marketization mechanism of the YRB. Environ. Prot. 49 (02), 57–60.
Liu, H., Qiao, L., and Sun, S. (2020). Spatial distribution and dynamic change of water use efficiency in the Yellow River Basin. Resour. Sci. 42 (01), 57–68. doi:10.18402/resci.2020.01.06
Lu, C., Ji, W., Hou, M., Ma, T., and Mao, J. (2022). Evaluation of efficiency and resilience of agricultural water resources system in the Yellow River Basin, China. Agric. Water Manag. 266, 107605. doi:10.1016/j.agwat.2022.107605
Lu, D., and Sun, D. (2019). Comprehensive management and sustainable development of the YRB. Acta Geogr. 74 (12), 2431–2436.
Luo, Y., Gu, R., Wang, C., Yang, F., and Xu, S. (2015). Spatial effect analysis of county industrial agglomeration and its influencing factors——an empirical study based on the Yangtze River Delta region. Econ. Geogr. 35 (12), 120–128.
Ma, H., Lei, M., and Yin, Z. (2017). “Spatial characteristics of China's economic development and carbon emission growth -- dynamic trajectory analysis based on GDP center of gravity,” in Secondary industry center of gravity and carbon emission center Technical Economy and Management Research (09), 112–118.
Miao, C. (2022). Strengthen the industrial support for the development of central cities and urban agglomerations in the YRB. Economic Research Reference (01), 21–31.
Shen, N., and Peng, H. (2021). Can industrial agglomeration achieve the emission-reduction effect? Socio-Economic Plan. Sci. (75), 100867. doi:10.1016/j.seps.2020.100867
Tanaka, K., and Managi, S. (2021). Industrial agglomeration effect for energy efficiency in Japanese production plants. Energy Policy 156, 112442. doi:10.1016/j.enpol.2021.112442
The State Council, (2021). The state Council. Available at http://www.gov.cn/gongbao/content/2021/content_5647346.htm (Accessed October 8, 2021).
Tu, J., Liu, L., Zhang, Y., Li, Q., Zhu, Y., and Xiang, W. (2018). The temporal and spatial evolution trajectory of my country's economic center from 1996 to 2015——based on the data of 291 prefecture-level cities. Econ. Geogr. 02 (38), 18–26.
Wang, S., Xie, Z., and Wang, Z. (2021). Spatial and temporal evolution and influencing factors of carbon emissions in counties in China. J. Geogr. 76 (12), 3103–3118.
Wang, Y. (2016). Research on the status quo, existing problems and optimization strategies of industrial layout in Qinghai province. Contemp. Econ. (29), 84–86.
Wei, J., Lei, Y., Yao, H., Ge, J., Wu, S., and Liu, L. (2021). Estimation and influencing factors of agricultural water efficiency in the Yellow River basin, China. J. Clean. Prod. 308, 127249. doi:10.1016/j.jclepro.2021.127249
Wu, W. (2021). Spatial and temporal evolution analysis of the unbalanced economic development in counties in the YRB. Statistics Decis. 37 (21), 132–135.
Zhang, K., Liu, T., Feng, R., Zhang, Z., and Liu, K. (2021). Coupling coordination relationship and driving mechanism between urbanization and ecosystem service value in large regions: A case study of urban agglomeration in Yellow River basin, China. Int. J. Environ. Res. Public Health 15 (18), 7836. doi:10.3390/ijerph18157836
Zhang, K., Zhang, Y., and Zhao, F. (2020). Research on the regional spatial effects of green development and environmental governance in China based on a spatial autocorrelation model. Struct. Chang. Econ. Dyn. 40 (07), 1–11. doi:10.1016/j.strueco.2020.06.001
Zhang, T., and Wang, D. (2018). Industrial agglomeration, spatial spillover effects and regional growth differences——an empirical analysis based on spatial durbin model. Econ. Latitude Longitude 35 (01), 86–91.
Zhang, X., and Zhang, Y. (2022). Optimization of regional economic industrial structure based on edge computing and fuzzy K-Means clustering. Wirel. Commun. Mob. Comput. 2022 (1-10), 1–10. doi:10.1155/2022/8775138
Zhang, Y., and Li, T. (2021). Spatial effects and influencing factors of industrial agglomeration in China's urban areas. Econ. Latitude Longitude 38 (05), 3–11.
Zhao, J., Lian, X., Chen, X., Wang, L., and Tang, J. (2021). Research on industrial layout mode matching high-quality development in the YRB. People's Yellow River. 43 (04), 18–23.
Zhao, L., Wang, Z. T., Ma, Y. H., Zhang, W., Dong, Q., Yu, J. T., et al. (2021). Associations of the cerebrospinal fluid hepatocyte growth factor with Alzheimer's disease pathology and cognitive function. BMC Neurol. 41 (03), 387–396. doi:10.1186/s12883-021-02356-9
Zhen, W., and Chen, S. (2021). Research on the spatial difference and convergence of economy in the YRB——based on the analysis of economic data in nine provinces and counties. Price Theory Pract. 11 (05), 189–192+196.
Zhong, S., Wang, L., and Yao, F. (2022). Industrial green total factor productivity based on an MML index in the Yangtze River economic Belt. Environ. Sci. Pollut. Res. 21 (02), 30673–30696. doi:10.1007/s11356-021-17625-w
Keywords: county, the Yellow River basin, industrial agglomeration, spatial econometric model, driver
Citation: Duan Y, Zhao H, Zhang H, Qin Y and Han Z (2022) The spatiotemporal effects and drivers of industrial agglomeration—A case study of counties in the Yellow River basin. Front. Environ. Sci. 10:982904. doi: 10.3389/fenvs.2022.982904
Received: 01 July 2022; Accepted: 29 July 2022;
Published: 31 August 2022.
Edited by:
Ming Zhang, China University of Mining and Technology, ChinaReviewed by:
Xilong Yao, Taiyuan University of Technology, ChinaHuiming Zhang, Nanjing University of Information Science and Technology, China
Zhenling Chen, Beijing Technology and Business University, China
Copyright © 2022 Duan, Zhao, Zhang, Qin and Han. This is an open-access article distributed under the terms of the Creative Commons Attribution License (CC BY). The use, distribution or reproduction in other forums is permitted, provided the original author(s) and the copyright owner(s) are credited and that the original publication in this journal is cited, in accordance with accepted academic practice. No use, distribution or reproduction is permitted which does not comply with these terms.
*Correspondence: Ye Duan, ZHlkbEBsbm51LmVkdS5jbg==