 Yawen Yu
 Jin Yang
 Lin Tang
- School of Economics and Management, China University of Geosciences, Beijing, China
The basic well-being of residents should be fully considered when making residential energy-saving policies. In this study, decent living standards for China were proposed. The provincial energy saving potential of Chinese residents were estimated from a lifetime perspective using environmental extended input–output analysis. The results show that, in 2017, the energy saving potential of Chinese residents constituted 32.74% of total energy consumption. The consumption categories of transportation, housing and cooking had the greatest energy saving potential of 1668.40, 3540.83 and 3229.75 trillion kJ, respectively, in which direct energy consumption accounted for 85% of total energy consumption. For food, clothing, water, health care and education, there was only energy saving potential from indirect consumption, of which food has the largest indirect energy consumption of 3159.25 trillion kJ. Moreover, the energy saving potential varied at the provincial level, coming from different consumption categories. Special attentions should be paid to the transportation in Beijing, housing in Liaoning, and cooking in Gansu, which have relatively greater energy saving potential with per capita energy saving potential of 207.38, 1002.16, and 4256.6 thousand kJ, respectively. The results verify the importance of differentiated and targeted energy policies for residential consumption in different provinces.
1 Introduction
Energy security has become a growing concern in many countries, particularly in developing countries, as energy demand has been growing at an unprecedented pace (Proskuryakova, 2018). As the world’s largest developing country, China has experienced unprecedented flourishing economic growth during the past decades, accompanied by ever-growing demands for energy resources (Huang et al., 2021). Under the dual constraints of both guaranteeing energy security and meeting ambitious greenhouse gas emissions targets, the way that we manage and consume energy will require major changes (Spence et al., 2021). Specifically, with the improvement of people’s living standards and the rapid development of the economy, the household sector has become the second largest energy consumption sector, second only to the industrial sector (Ding et al., 2017). Recent data from the National Bureau of Statistics of China show that residential energy consumption tripled between 1990 and 2019. Per capita residential energy consumption has substantially increased from 119 kgce (kgs of coal equivalent) in 1990 to 438 kgce in 2019 (China Statistical Yearbook, 2021).
However, equality is an important issue in energy saving and emission reduction practices, as mentioned in the Paris Agreement signed in 2016. Caney (2010) proposed the “Ability to Pay” principle, which is mainly based on the differentiated ability of different income groups to cope with climate change. The main idea of energy equality is that people’s living standards should not fall beneath a certain level in tandem with energy reduction. As a developing country, China is a large economy with unbalanced economic growth throughout different regions, posing significant challenges to allocating energy saving and carbon emission reduction responsibilities (Huang et al., 2021). To reduce residential energy consumption, the Chinese government has taken measures to propel the transition to energy-saving and low-carbon lifestyles, such as promoting clean and efficient coal-fired boilers and encouraging the use of natural gas and renewable energy. The white paper Energy in China’s New Era was also released in 2020 to encourage energy conservation and transition. However, the reality is that reductions in energy demand, as suggested by the government, could thus compromise attempts to provide basic human needs for all citizens. Therefore, it is of great significance to set a living standard for each region that can address the basic well-being of local residents, based on estimates for regional residential energy-saving potential.
The literature regarding residential energy consumption has been evaluated (Zhang, 2004; Herrerias et al., 2017; Han and Wu, 2018; Otsuka, 2018; Oberst et al., 2019; Freire-González, 2017). Tsemekidi Tzeiranaki et al. (2019) analysed the status and trends of energy consumption for EU residents using official Eurostat data. Heinonen and Junnila (2014) investigated the residential energy consumption patterns and overall energy requirements of urban and rural households holistically in Finland. Pablo-Romero et al. (2017) probed the residential energy consumption of main world regions by dividing it into three types: nonrenewable, direct renewable and indirect renewable. However, these literatures only estimate direct energy consumption, but household consumption also causes indirect energy consumption in upstream production sectors. There are also many scholars who have calculated the indirect energy consumption of residents (Cellura et al., 2012; Long et al., 2017; Tang et al., 2020; Li et al., 2020). Wang and Yang (2014) calculated the indirect energy consumption of eight categories from 1999 to 2010 based on the Consumer Lifestyle Approach (CLA). The results show that housing, food, education, cultural and entertainment services have the greatest energy intensity. Zhang et al. (2017) examined indirect energy consumption using the input–output method to improve accuracy. The results show that indirect energy consumption accounts for 69%–77% of total energy consumption. To investigate the energy consumption of each household consumption category, Zhou and Gu (2020) analysed the current situation of energy use for six consumption categories in different regions based on the input–output model of 30 provinces.
To guide the transition to an energy-saving lifestyle, in addition to residential energy consumption, the residential energy saving potential in different regions should be further investigated, which helps to differentiate and target policy-making. In terms of the calculation of energy saving potential, many studies focus on the production sector, such as Çay, 2018, Lin and Moubarak, 2014 and Hu et al. (2018). Swedish energy performance certificates for single-family housing provide rich information on energy consumption and various physical attributes. The estimates of the energy conservation potentials resulting from implementing cost-efficient energy saving measures are also included. On this basis, Wahlström and Hårsman (2015) assessed conservation potential amounting to 15% of total energy consumption. For China, Li et al., 2014 found that if full development and utilization of renewable energy is achieved, 2.2 times China’s rural energy consumption can be supplied by 100% carbon-free energy resources and 2.4 times that can be provided by renewable energy in 2008. Yu and Guo (2016) used a stochastic Frontier model to estimate energy saving potential based on physical characteristics such as house size, house age, number of TVs or refrigerators. The energy conservation potential determined by assessing and comparing different types of household consumption behaviours can shed light on policy-making for demand-side regulation. Ding et al. (2017) assessed the energy saving potential by comparing different types of household consumption behaviours. There are also studies exploring residential energy saving potential from a lifetime perspective, such as Zhu et al. (2018) and Kenzhekhanov et al. (2020).
Since energy saving actions will inevitably exert negative impacts on human welfare, increasing attention has been given to finding rational energy-saving pathways on that satisfy basic human welfare. Zhu and Pan (2007) demonstrated that the total energy required to meet basic needs for all Chinese citizens is 2.5 billion tons of oil equivalent, taking the current level of technology in OECD member countries, in particular Western European ones, as the basis in the calculation. Rao and Baer (2012) proposed a decent living standard (DLS) based on the well-being of residents, which is interpreted as a family’s needs for a set of basic substances, including adequate nutrition, housing, health care, education, transportation, refrigerators, televisions, and mobile phones. Rao and Min (2018) further proposed specific requirements and thresholds for DLS. This requirement is based on the common needs of human beings and can be used universally. Based on DLS, Kikstra et al. (2021) assessed the gaps in providing decent health, shelter, nutrition, socialization, and mobility within countries across the world. The results show that more people are deprived of DLS than are income-poor, even when numbers are measured against medium income poverty thresholds. Rao et al. (2019) estimated bottom-up energy consumption by households for decent living standards in India, Brazil and South Africa. The results showed that the energy consumption determined by the decent living standards in these countries can help achieve the 2°C target set out in the Paris Agreement.
Currently, a standard that reflects the basic well-being of residents and considers the actual situation in China is still lacking. Therefore, this study assessed the energy consumption of different consumption categories for residents in each province using China’s DLS for both direct and indirect energy consumption. The energy saving potential was estimated by comparing the energy consumption for a DLS and the actual situation. The remainder of this paper is organized as follows: Section 2 presents the methods and data, and the results and analysis are demonstrated in Section 3. The conclusions and recommendations are summarized in Section 4.
2 Materials and methods
Figure 1 shows the procedure of estimating household energy saving potential. The first step is to set the DLS for 8 consumption categories. Combining an environmentally extended input–output model, the energy consumption, including direct energy consumption and indirect energy consumption for the DLS and actual energy consumption for 8 consumption categories in 30 provinces of China, is quantified. Comparing the actual energy consumption in 2017 with that for the DLS, the energy saving potential is estimated, which may shed light on targeted and differentiated energy saving policy-making in China.
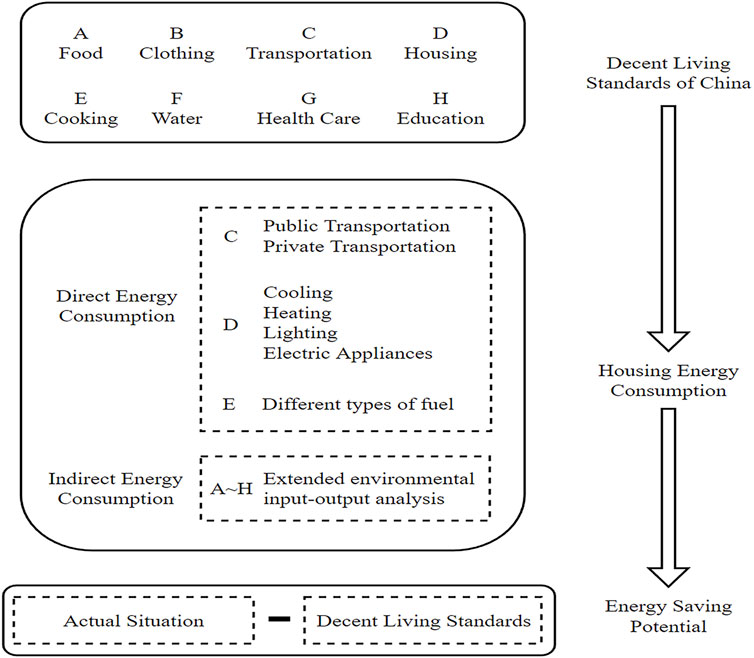
FIGURE 1. Methodological framework.
2.1 Decent living standards of China
Rao and Min (2018) proposed a set of universal, irreducible and essential material conditions for achieving basic human well-being, along with indicators and quantitative thresholds, i.e., the DLS. This standard sets the basic material needs according to the physiological needs of human beings, and can be adjusted according to the development stage of different regions. Compared with the standards set by Zhu and Pan (2007) based on the technical level of European, especially Western European, the DLS proposed by Rao and Min (2018) is more universal. It has been used to estimate energy consumption in India, Brazil and South Africa (Rao et al., 2019). In this context, the DLS is a “lowest common denominator” of basic material requirements that are instrumental (but not sufficient) to achieve physical, and to an extent social, dimensions of human well-being, whether conceived as basic needs or basic capabilities, and independent of peoples’ values or relative stature in society. The DLS has three principles. First, the constituents of a DLS must be necessary and indispensable or otherwise globally desired. One basic need or capability is at least satisfied; the fulfilment of others’ needs or capabilities is not harmed; it is the only satisfier of at least one basic need or capability, or it is one of many competing satisfiers and overwhelmingly preferred within the realm of at least one dimension. Second, a DLS holds basic human well-being to an acceptable threshold by limiting the risk. Third, material requirements at the household, community or societal level are given rise by individual entitlements.
Considering the differences in development levels, cultures, regions and living habits between countries, reasonable adjustments have been made to the DLS proposed by Rao and Min (2018) according to the actual situation of China in this study. For example, the setting of food consumption standards refers to the Dietary Reference Intakes (DRI) for Chinese Residents (2013)1 considering the population of different age; For Clothing, cooling and heating standards, the variation of temperature in different regions in China is taken in to consideration. Specifically, the difference between the north and the south in heating is fully considered. The differences of actual passenger turnover between urban and rural areas are also taken into account. The setting of DLS in China for each consumption category is described in detail in Supplementary Sections S1.2–S1.12 of the Supplementary Material and summarized in Supplementary Table S2.
2.2 Household energy consumption accounting
This section presents the methodology for calculating household energy consumption for the DLS scenario and the actual energy consumption in 2017. In addition to the direct effects of energy consumption for transportation, housing and cooking, the indirect effects of all 8 energy consumption categories were also calculated.
2.2.1 Direct energy consumption
2.2.1.1 Transportation
The calculation of transportation energy consumption, which includes public and private transportation, is shown in Eq. 1. For public transportation, the calculations are the same for the actual situation and the DLS scenario, which is estimated based on the passenger turnover of different transportation modes in each province. For private transportation, in actual situations, the turnover is calculated based on the number of private cars in each province and the average annual mileage distance per car. For the DLS scenario, assuming urban private transportation will be replaced by public transportation, the energy consumption coefficient of public transportation will be used for all urban transportation. Details are shown in Supplementary Section S2.1.1.
where
2.2.1.2 Housing
Housing includes cooling, heating, lighting and household electric appliances, which are all main sources of residential electricity consumption. Heating is mainly fuelled by heat and coal. Therefore, in actual situations, the energy consumption for housing is the total energy consumption of the residents’ heat, electricity and coal (excluding electricity and coal used for cooking). For the DLS scenario, the energy consumption for housing is separated by cooling, heating, lighting and electric appliances; the details are as follows.
The energy consumption for cooling (
where
where Z indicates the annual heating days;
where
where
2.2.1.3 Cooking
The energy consumption for cooking is calculated according to Eq. 6. In actual situations, cooking fuels include firewood, electricity, liquefied gas, coal, solar energy and natural gas. For the DLS scenario, all cooking fuels except electricity and gaseous fuel are replaced by electricity and gaseous fuel. The share of gaseous fuel and electricity for the DLS scenario are set as the proportion of their use to their total use in actuality.
where
2.2.2 Indirect energy consumption accounting
The indirect energy consumption is calculated using the environmental extended input–output analysis. The input–output table comprehensively and systematically reflects the input–output relationship among different economic sectors of the national economy. By combining environmental indicators with input–output analysis, extended environmental input–output analysis can be used as a tool to understand the material or energy requirements or the environmental burden (energy consumption in this study) associated with specific sectors or with the components of final demand (Schaffartzik et al., 2014).
The indirect energy consumption (
The MRIO tables for 42 sectors (National Bureau of Statistics of China) and energy consumption for 30 provinces (excluding Tibet) and 46 sectors (CEADs) in China in 2017 are used. The multiregional energy extended input–output tables for 30 sectors and 30 provinces are obtained by combining the sectors.
where
3 Results and discussions
3.1 The living standard of China for the decent living standard scenario
Actual residential consumption in most categories is larger than that in a DLS scenario, except for rural cooling, heating coverage, number of phones and health care expenditure (Table 1). Compared with the DLS scenario, the actual clothing demand, private passenger turnover, annual per capita water consumption and education expenditure in 2017 are much larger, which indicates overconsumption in these categories. Heating coverage in housing was 50.59% in 2017, which was much lower than the 90% in the DLS scenario. The reason is that centralized heating is currently only deployed in the north of the Qinling-Huaihe Line in China, ignoring the fact that many areas in the south of the Qinling-Huaihe Line also have heating demands with temperatures below 18°C in winter. This means that the basic heating needs of a large number of residents in China are still not satisfied. The actual number of refrigerators and phones in homes in 2017 is slightly higher than that in the DLS scenario. The actual number of AC in 2017 was less than that in the DLS scenario for urban areas but higher than that in the DLS scenario for rural areas.
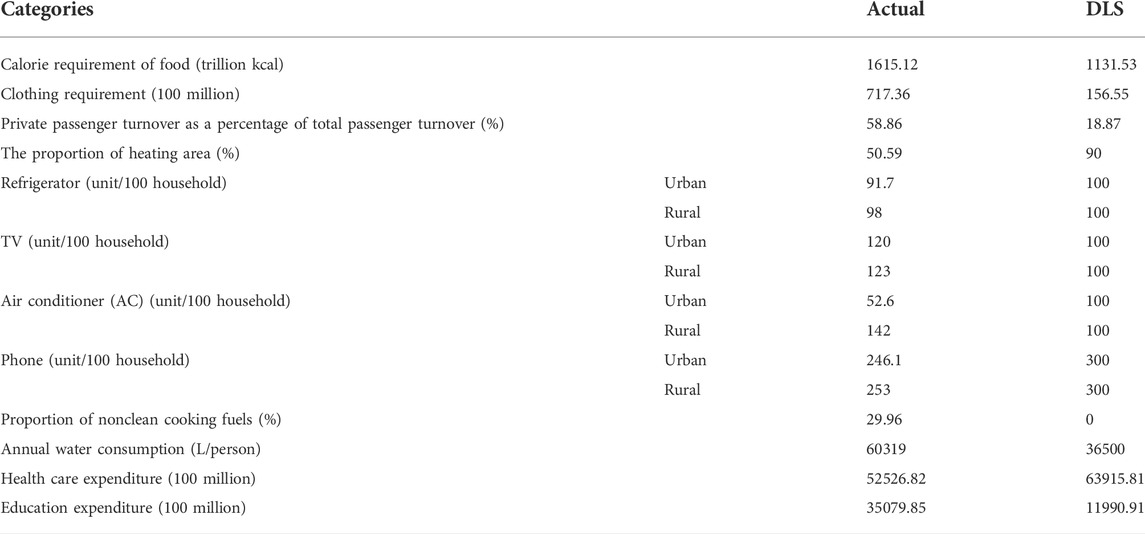
TABLE 1. Physical quantity under the actual situation and the DLS scenario in 2017.
3.2 Residential energy consumption
In actual situations, the energy consumption of Chinese residential areas was 31393.75 trillion kJ, while in the DLS scenario, it was 21114.14 trillion kJ. Therefore, the estimated energy saving potential of Chinese residential consumption was 10279.61 trillion kJ in 2017. The actual energy consumption of different categories is almost all bigger than that under the DLS (except health care). Among all consumption categories, transportation, housing and cooking were the largest contributors to residential energy consumption, constituting 22.99%, 30.63%, and 25.24%; 26.28%, 28.76% and 22.23% of the total energy consumption in the actual situation and the DLS scenario, respectively. These three categories had the largest energy saving potential, with energy saving potentials of 1668.40, 3540.83 and 3229.75 trillion kJ, respectively (Figure 2). It indicates that measures such as expanding the coverage of public transportation, improving the efficiency of heating and cooling, and substituting coal with gaseous fuel and electricity in cooking should be emphasized to reduce residential energy consumption. As the energy consumption of residents is more related to the lifestyle, rather than living standards, with the growing of human needs and improvement of living condition, the transformation to a low carbon lifestyle is the key to narrow the gap between actual energy consumed and the energy consumption under the DLS. Comparing the direct and indirect energy consumption of these three categories, we found that the energy saving potential was mainly concentrated in direct energy consumption. In terms of transportation, the direct energy saving potential was 86.07% of the total transportation energy saving potential. For housing, the direct energy saving potential was 91.98% of the total housing energy saving potential. The energy saving potential of cooking comes entirely from direct energy consumption, as the indirect energy consumption for the DLS scenario is 100.64 trillion kJ more than in the actual situation.
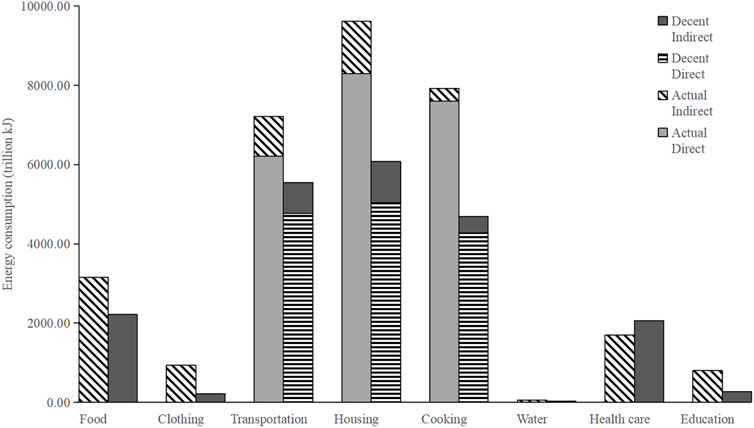
FIGURE 2. Energy consumption by household consumption categories under actual situation and DLS.
The energy consumption for transportation in the actual situation was 7217.89 trillion kJ, while that in the DLS scenario was 5549.48 trillion kJ. By calculating the difference in energy consumption between the actual situation and the DLS scenario, we found that energy saving potential mainly exists in direct energy consumption (Figure 2), as direct energy consumption constituted 86.07% of total transportation energy consumption. Direct energy consumption from transportation was influenced by the passenger turnover of private transportation. The proportion of total private passenger turnover in the actual situation was much larger than in the DLS scenario. In this study, the DLS scenario assumes that private transportation will be replaced by public transportation in urban areas. In the context of large-scale private transportation reduction and a slight increase in public transportation, substantial energy saving potential could be observed (Figure 3).
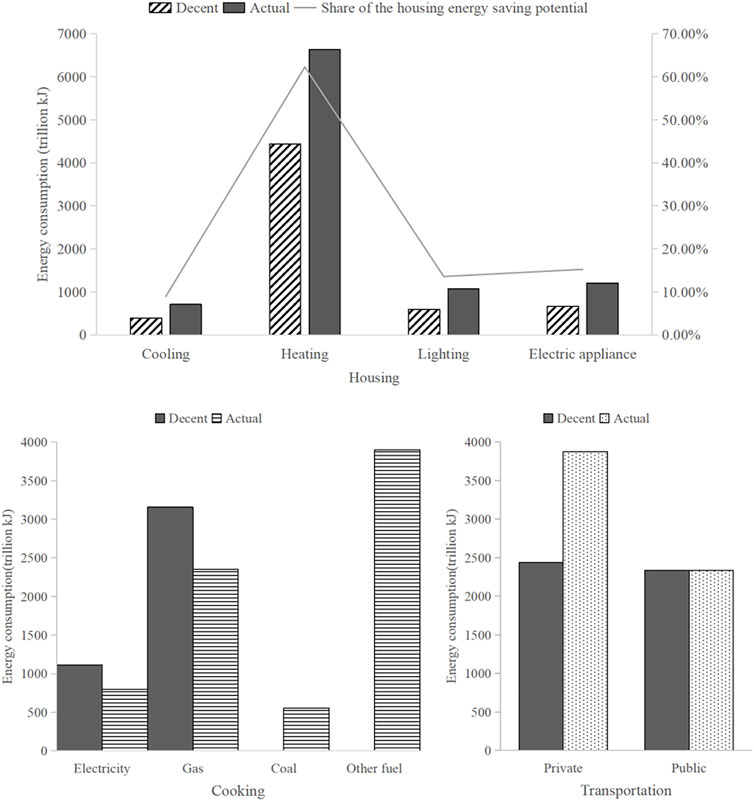
FIGURE 3. Direct energy consumption for transportation, cooking and housing.
The energy consumption of housing was 9612.95 and 6072.12 trillion kJ in actual situations and in the DLS scenario, respectively, which was derived from heating, cooling, lighting and electric appliances. The energy saving potential was mainly from heating, accounting for 62.27% (Figure 3). The energy saving potential of heating, located mainly in the north of the Qinling-Huaihe Line, was 1499.47 trillion kJ, accounting for 56.73% of the energy saving potential of housing (Figure 4). It is well known that the urban areas north of the Qinling-Huaihe Line are mostly equipped with centralized heating. The influencing factors of centralized heating energy consumption include the heat flux density (

FIGURE 4. Energy saving potential of housing. The red bars represent the north of the Qinling-Huaihe Line.
In terms of cooking, the energy consumption was 7922.95 trillion kJ in the actual situation and 4693.20 trillion kJ in the DLS scenario. The energy saving potential was mainly from direct fuel consumption (Figure 2), especially the use of clean fuels. We assumed that gaseous fuel and electricity could be used to completely replace traditional fuels such as coal and biomass in the DLS scenario, and the energy consumption could be reduced by 3229.75 trillion kJ in the DLS scenario (Figure 3). The significant energy saving potential could be attributed to the low energy efficiency utilization of unclean fuels, such as firewood and coal, which is only 15%, while that of electricity and gaseous fuel are 75% and 55%–60%, respectively.
3.3 Residential indirect energy consumption
Household energy consumption was not only from consumer activities related to direct energy use; the indirect energy consumption from upstream production chains also constituted a large proportion. The variations in household consumption preference may have indirectly influenced the total energy consumption. As shown in Figure 5, the three largest categories of indirect energy consumption were food, health care and housing, with energy consumption of 3159.25, 1684.32 and 1320.74 trillion kJ. We further traced the upstream sectors of these four categories to find the key points for energy saving. In terms of food, the four largest upstream sectors that contributed to indirect energy consumption were food and tobacco, farming, forestry, animal husbandry and fishery, chemical products and transport, storage, postal and telecommunications services. The food and tobacco sector provide basic supplies to satisfy the residential food demand. Most of the raw materials for food come from the farming, forestry, animal husbandry and fishery sectors. The mechanization rate in the farming, forestry, animal husbandry and fishery sectors will indirectly influence the total household energy consumption. In 2019, the mechanization rate of crop cultivation and harvesting in China reached 70% compared to only 33.5% in 20132. The continuous increase in food additive output in China, which has a yearly increase of 21.78%3, makes the chemical products sector a main contributor to residential indirect energy consumption. With the improvement of living standards, residents’ demand for the diversity and freshness of food increases the energy consumption of food transportation, storage and distribution. For health care, due to chemical drug consumption by residents, the indirect energy consumption for drug manufacturing in the chemical products sector was an important contributor to indirect residential energy consumption. In terms of housing, the largest indirect energy consumption came from the electric power and heat production and supply sector due to increasing electricity use in residential housing (Cao et al., 2019).
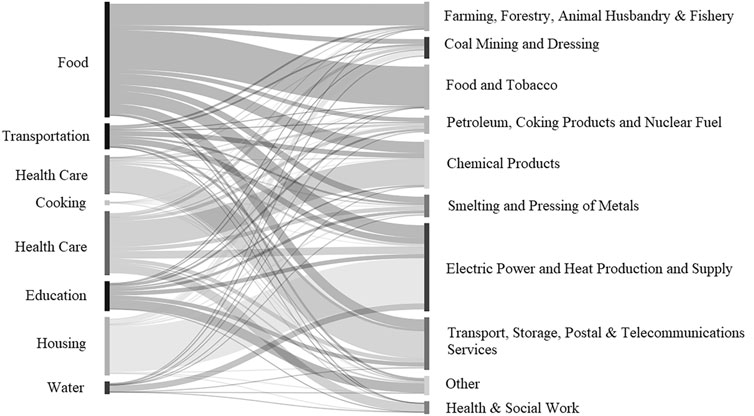
FIGURE 5. The path of residential indirect energy consumption.
3.4 Energy saving potential per capita at the provincial level
The energy saving potential in each province was investigated to shed light on targeted energy reduction policy-making. The energy saving potential from direct energy consumption was greater than the indirect energy consumption in all provinces except Hubei and Hainan. The energy saving potential differed across provinces. Ningxia, Xinjiang and Liaoning had the largest energy saving potential per capita, which were 21.61, 15.80, and 15.42 million kJ, respectively (Figure 6). The large energy saving potential in these provinces was contributed by the direct energy consumption of transportation, housing and cooking.
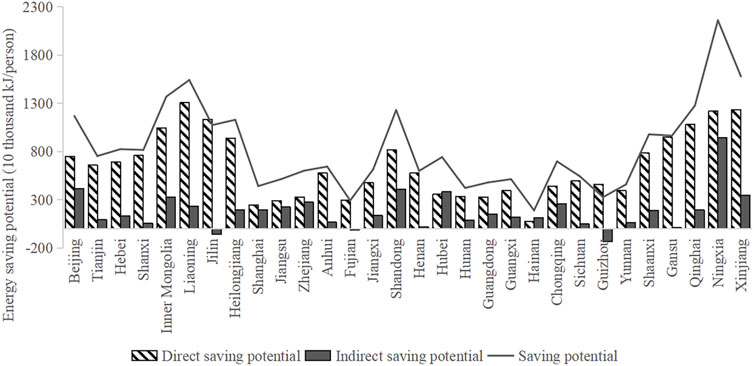
FIGURE 6. Per capita energy consumption under actual situation and DLS by province.
Beijing, Jiangsu and Zhejiang had the greatest energy saving potential in transportation (Figure 7) due to more private vehicles per 100 households. This result can be attributed to the high proportion of the urban population in these three areas and the large number of private vehicles in urban areas. For example, the urban population in Beijing reached 86.50%, ranking 2nd in China, and the private vehicles per 100 households are 49, which is much higher than most of the provinces. Provinces with low temperatures generally had greater energy saving potential in heating, such as Liaoning, Jilin, Heilongjiang and Xinjiang (Figure 7). On the one hand, the heating energy saving potential of these provinces is related to the heat flux density (
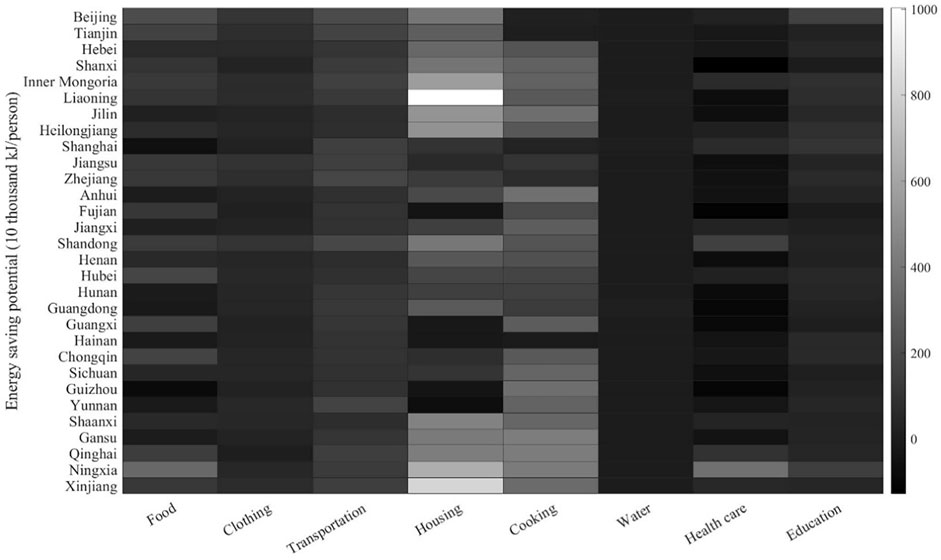
FIGURE 7. Energy saving potential of different consumption categories in different provinces.
Among all provinces, Ningxia had great energy saving potential in both direct and indirect energy consumption, especially indirect energy saving potential, which was much larger than other provinces (Figure 6). The direct energy saving potential was mainly in housing and cooking, especially in housing. The energy saving potential from indirect energy consumption relies on food, health care and education, which had greater energy saving potential compared with other provinces, and they all had only indirect energy consumption (Figure 7). By tracing the indirect energy path in Ningxia, we found that the largest indirect energy consumption was from upstream sectors such as chemical products, the smelting and pressing of metals, electric power and heat production and supply4.
4 Conclusion
Driven by growing residential demand, energy consumption in the residential sector shows an ever-increasing trend. Targeted energy saving policies should be enacted to guide residents to practice energy-saving lifestyles, which is of great significance to both guarantee energy security and alleviate global warming. To investigate the residential energy consumption status and estimate energy saving potential, this study sets the DLS applicable to Chinese residents in terms of eight consumption categories. The direct and indirect energy consumption for the actual situation and the DLS scenario for each category were calculated in combination with the environmental extended input–output method. The energy saving potential was estimated by comparing the energy consumption in the actual situation and DLS scenario, which may guide inclusive and targeted policy-making.
Among the eight consumption categories classified in this study, when compared with the DLS scenario, the consumption categories with the greatest energy saving potential for Chinese residents in 2017 were transportation, housing and cooking. In particular, direct energy consumption was related to the living habits of residents. Therefore, transformation to an energy-saving lifestyle is the key to residential energy reduction.
In transportation, reducing the use of private transportation and replacing private transportation with public transportation is an efficient way to reduce energy consumption, especially in urban areas. For housing, heating has the greatest energy saving potential, mainly in the areas with central heating north of the Qinling-Huaihe Line. The heating energy consumption in these areas is related to the choice of heating terminal and the efficiency of heat transfer that is affected by temperature. Therefore, residents should be encouraged to use more energy-saving heating terminals and upgrade heating transmission equipment to reduce energy losses. When addressing insufficient heating in the area south of the Qinling-Huaihe Line, radiators should be selected as heating terminals instead of floors. At the same time, heat preservation of the transmission pipeline should be addressed to reduce energy loss. For cooking, compared with the full use of clean fuels (electricity and gaseous fuel) in the DLS scenario, the proportion of unclean fuels (firewood and coal) used in many areas was very high in actual situations, especially in some undeveloped provinces and most rural areas. Therefore, it is necessary to increase the adoption rate of electricity and gasous fuels, especially in areas where the current proportion of clean fuels is relatively low.
Although the energy saving potential of indirect energy is less than that of direct energy, it cannot be ignored. By tracing and analysing the upstream sectors, it can be found that food has the largest indirect energy consumption among all consumption categories and mainly comes from sectors of farming, forestry, animal husbandry and fishery, chemical products and transport, storage, postal and telecommunications services due to the increasing use of machinery for agricultural production, the use of food additives, and the increasing demands for a variety of high quality food. Therefore, it is necessary to encourage residents to not waste food, to consume local food, and to strictly control the use of food additives.
Among all the provinces, Beijing has the greatest energy-saving potential in transportation. Because Beijing has more private vehicles than most provinces, it is necessary to reduce the frequency of private vehicle use by odd-even car bans and encourage residents to use public transportation or low-carbon travel, especially in households with multiple vehicles. Due to Liaoning having the lowest temperature, the focus should be on improving the heat transfer efficiency. Gansu has the largest proportion of unclean fuels and therefore had the greatest residential energy potential in cooking. Ningxia has the greatest direct and indirect energy saving potential. Both reducing energy consumption from the consumer side and improving the technical level and energy efficiency from the production side should be emphasized in Ningxia.
Data availability statement
The raw data supporting the conclusion of this article will be made available by the authors, without undue reservation.
Author contributions
YY: data curation, software, writing—original draft preparation JY: conceptualization, methodology, supervision SC: validation, reviewing and editing LT: methodology, visualization.
Funding
This research was financially supported by the National Natural Science Foundation of China (Nos. 72174187, 71704164).
Conflict of interest
The authors declare that the research was conducted in the absence of any commercial or financial relationships that could be construed as a potential conflict of interest.
Publisher’s note
All claims expressed in this article are solely those of the authors and do not necessarily represent those of their affiliated organizations, or those of the publisher, the editors and the reviewers. Any product that may be evaluated in this article, or claim that may be made by its manufacturer, is not guaranteed or endorsed by the publisher.
Supplementary material
The Supplementary Material for this article can be found online at: https://www.frontiersin.org/articles/10.3389/fenvs.2022.982662/full#supplementary-material
Footnotes
1https://www.amazon.com/Chinese-Dietary-Reference-Intakes-DRIs/dp/7501928959.
2http://www.ghs.moa.gov.cn/zlyj/202004/t20200430_6342839.htm.
3https://market.chinabaogao.com/huagong/033153E222021.html.
4https://www.ceads.net/user/index.php?id=951&lang=cn.
References
Caney, S. (2010). Climate change and the duties of the advantaged. Crit. Rev. Int. Soc. political philosophy 13 (1), 203–228. doi:10.1080/13698230903326331
Cao, J., Ho, M. S., Li, Y., Newell, R. G., and Pizer, W. A. (2019). Chinese residential electricity consumption: Estimation and forecast using micro-data. Resour. Energy Econ. 56, 6–27. doi:10.1016/j.reseneeco.2017.10.003
Çay, A. (2018). Energy consumption and energy saving potential in clothing industry. Energy 159, 74–85. doi:10.1016/j.energy.2018.06.128
Cellura, M., Longo, S., and Mistretta, M. (2012). Application of the structural decomposition analysis to assess the indirect energy consumption and air emission changes related to Italian households consumption. Renew. Sustain. energy Rev. 16 (2), 1135–1145. doi:10.1016/j.rser.2011.11.016
Ding, Q., Cai, W., Wang, C., and Sanwal, M. (2017). The relationships between household consumption activities and energy consumption in china—an input-output analysis from the lifestyle perspective. Appl. energy 207, 520–532. doi:10.1016/j.apenergy.2017.06.003
Freire-González, J. (2017). Evidence of direct and indirect rebound effect in households in EU-27 countries. Energy Policy 102, 270–276. doi:10.1016/j.enpol.2016.12.002
Han, H., and Wu, S. (2018). Rural residential energy transition and energy consumption intensity in China. Energy Econ. 74, 523–534. doi:10.1016/j.eneco.2018.04.033
Heinonen, J., and Junnila, S. (2014). Residential energy consumption patterns and the overall housing energy requirements of urban and rural households in Finland. Energy Build. 76, 295–303. doi:10.1016/j.enbuild.2014.02.079
Herrerias, M. J., Aller, C., and Ordóñez, J. (2017). Residential energy consumption: A convergence analysis across Chinese regions. Energy Econ. 62, 371–381. doi:10.1016/j.eneco.2016.06.006
Hu, Y., Chowdhury, J., Haltas, I., Balta-Ozkan, N., Matthew, G., and Varga, L. (2018). Reducing industrial energy demand in the UK: A review of energy efficiency technologies and energy saving potential in selected sectors. Renew. Sustain. Energy Rev. 94, 1153–1178. doi:10.1016/j.rser.2018.06.040
Huang, B., Zhang, L., Ma, L., Bai, W., and Ren, J. (2021). Multi-criteria decision analysis of China’s energy security from 2008 to 2017 based on Fuzzy BWM-DEA-AR model and Malmquist Productivity Index. Energy 228, 120481. doi:10.1016/j.energy.2021.120481
Kenzhekhanov, S., Memon, S. A., and Adilkhanova, I. (2020). Quantitative evaluation of thermal performance and energy saving potential of the building integrated with PCM in a subarctic climate. Energy 192, 116607. doi:10.1016/j.energy.2019.116607
Kikstra, J. S., Mastrucci, A., Min, J., Riahi, K., and Rao, N. D. (2021). Decent living gaps and energy needs around the world. Environ. Res. Lett. 16 (9), 095006. doi:10.1088/1748-9326/ac1c27
Li, C., He, L., Cao, Y., Xiao, G., Zhang, W., Liu, X., et al. (2014). Carbon emission reduction potential of rural energy in China. Renew. Sustain. Energy Rev. 29, 254–262. doi:10.1016/j.rser.2013.08.073
Li, X., He, X., Luo, X., Cui, X., and Wang, M. (2020). Exploring the characteristics and drivers of indirect energy consumption of urban and rural households from a sectoral perspective. Greenh. Gas. Sci. Technol. 10 (5), 907–924. doi:10.1002/ghg.2010
Lin, B., and Moubarak, M. (2014). Estimation of energy saving potential in China's paper industry. Energy 65, 182–189. doi:10.1016/j.energy.2013.12.014
Long, Y., Yoshida, Y., and Dong, L. (2017). Exploring the indirect household carbon emissions by source: Analysis on 49 Japanese cities. J. Clean. Prod. 167, 571–581. doi:10.1016/j.jclepro.2017.08.159
Oberst, C. A., Schmitz, H., and Madlener, R. (2019). Are prosumer households that much different? Evidence from stated residential energy consumption in Germany. Ecol. Econ. 158, 101–115. doi:10.1016/j.ecolecon.2018.12.014
Otsuka, A. (2018). Population agglomeration and residential energy consumption: Evidence from Japan. Sustainability 10 (2), 469. doi:10.3390/su10020469
Pablo-Romero, M. d. P., Pozo-Barajas, R., and Yñiguez, R. (2017). Global changes in residential energy consumption. Energy Policy 101, 342–352. doi:10.1016/j.enpol.2016.10.032
Proskuryakova, L. (2018). Updating energy security and environmental policy: Energy security theories revisited. J. Environ. Manag. 223, 203–214. doi:10.1016/j.jenvman.2018.06.016
Rao, N., and Baer, P. (2012). Decent living” emissions: a conceptual framework. Sustainability 4 (4), 656–681. doi:10.3390/su4040656
Rao, N. D., and Min, J. (2018). Decent living standards: material prerequisites for human wellbeing. Soc. Indic. Res. 138 (1), 225–244. doi:10.1007/s11205-017-1650-0
Rao, N. D., Min, J., and Mastrucci, A. (2019). Energy requirements for decent living in India, Brazil and South Africa. Nat. Energy 4 (12), 1025–1032. doi:10.1038/s41560-019-0497-9
Schaffartzik, A., Sachs, M., Wiedenhofer, D., and Eisenmenger, N. (2014). “Environmentally extended input-output analysis,” in Social ecology working paper (Vienna: Institute of Social Ecology Vienna), 154. https://www.aau.at/wp-content/uploads/2016/11/working-paper-154-web.pdf.
Spence, A., Leygue, C., and Andeane, P. O. (2021). Sustainability following adversity: Power outage experiences are related to greater energy saving intentions in the United Kingdom and Mexico. Energy Res. Soc. Sci. 79, 102143. doi:10.1016/j.erss.2021.102143
Tang, Z., Wu, S., and Zou, J. (2020). Consumption substitution and change of household indirect energy consumption in China between 1997 and 2012. Plos one 15 (8), e0221664. doi:10.1371/journal.pone.0221664
Tsemekidi Tzeiranaki, S., Bertoldi, P., Diluiso, F., Castellazzi, L., Economidou, M., Labanca, N., et al. (2019). Analysis of the EU residential energy consumption: Trends and determinants. Energies 12 (6), 1065. doi:10.3390/en12061065
Wahlström, M. H., and Hårsman, B. (2015). Residential energy consumption and conservation. Energy Build. 102, 58–66. doi:10.1016/j.enbuild.2015.05.008
Wang, Z., and Yang, L. (2014). Indirect carbon emissions in household consumption: evidence from the urban and rural area in China. J. Clean. Prod. 78, 94–103. doi:10.1016/j.jclepro.2014.04.041
Yu, Y., and Guo, J. (2016). Identifying electricity-saving potential in rural China: Empirical evidence from a household survey. Energy Policy 94, 1–9. doi:10.1016/j.enpol.2016.03.031
Zhang, Q. (2004). Residential energy consumption in China and its comparison with Japan, Canada, and USA. Energy Build. 36 (12), 1217–1225. doi:10.1016/j.enbuild.2003.08.002
Zhang, Y. J., Bian, X. J., Tan, W., and Song, J. (2017). The indirect energy consumption and CO2 emission caused by household consumption in China: an analysis based on the input–output method. J. Clean. Prod. 163, 69–83. doi:10.1016/j.jclepro.2015.08.044
Zhou, X. Y., and Gu, A. L. (2020). Impacts of household living consumption on energy use and carbon emissions in China based on the input–output model. Adv. Clim. Change Res. 11 (2), 118–130. doi:10.1016/j.accre.2020.06.004
Zhu, H., Hong, J., Shen, G. Q., Mao, C., Zhang, H., and Li, Z. (2018). The exploration of the life-cycle energy saving potential for using prefabrication in residential buildings in China. Energy Build. 166, 561–570. doi:10.1016/j.enbuild.2017.12.045
Zhu, X., and Pan, J. (2007). Energy requirements for satisfying basic needs: China as a case for illustration. Beijing China: Chinese Academy of Social Sciences. Available at: www.basicproject.net/(Accessed January 20, 2012).
Keywords: decent living standards, residential energy consumption, energy saving potential, environmental extended input-output analysis, provincial differences
Citation: Yu Y, Yang J, Chai S and Tang L (2022) Estimating the energy saving potential of residential consumption in China based on decent living standards. Front. Environ. Sci. 10:982662. doi: 10.3389/fenvs.2022.982662
Received: 30 June 2022; Accepted: 25 July 2022;
Published: 19 August 2022.
Edited by:
Kangyin Dong, University of International Business and Economics, ChinaReviewed by:
Shan Guo, Renmin University of China, ChinaShaoqing Chen, Sun Yat-sen University, China
Copyright © 2022 Yu, Yang, Chai and Tang. This is an open-access article distributed under the terms of the Creative Commons Attribution License (CC BY). The use, distribution or reproduction in other forums is permitted, provided the original author(s) and the copyright owner(s) are credited and that the original publication in this journal is cited, in accordance with accepted academic practice. No use, distribution or reproduction is permitted which does not comply with these terms.
*Correspondence: Jin Yang, eWFuZ2ppbkBjdWdiLmVkdS5jbg==